")
Back to Journals » ClinicoEconomics and Outcomes Research » Volume 10
Budget impact analysis of sarilumab for the treatment of rheumatoid arthritis in patients with an inadequate response to conventional synthetic DMARD or TNF inhibitor therapies
Authors Ferrufino CP, Munakata J, Wei W , Proudfoot C, Kuznik A, Boklage SH, Chen C
Received 26 January 2018
Accepted for publication 23 September 2018
Published 16 November 2018 Volume 2018:10 Pages 805—819
DOI https://doi.org/10.2147/CEOR.S163829
Checked for plagiarism Yes
Review by Single anonymous peer review
Peer reviewer comments 2
Editor who approved publication: Dr Samer Hamidi
Cheryl P Ferrufino,1 Julie Munakata,1 Wenhui Wei,2 Clare Proudfoot,3 Andreas Kuznik,4 Susan H Boklage,4 Chieh-I Chen4
1IQVIA, Fairfax, VA, USA; 2Sanofi, Bridgewater, NJ, USA; 3Sanofi, Guildford, UK; 4Regeneron Pharmaceuticals, Inc., Tarrytown, NY, USA
Objective: To estimate the 5-year budget impact (BI) on a US health plan of introducing sarilumab – a human immunoglobulin G1 anti-IL-6 receptor α monoclonal antibody – as combination treatment with conventional synthetic disease-modifying antirheumatic drugs (csDMARDs) or monotherapy in patients with moderate-to-severe rheumatoid arthritis (RA).
Methods: BI analysis was conducted from a commercial payer perspective. Treatment-eligible populations included adult patients with moderate-to-severe RA and inadequate response (IR) to csDMARDs or tumor necrosis factor (TNF)-α inhibitors-IR. All licensed biologic treatments recommended by the American College of Rheumatology guidelines were included.
Results: For a hypothetical plan of one million members, 409 csDMARD-IR and 345 TNF-IR patients were annually eligible for combination therapy and 226 csDMARD and TNF-IR patients for monotherapy with sarilumab. Based on 2018 US direct treatment costs, the introduction of sarilumab was estimated to save $526,424, $322,637 and $264,306 over 5 years for csDMARD-IR combination therapy patients, TNF-IR combination therapy patients, and csDMARD-IR/TNF-IR monotherapy patients, respectively. As sarilumab absorbed a greater market share over the horizon, annual savings increased from years 1 to 5, $28,610 (–0.14%) to $194,646 (–0.83%) in csDMARD-IR, $16,986 (–0.11%) to $120,893 (–0.67%) in TNF-IR, and $14,256 (–0.13%) to $98,040 (–0.79%) in monotherapy. One-way sensitivity analyses revealed that the model was most sensitive to variations in sarilumab adherence.
Conclusion: Total cost savings of introducing sarilumab to a health-care plan accrued from years 1 to 5, attributable to the lower treatment cost, stable dosing paradigm, and price parity for the two available doses (150 and 200 mg every 2 weeks) compared with alternative biologic DMARDs that have substantial variability in dose titration/schedules.
Keywords: treatment costs, disease-modifying anti-rheumatic drug, IL-6 inhibitor
Corrigendum for this paper has been published
Introduction
It is estimated that 1.5 million adults in the US have a diagnosis of rheumatoid arthritis (RA).1 Disease chronicity and need for long-term therapy create substantial lifetime humanistic burden to patients and economic burden to payers and society.2,3 Inadequate response (IR) or intolerance to treatment adds to the challenges of managing RA, and increases the associated burden.4,5
Treatment with conventional synthetic (cs) disease-modifying antirheumatic drug (DMARD) monotherapy (eg, methotrexate) forms the standard of care for treatment-naïve RA patients. For patients with moderate-to-severe RA and IR to csDMARD monotherapy (csDMARD-IR), a broad range of biologic DMARDs (bDMARDs) including tumor necrosis factor inhibitor (TNFi; adalimumab, certolizumab, etanercept, golimumab, and infliximab) and non-TNFi (abatacept, rituximab, sarilumab, and tocilizumab) treatments can be added.6 For patients who have IR and/or intolerance to one or more TNFi agents (TNF-IR), switching from one class of bDMARDs to another with a different mechanism of action, such as T- or B-cell inhibitors or IL-6 inhibitors, is suggested in RA treatment guidelines.6
Despite the number of treatment options available, patients may fail to respond to, maintain response to, or must stop therapy due to adverse events; therefore, new therapies continue to provide valuable options for patients with this chronic condition. Sarilumab is a human immunoglobulin G1 (IgG1) anti-IL-6 receptor α (anti-IL-6Rα) monoclonal antibody (IL-6 has been shown to contribute to inflammation and joint destruction in RA);7 Phase III studies have confirmed its efficacy and safety in patients with RA as a monotherapy8 as well as in combination with methotrexate or other csDMARDs.9–11
Whereas disease cost offsets can potentially be realized from effective treatment,4 drug costs are responsible for a large share of the RA cost burden,12 and the budgetary consequences of introducing any new treatment options to health systems are of concern to payers. In the face of health-care resource constraints, budget impact analysis enables evaluating the financial consequences of adopting and diffusing a health-care intervention for a target population, within a given health-care setting.13 The current budget impact analysis was conducted from a US commercial payer perspective to assess the financial consequences associated with the adoption of sarilumab into commercial health-care formularies as combination therapy with csDMARDs or as monotherapy for patients with moderate-to-severe RA.
Methods
Model structure
A 5-year budget-impact model was constructed using Microsoft Excel 2007. A market-based approach was followed that first estimated the current or baseline annual budget of a health-care plan for treatment, assuming sarilumab was not commercially available. Certain market and pricing assumptions (summarized in Table S1), including the commercial availability of sarilumab, were then modified and the impact on annual budgets was projected. The budget impact is the difference between the projected and current (or baseline) estimated total cost over a 5-year time horizon for the pharmacy, medical, or total health-care plan budgets.
Model inputs
Population
Sarilumab is indicated for the treatment of moderate-to-severe active RA in adults who have had an IR to one or more DMARDs. Data supporting the efficacy and safety of sarilumab as monotherapy and combination therapy with csDMARDs have been previously reported.9–11,13 Two target populations consistent with the indication were considered for comparative analyses of the budget impact of sarilumab. These mutually exclusive populations comprised csDMARD-IR patients (ie, biologic-naïve patients with IR to csDMARD) and TNF-IR patients (ie, patients with IR to TNFi). The model quantified the target populations for sarilumab on the basis of demographic and epidemiological assumptions applied to a starting hypothetical managed-care plan population of one million covered lives. The adult population (age ≥18 years) was based on 2017 US Census data estimates. An RA prevalence rate of 0.6% was based on published epidemiologic data of RA in US adults (Table 1).14
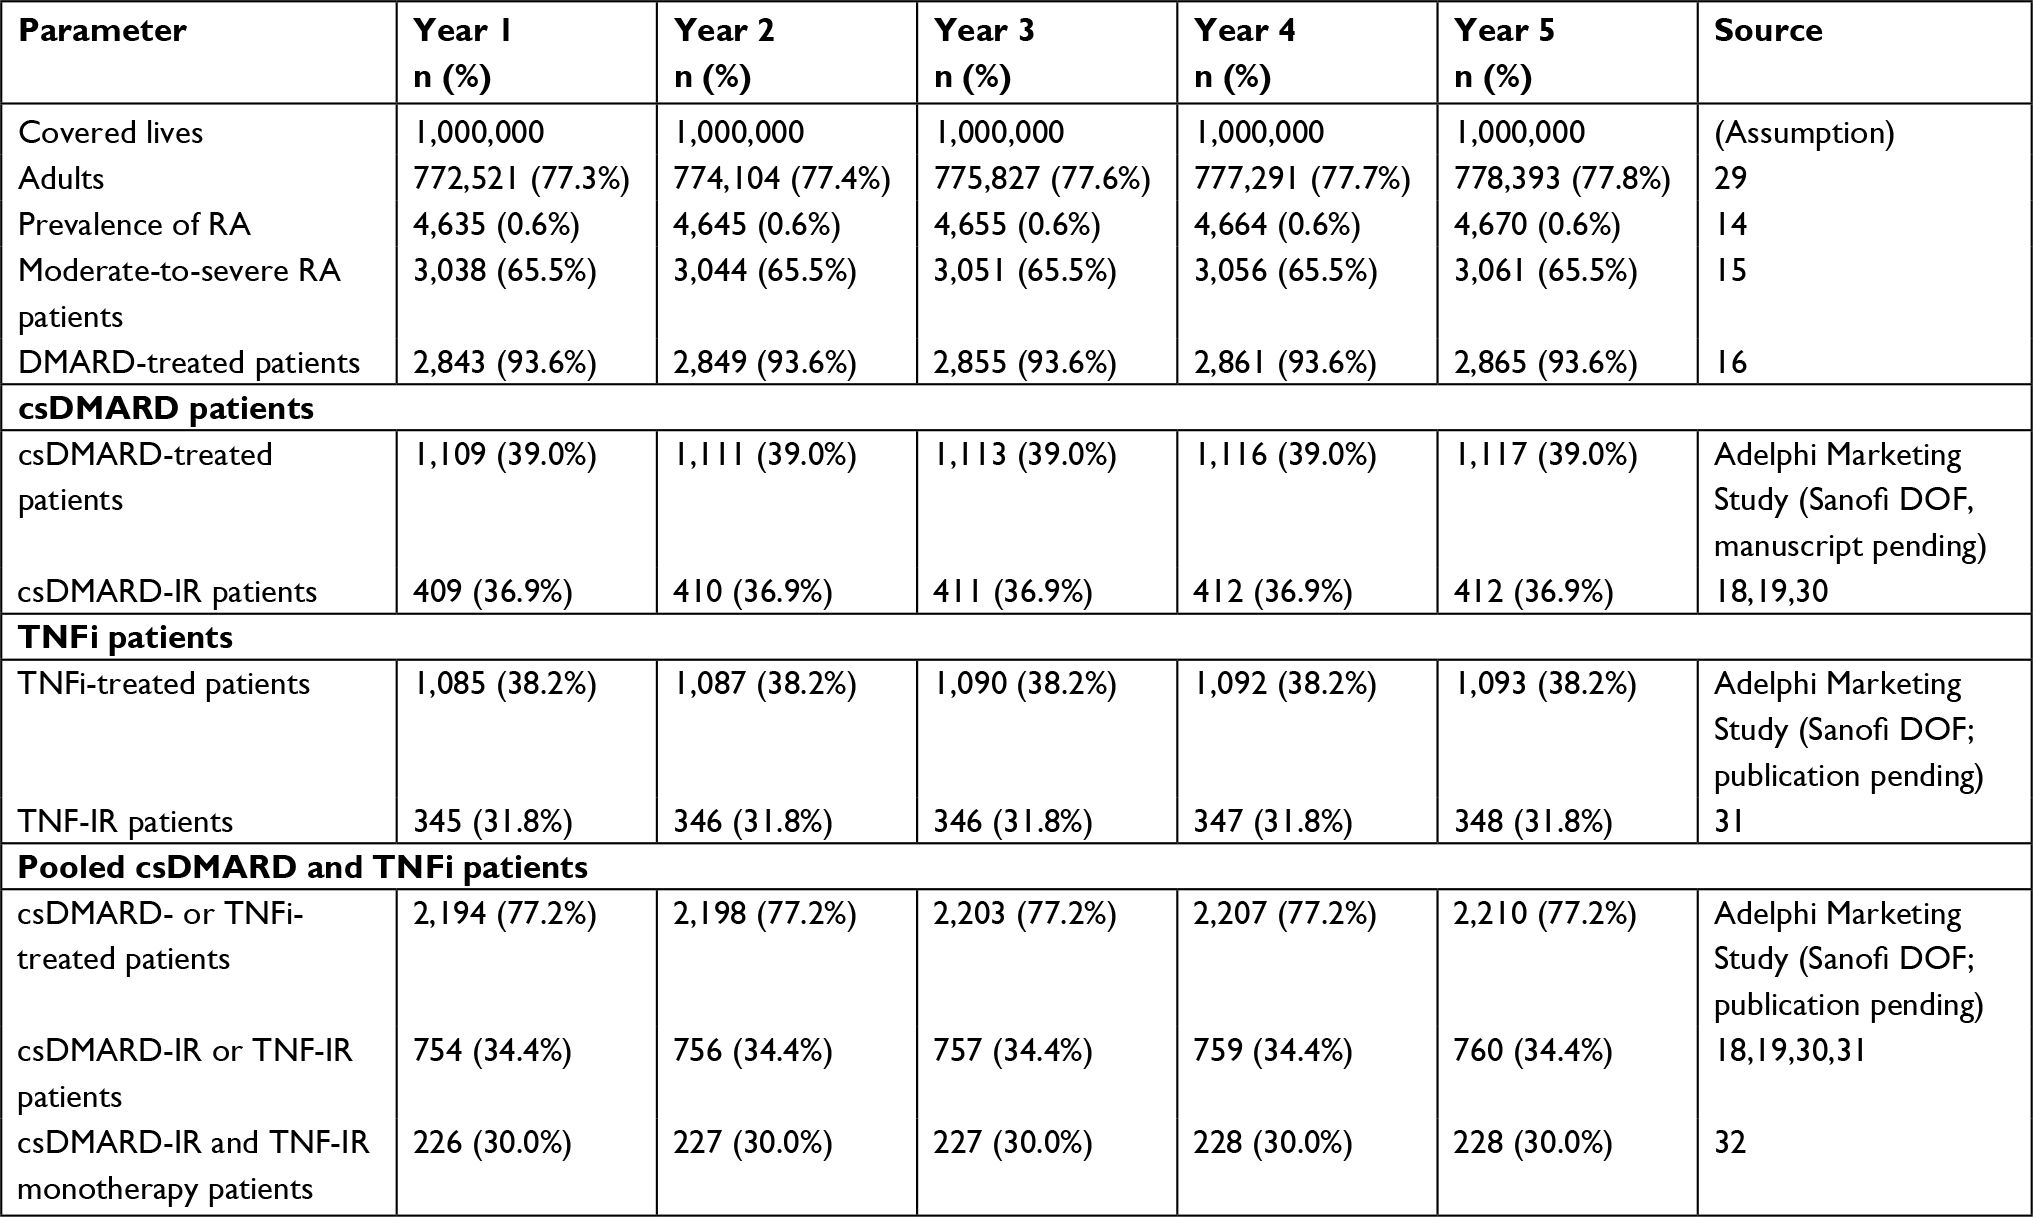 | Table 1 Estimates of treatment-eligible population: demographic and epidemiological parameters and estimates of treatment-eligible populations Abbreviations: DMARD, disease-modifying antirheumatic drug; IR, inadequate response; RA, rheumatoid arthritis; TNFi, tumor necrosis factor inhibitor; csDMARD, conventional synthetic disease-modifying antirheumatic drug; DOF, data on file. |
Among the 65.5% of patients with moderate-to-severe RA,15 approximately 93.6% of patients were currently receiving DMARD therapy.16 Three treatment settings were considered: 1) TNF-IR, 2) csDMARD-IR (in both of these settings, patients were treated with csDMARDs+ bDMARDs – ie, combination therapy), and 3) pooled csDMARD-IR and TNF-IR monotherapy (csDMARD-IR or bDMARD-IR patients treated with bDMARDs alone). The final eligible target patient populations for the three treatment settings of interest (Table 1) were then based on the proportion of patients treated with either a csDMARD or bDMARD, as estimated via a retrospective database analysis of real-world prescription claims among treated patients (Adelphi Marketing Study, Sanofi, data on file).
The csDMARD-IR rate, defined as those who failed to meet American College of Rheumatology (ACR) 20 criteria17 by Week 52, was based on data from three large pivotal trials: 53/212 (25%) from TEMPO,18 95/257 (37%) from PREMIER,19 and 126/274 (46%) from ASPIRE.20 Thus, overall, 36.9% (n=274/743) of treated patients failed to meet the ACR20 criteria (Table 1).
Market shares of treatments
The treatment comparators were based on the treatments recommended by the ACR guidelines,6 comprising non-TNF biologics, TNFi biologics, and Janus kinase (JAK) inhibitors. All licensed RA treatments that are currently on the market were included in each category. However, some RA treatments (eg, azathioprine, cyclosporine, minocycline, and gold) were excluded from the budget-impact analysis due to their absence from the ACR guidelines.6 Market distributions by drug were based on current US market trends and reflect the anticipated primary comparators to sarilumab. Market-share estimates were derived from market forecast research (Sanofi/Regeneron Pharmaceuticals, Inc., data on file), which estimated patient utilization by line of therapy, and patient utilization data from Decision Resources 2011 (Table 2). Due to the absence of market-share data, anakinra was excluded from the analyses. The sarilumab market share was assumed to be zero in the base-case scenario. In the projected scenario which illustrates the availability of sarilumab, the sarilumab adoption rates were assumed to be 0.50%, 1.00%, 1.50%, 2.00%, and 2.50% in years 1 through 5, respectively, of the total annual market share (Table 2). Due to the absence of data on market-share migration, it was assumed that the annual market shares for the comparator treatments were equi-proportionally reduced by the annual adoption rates for sarilumab, consistent with other budget-impact analyses of RA treatments.21
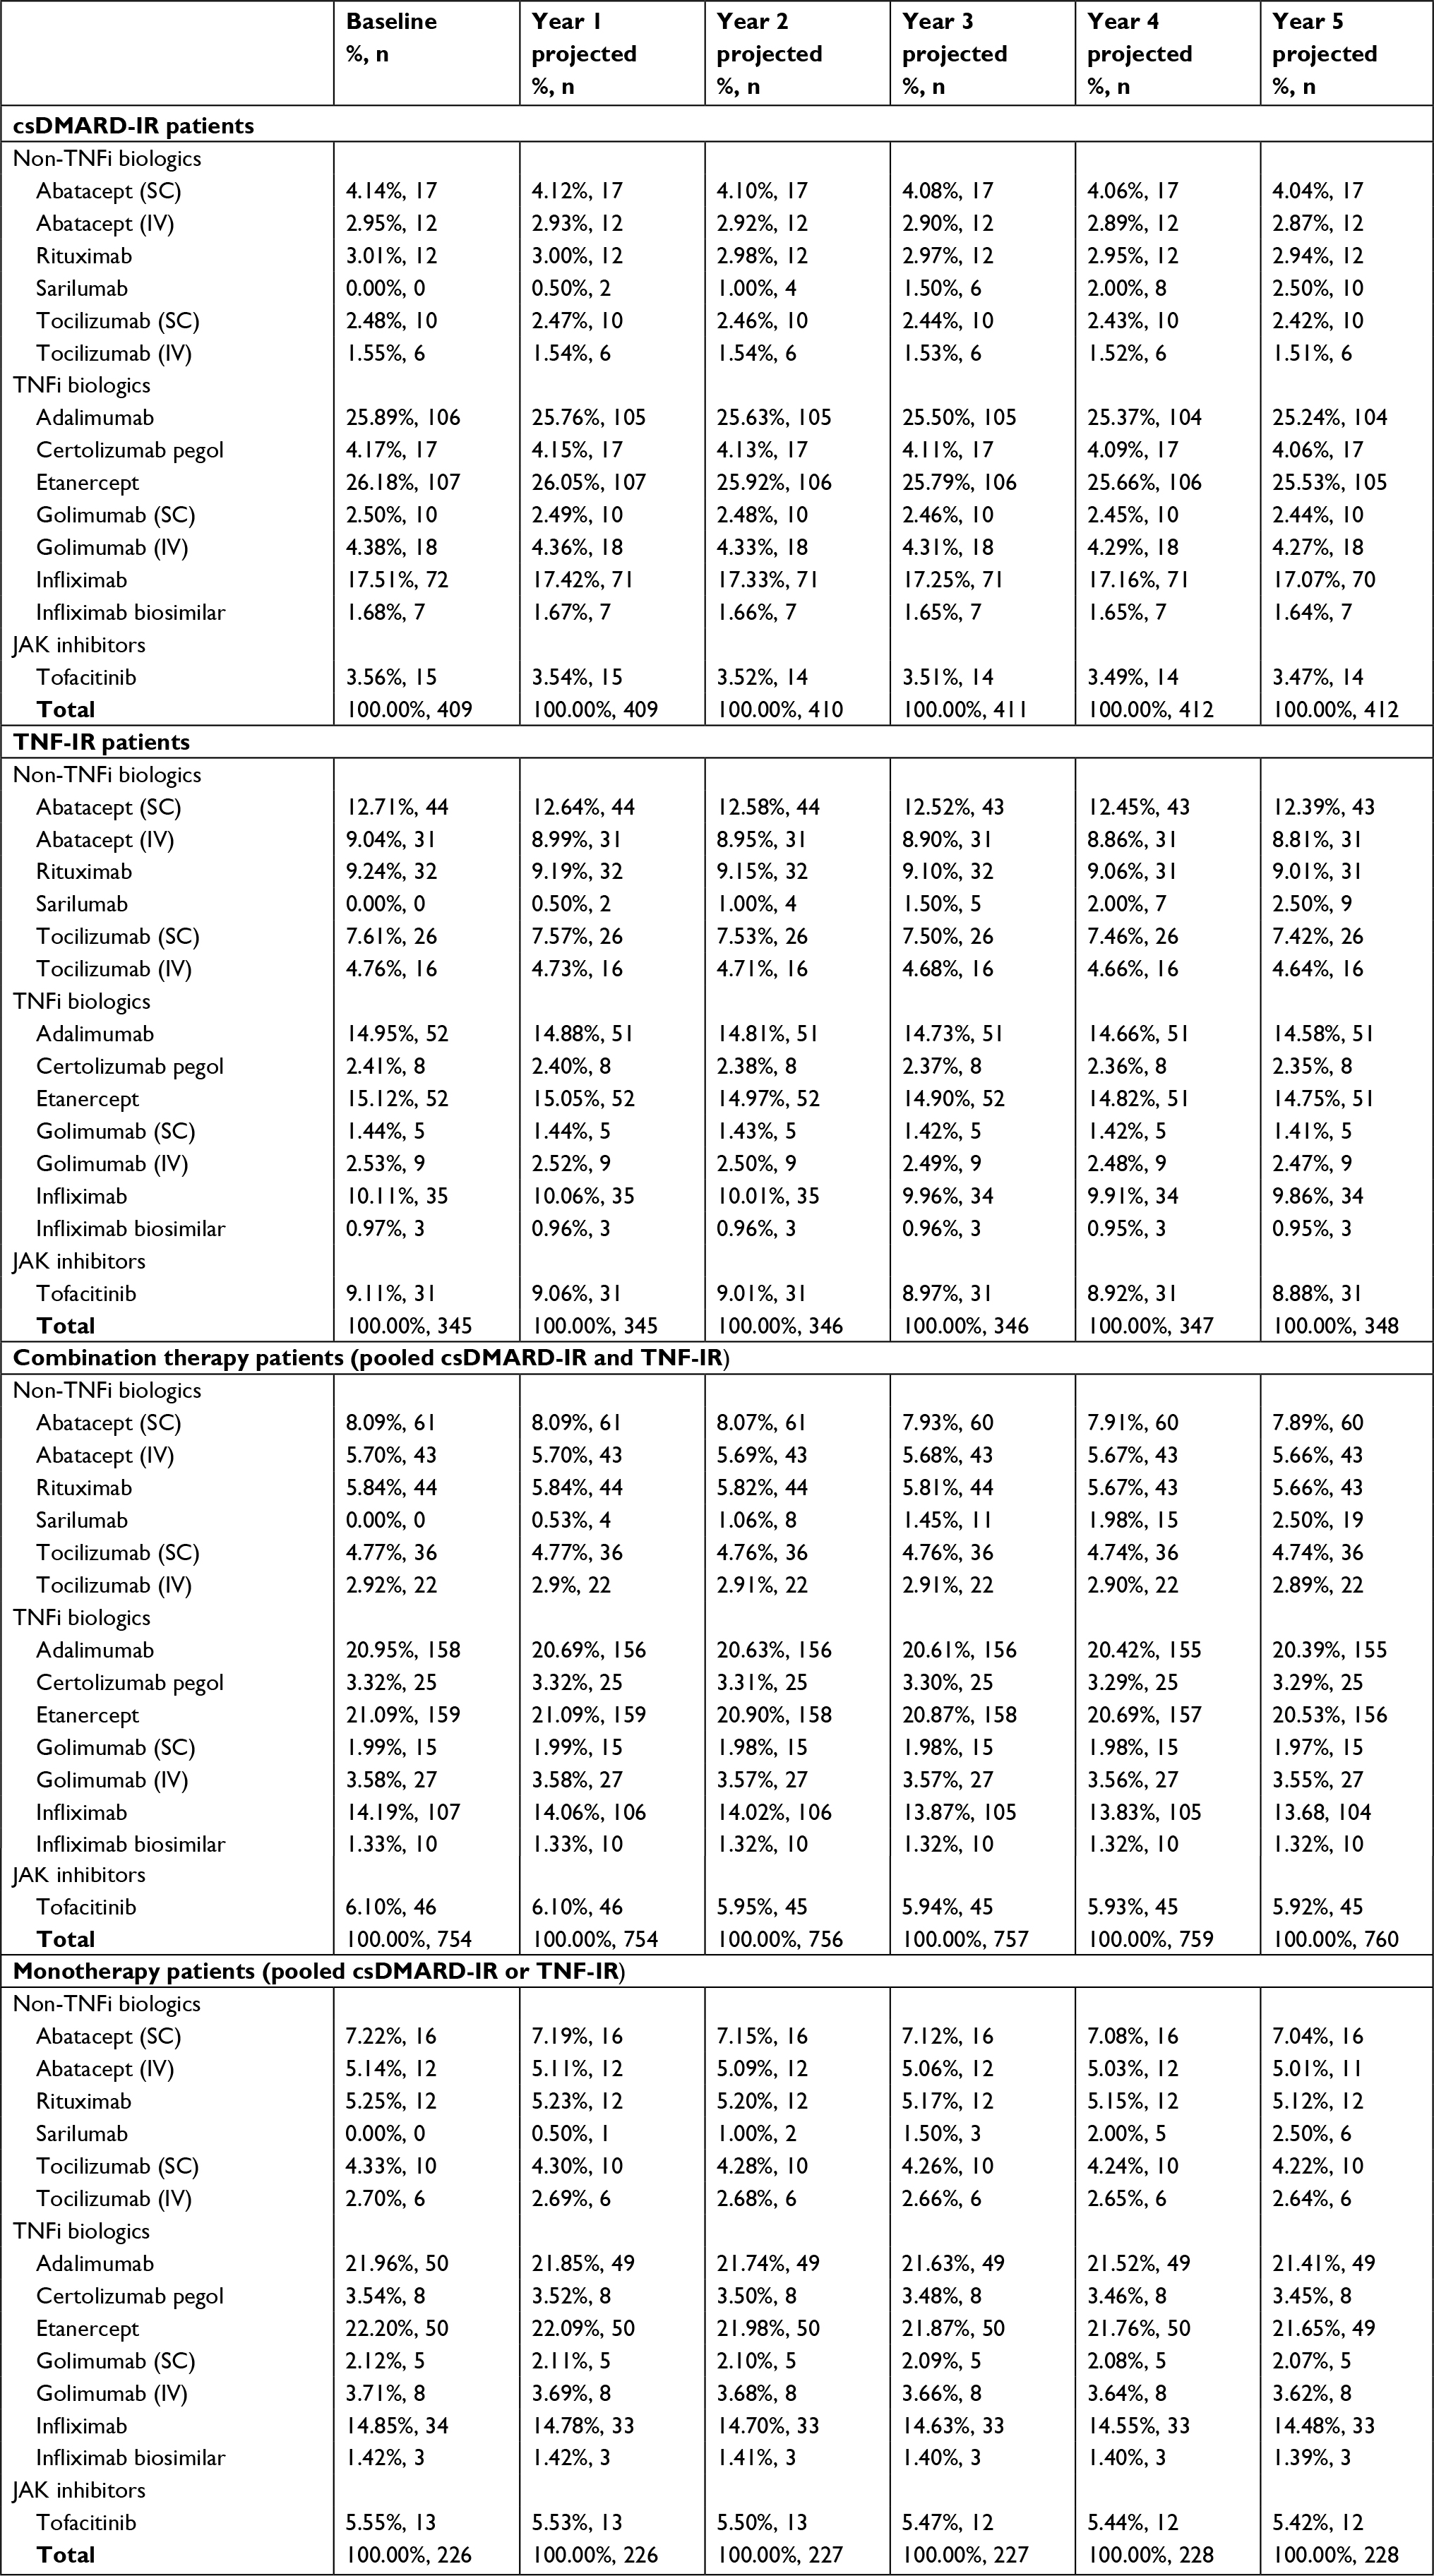 | Table 2 Estimates of treatment-eligible population: projected patient treatment distributions Abbreviations: DMARD, disease-modifying antirheumatic drug; IR, inadequate response; IV, intravenous; JAK, Janus kinase; RA, rheumatoid arthritis; SC, subcutaneous; TNF, tumor necrosis factor; TNFi, tumor necrosis factor inhibitor; csDMARD, conventional synthetic disease-modifying antirheumatic drug. |
Treatment assumptions
The model does not assume treatment use over the entire 5-year horizon; rather, a comparable 1-year duration of treatment (DOT) was assumed for all treatments, with the basis of this standardization due to the lack of real-world DOT data for sarilumab. Dosing requirements and infusion times were obtained from drug-prescribing information. For treatments administered according to body weight, the model assumed that all patients had an average weight of 81.8 kg, based on the national average weight of males and females in the US, taken from the National Center for Health Statistics.22 TNF-IR and csDMARD-IR populations were assumed to be administered csDMARD combination therapy with methotrexate. Rates of methotrexate use were adopted from Chen et al (2016)23 for all treatments except sarilumab, which was assumed to be 100%, and tofacitinib, which was assumed to be a mid-point value of 50% due to lack of evidence.
Dose titration in RA treatment is commonly observed in real-world practice as patients and physicians strive to achieve and maintain treatment response in RA patients. Therefore, the model considers dose titration with the RA drugs. For sarilumab, 150 and 200 mg subcutaneous (SC) doses are available, and it was assumed that patients would begin sarilumab treatment with the 200-mg dose with an option to decrease to 150 mg if required as per the label. Dose-titration estimates for each of the other treatments considered the time to dose titration, the percentage of patients titrating, and the magnitude of dose titration (Table 3).
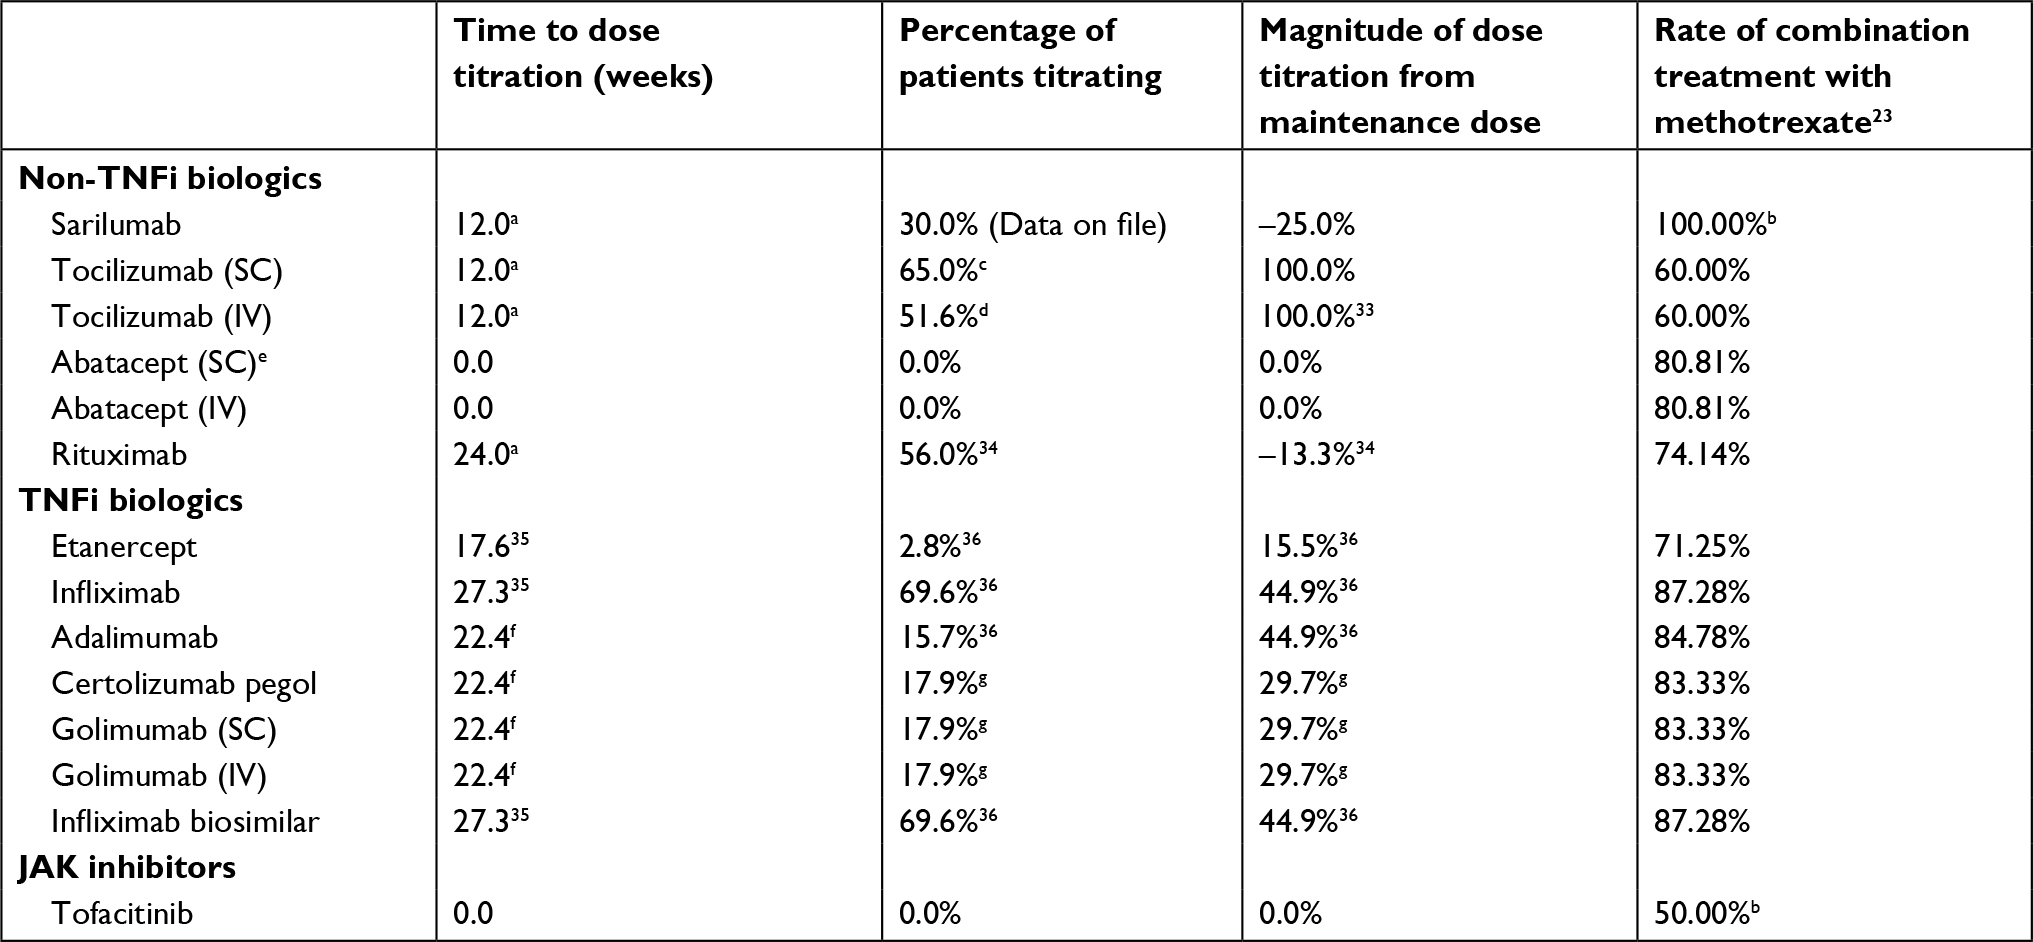 | Table 3 Dose titration and combination treatment with methotrexate Notes: aIn the absence of observational data estimating the average time to titration, it is assumed that patients titrate at their 3-month follow-up if they do not adequately respond or due to tolerability issues. bAssumptions due to unavailability of data; for tofacitinib, 50% is the mid-point value. cRegeneron and Sanofi US Real World Actemra SC Dosing Study using Truven MarketScan Databases. 2016 (Data on file). dGNS TNF cycling predictive analytics project (data on file). eDose titration is not recommended for Abatacept (package insert). fAssumption based on the average time to escalation of etanercept and infliximab.35 gWeighted average of etanercept, infliximab, and adalimumab derived from Joyce et al.36 Abbreviations: IV, intravenous; JAK, Janus kinase; SC, subcutaneous; TNF, tumor necrosis factor; TNFi, tumor necrosis factor inhibitor. |
Adherence to treatment was assumed to impact the number of DMARD doses and administrations. The model considered that all patients were 100% adherent during the 8-week induction phase; however, adherence, after the induction phase, declined at rates specific to each treatment (Sanofi-Regeneron data on file: Decision Resources - Immune and Inflammatory Disorders Study: Rheumatoid Arthritis. 2011), reducing the volume of medication consumed during the maintenance phase.
Costs
Direct medical costs (reported in 2018 USD) associated with treatment were considered for analysis; these included individual wholesale acquisition costs (April 2018) of RA treatments and concomitant medications, administration costs, and individual drug-monitoring costs. Other direct medical costs such as outpatient visits were not included, as this resource use was anticipated to be similar across the treatments and, therefore, contributory to non-differential costs. Moreover, adverse event costs were not included due to the heterogeneity of how severity is defined, such as for infections, and consequently valued, in the published literature.
Individual drug costs reflected the health-care plan benefit structure (eg, tier placement and patient cost-sharing schemes, such as co-payment amount or co-insurance rate) to more accurately represent the final cost to the commercial health-care plan. Except for methotrexate and prednisone, which were allocated to Tier 1 ($11.00 co-payment; 17.0% co-insurance) because of their available generic formulations, all other comparators were allocated to “specialty tier” ($54.00 co-payment; 43.0% co-insurance)24 based on their cost exceeding $670 per month.25 National co-payment amounts for commercial health-care plan medical and pharmacy benefits, by tier, were obtained from 2015 Kaiser Family Foundation (KFF) data.24 A dispensing fee of either $1.87 for brands or $1.77 for generic products was implemented across all comparators except those administered intravenously.26 In the base-case analysis, published wholesale acquisition costs (WAC) of drugs were utilized (Table 4). The compound annual growth rate for drug price increases levied by the manufacturer between 2013 and 2018 were calculated in order to estimate the projected annual price increases for each drug.
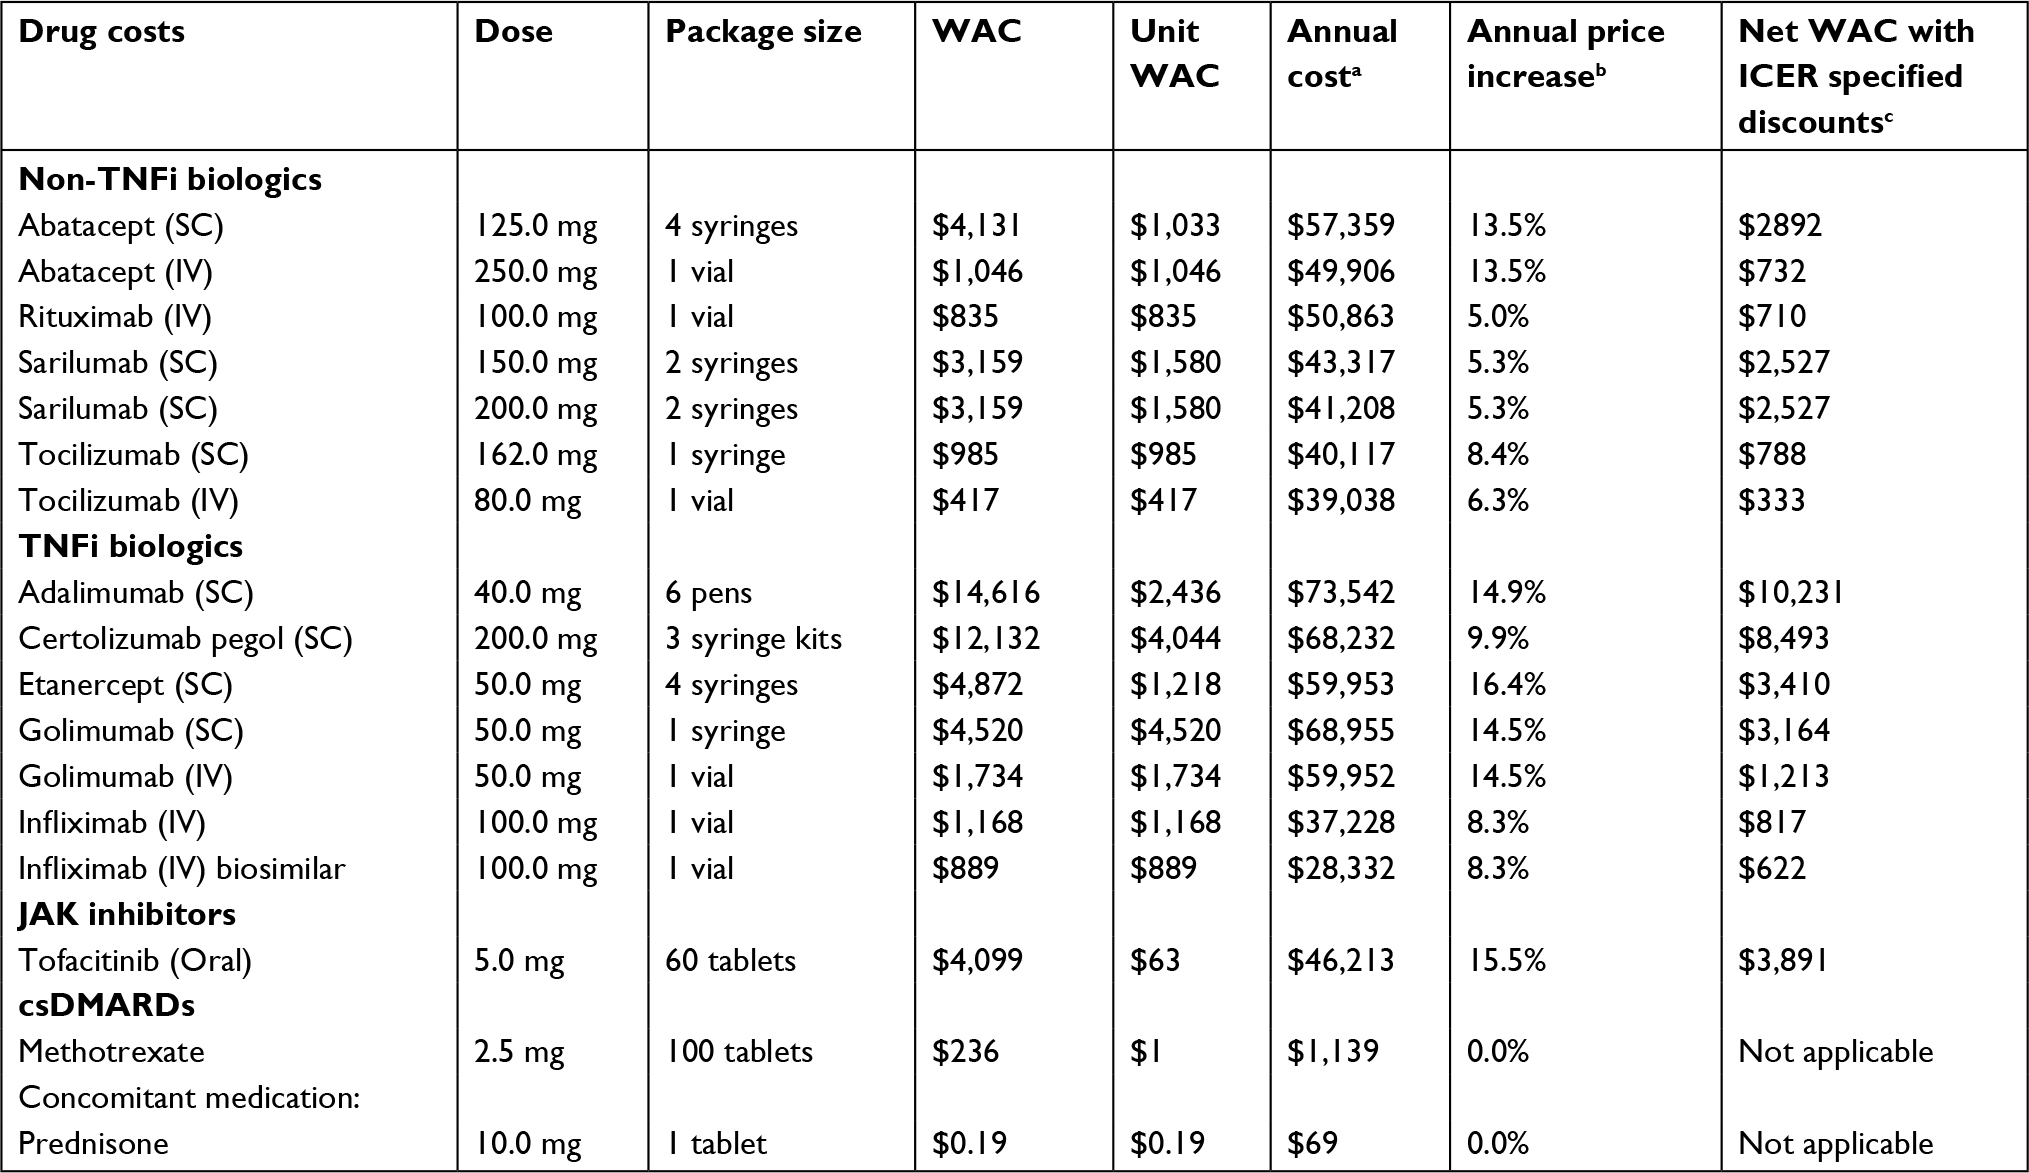 | Table 4 Drug cost summary Notes: aAssuming full compliance, no fees, discounts or any patient out of pocket contributions. bBased on the compound annual growth rate for drug prices between January 2013 to January 2016.37 cDiscounts: TNFi: 30%, CD-20 directed cytolytic antibody: 15%, T-cell inhibitors: 30%, IL-6 inhibitors: 20%, JAK inhibitors: 5%. Abbreviations: csDMARD, conventional synthetic disease-modifying antirheumatic drug; IV, intravenous; JAK, janus kinase; SC, subcutaneous; TNFi, tumor necrosis factor inhibitor; WAC, wholesale acquisition cost. |
According to the 2015 ACR guidelines,6 RA patients with moderate or severe disease activity despite treatment with csDMARDs or biologic therapy are recommended low-dose glucocorticoids (≤10 mg/day of prednisone or equivalent); consequently, concomitant prednisone therapy costs were included in drug costs. In addition, costs of laboratory monitoring were included, on the basis of monitoring requirements published in the drug’s prescribing information; laboratory monitoring costs were based on the Medicare Clinical and Laboratory Fee Schedule.27
Analyses
An analysis of the impact of sarilumab on pharmacy, medical, and total health-care budgets was conducted with annual and aggregated estimates up to Year 5. In addition, the average monthly costs per health-care plan member (ie, net per member per month [PMPM] costs) were evaluated. Furthermore, a scenario analysis was conducted where drug costs were net of class-level discounts as applied in the recent evidence report, Targeted Immune Modulators for Rheumatoid Arthritis: Effectiveness & Value issued by the Institute for Clinical and Economic Review (ICER).28 In this evaluation, discounts were estimated by comparing average net prices for each agent over the four quarters of 2016 against its WAC. An average discount was then estimated for each drug class28: TNFi: 30%; CD-20 directed cytolytic antibody: 15%; T-cell inhibitors: 30%; IL-6 inhibitors: 20%; and JAK inhibitors: 5% (Table 4).
One-way sensitivity analyses (OWSA) were conducted on the base-case budget impact to evaluate the effect to the model by varying input parameters within the range of ±20%. Base-case parameters included: sarilumab combination, sarilumab DOT, covered lives (Year 1), percentage adults (Year 1), prevalence of RA (Year 1), moderate-to-severe patients (Year 1), csDMARD-treated patients (Year 1), csDMARD-IR (Year 1), adalimumab compliance, and etanercept compliance.
Results
Base-case analysis
For a hypothetical plan of one million members, the adult population increased from 772,521 in Year 1 to 778,393 in Year 5, with the prevalence of RA, including moderate-to-severe RA, and DMARD use increasing proportionally over the horizon (Table 1). The prevalence of csDMARD and TNFi use along with csDMARD-IR and TNF-IR patient populations are shown in Table 1. The annual sarilumab-eligible csDMARD-IR, TNF-IR, and monotherapy patient populations were estimated to be 409, 345, and 226 in Year 1, respectively, with a slight increase over time due to changing population demographics (Table 1).
Upon the introduction of sarilumab as an available treatment for RA for those patients who have had an IR or who were intolerant to one or more DMARDs, the projected average annual pharmacy cost per patient per year (PPPY) over the 5-year horizon for sarilumab combination therapy was $36,949. Given equivalent cost per dose, the cost for sarilumab was stable despite titration. For comparators, PPPY treatment costs (taking into account titration) ranged from $24,063 for the infliximab biosimilar to $92,797 for etanercept (Figure 1).
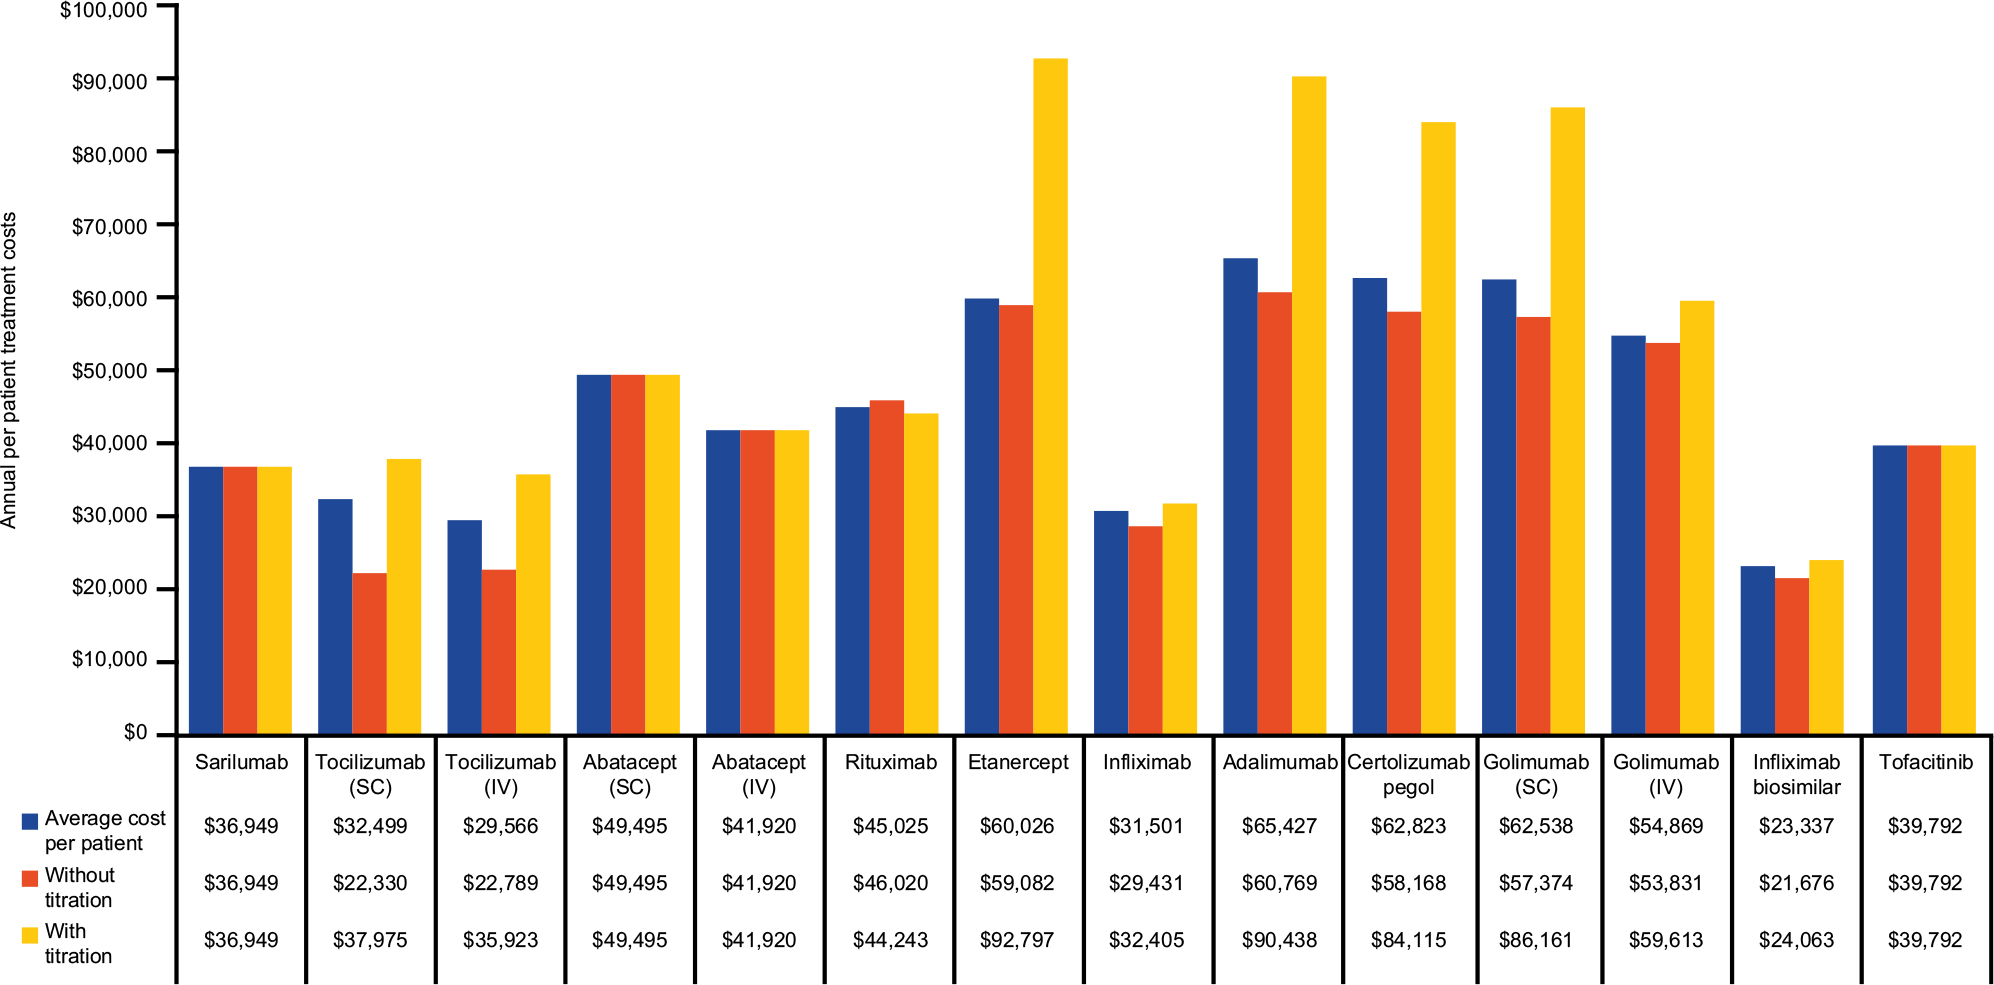 | Figure 1 Annual per-patient treatment costs for years 1–5. Note: All costs are presented in US$. Abbreviations: IV, intravenous; SC, subcutaneous. |
As more patients in each of the patient populations received sarilumab treatment, total costs within a health plan decreased over the 5 years. In the csDMARD-IR population, savings grew from $28,610 (−0.14%) in Year 1 to $194,646 (−0.85%) in Year 5 resulting in total savings of $526,424 (0.49%) to the health-care plan over 5 years from the introduction of sarilumab to the market (Figure 2A; Table S2A).
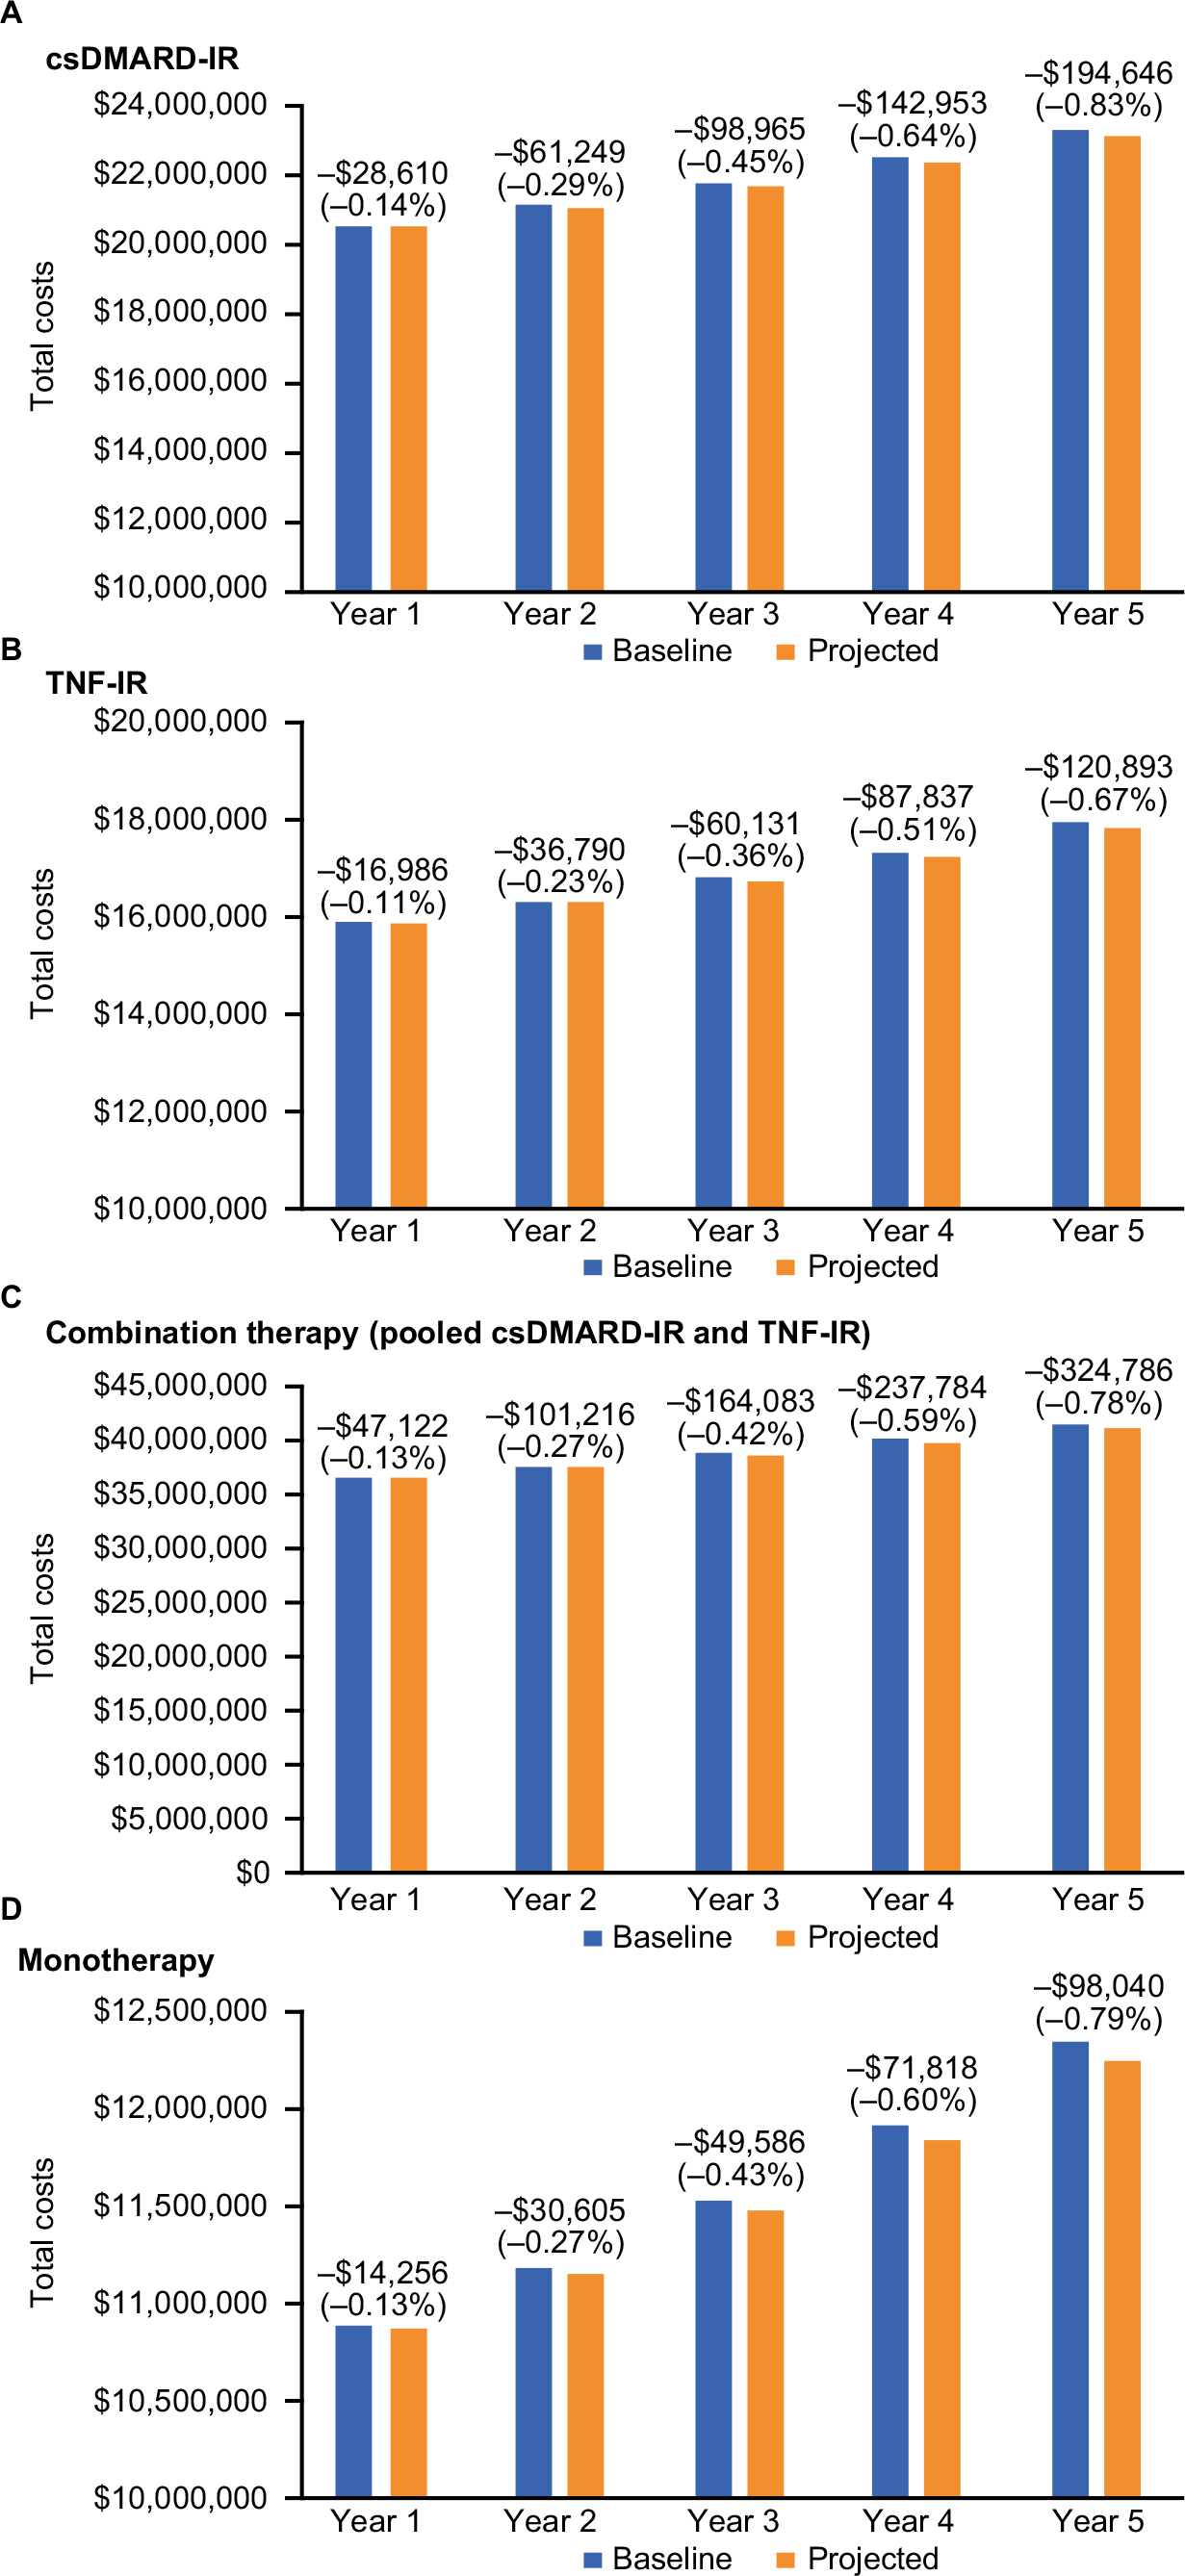 | Figure 2 Total costs and budget impact in years 1–5 for (A) csDMARD-IR, (B) TNF-IR, (C) combination therapy, and (D) monotherapy populations. Note: All costs are presented in US$. Abbreviations: csDMARD, conventional synthetic disease-modifying antirheumatic drug; IR, inadequate response; TNF, tumor necrosis factor. |
In the csDMARD-IR population, although additional monitoring requirements for sarilumab increased medical expenditures from $145 (2.40%) to $732 (1.19%) in years 1 and 5, respectively, net savings were gained primarily from reduced costs of csDMARD, other bDMARD, JAK inhibitors, and concomitant medications ($27,638 [−0.14%] to $189,753 [−0.82%] in years 1 and 5, respectively), and decreased administration costs associated with IV therapies ($1116 [−0.50%] to $5625 [−2.50%] in years 1 and 5, respectively) due to patient migration to sarilumab from the other available treatments. The average monthly cost per health-care plan member (ie, net PMPM cost savings) was neutral to moderately cost saving ($0.00 in Year 1 [−0.14%] and −$0.02 [−0.89%] in Year 5).
Similarly, for the TNF-IR treatment population, the base-case assumptions resulted in potential total health-care plan cost savings of up to $322,637 (0.38%) over the 5 years. Savings grew from $16,986 in year 1 to $120,893 in Year 5, with relative savings increasing from 0.11% to 0.67% (Figure 2B; Table S2B). Furthermore, savings on a PMPM basis increased, from neutral ($0.00 [−0.11%]) in Year 1 to moderately cost-saving ($0.01 [−0.67%]) in Year 5. Additional monitoring requirements for sarilumab added to medical expenditures, $102 (0.18%) to $513 (0.91%) in years 1 and 5, respectively, and net savings were gained primarily from the reduced cost of other pharmaceuticals (−$15,947 [−0.10%] to −$115,658 [−0.66%] in years 1 and 5, respectively) and associated administration costs ($1141 [−0.50%] to $5748 [−2.50%] in years 1 and 5, respectively).
When the csDMARD-IR and TNF-IR populations were pooled (combination therapy population), the total health-care plan cost savings were $47,122 (−0.13%) in Year 1, rising to $324,786 (−0.78%) in Year 5 (Figure 2C; Table S2C). As may be expected, these savings were primarily due to reduced cost of other treatment ($45,158 [−0.12%] to $314,895 [−0.77%] in years 1 and 5, respectively) and administration costs ($2215 [−0.50%] to $11,159 [−2.5%] in years 1 and 5, respectively).
In the pooled csDMARD-IR and TNF-IR monotherapy population, total health-care plan cost savings of up to $264,306 (−0.46%) accrued over 5 years; saving $14,256 (−0.13%) in Year 1 to $98,040 (−0.79%) in Year 5 (Figure 2D; Table S2D). PMPM savings increased from neutral ($0.00 [−0.13%]) in Year 1 to moderately cost-saving (−$0.01 [−0.79%]) in Year 5. Additional monitoring requirements for sarilumab added to medical expenditures, $123 (2.09%) to $621 (10.44%) in years 1 and 5, respectively. Net savings accrued from reduced cost of other pharmaceuticals ($13,714 [−0.13%] to $95,308 [−0.78%] in years 1 and 5, respectively), and administration costs ($664 [−0.50%] to $3348 [−2.50%] in years 1 and 5, respectively).
Scenario analyses
After applying class-level discounts29 to the WAC of each treatment (Table 4), the model demonstrated a potential for continued cost savings with the introduction of sarilumab. Total health-care plan cost savings of up to $482,582 over the 5 years ($25,702 [−0.15%] in Year 1 to $179,999 [−0.92%] in Year 5) were estimated in csDMARD-IR, up to $287,127 over the 5 years for TNF-IR ($14,631 [−0.12%] in Year 1 to $109,030 [−0.74%] in Year 5) and $238,598 (0.50%) over the 5 years for monotherapy ($12,552 [−0.14%] in Year 1 to $89,451 [−0.86%] in Year 5). Compared with the scenario which did not consider the discounted drug prices, the estimated savings were approximately 8–11% lower across the various populations.
Sensitivity analysis
OWSA in Year 1 on all variables revealed that the model was most sensitive to variations in sarilumab adherence (Figure 3), with consistent results for both the csDMARD-IR and TNF-IR population models. When population variables were excluded from the OWSA, adherence and DOT variables showed the greatest impact on costs in both population models.
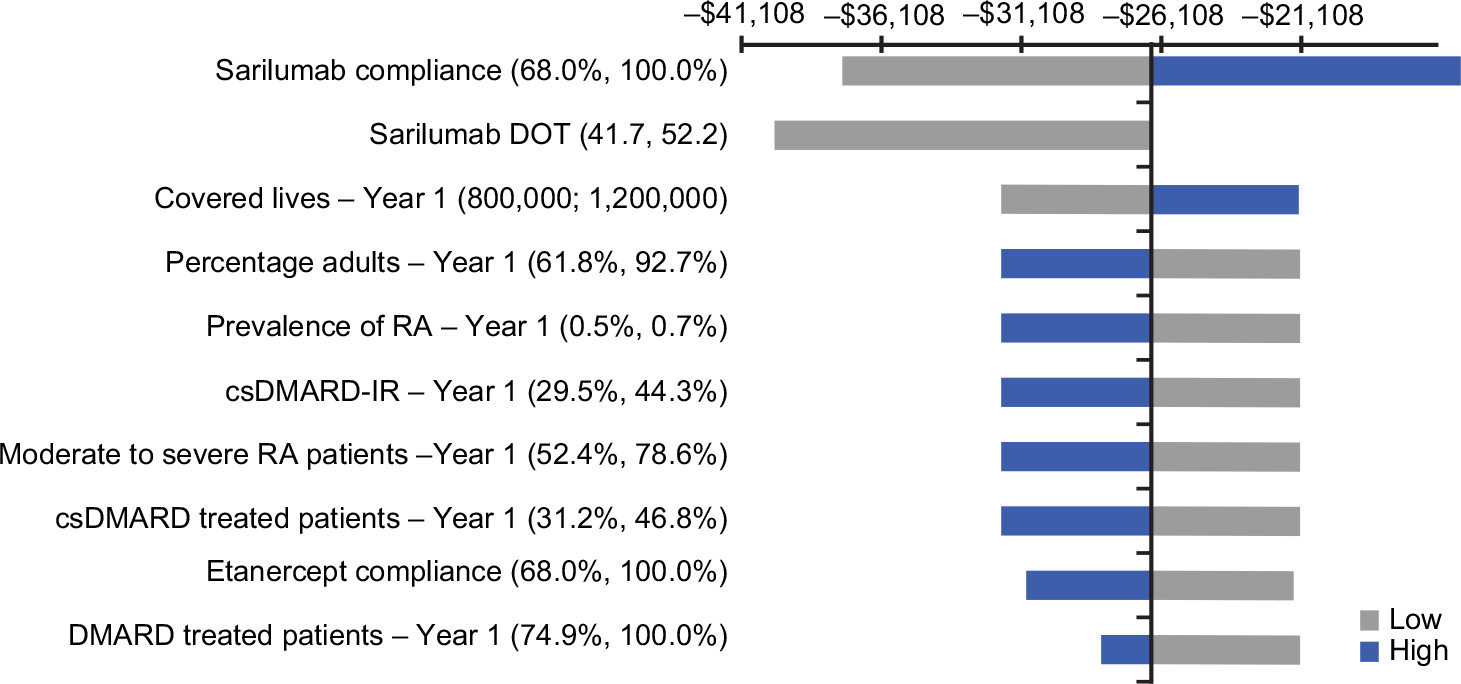 | Figure 3 One-way sensitivity analyses on total costs for csDMARD-IR (minimum and maximum of parameter range). Note: All costs are presented in US$. Abbreviations: DOT, duration of treatment; csDMARD, conventional synthetic disease-modifying antirheumatic drug; IR, inadequate response; RA, rheumatoid arthritis. |
Discussion
The current budget-impact analysis evaluated the 1- to 5-year budgetary consequences to a US commercial health-care plan of adding sarilumab for the treatment of moderate-to-severe RA in patients who have IR to one or more DMARDs. The base-case considered a 2.50% RA sarilumab-adoption rate by Year 5, displacing the use of other RA treatments. In this base-case analysis, the addition of sarilumab to the formulary resulted in budgetary savings of up to 0.14% at Year 1 to 0.83% at Year 5 in the csDMARD-IR population. Reduced costs were primarily due to the displacement of the more expensive biologics with sarilumab.
The stable dosing paradigm and price parity for the two available doses (150 and 200 mg every 2 weeks) of sarilumab underscore its economic value, as compared with alternative biologic products that have substantial variability in dose titration and schedules, and are more expensive at higher doses. The published data on dose titrations that informed the model indicated that upward titration was prevalent for most of the bDMARDs, with the magnitude of dose titration from the maintenance dose ranging from 15.50% for etanercept up to 100% for a portion of patients treated with tocilizumab (SC and IV).
OWSA on all variables in Year 1 shows that the model was most sensitive to variations in sarilumab adherence. When population variables were excluded, the model was most sensitive to variations in adherence and DOT, which directly impact the volume of drug utilized.
A limitation of the budget-impact analysis was the lack of real-world data on DOT for sarilumab and other biologic treatments. At the time of model development, this parameter was only informed by an assumption of equivalent DOT across treatments in the base-case. Future research is warranted to evaluate the true impact of DOT on costs when real-world data on sarilumab treatment duration are available. Furthermore, the analysis was based on published list prices for biologic drugs, although payers may receive confidential discounts and rebates from manufacturers. Although these rebates are not publicly available and could, therefore, not be included in the calculation, they may impact the findings of this analysis. However, a scenario with class-level discounts based on real-world pricing data indicated28 that the beneficial impact of introducing sarilumab to a health-care plan budget would be sustained.
This budget-impact model has been conducted over a horizon of 5 years, and considered a number of important compliance, titration, administration, and treatment-monitoring assumptions, in addition to the dynamic market-share factors, in evaluating the consequences of introducing sarilumab to a US commercial health-care plan – an approach that is relatively more comprehensive than previous such evaluations in the US.21 The results of a budget-impact analysis of tofacitinib by Bhattacharya and Kamal21 are not comparable with our study, given the large difference in the evaluation approach, including their limited market basket to anti-TNFs only; 2013 drug costs, which have increased significantly since then; and variations in the utilization rates, which impact the contribution of each drug to the overall costs.
Our analysis indicates that the introduction of sarilumab would be associated with potential cost savings as early as Year 1, primarily due to the displacement of the more expensive biologics for RA with this most recently available IL-6 inhibitor. The modeling approach adhered to published guidelines for good modeling practice12 and the scenario analysis aligned with costing assumptions applied in the recent ICER evaluation of targeted therapies.28
Conclusion
Sarilumab provides a new option for non-responders to csDMARD or TNFi and opportunities for cost savings for patients who do not respond well to their initial treatment or are titrated with little clinical benefit.4 The information presented in this analysis may help inform formulary decision-making for reimbursement of RA treatments, given the recent approval of sarilumab.
Acknowledgments
Medical writing assistance and editorial support, under the direction of the authors, were respectively provided by Gauri Saal, MA Economics, Sam Lewtas, MPharm, and Sinead Stewart of Prime (Knutsford, UK), funded by Sanofi/Regeneron Pharmaceuticals, Inc. according to Good Publication Practice guidelines (http://annals.org/aim/article/2424869). Sanofi/Regeneron sponsored the study and funded medical writing and editorial support. The sponsor was involved in the study design, collection, analysis, and interpretation of data, as well as data checking of information provided in the manuscript.
Author contributions
The authors had unrestricted access to study data and were responsible for all content and editorial decisions. All authors contributed to data analysis, drafting and revising the article, gave final approval of the version to be published, and agree to be accountable for all aspects of the work.
Disclosure
CPF and JM are employees of IQVIA, a company that received research funding for the current study from Regeneron Pharmaceuticals, Inc./Sanofi. CP is a former employee of, and current stockholder in, Sanofi and is a current employee and stockholder in ViiV Healthcare/GlaxoSmithKline. WW is a former employee of, and current stockholder in, Sanofi and is an employee of Regeneron Pharmaceuticals, Inc. AK, SB, and CC are current employees of, and stockholders in, Regeneron Pharmaceuticals, Inc. The authors received no honoraria related to the development of this publication. The authors report no other conflicts of interest in this work.
References
Myasoedova E, Crowson CS, Kremers HM, Therneau TM, Gabriel SE. Is the incidence of rheumatoid arthritis rising?: results from Olmsted County, Minnesota, 1955–2007. Arthritis Rheum. 2010;62(6):1576–1582. | ||
Birnbaum H, Pike C, Kaufman R, et al. Societal cost of rheumatoid arthritis patients in the US. Curr Med Res Opin. 2010;26(1):77–90. | ||
Shah A, St Clair EW. Rheumatoid arthritis. Harrison’s Principles of Internal Medicine. 19th ed. Kasper DL, Fauci AS, Hauser SL, editors. Vol. 2; 2015:2136–2149. | ||
Grabner M, Boytsov NN, Huang Q, et al. Costs associated with failure to respond to treatment among patients with rheumatoid arthritis initiating TNFi therapy: a retrospective claims analysis. Arthritis Res Ther. 2017;19(1):92. | ||
Beresniak A, Gossec L, Goupille P, et al. Direct cost-modeling of rheumatoid arthritis according to disease activity categories in France. J Rheumatol. 2011;38(3):439–445. | ||
Singh JA, Saag KG, Bridges SL, et al. 2015 American College of Rheumatology Guideline for the Treatment of Rheumatoid Arthritis. Arthritis Rheumatol. 2016;68(1):1–26. | ||
Srirangan S, Choy EH. The role of interleukin 6 in the pathophysiology of rheumatoid arthritis. Ther Adv Musculoskelet Dis. 2010;2(5):247–256. | ||
Burmester GR, Lin Y, Patel R, et al. Efficacy and safety of sarilumab monotherapy versus adalimumab monotherapy for the treatment of patients with active rheumatoid arthritis (MONARCH): a randomised, double-blind, parallel-group phase III trial. Ann Rheum Dis. 2017;76(5):840–847. | ||
Strand V, Kosinski M, Chen CI, et al. Sarilumab plus methotrexate improves patient-reported outcomes in patients with active rheumatoid arthritis and inadequate responses to methotrexate: results of a phase III trial. Arthritis Res Ther. 2016;18:198. | ||
Genovese MC, Fleischmann R, Kivitz AJ, et al. Sarilumab Plus Methotrexate in Patients With Active Rheumatoid Arthritis and Inadequate Response to Methotrexate: Results of a Phase III Study. Arthritis Rheumatol. 2015;67(6):1424–1437. | ||
Fleischmann R, van Adelsberg J, Lin Y, et al. Sarilumab and Nonbiologic Disease-Modifying Antirheumatic Drugs in Patients With Active Rheumatoid Arthritis and Inadequate Response or Intolerance to Tumor Necrosis Factor Inhibitors. Arthritis Rheumatol. 2017;69(2):277–290. | ||
Sullivan SD, Mauskopf JA, Augustovski F, et al. Budget impact analysis-principles of good practice: report of the ISPOR 2012 Budget Impact Analysis Good Practice II Task Force. Value Health. 2014;17(1):5–14. | ||
Burmester GR, Rubbert-Roth A, Cantagrel A, et al. Efficacy and safety of subcutaneous tocilizumab versus intravenous tocilizumab in combination with traditional DMARDs in patients with RA at week 97 (SUMMACTA). Ann Rheum Dis. 2016;75(1):68–74. | ||
Centers for Disease Control and Prevention. Rheumatoid Arthritis (RA); 2016. Available from: http://www.cdc.gov/arthritis/basics/rheumatoid.htm. Accessed January 30, 2017. | ||
Decision Resources Group. Pharmacor Immune and Inflammatory Disease: Rheumatoid Arthritis; 2015. Available from: https://decisionresourcesgroup.com/report/246098-biopharma-rheumatoid-arthritis-2015/. Accessed January 30, 2017. | ||
NCQA. DMARD Treatment Rate: Disease-Modifying Anti-Rheumatic Drug Therapy for Rheumatoid Arthritis; 2016. Available from: http://www.ncqa.org/report-cards/health-plans/state-of-health-care-quality/2016-table-of-contents/dmards. Accessed January 30, 2017. | ||
Pincus T, Strand V, Koch G, et al. An index of the three core data set patient questionnaire measures distinguishes efficacy of active treatment from that of placebo as effectively as the American College of Rheumatology 20% response criteria (ACR20) or the Disease Activity Score (DAS) in a rheumatoid arthritis clinical trial. Arthritis Rheum. 2003;48(3):625–630. | ||
Klareskog L, van der Heijde D, de Jager JP, et al. Therapeutic effect of the combination of etanercept and methotrexate compared with each treatment alone in patients with rheumatoid arthritis: double-blind randomised controlled trial. Lancet. 2004;363(9410):675–681. | ||
Breedveld FC, Weisman MH, Kavanaugh AF, et al. The PREMIER study: A multicenter, randomized, double-blind clinical trial of combination therapy with adalimumab plus methotrexate versus methotrexate alone or adalimumab alone in patients with early, aggressive rheumatoid arthritis who had not had previous methotrexate treatment. Arthritis Rheum. 2006;54(1):26–37. | ||
Smolen JS, van der Heijde DM, St Clair EW, et al. Predictors of joint damage in patients with early rheumatoid arthritis treated with high-dose methotrexate with or without concomitant infliximab: results from the ASPIRE trial. Arthritis Rheum. 2006;54(3):702–710. | ||
Bhattacharya R, Kamal KM. Budget Impact Analysis of Tofacitinib for treatment of Rheumatoid Arthritis. J Arthritis. 2015;04(02):152. | ||
National Center for Health Statistics. Body Measurements. Available from: http://www.cdc.gov/nchs/fastats/body-measurements.htm. Accessed October 10, 2018. | ||
Chen CI, Wei W, Blackburn S, Sullivan E, Piercy J. Trends and Factors Associated with Use of Biologic Agents As Monotherapy Among US Patients with Rheumatoid Arthritis [abstract]. Arthritis Rheumatol. 2016;68(Suppl 10). | ||
Kaiser Family Foundation and Health Research & Educational Trust. Employer Health Benefits. 2015 Annual Survey; 2015. Available from: http://files.kff.org/attachment/report-2015-employer-health-benefits-survey. Accessed January 30, 2017. | ||
Centers for Medicare & Medicaid Services. Announcement of Calendar Year (CY) 2017 Medicare Advantage Capitation Rates and Medicare Advantage and Part D Payment Policies and Final Call Letter; 2016. Available from: https://www.cms.gov/Medicare/Health-Plans/MedicareAdvtgSpecRateStats/Downloads/Announcement2017.pdf. Accessed October 10, 2018. | ||
Pharmacy Benefit Management Institute. 2014-2015 Prescription Drug Benefit Cost and Plan Design Annual Report. 2016. Available from: https://www.pbmi.com/ItemDetail?iProductCode=2014-2015_BDR&Category=BDR. Accessed November 22, 2017. | ||
Centers for Medicare & Medicaid Services. Clinical Laboratory Fee Schedule; 2016. Available from: https://www.cms.gov/medicare/medicare-fee-for-service-payment/clinicallabfeesched/. Accessed January 30, 2017. | ||
Institute for Clinical and Economic Review. Targeted Immune Modulators for Rheumatoid Arthritis: Effectiveness & Value; 2017. Available from: https://icer-review.org/wp-content/uploads/2016/08/NE_CEPAC_RA_Evidence_Report_FINAL_040717.pdf. Accessed May 20, 2017. | ||
U.S. Census Bureau, Projections N.P; 2014. Available from: https://www.census.gov/data/tables/2014/demo/popproj/2014-summary-tables.html. Accessed October 23, 2018. | ||
REMICADE (infliximab) [prescribing information]. Horsham, PA: Janssen Biotech Inc; 2015. Available from: https://www.accessdata.fda.gov/drugsatfda_docs/label/2013/103772s5359lbl.pdf. Accessed October 23, 2018. | ||
Strand V, Williams S, Miller PSJ, Saunders K, Grant S, Kremer JM. OP0064 Discontinuation of Biologic Therapy in Rheumatoid Arthritis (RA): Analysis from the Consortium of Rheumatology Researchers of North America (CORRONA) Database. Ann Rheum Dis. 2013;72(Suppl 3):71–A72. | ||
Yazici Y, Shi N, John A. Utilization of biologic agents in rheumatoid arthritis in the United States: analysis of prescribing patterns in 16,752 newly diagnosed patients and patients new to biologic therapy. Bull NYU Hosp Jt Dis. 2008;66(2):77–85. | ||
Pappas DA, John A, Curtis JR, et al. Dosing of Intravenous Tocilizumab in a Real-World Setting of Rheumatoid Arthritis: Analyses from the Corrona Registry. Rheumatol Ther. 2016;3(1):103–115. | ||
Ogale S, Hitraya E, Henk HJ. Patterns of biologic agent utilization among patients with rheumatoid arthritis: a retrospective cohort study. BMC Musculoskelet Disord. 2011;12:204. | ||
Ariza-Ariza R, Navarro-Sarabia F, Hernández-Cruz B, Rodríguez-Arboleya L, Navarro-Compán V, Toyos J. Dose escalation of the anti-TNF-alpha agents in patients with rheumatoid arthritis. A systematic review. Rheumatology. 2007;46(3):529–532. | ||
Joyce AT, Gandra SR, Fox KM, Smith TW, Pill MW. National and regional dose escalation and cost of tumor necrosis factor blocker therapy in biologic-naïve rheumatoid arthritis patients in US health plans. J Med Econ. 2014;17(1):1–10. | ||
Medi-Span Price Rx; 2017. Available from: https://pricerx.medispan.com. Accessed October 10, 2018. |
Supplementary materials
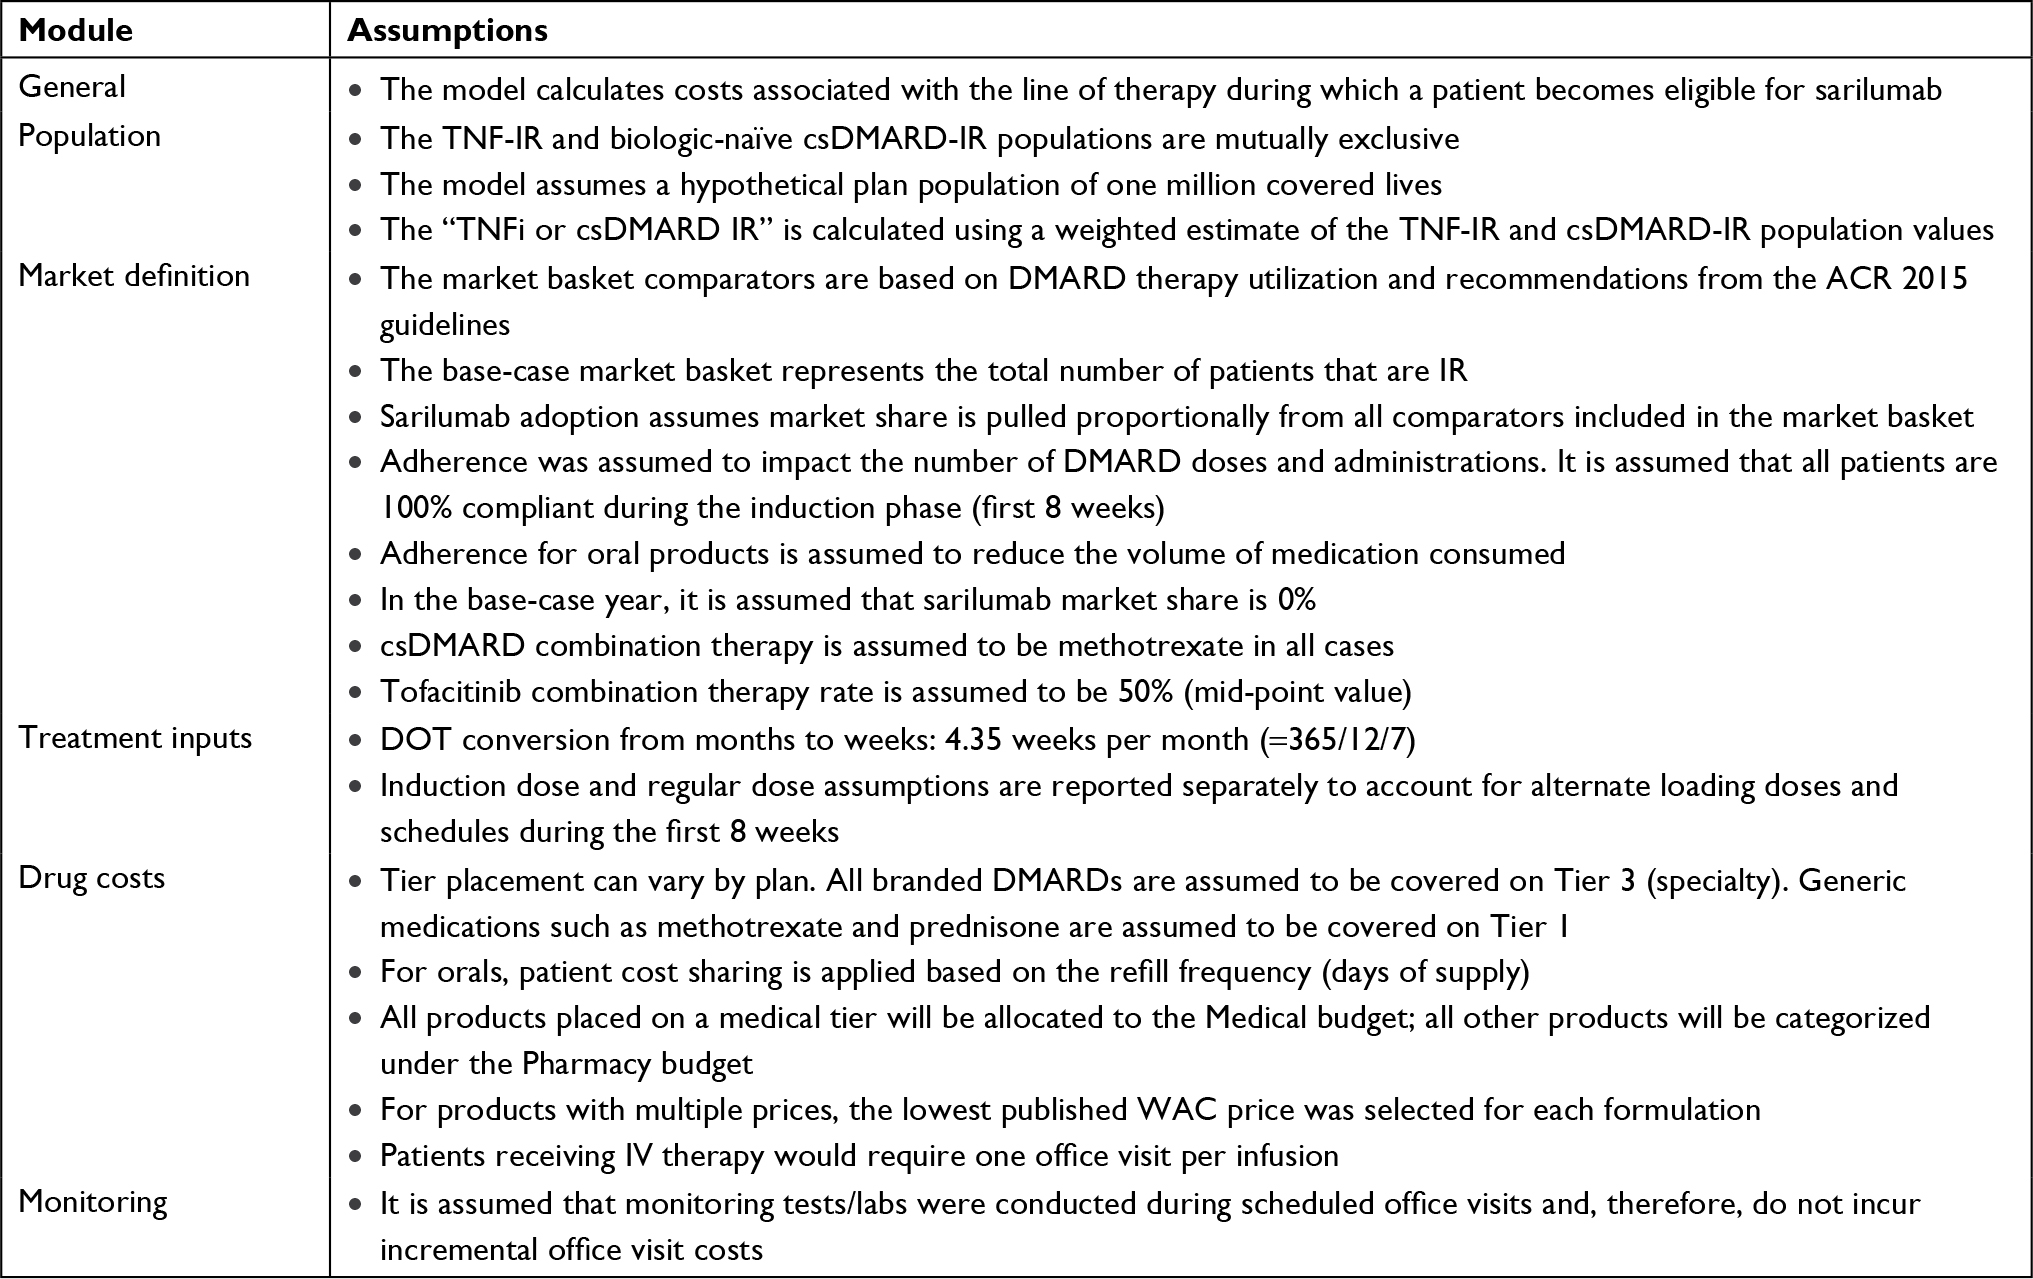 | Table S1 Model assumptions Abbreviations: ACR, American College of Rheumatology; cs, conventional synthetic; DMARD, disease-modifying antirheumatic drug; DOT, duration of treatment; IR, inadequate response; IV, intravenous; RA, rheumatoid arthritis; TNFi, tumor necrosis factor inhibitor; WAC, wholesale acquisition cost. |
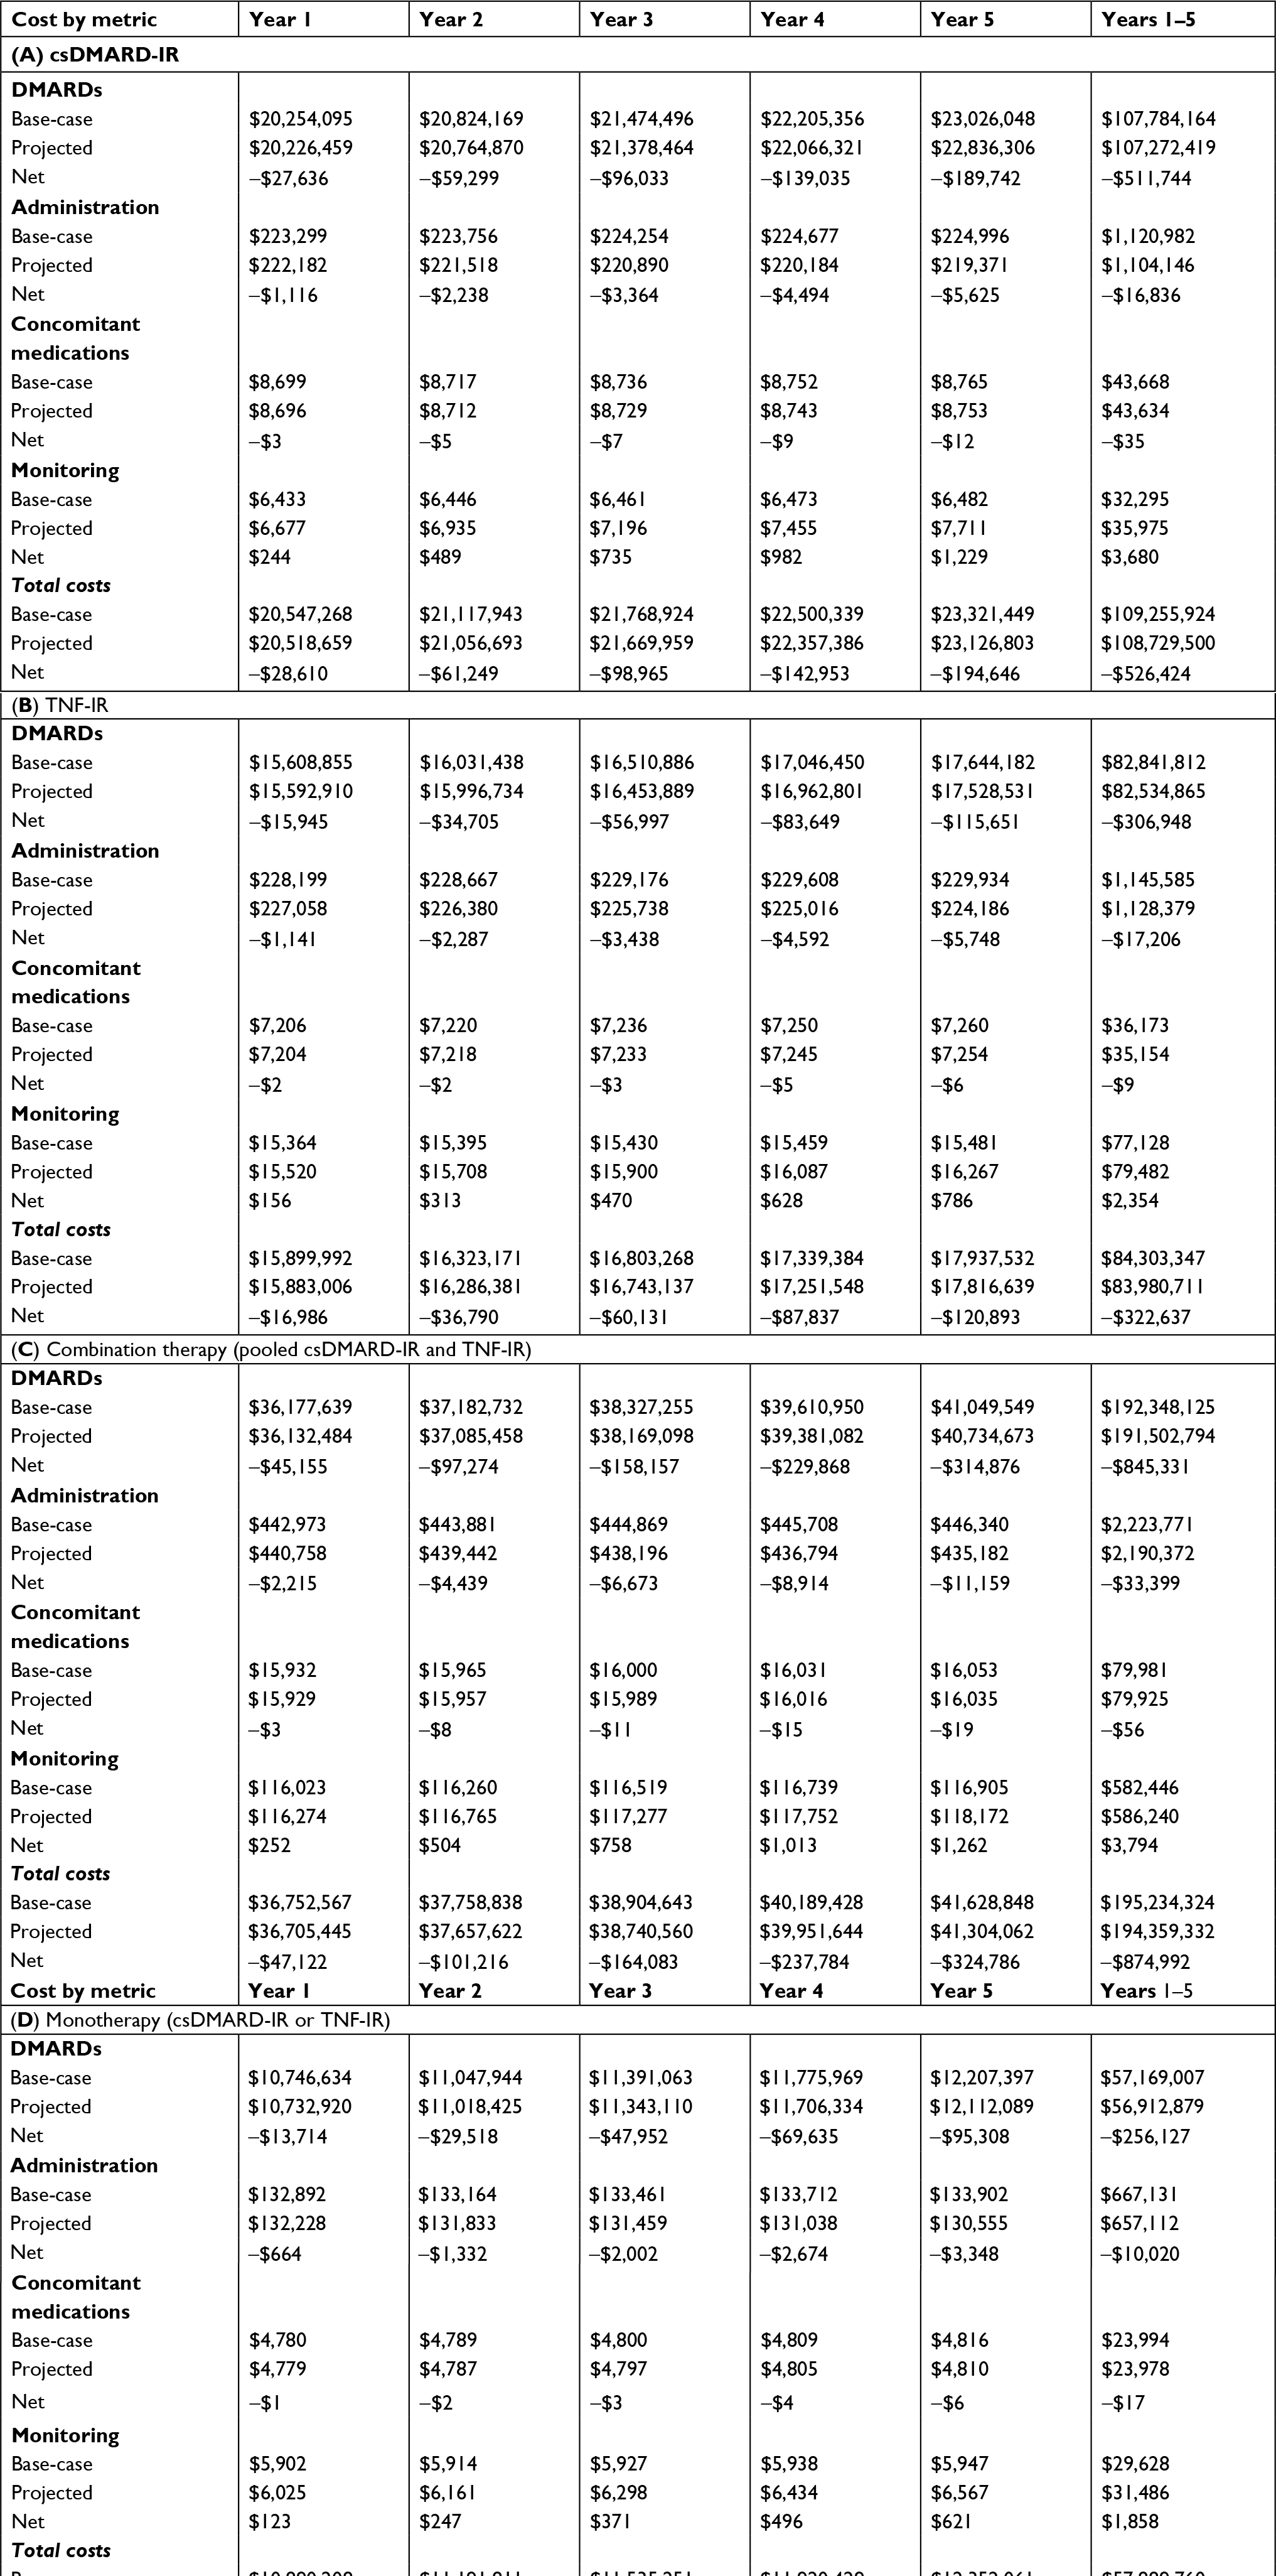 | Table S2 Budget impact by cost metric in years 1–5, in (A) csDMARD-IR, (B) TNF-IR populations, (C) combination (pooled csDMARD-IR and TNF-IR), and (D) monotherapy (csDMARD-IR or TNF-IR) Abbreviations: csDMARD, conventional synthetic disease-modifying antirheumatic drug; DMARD, disease-modifying antirheumatic drug; IR, inadequate response; TNF, tumor necrosis factor inhibitor. |
 © 2018 The Author(s). This work is published and licensed by Dove Medical Press Limited. The full terms of this license are available at https://www.dovepress.com/terms.php and incorporate the Creative Commons Attribution - Non Commercial (unported, v3.0) License.
By accessing the work you hereby accept the Terms. Non-commercial uses of the work are permitted without any further permission from Dove Medical Press Limited, provided the work is properly attributed. For permission for commercial use of this work, please see paragraphs 4.2 and 5 of our Terms.
© 2018 The Author(s). This work is published and licensed by Dove Medical Press Limited. The full terms of this license are available at https://www.dovepress.com/terms.php and incorporate the Creative Commons Attribution - Non Commercial (unported, v3.0) License.
By accessing the work you hereby accept the Terms. Non-commercial uses of the work are permitted without any further permission from Dove Medical Press Limited, provided the work is properly attributed. For permission for commercial use of this work, please see paragraphs 4.2 and 5 of our Terms.