")
Back to Journals » Neuropsychiatric Disease and Treatment » Volume 14
Brain structural networks and connectomes: the brain–obesity interface and its impact on mental health
Authors Chen VCH, Liu YC, Chao SH, McIntyre RS, Cha DS, Lee Y, Weng JC
Received 17 July 2018
Accepted for publication 23 October 2018
Published 26 November 2018 Volume 2018:14 Pages 3199—3208
DOI https://doi.org/10.2147/NDT.S180569
Checked for plagiarism Yes
Review by Single anonymous peer review
Peer reviewer comments 2
Editor who approved publication: Dr Yuping Ning
Vincent Chin-Hung Chen,1,2 Yi-Chun Liu,3 Seh-Huang Chao,4 Roger S McIntyre,5–7 Danielle S Cha,5,8 Yena Lee,5,6 Jun-Cheng Weng2,9
1School of Medicine, Chang Gung University, Taoyuan, Taiwan; 2Department of Psychiatry, Chang Gung Memorial Hospital, Chiayi, Taiwan; 3Department of Medical Imaging and Radiological Sciences, Chung Shan Medical University, Taichung, Taiwan; 4Center of Metabolic and Bariatric Surgery, Jen-Ai Hospital, Taichung, Taiwan; 5Mood Disorder Psychopharmacology Unit, University Health Network, Department of Psychiatry, University of Toronto, ON, Canada; 6Institute of Medical Science, University of Toronto, Toronto, ON, Canada; 7Departments of Psychiatry and Pharmacology, University of Toronto, Toronto, ON, Canada; 8School of Medicine, University of Queensland, Queensland, Brisbane, Australia; 9Department of Medical Imaging and Radiological Sciences, Chang Gung University, Taoyuan, Taiwan
Purpose: Obesity is a complex and multifactorial disease identified as a global epidemic. Convergent evidence indicates that obesity differentially influences patients with neuropsychiatric disorders providing a basis for hypothesizing that obesity alters brain structure and function associated with the brain’s propensity toward disturbances in mood and cognition. Herein, we characterize alterations in brain structures and networks among obese subjects (ie, body mass index [BMI] ≥30 kg/m2) when compared with non-obese controls.
Patients and methods: We obtained noninvasive diffusion tensor imaging and generalized q-sampling imaging scans of 20 obese subjects (BMI=37.9±5.2 SD) and 30 non-obese controls (BMI=22.6±3.4 SD). Graph theoretical analysis and network-based statistical analysis were performed to assess structural and functional differences between groups. We additionally assessed for correlations between diffusion indices, BMI, and anxiety and depressive symptom severity (ie, Hospital Anxiety and Depression Scale total score).
Results: The diffusion indices of the posterior limb of the internal capsule, corona radiata, and superior longitudinal fasciculus were significantly lower among obese subjects when compared with controls. Moreover, obese subjects were more likely to report anxiety and depressive symptoms. There were fewer structural network connections observed in obese subjects compared with non-obese controls. Topological measures of clustering coefficient (C), local efficiency (Elocal), global efficiency (Eglobal), and transitivity were significantly lower among obese subjects. Similarly, three sub-networks were identified to have decreased structural connectivity among frontal–temporal regions in obese subjects compared with non-obese controls.
Conclusion: We extend knowledge further by delineating structural interconnectivity alterations within and across brain regions that are adversely affected in individuals who are obese.
Keywords: obesity, diffusion tensor imaging, DTI, generalized q-sampling imaging, GQI, graph theoretical analysis, GTA, network-based statistical analysis, NBS
Introduction
Obesity is operationalized by the WHO as a body mass index (BMI) (ie, weight in kilograms/height in meter2) of 30 or greater; however, disparate BMI thresholds for obesity have been reported across global regions (eg, North America vs Asia).1,2 Obesity is a complex and multifactorial disease that represents one of the leading challenges in chronic disease prevention worldwide.3 According to the WHO, ~2.8 million people die each year due to overweight/obesity with an estimated 35.8 million global disability-adjusted life years being attributable to obesity in the absence of other medical comorbidities.4 Replicated evidence also indicates that obesity significantly increases the risk for, exacerbates the course of, and significantly reduces overall health outcomes for a multitude of chronic diseases including, but not limited to, disturbances in the metabolic milieu (eg, hypertension, dyslipidemia, and metabolic syndrome), cardiovascular disease, autoimmune diseases, and cancers (eg, breast, colon, and prostate).3,5–7 Furthermore, available data indicate that obesity differentially affects individuals with neuropsychiatric disorders, influencing illness trajectory and progression.8–11 Notwithstanding, the mediators of the association between obesity and adverse brain function are insufficiently characterized. Replicated evidence suggests that the metabolic–immunoinflammatory interface is a critical moderator of the differential effects of obesity on individuals with a neuropsychiatric illness.10–13
The hypothesis of our study was that the main cause of obesity was due to metabolic problems, which may lead to changes in nerve fibers.10–13 Obesity was thought to be associated with dopaminergic pathways that can regulate rewarding processes.14 Therefore, when dopamine receptor decreased, it will reduce the sensitivity to natural rewards. Rewarding processes play a critical role in brain processes that regulate human eating behavior and food intake. In addition to obesity, accumulation of fat in the body may also have an important effect on brain function and optimal body composition maintenance (ie, optimal body fat to muscle ratio).15 Moreover, available data suggested that overweight/obesity influences structural and functional changes in patients with neuropsychiatric disorders (eg, anxiety and depression), provides a basis for hypothesizing that overweight/obesity alters brain structure and function, increasing the brain’s propensity toward disturbances in mood and cognition.8,16–18
Obesity is increasingly being recognized as having a significant impact on both brain structure and function. For example, obesity has been evinced to produce differential activation of brain functional regions or networks among individuals with obesity when compared with non-obese controls.16 Moreover, the convergence of replicated evidence indicating that overweight/obesity influences structural and functional changes in patients with neuropsychiatric disorders (eg, anxiety and depression), provides a basis for hypothesizing that overweight/obesity alters brain structure and function, increasing the brain’s propensity toward disturbances in mood and cognition.8,16–18
Diffuse tensor imaging (DTI) was used to investigate neurological disease, such as epilepsy, Parkinson’s disease and Alzheimer’s disease.19–21 Marqués-Iturria et al used DTI to reconstruct and compare obese (n=31) and non-obese (n=32) subjects’ brain reward networks based on white matter volume and microstructure, the authors reported that obese subjects displayed a lower number of fibers and decreased integrity of connections in addition to reduced network clustering strength among the orbitofrontal cortex and striatum nuclei including the accumbens, caudate, and putamen when compared with non-obese subjects.22 In a separate study, Kullmann et al used DTI and multiparametric mapping to examine the effect of increasing BMI among lean, overweight, and obese subjects on brain white matter.23
Results indicated that white matter structures showed reduced myelin and increased water with increasing BMI in the corticospinal tract and fiber tracts linking limbic structures with prefrontal regions.23 The foregoing observations were interpreted by the authors as having the potential to accelerate cognitive decline among obese individuals, which comport with existing literature on the differential impact of obesity in individuals with neuropsychiatric disorders, representing a pathophysiological nexus sub-serving the multiplicative interaction between obesity, mood, and cognition.10,23–26
A conceptual framework for brain research that was recently proposed describes the “connectome”.27,28 The “connectome” provides novel insights to various brain functions and structural organization by modeling the complex networks of the human brain, allowing researchers to investigate the segregation and integration of information processing. The foregoing analyses are accomplished based on topology and graph theoretical analysis (GTA), which provides a quantitative method of identifying nodes, edges, and disparate topological parameters, including, but not limited to, clustering coefficient(s), characteristic path length(s), and small-worldness (ie, high levels of local clustering among nodes of a network and short paths that globally link all nodes of the network).29,30
In keeping with the “connectome” conceptual framework, we used noninvasive DTI and generalized q-sampling imaging (GQI) to identify altered brain structure(s)/networks between obese subjects and non-obese healthy controls (HC). GQI was used to overcome limitations including, but not limited to the resolution of complicated neural structures (eg, fiber crossings) and the detection of structural changes in gray matter.31–33 The correlation between diffusion indices with subjects’ BMI and Hospital Anxiety and Depression Scale (HADS) ratings were also calculated. In addition, GTA and network-based statistical (NBS) analysis were also used to identify the structural network differences between the two groups.27,34
Patients and methods
Subjects and clinical characteristics
A total of 50 subjects, including 20 obese subjects (BMI=37.9±5.2) and 30 age- and sex-matched non-obese controls (BMI=22.6±3.4) were recruited in this study. Obese subjects are recruited from patients who are going to the outpatient clinic for a stomach reduction surgery. This study was conducted in accordance with the Declaration of Helsinki, and written informed consent was obtained from all subjects. The study was approved by the Institutional Review Board of Jen-Ai Hospital, Taichung, Taiwan (IRB No 104-3465B), and all research was performed in accordance with relevant guidelines and regulations. Subjects’ baseline anxiety and/or depressive symptoms were evaluated using the HADS prior to DTI and GQI. The HADS is a 14-item scale with 7 items to assess anxiety and depressive symptoms, respectively. Each of the 14 items is scored from 0 to 3 with a maximum score of 21. Total scores above 7 indicate clinically significant anxiety and depressive symptoms; a total score exceeding 10 suggests moderate-to-severe symptoms (Table 1).
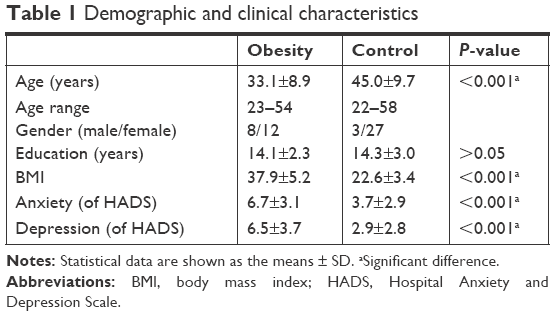 | Table 1 Demographic and clinical characteristics |
Exclusion criteria for all subjects included a history of any psychiatric or neurological illnesses (eg, schizophrenia) or substance dependence and/or use disorders, no family history of major neuropsychiatric or serious medical illnesses and not currently taking any prescription or psychotropic medications. The exclusion criteria also included those who were pregnant or breastfeeding, or those with metallic implants or other known contraindications to MRI.
MRI data acquisition
All images were acquired using a 1.5T MRI system (Ingenia, Philips, the Netherlands). Echo planar diffusion images were obtained with repetition time/echo time=3,279/110 ms, field of view=224×224 mm2, matrix=128×128, slices=40, in-plane resolution=1.75×1.75 mm2, slice thickness=3 mm, 67 non-collinear diffusion-weighting gradient direction with b=1,000 and 2,000 s/mm2 and one additional image without diffusion weighting (b=0 s/mm2). The scan time for each subject was ~20 minutes.
Diffusion image analysis
Each subject’s original diffusion image was completed with Eddy Current Correction using FSL (FMRIB Software Library, Oxford, UK). Images were then spatially normalized to the Montreal Neurological Institute T2-weighted imaging template using parameters determined from the normalization of the diffusion null image to the T2-weighted imaging template using Statistical Parametric Mapping (SPM8, Wellcome Department of Cognitive Neurology, London, UK). Images were resampled with a final voxel size of 2×2×2 mm3. DTI and GQI reconstruction were performed using DSI Studio (National Taiwan University, Taipei, Taiwan). For the DTI analysis, the fractional anisotropy (FA), mean diffusivity (MD), axial diffusivity (AD), and radial diffusivity (RD) mapping were calculated. For the GQI analysis, the generalized fractional anisotropy (GFA), isotropic value of the orientation distribution function (ISO), and normalized quantitative anisotropy (NQA) mapping were calculated. For the voxel-based statistical analysis, analysis of covariance (ANCOVA) was used to test for statistical significance. In addition, multiple regression was used to detect the correlation between the diffusion (DTI and GQI) indices and BMI as well as HADS scores for all 50 subjects. In the ANCOVA, age and sex, both of which were significantly different between groups, were used as covariates.
Graph theoretical and NBS analyses
The structural connectivity matrix of obese subjects (n=20) and non-obese HC (n=30) was obtained by DTI and GQI whole-brain tractography with FA and NQA threshold of 0.15, respectively, and max angle of 70°. The individual structural connectivity matrix (fiber number × FA or NQA/mean fiber length) of each subject with a size of 90×90 could be output followed by importation of ROIs based on the Automated Anatomical Labeling.
Graph theoretical and NBS (Melbourne Neuropsychiatry Center, The University of Melbourne and Melbourne Health, Australia) analyses were applied to investigate systematic alterations of whole-brain structural topological organization and structural connectivity between the two groups. GTA was performed on the interregional connectivity matrix by using Graph Analysis Toolbox (GAT, Stanford University School of Medicine, Stanford, CA, USA). In the ANCOVA, age and sex, both of which were significantly different between groups, were used as covariates. The topological measures of structural brain networks were calculated, including clustering coefficient (C), normalized clustering coefficient (γ), local efficiency (Elocal), characteristic path length (L), normalized characteristic path length (λ), global efficiency (Eglobal), small-worldness index (σ), assortativity, transitivity, and modularity. Both P-value <0.05 for the permutation test in GTA and the two-sample t-test in NBS were considered to indicate statistical significance. The BrainNet viewer was used to visualize significant differences in sub-networks between the two groups revealed from NBS analysis.
Results
Altered DTI indices between obese subjects and non-obese HCs
The AD value of the posterior limb of internal capsule was lower in the obese subjects compared with the non-obese HC. The RD value of the superior corona radiata was lower in the obese subjects compared with the non-obese HC. The MD values of posterior limb of internal capsule and superior longitudinal fasciculus were also lower in the obese subjects compared with the non-obese HC (Figure 1).
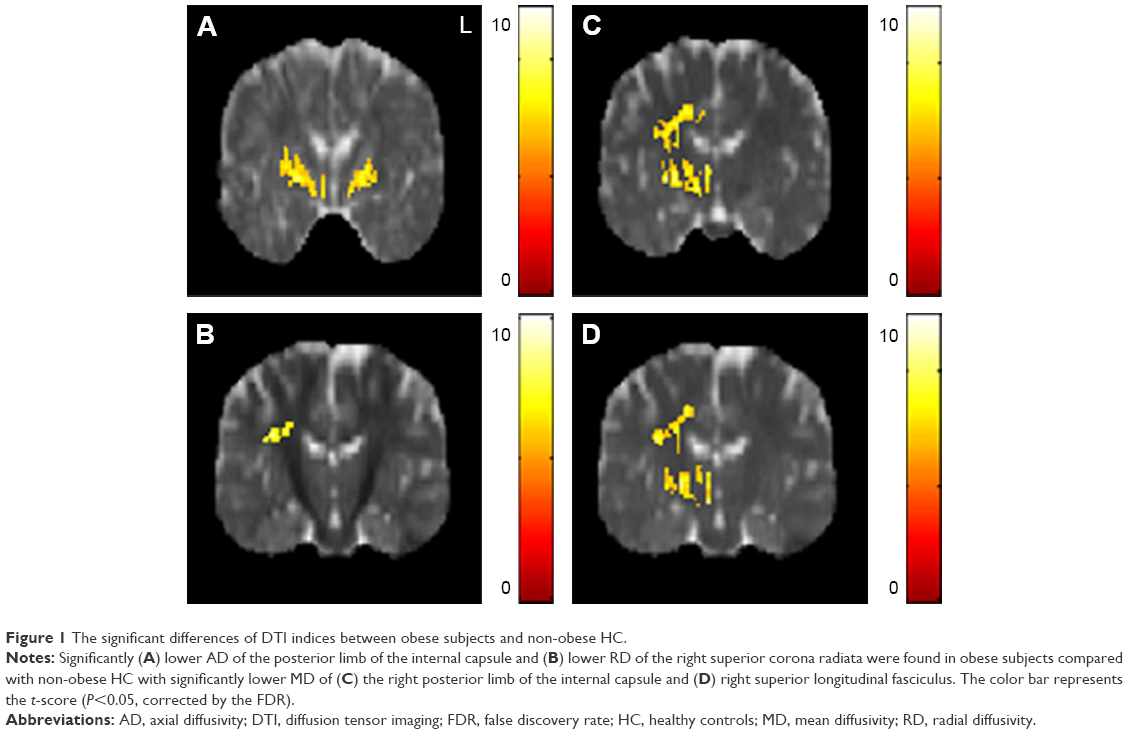 | Figure 1 The significant differences of DTI indices between obese subjects and non-obese HC. |
The correlation between DTI indices, BMI, and HADS scores
In the correlation between DTI indices, BMI, and HADS scores, a significant negative correlation between BMI and the AD value in the posterior limb of the internal capsule was observed across all subjects (N=50). A significant negative correlation was also observed between BMI and RD values in the corpus callosum (Figure 2A and B). There was no significant correlation between BMI and the FA, MD value. A significant negative correlation between anxiety scores and AD values in the corpus callosum and superior frontal blade was observed; in addition, a significant negative correlation between anxiety scores and RD value was observed in the superior frontal blade (Figure 2C–E). There was no significant correlation between anxiety scores and FA, MD value. A significant negative correlation between depression scores and AD value in the corpus callosum was also found, as was a significant negative correlation between depression scores and RD value in the sagittal stratum. A significant positive correlation between depression scores was also observed between depression scores and MD value (Figure 2F–H). There was no significant correlation between depression scores and FA value.
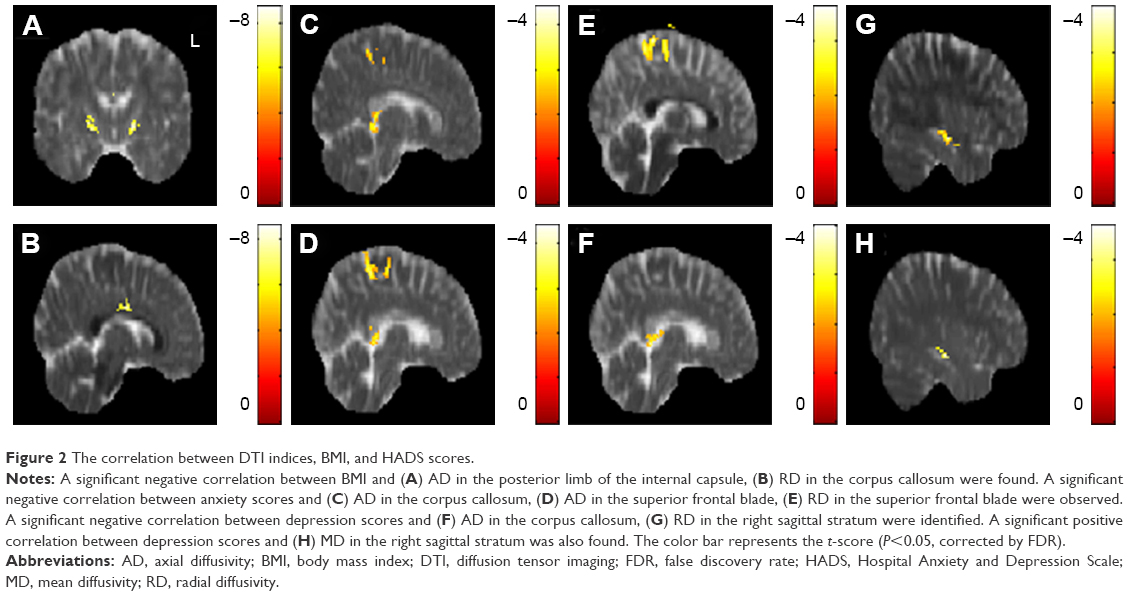 | Figure 2 The correlation between DTI indices, BMI, and HADS scores. |
Altered GQI indices between obese subjects and non-obese HCs
The GFA values of the posterior limb of the internal capsule and posterior corona radiata were significantly lower in the obese subjects compared with the non-obese HC. The NQA values of the lentiform nucleus were also significantly lower in the obese subjects compared with non-obese HC (Figure 3).
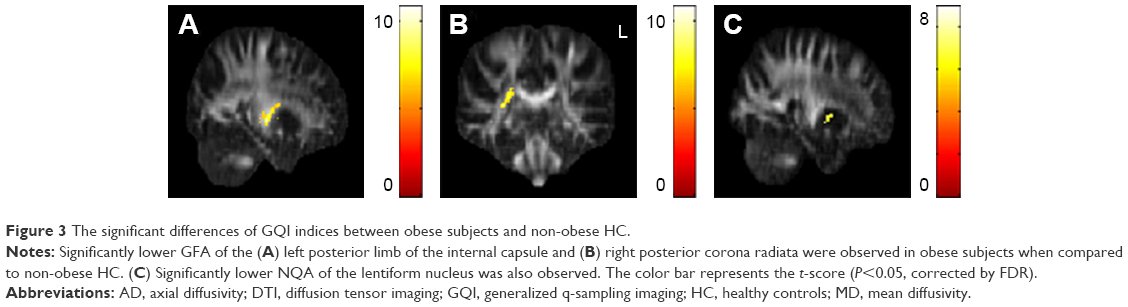 | Figure 3 The significant differences of GQI indices between obese subjects and non-obese HC. |
The correlation between the GQI indices, BMI, and HADS scores
In the correlation between the GQI indices, BMI, and HADS scores, a significant negative correlation between BMI and the GFA value in the posterior limb of the internal capsule was observed; likewise, a significant negative correlation between BMI and NQA values in the corpus callosum and superior frontal blade were observed across all subjects (N=50) (Figure 4A–C). A significant negative correlation between anxiety scores and GFA values in the posterior cingulate, lentiform nucleus, and precuneus was observed. Significant negative correlation between anxiety scores and NQA value in the superior corona radiata was also observed (Figure 4D–G). A significant negative correlation between depression scores and the GFA value in the precuneus was observed in addition to a significant negative correlation between NQA values in the posterior cingulate and lingual gyrus (Figure 4H–J). There was no significant correlation between BMI, anxiety scores, depression scores, and ISO values.
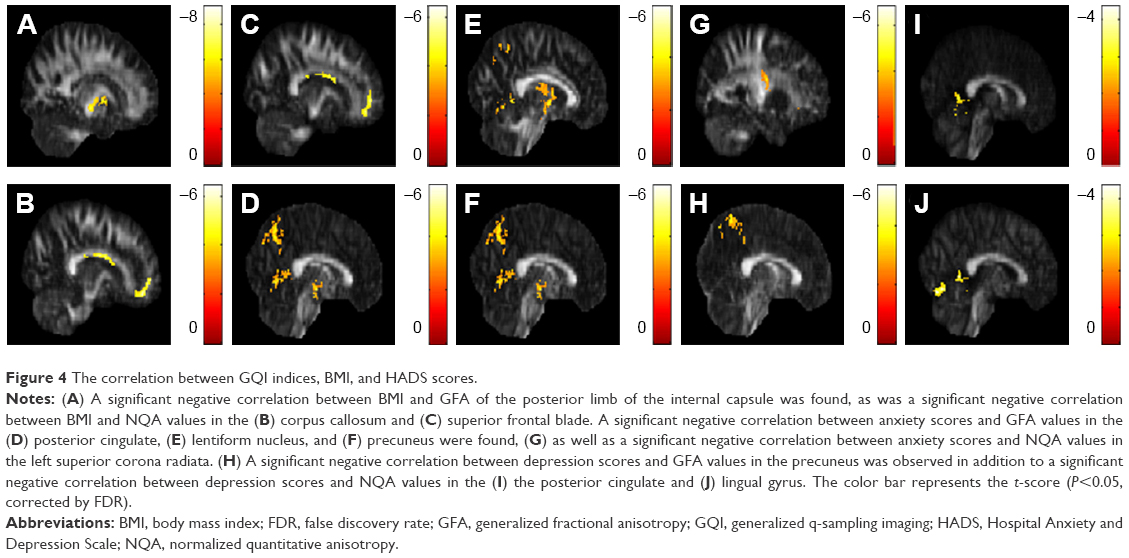 | Figure 4 The correlation between GQI indices, BMI, and HADS scores. |
Graph theoretical and NBS analyses
For the DTI analysis, there were no significant differences in any topological measures between obese subjects and non-obese HC. For the GQI analysis, there were fewer connections of structural networks found in the obese subjects compared with non-obese HC in high node degree regime (Figure 5A and B). The topological measures of C, Elocal, Eglobal, and transitivity were significantly lower in obese subjects compared with non-obese HC (Figure 5C–F), while no significant differences were observed for other topological measures between the two groups.
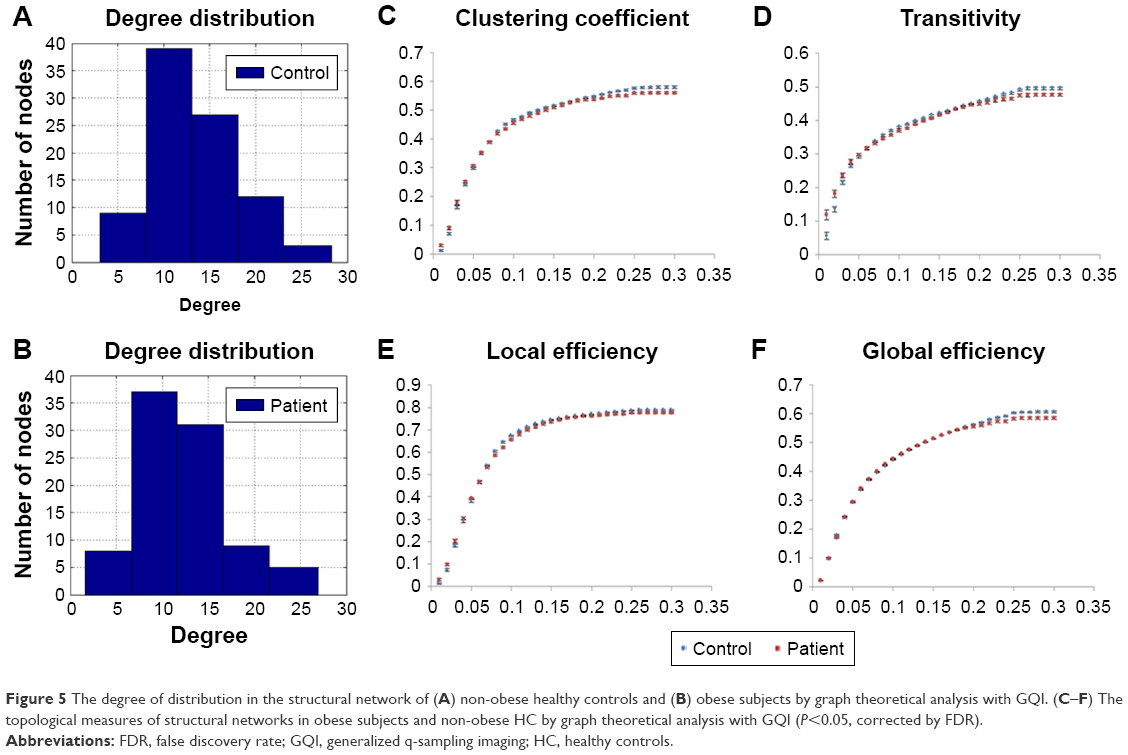 | Figure 5 The degree of distribution in the structural network of (A) non-obese healthy controls and (B) obese subjects by graph theoretical analysis with GQI. (C–F) The topological measures of structural networks in obese subjects and non-obese HC by graph theoretical analysis with GQI (P<0.05, corrected by FDR). |
Three networks were identified by the NBS (P<0.001, corrected), exhibiting decreased structural connectivity among frontal–temporal regions in obese subjects (Figure 6). The weakened connectivity within sub-networks comprised edges between the right precentral gyrus, right superior frontal gyrus, left middle frontal gyrus (including pars orbitalis), left inferior frontal gyrus (pars opercularis), right inferior frontal gyrus (pars orbitalis), right olfactory, right middle frontal gyrus (pars orbitalis), right rectus, left insula, right anterior cingulum, and left middle cingulum (Figure 6A and B); between the left superior frontal gyrus, right superior frontal gyrus (pars orbitalis), left rolandic operculum, right precuneus, left superior medial frontal gyrus, bilateral middle temporal gyrus, left inferior temporal gyrus and right middle temporal pole (Figure 6C and D); and between the right postcentral gyrus, left supramarginal gyrus, right paracentral lobule, right angular gyrus, left globus pallidum, bilateral thalamus, left superior temporal pole, left superior temporal gyrus, right inferior temporal gyrus, and left middle temporal pole (Figure 6E and F).
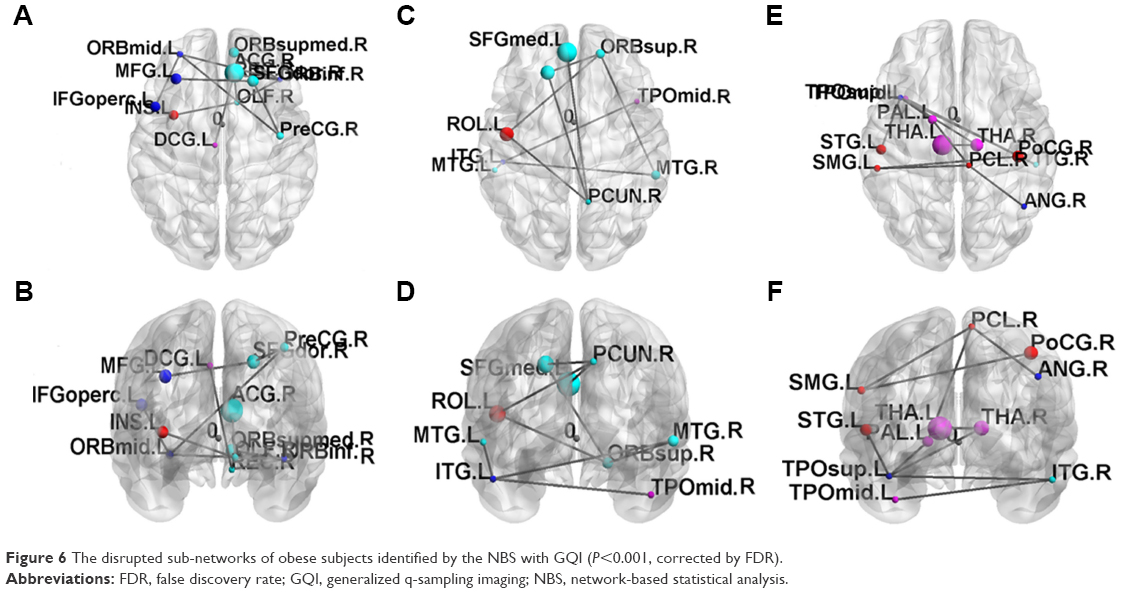 | Figure 6 The disrupted sub-networks of obese subjects identified by the NBS with GQI (P<0.001, corrected by FDR). |
Discussion
We found that the diffusion indices of the posterior limb of the internal capsule, corona radiate, superior longitudinal fasciculus, and lentiform nucleus were lower in obese subjects when compared with non-obese HC. The obese subjects were more likely to have feelings of anxiety and depression. For GTA, the lower global integration and local segregation of the structural brain networks were found in the obese subjects. In addition, three networks showed decreased structural connectivity within frontal–temporal regions in the obese subjects.
The identified brain structures are involved in neural networks associated with feeding behaviors (eg, reward, motivation, and control).35–40 The foregoing observation comports with phenomenological evidence of higher prevalence of eating disorders among obese individuals and vice versa.41,42 Obesity has been proposed to be associated with dopaminergic pathways that can regulate rewarding processes.14 Therefore, when dopamine receptor decreases, it will reduce the sensitivity to natural rewards. Reward processes play a critical role in regulating human eating behavior and food intake. For example, a previous study reported that a decrease in dopamine receptor activity results in a sharp increase in the consumption of high-fat foods.15 In addition, lower number of fibers and integrity of connections in the reward system are correlated with obesity.22 Similarly, neural networks that are highly interconnected and modulate the body shape processing (eg, frontal-temporal regions) have been found to be underactive in people with an eating disorder.43,44 Taken together, brain circuits and networks that modulate reward sensitivity, self-perception, and feeding behavior may be altered in obese individuals.
A higher incidence of anxiety and depressive disorders has been observed in populations with an eating disorder.45 Similarly, when compared with non-obese individuals, obese participants were more likely to have depressive symptoms, and the higher prevalence of obesity among populations with mood disorders.46,47 Furthermore, obesity may adversely affect treatment outcomes in patients with neuropsychiatric disorders. After evaluating the impact of weight on the treatment of patients with major depressive disorder, patients with high BMI showed a significantly slower clinical response than patients with normal BMI during antidepressant treatment.48 Therefore, we can know that obesity lead to unfavorable treatment outcome of patients with major depressive disorder.
We identified alterations in the posterior limb of the internal capsule, corona radiata, and superior longitudinal fasciculus among obese subjects when compared with controls, implicating changes in the frontal gyrus, cingulate, lentiform nucleus, and precuneus. Frontal gyrus activity has been implicated to moderate food intake avoidance.35 A separate study also reported that decreased activity in the frontal cortex bilaterally is associated with subjects reporting a loss of control over their eating behaviors.36 The cingulate cortex has been described as being involved in compensatory mechanisms, which increase the likelihood of engaging in healthier behaviors (eg, exercise) as well as being more receptive to education (eg, weight control advice).37,38 Mounting evidence suggests that the lentiform nucleus is a critical structure in the modulation of the reward circuit, wherein excess weight may negatively impact reward circuit processing.39,49
The strength of our study is that in addition to identifying altered brain structures between obese subjects and non-obese HCs, we observe structural brain network to investigate the segregation and integration of information processing. The limitation of this study is that we did not use the mini-mental state examination score to test the cognitive function of all subjects.
Conclusion
Our results indicate that the structural connectivity of the posterior limb of the internal capsule, corona radiata, superior longitudinal fasciculus, and lentiform nucleus were lower in obese subjects compared with non-obese HC. The obese subjects were more likely to have feelings of anxiety and depression. The lower global integration and local segregation of the structural brain networks were also found in the obese subjects. In addition, three networks showed decreased structural connectivity among frontal-temporal regions in the obese subjects. Our results reinforce further the observation that obesity is associated with abnormal brain structure and function. We extend knowledge further by delineating structural interconnectivity alterations within and across brain regions that are adversely affected in individuals who are obese. Translationally, the link between obesity and adverse brain outcomes have significant public health implications in light of the global obesity epidemic. Moreover, it is a testable hypothesis that treatment and prevention strategies that aim to normalize body weight may exert salutary effects on brain structure and function.
Acknowledgments
This study was supported by the research programs NSC103-2420-H-182A-001 and MOST106-2221-E-182-079, which were sponsored by the Ministry of Science and Technology, Taipei, Taiwan. The authors appreciate the full support from the Department of Radiology, Jen-Ai Hospital, Taichung, Taiwan, and the Health Information and Epidemiology Laboratory (CLRPG6G0041), Chang Gung Memorial Hospital, Chiayi, Taiwan. The authors would like to thank Hsiang-Ya Huang and I Ieng Chao for their assistance in experimental preparation.
Author contributions
VCHC: project idea, study design, manuscript revision; YCL: data analysis, writing article; SHC: data collection; RSM: manuscript revision; DSC: manuscript revision; YL: manuscript revision; JCW: project idea, study design, software development, data analysis, writing article, manuscript revision. All authors contributed to data analysis, drafting and revising the article, gave final approval of the version to be published, and agree to be accountable for all aspects of the work.
Disclosure
The authors report no conflicts of interest in this work.
References
WHO Expert Consultation. Appropriate body-mass index for Asian populations and its implications for policy and intervention strategies. Lancet. 2004;363(9403):157–163. | ||
WHO. Obesity and overweight; 2017. Available from: http://www.who.int/news-room/fact-sheets/detail/obesity-and-overweight. Accessed November 6, 2018. | ||
Hruby A, Hu FB. The epidemiology of obesity: a big picture. Pharmacoeconomics. 2015;33(7):673–689. | ||
WHO. Obesity: Situation and trends. Available from: http://www.who.int/gho/ncd/risk_factors/overweight/en/. Accessed November 6, 2018. | ||
Slyepchenko A, Maes M, Jacka FN, et al. Gut microbiota, bacterial translocation, and interactions with diet: pathophysiological links between major depressive disorder and non-communicable medical comorbidities. Psychother Psychosom. 2017;86(1):31–46. | ||
Woo YS, McIntyre RS, Kim JB, et al. Association of treatment response with obesity and other metabolic risk factors in adults with depressive disorders: Results from a National Depression Cohort study in Korea (the CRESCEND study). J Affect Disord. 2016;203:190–198. | ||
Mansur RB, Brietzke E, McIntyre RS. Is there a “metabolic-mood syndrome”? A review of the relationship between obesity and mood disorders. Neurosci Biobehav Rev. 2015;52:89–104. | ||
Mansur RB, Brietzke E, McIntyre RS, et al. BDNF and BMI effects on brain structures of bipolar offspring: results from the global mood and brain science initiative. Acta Psychiatr Scand. 2017;136(6):607–614. | ||
Leclerc E, Mansur RB, Grassi-Oliveira R, et al. The differential association between history of childhood sexual abuse and body mass index in early and late stages of bipolar disorder. J Affect Disord. 2018;227:214–218. | ||
Mansur RB, McIntyre RS, Cao B, et al. Obesity and frontal-striatal brain structures in offspring of individuals with bipolar disorder: Results from the global mood and brain science initiative. Bipolar Disord. 2018;20(1):42–48. | ||
Lee JH, Park SK, Ryoo JH, et al. U-shaped relationship between depression and body mass index in the Korean adults. Eur Psychiatry. 2017;45:72–80. | ||
Cizza G, Rother KI. Beyond fast food and slow motion: weighty contributors to the obesity epidemic. J Endocrinol Invest. 2012;35(2):236–242. | ||
Scarpina F, Migliorati D, Marzullo P, Mauro A, Scacchi M, Costantini M. Altered multisensory temporal integration in obesity. Sci Rep. 2016;6:28382. | ||
Volkow ND, Wang GJ, Baler RD. Reward, dopamine and the control of food intake: implications for obesity. Trends Cogn Sci. 2011;15(1):37–46. | ||
Krishna S, Keralapurath MM, Lin Z, et al. Neurochemical and electrophysiological deficits in the ventral hippocampus and selective behavioral alterations caused by high-fat diet in female C57BL/6 mice. Neuroscience. 2015;297:170–181. | ||
Chao SH, Liao YT, Chen VC, et al. Correlation between brain circuit segregation and obesity. Behav Brain Res. 2018;337:218–227. | ||
Thiara G, Cigliobianco M, Muravsky A, et al. Evidence for neurocognitive improvement after bariatric surgery: A systematic review. Psychosomatics. 2017;58(3):217–227. | ||
Jantaratnotai N, Mosikanon K, Lee Y, McIntyre RS. The interface of depression and obesity. Obes Res Clin Pract. 2017;11(1):1–10. | ||
Chandra A, Dervenoulas G, Politis M; Alzheimer’s Disease Neuroimaging Initiative. Magnetic resonance imaging in Alzheimer’s disease and mild cognitive impairment. J Neurol. Epub 2018 Aug 17. | ||
Xu SW, Xi JH, Lin C, et al. Cognitive decline and white matter changes in mesial temporal lobe epilepsy. Medicine (Baltimore). 2018;97(33):e11803. | ||
Guimarães RP, Campos BM, de Rezende TJ, et al. Is diffusion tensor imaging a good biomarker for early parkinson’s disease? Front Neurol. 2018;9:626. | ||
Marqués-Iturria I, Scholtens LH, Garolera M, et al. Affected connectivity organization of the reward system structure in obesity. Neuroimage. 2015;111:100–106. | ||
Kullmann S, Callaghan MF, Heni M, et al. Specific white matter tissue microstructure changes associated with obesity. Neuroimage. 2016;125:36–44. | ||
Mora E, Portella MJ, Martinez-Alonso M, et al. The impact of obesity on cognitive functioning in euthymic bipolar patients: a cross-sectional and longitudinal study. J Clin Psychiatry. 2017;78(8):e924–e932. | ||
Lackner N, Bengesser SA, Birner A, et al. Abdominal obesity is associated with impaired cognitive function in euthymic bipolar individuals. World J Biol Psychiatry. 2016;17(7):535–546. | ||
Yim CY, Soczynska JK, Kennedy SH, Woldeyohannes HO, Brietzke E, McIntyre RS. The effect of overweight/obesity on cognitive function in euthymic individuals with bipolar disorder. Eur Psychiatry. 2012;27(3):223–228. | ||
Bullmore ET, Bassett DS. Brain graphs: graphical models of the human brain connectome. Annu Rev Clin Psychol. 2011;7:113–140. | ||
Chen VC, Shen CY, Liang SH, et al. Assessment of abnormal brain structures and networks in major depressive disorder using morphometric and connectome analyses. J Affect Disord. 2016;205:103–111. | ||
Bullmore E, Sporns O. Complex brain networks: graph theoretical analysis of structural and functional systems. Nat Rev Neurosci. 2009;10(3):186–198. | ||
Hosseini SM, Hoeft F, Kesler SR. GAT: a graph-theoretical analysis toolbox for analyzing between-group differences in large-scale structural and functional brain networks. PLoS One. 2012;7(7):e40709. | ||
Tyan YS, Liao JR, Shen CY, Lin YC, Weng JC. Gender differences in the structural connectome of the teenage brain revealed by generalized q-sampling MRI. Neuroimage Clin. 2017;15:376–382. | ||
Weng JC, Kao TW, Huang GJ, Tyan YS, Tseng HC, Ho MC. Evaluation of structural connectivity changes in betel-quid chewers using generalized q-sampling MRI. Psychopharmacology (Berl). 2017;234(13):1945–1955. | ||
Yeh FC, Wedeen VJ, Tseng WY, Imaging Gq-Sampling. Generalized q-sampling imaging. IEEE Trans Med Imaging. 2010;29(9):1626–1635. | ||
Zalesky A, Fornito A, Bullmore ET. Network-based statistic: identifying differences in brain networks. Neuroimage. 2010;53(4):1197–1207. | ||
Brooks SJ, O’Daly OG, Uher R, et al. Differential neural responses to food images in women with bulimia versus anorexia nervosa. PLoS One. 2011;6(7):e22259. | ||
Marsh R, Stefan M, Bansal R, Hao X, Walsh BT, Peterson BS. Anatomical characteristics of the cerebral surface in bulimia nervosa. Biol Psychiatry. 2015;77(7):616–623. | ||
Kerns JG, Cohen JD, MacDonald AW 3rd, Cho RY, Stenger VA, Carter CS. Anterior cingulate conflict monitoring and adjustments in control. Science. 2004;303(5660):1023–1026. | ||
King NA, Caudwell P, Hopkins M, et al. Metabolic and behavioral compensatory responses to exercise interventions: barriers to weight loss. Obesity (Silver Spring). 2007;15(6):1373–1383. | ||
Volkow ND, Wang GJ, Tomasi D, Baler RD. Obesity and addiction: neurobiological overlaps. Obes Rev. 2013;14(1):2–18. | ||
Devoto F, Zapparoli L, Bonandrini R, et al. Hungry brains: a meta-analytical review of brain activation imaging studies on food perception and appetite in obese individuals. Neurosci Biobehav Rev. 2018;94:271–285. | ||
Hauck C, Weiβ A, Schulte EM, Meule A, Ellrott T. Prevalence of ‘food addiction’ as measured with the yale food addiction scale 2.0 in a representative german sample and its association with sex, age and weight categories. Obes Facts. 2017;10(1):12–24. | ||
Eladawi N, Helal R, Niazy NA, Abdelsalam S. Prevalence and associated factors of eating disorders in weight management centers in Tanta, Egypt. Chin Med J (Engl). 2018;131(1):50–55. | ||
Uher R, Murphy T, Friederich HC, et al. Functional neuroanatomy of body shape perception in healthy and eating-disordered women. Biol Psychiatry. 2005;58(12):990–997. | ||
Volpe U, Galderisi S, Mucci A, et al. P02-145 – Perception of body shape in bulimia nervosa: An ERP study. Eur Psychiatry. 2011;26:741. | ||
Rowe R, Pickles A, Simonoff E, Bulik CM, Silberg JL. Bulimic symptoms in the Virginia Twin Study of adolescent behavioral development: correlates, comorbidity, and genetics. Biol Psychiatry. 2002;51(2):172–182. | ||
Xiang X, An R. Obesity and onset of depression among U.S. middle-aged and older adults. J Psychosom Res. 2015;78(3):242–248. | ||
Martin-Rodriguez E, Guillen-Grima F, Aubá E, Martí A, Brugos-Larumbe A. Relationship between body mass index and depression in women: a 7-year prospective cohort study. The APNA study. Eur Psychiatry. 2016;32:55–60. | ||
Kloiber S, Ising M, Reppermund S, et al. Overweight and obesity affect treatment response in major depression. Biol Psychiatry. 2007;62(4):321–326. | ||
Taki Y, Kinomura S, Sato K, et al. Relationship between body mass index and gray matter volume in 1,428 healthy individuals. Obesity (Silver Spring). 2008;16(1):119–124. |
 © 2018 The Author(s). This work is published and licensed by Dove Medical Press Limited. The full terms of this license are available at https://www.dovepress.com/terms.php and incorporate the Creative Commons Attribution - Non Commercial (unported, v3.0) License.
By accessing the work you hereby accept the Terms. Non-commercial uses of the work are permitted without any further permission from Dove Medical Press Limited, provided the work is properly attributed. For permission for commercial use of this work, please see paragraphs 4.2 and 5 of our Terms.
© 2018 The Author(s). This work is published and licensed by Dove Medical Press Limited. The full terms of this license are available at https://www.dovepress.com/terms.php and incorporate the Creative Commons Attribution - Non Commercial (unported, v3.0) License.
By accessing the work you hereby accept the Terms. Non-commercial uses of the work are permitted without any further permission from Dove Medical Press Limited, provided the work is properly attributed. For permission for commercial use of this work, please see paragraphs 4.2 and 5 of our Terms.