")
Back to Journals » International Journal of Women's Health » Volume 8
Bone strength and management of postmenopausal fracture risk with antiresorptive therapies: considerations for women’s health practice
Authors Cheung A, Frame H, Ho M, Mackinnon E, Brown J, Elsaid S
Received 12 May 2016
Accepted for publication 14 July 2016
Published 28 September 2016 Volume 2016:8 Pages 537—547
DOI https://doi.org/10.2147/IJWH.S112621
Checked for plagiarism Yes
Review by Single anonymous peer review
Peer reviewer comments 2
Editor who approved publication: Professor Elie Al-Chaer
Angela M Cheung,1–3 Heather Frame,4 Michael Ho,5 Erin S Mackinnon,6 Jacques P Brown7
1Department of Medicine, University of Toronto, 2Centre of Excellence in Skeletal Health Assessment, Joint Department of Medical Imaging, University Health Network (UHN), 3Mount Sinai Hospital, University of Toronto, Toronto, ON, 4Assiniboine Clinic, Winnipeg, MB, 5University Health Network, Toronto, 6Amgen Canada, Inc, Mississauga, ON, 7Rheumatology Division, CHU de Québec Research Centre, Laval University, Quebec City, QC, Canada
Abstract: Bone strength – and, hence, fracture risk – reflects the structural and material properties of the skeleton, which changes with bone turnover during aging and following effective pharmacotherapy. A variety of powerful new techniques (quantitative computed tomography, as well as peripheral quantitative computed tomography and high-resolution peripheral quantitative computed tomography) provide precise images of bone structure and can be used to model the response of specific bones to different types of mechanical load. This review explores the various components of bone strength and the clinical significance of measures, such as bone mineral density, bone turnover markers, and modern imaging data, with regard to fracture risk in women with postmenopausal osteoporosis, before and after initiating antiresorptive therapy. These imaging and related techniques offer an ever-clearer picture of the changes in bone structure and bone mineral metabolism during normal aging and in osteoporosis, as well as in response to treatment. However, because the newer techniques are not yet available in routine practice, validated tools for absolute fracture risk assessment remain essential for clinical decision making. These tools, which are tailored to patient risk data in individual countries, are based on bone mineral density and other readily available clinical data. In addition, bone turnover marker measurements can be useful in assessing risk and guiding treatment decisions for women with postmenopausal osteoporosis. Such tests may be used before starting a patient on antiresorptive therapy and for ongoing monitoring of treatment effectiveness.
Keywords: bone strength, antiresorptive, postmenopausal osteoporosis, bisphosphonate, denosumab, fracture risk
Introduction
The human skeleton is well designed to resist physical insults, but bone, like other materials, will break under a sufficiently great load. Bone strength is therefore defined as resistance to fracture, and fracture provides the most clinically meaningful indicator of bone strength in primary care. Fragility fractures – those that occur with minimal trauma, such as in falls from standing height – clearly demonstrate decreased bone strength. Indeed, a history of fragility fractures in peri- and postmenopausal women is strongly associated with a risk of future fractures.1
What is bone strength?
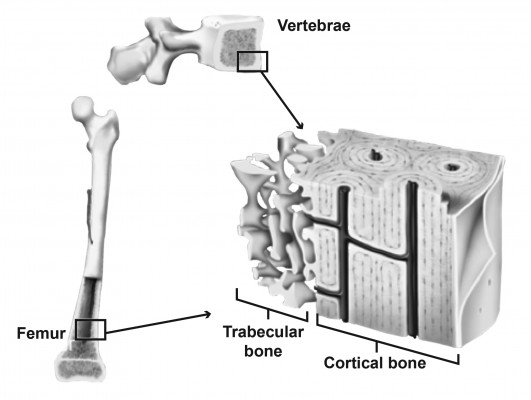
Bones are hard because they consist of hydroxyapatite crystals, set in a matrix of collagen and other connective tissue. They owe their strength not just to their composition (bone mineral density [BMD]), but also to their structure – their overall size and shape, along with their microarchitecture.2 Viewed up close, every bone has a complex microarchitecture, with pores and channels running through the apparently solid cortex (Figure 1). Inside the cortex is the medullary cavity, where bone tissue is not solid, but spongy in appearance, consisting of an extensive cross-linked meshwork of projections (trabeculae).
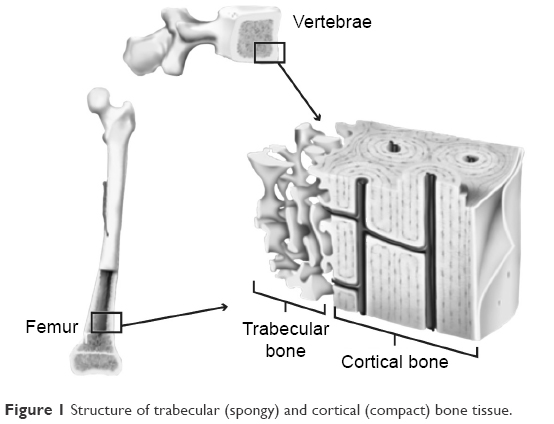 | Figure 1 Structure of trabecular (spongy) and cortical (compact) bone tissue. |
The distribution of trabecular and cortical tissue varies across anatomical sites, with the vertebrae containing >75% trabecular bone and long bones, such as the femur, containing >75% cortical bone.3 At the microarchitectural level, features also differ. Trabecular tissue varies with regard to the number of trabeculae, as well as their length, thickness, and degree of cross-linking. Cortical bone is of variable thickness and porosity (the number and size of pores). Both trabecular and cortical bone may also show microcracks as a result of mechanical loading.
These features, which greatly influence the overall mechanical strength of the bone, are all in a state of flux: bone is constantly being turned over and replaced by resident osteoclasts and osteoblasts.2,4 Because loss of bone strength leads to increased risk of fracture, antiresorptive agents and other interventions that reduce bone turnover can improve bone strength and reduce fracture risk in women with postmenopausal osteoporosis (PMO).5,6
Patterns of age-related bone loss
Women commonly experience some degree of bone loss as they age, particularly as their estrogen levels decline during and after menopause.7 Along with this loss of BMD, bone microarchitecture changes in several ways, including: loss and thinning of trabeculae, which reduce cross-linking between neighboring trabeculae; expansion of the medullary cavity (cortical thinning) as the inner endosteal surface is eroded by an imbalance in bone turnover;8 and increased porosity within the cortex itself.9 Each of these changes will ultimately lead to loss of bone strength and increased fracture risk.
The timing of increased fracture risk varies among different women, reflecting both the peak bone mass they reached in their youth and the rate at which they lose BMD during the years around menopause.10 In addition, the relative timing of mineral loss from the cortical and trabecular compartments can vary among different bones, due to differences in bone architecture and load.11
In general, trabecular bone loss occurs first, largely affecting the spine and resulting in compression fractures. Although often unnoticed clinically, these fractures can lead to height loss.12 Trabecular bone loss begins by age 40, when women still produce substantial levels of estrogen; approximately a third of a woman’s lifetime loss of trabecular bone occurs in the decades before menopause. Trabecular bone loss accelerates with estrogen deficiency for the first 4–8 years of menopause, after which it continues at a lower rate.13
Because the vertebrae contain a large proportion of trabecular bone, it is expected that vertebral fracture risk begins to rise relatively early in life, as trabecular BMD declines.14 However, the large majority (80%) of osteoporotic fractures are nonvertebral, occurring in bones, such as the wrist and the hip, where cortical thickness is a key predictor of bone strength and stiffness.15 In Canada and the US, the majority of these nonvertebral fractures occur in the wrist.16,17
As postmenopausal women age, BMD loss moves from trabecular bone to the inner cortex, where loss of mechanical strength appears to drive the growing risk of nonvertebral fractures.14,18,19 Changes in the cortex occur by cortical thinning and increased cortical porosity – that is, erosion of the bone tissue on the inner (endosteal) surface and also within the cortical compartment. Endosteal resorption produces porous structures resembling trabeculae.7,18 This process is observed in the earlier years of menopause and accelerates after age 65,18 and continues at a lower rate even into extreme old age.18,20 Likewise, cortical porosity appears to increase in a woman during her 40s to 50s in different bones and continues indefinitely (Figure 2A).9,19 Cortical bone loss is strongly related to estrogen deficiency7 and accelerates after menopause,18 playing a major role in nonvertebral fractures later in a woman’s life.
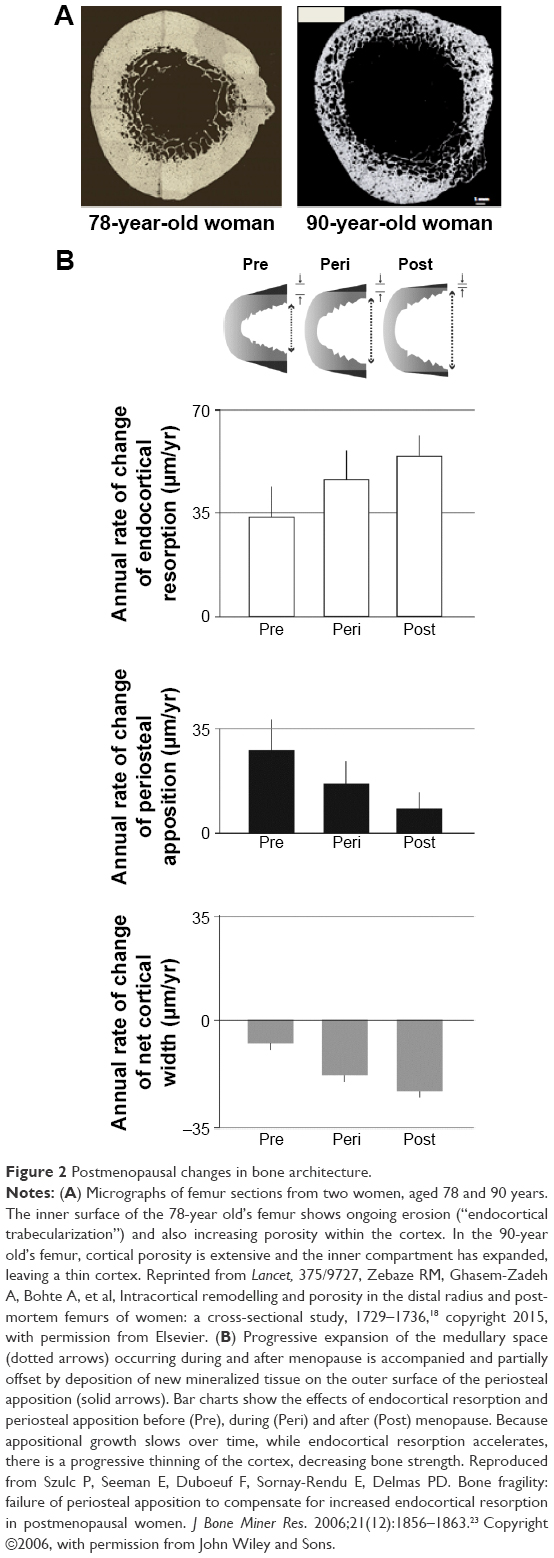 | Figure 2 Postmenopausal changes in bone architecture. |
Aging is also associated with an adaptative expansion of the outer diameter of bones (periosteal apposition),20–22 which occurs throughout adult life. As a result of appositional growth on the outer (periosteal) surface, along with erosion on the inner (endosteal) surface, the cortex is gradually displaced outward. At the same time, the cortex thins, because periosteal growth does not keep up with endosteal resorption (Figure 2B). Following menopause, cortical loss accelerates and periosteal appositional growth declines. In long bones, these changes lead to substantial loss of bending strength.13,23
Measures of bone strength
Bone strength assessment in clinical practice generally relies on standard radiological (eg, dual-energy X-ray absorptiometry [DXA]) and laboratory tests (eg, serum bone turnover markers [BTMs]). Validated prognostic tools incorporate patient history and clinical observations, along with DXA findings, to estimate an individual’s absolute risk of fracture over the following 10 years (eg, the Canadian Association of Radiologists and Osteoporosis Canada Tool [CAROC] and the WHO Fracture Risk Assessment Tool [FRAX]). However, some newer mechanical modeling approaches that use high-resolution imaging data have had impressive success predicting whether and how a bone will fracture in a fall. Insights from these studies are important for primary care and fracture prevention, because they confirm that available treatments improve bone strength and reduce fracture risk by reversing some of the microarchitectural changes associated with aging bone.
Here, we discuss a variety of tools and measurements used to assess bone strength and fracture risk. We consider how these tools demonstrate different components of bone strength and the effects of pharmacotherapy on fracture risk in women with PMO.
Measuring bone strength: tools of the trade and what they tell us
Clinical measures of bone strength provide clues to a patient’s risk of suffering a fracture. As shown in Table 1, not all of these tools are widely used in clinical practice. However, all offer insights into the loss of BMD with aging, as well as the material and structural changes to the bone that occur during effective pharmacotherapy.
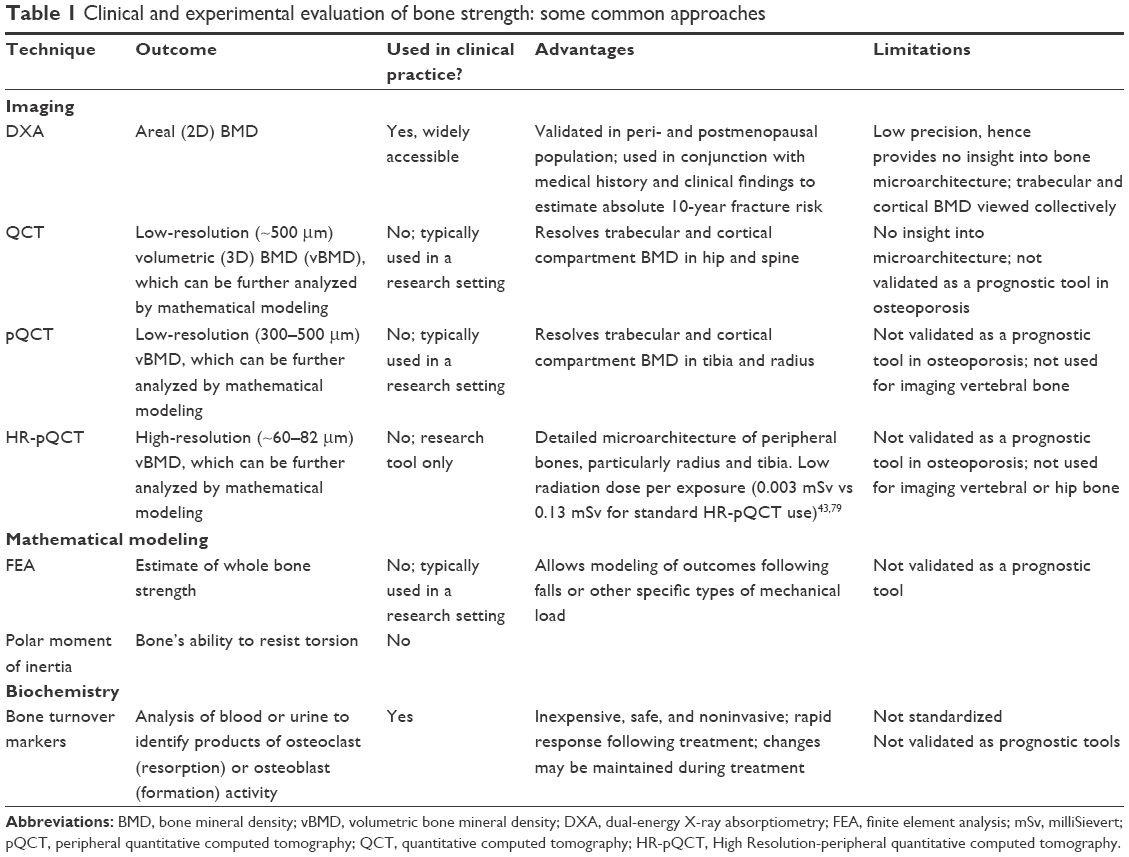 | Table 1 Clinical and experimental evaluation of bone strength: some common approaches |
DXA
DXA is used to assess the “areal” BMD, meaning the mass of bone mineral per unit area when this mass is projected onto a 2D surface, as in an X-ray image. By definition, a reduction in BMD indicates the extent of mineral loss from the bone, but it measures the mineral mass of cortical and trabecular bone collectively and does not identify the compartment where mineral is lost.
Uses and limitations of DXA
While DXA correlates with incident fracture rate, in the postmenopausal years 60% of nonvertebral fractures occur in women who have nonosteoporotic BMD,24 highlighting a limitation of using this measure on its own as an indicator of fracture risk.2 DXA scans can also be used to calculate a Trabecular Bone Score (TBS). This approach, which uses grayscale variations in the scanning data to quantify trabecular bone density, is broadly predictive of incident fractures in postmenopausal women. In some at-risk populations, such as individuals with diabetes or primary hyperparathyroidism or those receiving long-term glucocorticoid therapy, it has been suggested that the TBS can improve fracture prediction, relative to DXA alone. Conversely, in postmenopausal women, TBS so far has not proved superior to standard DXA measurements of the hip (reviewed in Bousson et al25).
For practical purposes, estimates of 10-year absolute fracture risk (AFR) overcome some of the limitations of DXA by incorporating other patient data, including age, medical history, and prior fracture.26,27 Comorbidities that affect bone strength without necessarily changing BMD in a predictable way, such as glucocorticoid-induced osteoporosis,28,29 are included in these AFR tools. Canadian guidelines recommend AFR estimated by the Canadian FRAX30 or CAROC tools (which are ~90% concordant) be used in preference to DXA alone to identify patients who will most benefit from pharmacotherapy.26,31 Recent updates of the FRAX tool for some jurisdictions now allow the user to include the TBS, if available, as a component of AFR evaluation.32
Use of BMD in treatment monitoring
At the population level, antiresorptive treatment clearly reduces vertebral and nonvertebral fracture risk in PMO.5,6 To monitor the effectiveness of therapy, DXA scans are usually repeated every 1–3 years, with a decrease in testing once the patient appears to have responded.26,31
In clinical practice, maintenance or increase in BMD is traditionally taken as evidence of decreased fracture risk in patients treated with antiresorptives, such as oral bisphosphonates. However, the optimal frequency of testing and the most useful target BMD have not been established.33–35 Moreover, it is common in many areas to restrict follow-up DXA to a single scan unless the patient’s risk factors for fracture change.
Ongoing DXA monitoring would be justified by clear evidence showing that BMD predicts incident fracture in women on therapy, as it does in treatment-naïve women. Indeed, one study of women on antiresorptives showed that a DXA T-score that remains in the osteoporotic range (≤−2.5) predicts continued high risk of incident fracture.36 In addition, prospective, placebo-controlled trials using potent antiresorptive agents have shown good correlations between BMD change and incident fracture rate.5,6
The clearest evidence of such link in women with PMO comes from a study of denosumab, an inhibitor of the receptor activator of nuclear factor kappa B ligand, which is essential for the formation, function, and survival of osteoclasts. Austin et al reported strong correlations between changes in total hip BMD and the incidences of vertebral and nonvertebral fracture over 3 years.37 As shown in Figure 3, total hip BMD increased in most subjects on denosumab, while declining or remaining unchanged in most placebo-treated subjects. For every 1% increase in total hip BMD, there was a 3% decrease in nonvertebral fractures (Figure 3A) and a 4.9% decrease in new vertebral fractures (Figure 3B). This relationship between the increase in total hip BMD and reduced fractures persists out to 6 years of treatment.38
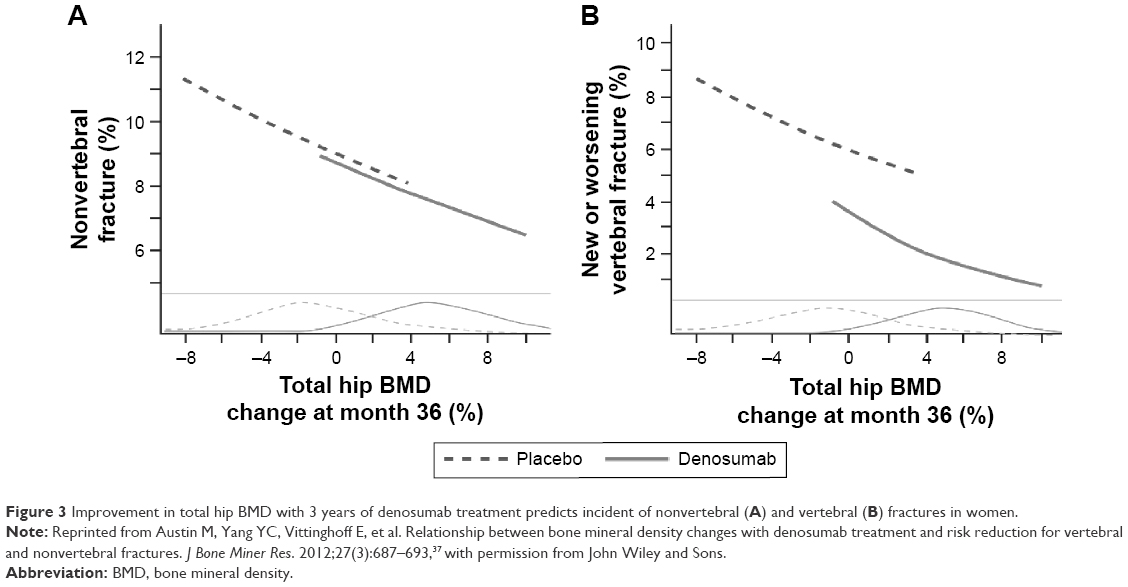 | Figure 3 Improvement in total hip BMD with 3 years of denosumab treatment predicts incident of nonvertebral (A) and vertebral (B) fractures in women. |
Another study, which followed women on zoledronic acid in a prospective manner over 3 years, found a similar relationship between change in BMD and fracture risk.39 Based on these two studies, it appears that BMD increase can serve as a surrogate for improved bone strength in the treatment setting, at least in patients receiving relatively potent antiresorptive drugs. Thus, ongoing monitoring with DXA may provide helpful guidance in deciding whether to maintain or switch therapy.
QCT, pQCT, and HR-pQCT
Quantitative computed tomography (QCT) and related techniques use X-ray tomography to generate an average BMD for a whole bone or a specified volume within the bone.40,41 This volumetric BMD measurement differs from the standard (areal) BMD reported by DXA scanning, because it calculates the mass of mineral within a volume of the bone tissue, rather than a 2D projection of the bone.
Structural changes affecting bone strength can be seen using each of these imaging technologies.40,42–44 QCT and peripheral QCT (pQCT) can show internal bone structure with a resolution of 300–500 μm.40,41 These techniques separate a bone’s trabecular and cortical compartments, allowing the average BMD to be determined separately for each compartment. With high-resolution pQCT (HR-pQCT), the resolution is generally ~60–82 μm.45,46 Thus, while pQCT is generally not able to resolve internal structures within the compartments,47 HR-pQCT shows this structure with considerable detail.48 Using HR-pQCT, researchers can observe and quantify specific microarchitecture changes, such as thinning of the bone cortex and the specific location (eg, the inner cortex), an increase in the size or number of cortical pores, or the loss of trabecular cross-links.43
Uses and limitations of QCT, pQCT, and HR-pQCT
As shown in Figure 4, different classes of bone mineral loss (endosteal cortical thinning, increased cortical porosity, and loss of trabeculae) may have essentially identical effects on BMD but different effects on bone strength.40,49,50 Using HR-pQCT imaging, it is possible to improve estimates of fracture risk, particularly in women who are not in the “osteoporotic” range by DXA but have low BMD (T-scores between −1 and −2.5).51
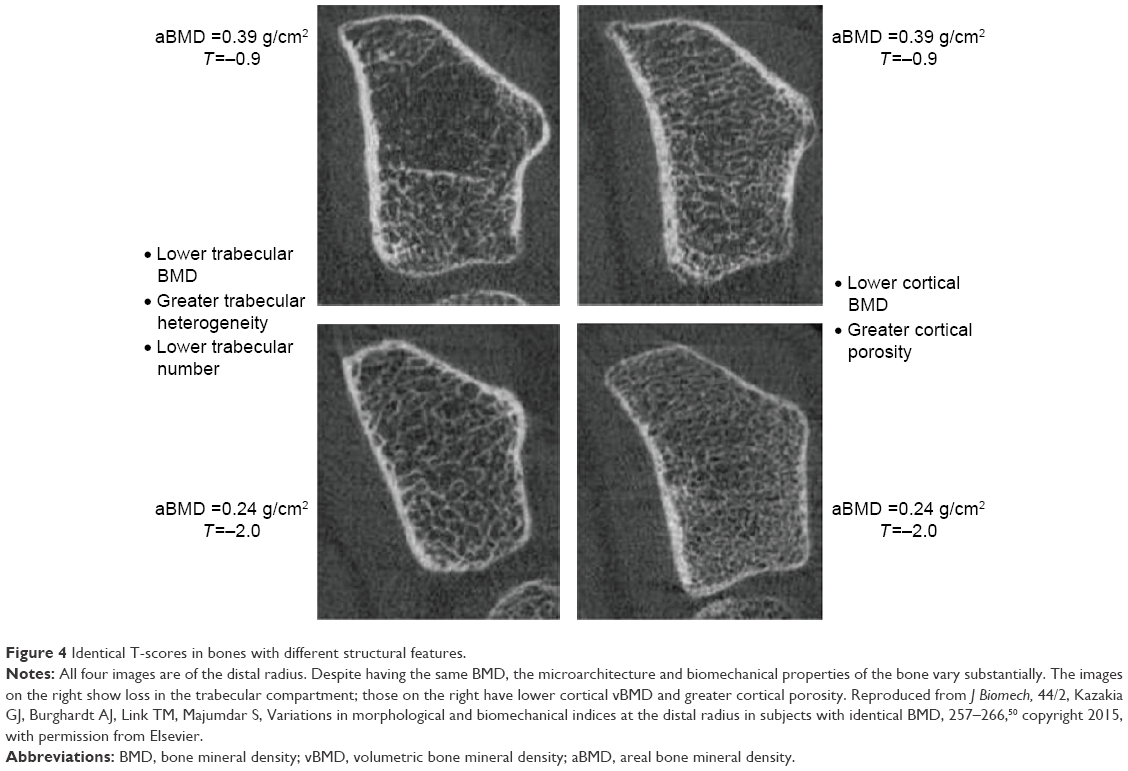 | Figure 4 Identical T-scores in bones with different structural features. |
Complementing the material and structural data from HR-pQCT and pQCT measurements are several mathematical models for estimating bone strength. These analytic tools, such as finite element analysis (FEA, which models bone strength and the bone’s ability to resist fracture under different kinds of mechanical load) and polar moment of inertia (PMI, reflecting the bone’s ability to resist torsion), are adapted from engineering, where they are used to analyze the mechanical strength of various structures.
FEA has been used successfully even with low-resolution structural data from DXA scans, leading to improved prediction of hip fractures, relative to DXA alone.49 However, FEA and PMI are most powerful when applied to data from higher-resolution QCT and related methods that capture cortical and trabecular structure.40,41,43,52 Using FEA to model the strength of the imaged bone, researchers can model the outcomes of specific kinds of impact, such as a femoral neck fracture resulting from an unprotected sideways fall, and the changes in these parameters when patients are treated for osteoporosis.52–54
In a study of older adults (average age 75 years), femoral neck BMD proved to be a good surrogate for hip strength measured by QCT FEA. This finding is significant for clinical practice because it helps confirm the value in fracture risk assessment of the femoral neck BMD T-score, which is central to the CAROC and FRAX tools.55
Limitations of HR-pQCT and pQCT include motion artifacts (particularly for the distal forearm with HR-pQCT), and the inability to image clinically important sites, such as spine and hip. HR-pQCT is generally used for just two sites in the peripheral skeleton, the distal tibia and distal radius43 while pQCT can image mid-shaft tibia and occasionally mid-femur. Conversely, QCT can be used for imaging central skeletal sites, such as the spine and hip, although with its limited resolution, it provides less precise information about changes in bone microarchitecture. Another limitation is that these techniques cannot inform us regarding the nonmineral aspects of the bone matrix, such as cells and collagen, which provide toughness to the bone. Turnover of these nonmineral components is not evaluated by imaging in the clinical setting but may be assessed biochemically.
BTMs
Complementing the insights of medical imaging, BTMs are biochemical markers that can be assayed in the serum or urine to follow changes in bone remodeling. BTMs measure either bone resorption by osteoclasts (eg, the cross-linked collagen telopeptides CTX and NTX) or bone formation by osteoblasts (eg, serum procollagen type 1 N-terminal propeptide; bone-specific alkaline phosphatase; and serum osteocalcin).
Markers of bone resorption and formation tend to rise or fall together; most commonly, both are high, as in PMO; more rarely, both are low in certain “low-turnover” states, such as adynamic bone disease.56,57 This is because bone resorption and bone formation are tightly coupled, with osteoclasts and osteoblasts acting together on the bone surface.58 However, coupling does not mean that resorption and formation always remain in balance. On the contrary, in postmenopausal women, increased bone remodeling is associated with excess bone resorption, and high BTM levels (resorption or formation markers) correlate loosely with lower BMD and reduced bone strength.5,59
Uses and limitations of BTMs
BTMs offer a rapid and inexpensive test for changes in bone remodeling, commonly responding within days to weeks of the initial treatment with an osteoporosis agent,35,58,60–62 much sooner than BMD changes can be measured. For this reason, they offer an early indication that the patient is responding to therapy as expected.35
This reassurance may be helpful for managing patients with high AFR and high BTMs at baseline. For instance, one study followed outcomes in high-risk women on bisphosphonates (alendronate or risedronate) and found that about a fourth experienced an inadequate treatment response, defined as multiple incident fractures and/or significant BMD loss over 3 years. This outcome was significantly associated with elevated levels of the BTM bone-specific alkaline phosphatase, both at baseline and the end of the study period.63
BTM responses seem to be maintained over the course of treatment, at least in clinical trials. At the population level, elevated BTMs are associated with increased fracture rates, an effect that seems to be independent of BMD in older women.14,35,58,62 In principle, these findings suggest that BTM testing could be incorporated into routine fracture risk assessment. However, validated risk assessment tools, such as FRAX, so far have not included BTMs. This is due in part to a lack of standardization of BTM assays, and in part to the substantial intra- and inter-individual variability seen with these markers, including dietary and circadian effects.35,58,62
BTMs in treatment monitoring
BTM changes associated with treatment vary among different antiresorptive therapies, due to differences in their mechanisms and duration of action and potency.26,64,65 No standardized set of BTM tests has been validated in women undergoing treatment for PMO.33,58,66 Thus, it has been suggested that the primary benefit of BTM monitoring is to encourage treatment adherence.59
For physicians wishing to use BTMs to monitor response to therapy, Canadian guidance suggests that serum CTX be examined before and 3–6 months after the onset of antiresorptive treatment; patients who show a <35% decrease in serum CTX should be asked about their adherence and any side effects that might be limiting their use of the therapeutic agent. Conversely, those who respond may be maintained on therapy, with regular but infrequent monitoring of serum CTX to detect changes in bone remodeling.66
Impact of antiresorptive therapy on bone strength
Although both denosumab and bisphosphonates are antiresorptive medications, they differ with regard to compartmental access in the bone. Bisphosphonates are preferentially adsorbed into trabecular bone, which has a high surface area per volume. Once incorporated into the bone mineral matrix exposed during the initial phase of the resorption lacunae, bisphosphonates are taken up by osteoclasts, causing apoptosis and, subsequently, reduced bone resorption. In contrast, because denosumab acts in the extracellular milieu to inhibit osteoclast formation, function, and survival, it inhibits resorption in both trabecular and cortical bone (Figure 5).67 The Osteoporosis Canada Clinical Practice Guidelines recommend denosumab and bisphosphonates (alendronate, risedronate, and zoledronic acid) as first-line antiresorptive therapies to significantly decrease vertebral, hip, and nonvertebral fracture risk.26
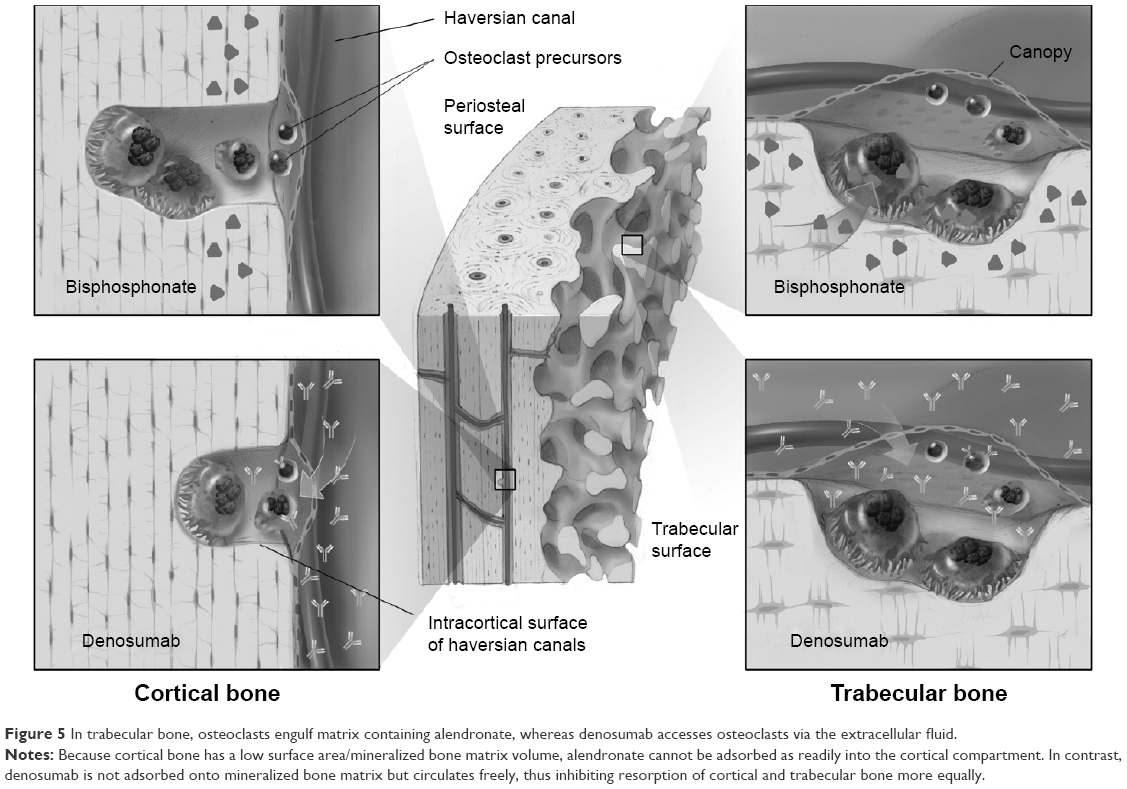 | Figure 5 In trabecular bone, osteoclasts engulf matrix containing alendronate, whereas denosumab accesses osteoclasts via the extracellular fluid. |
Head-to-head fracture trials comparing fracture outcomes of these agents have not been conducted. However, there have been several head-to-head studies investigating the impact of denosumab compared to bisphosphonates on indices of bone strength.60,68–71 Denosumab significantly increased BMD (by DXA) at all cortical and trabecular sites measured, relative to bisphosphonates, in subjects who were either treatment-naïve60 or transitioning from a prior bisphosphonate treatment.68,69 At the distal 1/3 radius (a highly cortical site),72,73 a novel analysis of images obtained after in an HR-pQCT study showed that 1 year of denosumab treatment resulted in a more rapid and profound reduction in bone resorption, as well as a 1.5–2.0-fold greater reduction in cortical porosity, relative to alendronate (Figure 6).71 These findings complement data from the original 1-year study, which showed that denosumab significantly increased cortical volumetric BMD and calculated bone strength or PMI in the distal radius and distal tibia compared to alendronate.70
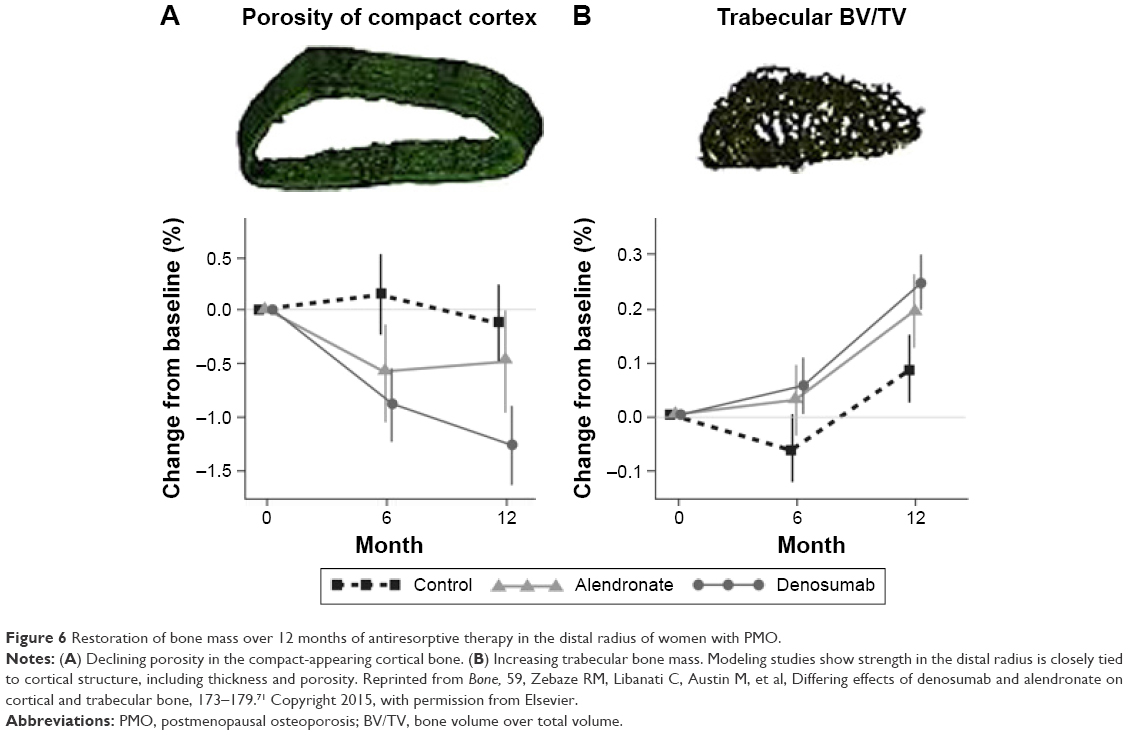 | Figure 6 Restoration of bone mass over 12 months of antiresorptive therapy in the distal radius of women with PMO. |
Recent observational data suggest that continued use of denosumab beyond 3 years of treatment resulted in a further significant reduction in nonvertebral fracture risk,74 presumably reflecting the decreased cortical porosity and the improvement in calculated bone strength associated with this treatment.
Conclusion: goals of therapy and implications for everyday practice
The goal of osteoporosis therapy is to decrease fracture risk by improving bone strength. The available clinical data confirm that bone strength can be improved with antiresorptive treatment and that both trabecular and cortical BMD must be maintained and restored to prevent fracture in older women. Long-term studies of 7 to 10 years’ duration indicate that gains in BMD are either maintained75–77 or continue to increase78 at both cortical and trabecular sites with long-term antiresorptive treatment. Similarly, BTMs decline with the onset of treatment and generally remain suppressed over long-term treatment. As a consequence of improved bone strength, fracture incidence may be suppressed over the course of long-term therapy and may even continue to decline with time.74
The newer imaging technologies complement BMD and may give physicians confidence that their therapies are working as intended. While these technologies offer an extraordinary view of the changes occurring with aging, osteoporosis, and antiresorptive therapy, approaches in common use today (DXA, BTMs, and validated fracture risk assessment tools [ie, CAROC, FRAX]) still suffice for routine clinical decision making. Baseline and postinitiation DXA and BTM measurements may provide reassurance that the patient has responded to therapy and that she maintains reasonable adherence to the intended dosing.
Acknowledgments
The authors gratefully acknowledge writing assistance by John Ashkenas PhD (SCRIPT, Toronto Ontario) and support from Amgen Canada throughout the development of this manuscript. All opinions are those of the authors.
Disclosure
Dr Cheung has received grants (to UHN) and honoraria from Amgen, Eli Lilly, and Merck. Dr Frame has served as a speaker or on advisory board for Amgen, Eli Lilly, Merck, Novartis, and Sanofi. Dr Ho has served as speaker for Merck and AstraZeneca and is on advisory board for Amgen, AstraZeneca, and Tribute. Dr Mackinnon is employed by Amgen Canada. Dr Brown has received research grants, consulting fees, or speakers’ bureau fees from Abbvie, Actavis, Amgen, Eli Lilly, and Takeda. The authors report no other conflicts of interest in this work.
References
Morin SN, Lix LM, Leslie WD. The importance of previous fracture site on osteoporosis diagnosis and incident fractures in women. J Bone Miner Res. 2014;29(7):1675–1680. | ||
Cheung AM, Detsky AS. Osteoporosis and fractures: missing the bridge? JAMA. 2008;299(12):1468–1470. | ||
Dempster DW. Anatomy and functions of the adult skeleton. In: Favus MJ, editor. Primer on the Metabolic Bone Diseases and Disorders of Mineral Metabolism. 6th ed. Ames, Iowa: ASBMR; 2006:7–11. | ||
Seeman E, Delmas PD. Bone quality – the material and structural basis of bone strength and fragility. N Engl J Med. 2006;354(21):2250–2261. | ||
Hochberg MC, Greenspan S, Wasnich RD, Miller P, Thompson DE, Ross PD. Changes in bone density and turnover explain the reductions in incidence of nonvertebral fractures that occur during treatment with antiresorptive agents. J Clin Endocrinol Metab. 2002;87(4):1586–1592. | ||
Wasnich RD, Miller PD. Antifracture efficacy of antiresorptive agents are related to changes in bone density. J Clin Endocrinol Metab. 2000;85(1):231–236. | ||
Cheung AM, Tile L, Cardew S, et al. Bone density and structure in healthy postmenopausal women treated with exemestane for the primary prevention of breast cancer: a nested substudy of the MAP.3 randomised controlled trial. Lancet Oncol. 2012;13(3):275–284. | ||
Mayhew PM, Thomas CD, Clement JG, et al. Relation between age, femoral neck cortical stability, and hip fracture risk. Lancet. 2005;366(9480):129–135. | ||
Macdonald HM, Nishiyama KK, Kang J, Hanley DA, Boyd SK. Age-related patterns of trabecular and cortical bone loss differ between sexes and skeletal sites: a population-based HR-pQCT study. J Bone Miner Res. 2011;26(1):50–62. | ||
Hansen MA, Overgaard K, Riis BJ, Christiansen C. Role of peak bone mass and bone loss in postmenopausal osteoporosis: 12 year study. BMJ. 1991;303(6808):961–964. | ||
Burghardt AJ, Kazakia GJ, Sode M, de Papp AE, Link TM, Majumdar S. A longitudinal HR-pQCT study of alendronate treatment in postmenopausal women with low bone density: Relations among density, cortical and trabecular microarchitecture, biomechanics, and bone turnover. J Bone Miner Res. 2010;25(12):2558–2571. | ||
Xu W, Perera S, Medich D, et al. Height loss, vertebral fractures, and the misclassification of osteoporosis. Bone. 2011;48(2):307–311. | ||
Khosla S. Pacifici. Estrogen deficiency, postmenopausal osteoporosis, and age-related bone loss. In: Marcus R, Feldman D, Dempster DW, Luckey M, Cauley JA, editors. Osteoporosis. 4th ed. San Diego: Academic Press; 2013:1113–1136. | ||
Sambrook P, Cooper C. Osteoporosis. Lancet. 2006;367(9527):2010–2018. | ||
MacNeil JA, Boyd SK. Load distribution and the predictive power of morphological indices in the distal radius and tibia by high resolution peripheral quantitative computed tomography. Bone. 2007;41(1):129–137. | ||
Burge R, Dawson-Hughes B, Solomon DH, Wong JB, King A, Tosteson A. Incidence and economic burden of osteoporosis-related fractures in the United States, 2005–2025. J Bone Miner Res. 2007;22(3):465–475. | ||
Bessette L, Ste-Marie LG, Jean S, et al. The care gap in diagnosis and treatment of women with a fragility fracture. Osteoporos Int. 2008;19(1):79–86. | ||
Zebaze RM, Ghasem-Zadeh A, Bohte A, et al. Intracortical remodelling and porosity in the distal radius and post-mortem femurs of women: a cross-sectional study. Lancet. 2010;375(9727):1729–1736. | ||
Burghardt AJ, Kazakia GJ, Ramachandran S, Link TM, Majumdar S. Age- and gender-related differences in the geometric properties and biomechanical significance of intracortical porosity in the distal radius and tibia. J Bone Miner Res. 2010;25(5):983–993. | ||
Ahlborg HG, Johnell O, Turner CH, Rannevik G, Karlsson MK. Bone loss and bone size after menopause. N Engl J Med. 2003;349(4):327–334. | ||
Seeman E. Periosteal bone formation – a neglected determinant of bone strength. N Engl J Med. 2003;349(4):320–323. | ||
Lauretani F, Bandinelli S, Griswold ME, et al. Longitudinal changes in BMD and bone geometry in a population-based study. J Bone Miner Res. 2008;23(3):400–408. | ||
Szulc P, Seeman E, Duboeuf F, Sornay-Rendu E, Delmas PD. Bone fragility: failure of periosteal apposition to compensate for increased endocortical resorption in postmenopausal women. J Bone Miner Res. 2006;21(12):1856–1863. | ||
Cranney A, Jamal SA, Tsang JF, Josse RG, Leslie WD. Low bone mineral density and fracture burden in postmenopausal women. CMAJ. 2007;177(6):575–580. | ||
Bousson V, Bergot C, Sutter B, et al. Trabecular bone score: where are we now? Joint Bone Spine. 2015;82(5):320–325. | ||
Papaioannou A, Morin S, Cheung AM, et al. 2010 clinical practice guidelines for the diagnosis and management of osteoporosis in Canada: summary. CMAJ. 2010;182(17):1864–1873. | ||
Unnanuntana A, Gladnick BP, Donnelly E, Lane JM. The assessment of fracture risk. J Bone Joint Surg Am. 2010;92(3):743–753. | ||
Van Staa TP, Laan RF, Barton IP, Cohen S, Reid DM, Cooper C. Bone density threshold and other predictors of vertebral fracture in patients receiving oral glucocorticoid therapy. Arthritis Rheum. 2003;48(11):3224–3229. | ||
Amin S, Gabriel SE, Achenbach SJ, Atkinson EJ, Melton LJ 3rd. Are young women and men with rheumatoid arthritis at risk for fragility fractures? A population-based study. J Rheumatol. 2013;40(10):1669–1676. | ||
Leslie WD, Lix LM, Langsetmo L, et al. Construction of a FRAX(R) model for the assessment of fracture probability in Canada and implications for treatment. Osteoporos Int. 2011;22(3):817–827. | ||
Papaioannou A, Morin S, Cheung AM, et al. Clinical Practice Guidelines for the Diagnosis and Management of Osteoporosis in Canada: Background and Technical Report. Available from: http://www.osteoporosis.ca/multimedia/pdf/Osteoporosis_Guidelines_2010_Background_And_Technical_Report.pdf. Accessed July 2016. | ||
FRAX fracture risk assessment tool output can now be modified by TBS [updated May 15, 2015]. Available from: https://www.iofbonehealth.org/news/frax-fracture-risk-assessment-tool-output-can-now-be-modified-tbs. Accessed June 2016. | ||
Lewiecki EM, Cummings SR, Cosman F. Treat-to-target for osteoporosis: is now the time? J Clin Endocrinol Metab. 2013;98(3):946–953. | ||
Muncie H, Leblanc LL. Monitoring osteoporosis treatment: DXA should not be routinely repeated. Am Fam Phys. 2010;82(7):752–754. | ||
Wheater G, Elshahaly M, Tuck SP, Datta HK, van Laar JM. The clinical utility of bone marker measurements in osteoporosis. J Transl Med. 2013;11:201. | ||
Kuroda T, Shiraki M, Shiraki Y, Tanaka S. The importance of absolute bone mineral density in the assessment of antiresorptive agents used for the prevention of osteoporotic fractures. J Clin Densitom. 2012;15(4):392–398. | ||
Austin M, Yang YC, Vittinghoff E, et al. Relationship between bone mineral density changes with denosumab treatment and risk reduction for vertebral and nonvertebral fractures. J Bone Miner Res. 2012;27(3):687–693. | ||
Miller P, Cummings S, Reginster JY, et al. Relationship between changes in BMD and incidence of Fracture with 6 years of denosumab treatment. Presented at: ASMBR Annual Meeting; Minneapolis, MN; October 14, 2012. Abstract 1099; Presentation. | ||
Jacques RM, Boonen S, Cosman F, et al. Relationship of changes in total hip bone mineral density to vertebral and nonvertebral fracture risk in women with postmenopausal osteoporosis treated with once-yearly zoledronic acid 5 mg: the HORIZON-Pivotal Fracture Trial (PFT). J Bone Miner Res. 2012;27(8):1627–1634. | ||
Engelke K. Assessment of bone quality and strength with new technologies. Curr Opin Endocrinol Diabetes Obes. 2012;19(6):474–482. | ||
Engelke K, Adams JE, Armbrecht G, et al. Clinical use of quantitative computed tomography and peripheral quantitative computed tomography in the management of osteoporosis in adults: the 2007 ISCD official positions. J Clin Densitom. 2008;11(1):123–162. | ||
Nishiyama KK, Shane E. Clinical imaging of bone microarchitecture with HR-pQCT. Curr Osteoporos Rep. 2013;11(2):147–155. | ||
Cheung AM, Adachi JD, Hanley DA, et al. High-resolution peripheral quantitative computed tomography for the assessment of bone strength and structure: a review by the Canadian Bone Strength Working Group. Curr Osteoporos Rep. 2013;11(2):136–146. | ||
Dhainaut A, Hoff M, Syversen U, Haugeberg G. Cortical hand bone porosity and its association with distal radius fracture in middle aged and elderly women. PLoS One. 2013;8(7):e68405. | ||
Wong A. CaMos Bone Quality Studies: Plans & Pilot Studies; 2011. Available from: http://www.camris.ca/med/document/WongAKO-SaskatoonCaMosPilots-1-7.pdf. Accessed September 2014. | ||
SCANCO Medical. XtremeCT II. Available from: http://www.scanco.ch/en/systems-solutions/clinical-microct/xtremect1.html. Accessed September 2015. | ||
Lee DC, Gilsanz V, Wren TA. Limitations of peripheral quantitative computed tomography metaphyseal bone density measurements. J Clin Endocrinol Metab. 2007;92(11):4248–4253. | ||
Bouxsein ML. Technology insight: noninvasive assessment of bone strength in osteoporosis. Nat Clin Pract Rheumatol. 2008;4(6):310–318. | ||
Naylor KE, McCloskey EV, Eastell R, Yang L. Use of DXA-based finite element analysis of the proximal femur in a longitudinal study of hip fracture. J Bone Miner Res. 2013;28(5):1014–1021. | ||
Kazakia GJ, Burghardt AJ, Link TM, Majumdar S. Variations in morphological and biomechanical indices at the distal radius in subjects with identical BMD. J Biomech. 2011;44(2):257–266. | ||
Boutroy S, Bouxsein ML, Munoz F, Delmas PD. In vivo assessment of trabecular bone microarchitecture by high-resolution peripheral quantitative computed tomography. J Clin Endocrinol Metab. 2005;90(12):6508–6515. | ||
Sheu Y, Zmuda JM, Boudreau RM, et al. Bone strength measured by peripheral quantitative computed tomography and the risk of nonvertebral fractures: the osteoporotic fractures in men (MrOS) study. J Bone Miner Res. 2011;26(1):63–71. | ||
Genant HK, Engelke K, Hanley DA, et al. Denosumab improves density and strength parameters as measured by QCT of the radius in postmenopausal women with low bone mineral density. Bone. 2010;47(1):131–139. | ||
Orwoll ES, Marshall LM, Nielson CM, et al. Finite element analysis of the proximal femur and hip fracture risk in older men. J Bone Miner Res. 2009;24(3):475–483. | ||
Kopperdahl DL, Aspelund T, Hoffmann PF, et al. Assessment of incident spine and hip fractures in women and men using finite element analysis of CT scans. J Bone Miner Res. 2014;29(3):570–580. | ||
Watts NB. Clinical utility of biochemical markers of bone remodeling. Clin Chem. 1999;45(8 Pt 2):1359–1368. | ||
Coen G, Ballanti P, Bonucci E, et al. Bone markers in the diagnosis of low turnover osteodystrophy in haemodialysis patients. Nephrol Dial Transplant. 1998;13(9):2294–2302. | ||
Burch J, Rice S, Yang H, et al. Systematic review of the use of bone turnover markers for monitoring the response to osteoporosis treatment: the secondary prevention of fractures, and primary prevention of fractures in high-risk groups. Health Technol Assess. 2014;18(11):1–180. | ||
Funck-Brentano T, Biver E, Chopin F, et al. Clinical utility of serum bone turnover markers in postmenopausal osteoporosis therapy monitoring: a systematic review. Semin Arthritis Rheum. 2011;41(2):157–169. | ||
Brown JP, Prince RL, Deal C, et al. Comparison of the effect of denosumab and alendronate on BMD and biochemical markers of bone turnover in postmenopausal women with low bone mass: a randomized, blinded, phase 3 trial. J Bone Miner Res. 2009;24(1):153–161. | ||
Delmas PD, Munoz F, Black DM, et al. Effects of yearly zoledronic acid 5 mg on bone turnover markers and relation of PINP with fracture reduction in postmenopausal women with osteoporosis. J Bone Miner Res. 2009;24(9):1544–1551. | ||
Vasikaran S, Eastell R, Bruyere O, et al. Markers of bone turnover for the prediction of fracture risk and monitoring of osteoporosis treatment: a need for international reference standards. Osteoporos Int. 2011;22(2):391–420. | ||
Cairoli E, Eller-Vainicher C, Ulivieri FM, et al. Factors associated with bisphosphonate treatment failure in postmenopausal women with primary osteoporosis. Osteoporos Int. 2014;25(4):1401–1410. | ||
Hanley DA, Adachi JD, Bell A, Brown V. Denosumab: mechanism of action and clinical outcomes. Int J Clin Pract. 2012;66(12):1139–1146. | ||
Boonen S, Ferrari S, Miller PD, et al. Postmenopausal osteoporosis treatment with antiresorptives: effects of discontinuation or long-term continuation on bone turnover and fracture risk – a perspective. J Bone Miner Res. 2012;27(5):963–974. | ||
Brown JP, Albert C, Nassar BA, et al. Bone turnover markers in the management of postmenopausal osteoporosis. Clin Biochem. 2009;42(10–11):929–942. | ||
Baron R, Ferrari S, Russell RG. Denosumab and bisphosphonates: different mechanisms of action and effects. Bone. 2011;48(4):677–692. | ||
Kendler DL, Roux C, Benhamou CL, et al. Effects of denosumab on bone mineral density and bone turnover in postmenopausal women transitioning from alendronate therapy. J Bone Miner Res. 2010;25(1):72–81. | ||
Roux C, Hofbauer LC, Ho PR, et al. Denosumab compared with risedronate in postmenopausal women suboptimally adherent to alendronate therapy: efficacy and safety results from a randomized open-label study. Bone. 2014;58:48–54. | ||
Seeman E, Delmas PD, Hanley DA, et al. Microarchitectural deterioration of cortical and trabecular bone: differing effects of denosumab and alendronate. J Bone Miner Res. 2010;25(8):1886–1894. | ||
Zebaze RM, Libanati C, Austin M, et al. Differing effects of denosumab and alendronate on cortical and trabecular bone. Bone. 2014;59:173–179. | ||
Firoozabadi R, Morshed S, et al. Qualitative and quantitative assessment of bone fragility and fracture healing using conventional radiography and advanced imaging technologies – focus on wrist fracture. J Orthop Trauma. 2008;22(8 Suppl):S83–S90. | ||
Wahner HW, Eastell R, Riggs BL. Bone mineral density of the radius: where do we stand? J Nucl Med. 1985;26(11):1339–1341. | ||
Ferrari S, Adachi JD, Lippuner K, et al. Further reductions in nonvertebral fracture rate with long-term denosumab treatment in the FREEDOM open-label extension and influence of hip bone mineral density after 3 years. Osteoporos Int. 2015;26(12):2763–2771. | ||
Black DM, Reid IR, Boonen S, et al. The effect of 3 versus 6 years of zoledronic acid treatment of osteoporosis: a randomized extension to the HORIZON-pivotal fracture trial (PFT). J Bone Miner Res. 2012;27(2):243–254. | ||
Bone HG, Hosking D, Devogelaer JP, et al. Ten years’ experience with alendronate for osteoporosis in postmenopausal women. N Engl J Med. 2004;350(12):1189–1199. | ||
Mellstrom DD, Sorensen OH, Goemaere S, Roux C, Johnson TD, Chines AA. Seven years of treatment with risedronate in women with postmenopausal osteoporosis. Calcif Tissue Int. 2004;75(6):462–468. | ||
Papapoulos S, Lippuner K, Roux C, et al. The effect of 8 or 5 years of denosumab treatment in postmenopausal women with osteoporosis: results from the FREEDOM Extension study. Osteoporos Int. 2015;26(12):2773–2783. | ||
Huang AJ, Chang CY, Thomas BJ, MacMahon PJ, Palmer WE. Using cone-beam CT as a low-dose 3D imaging technique for the extremities: initial experience in 50 subjects. Skeletal Radiol. 2015;44(6):797–809. |
 © 2016 The Author(s). This work is published and licensed by Dove Medical Press Limited. The full terms of this license are available at https://www.dovepress.com/terms.php and incorporate the Creative Commons Attribution - Non Commercial (unported, v3.0) License.
By accessing the work you hereby accept the Terms. Non-commercial uses of the work are permitted without any further permission from Dove Medical Press Limited, provided the work is properly attributed. For permission for commercial use of this work, please see paragraphs 4.2 and 5 of our Terms.
© 2016 The Author(s). This work is published and licensed by Dove Medical Press Limited. The full terms of this license are available at https://www.dovepress.com/terms.php and incorporate the Creative Commons Attribution - Non Commercial (unported, v3.0) License.
By accessing the work you hereby accept the Terms. Non-commercial uses of the work are permitted without any further permission from Dove Medical Press Limited, provided the work is properly attributed. For permission for commercial use of this work, please see paragraphs 4.2 and 5 of our Terms.