")
Back to Journals » Diabetes, Metabolic Syndrome and Obesity » Volume 13
Bone Morphogenetic Protein-2 and Osteopontin Gene Expression in Epicardial Adipose Tissue from Patients with Coronary Artery Disease Is Associated with the Presence of Calcified Atherosclerotic Plaques
Authors Luna-Luna M , Criales-Vera S , Medina-Leyte D , Díaz-Zamudio M, Flores-Zapata A, Cruz-Robles D , López-Meneses M, Olvera-Cruz S, Ramírez-Marroquín S, Flores-Castillo C , Fragoso JM , Carreón-Torres E , Vargas-Barrón J, Vargas-Alarcón G , Pérez-Méndez Ó
Received 18 March 2020
Accepted for publication 4 June 2020
Published 11 June 2020 Volume 2020:13 Pages 1943—1951
DOI https://doi.org/10.2147/DMSO.S253632
Checked for plagiarism Yes
Review by Single anonymous peer review
Peer reviewer comments 2
Editor who approved publication: Dr Konstantinos Tziomalos
María Luna-Luna,1 Sergio Criales-Vera,2 Diana Medina-Leyte,1 Mariana Díaz-Zamudio,2 Adriana Flores-Zapata,1 David Cruz-Robles,1 Mauricio López-Meneses,3 Sergio Olvera-Cruz,3 Samuel Ramírez-Marroquín,4 Cristóbal Flores-Castillo,1 José Manuel Fragoso,1 Elizabeth Carreón-Torres,1 Jesús Vargas-Barrón,5 Gilberto Vargas-Alarcón,1 Óscar Pérez-Méndez1,6
1Molecular Biology, National Institute of Cardiology “Ignacio Chávez”, Mexico City, Mexico; 2Radiology, National Institute of Cardiology “Ignacio Chávez”, Mexico City, Mexico; 3Adult Cardiology, National Institute of Cardiology “Ignacio Chávez”, Mexico City, Mexico; 4Cardiothoracic Surgery, National Institute of Cardiology “Ignacio Chávez”, Mexico City, Mexico; 5Research Direction, National Institute of Cardiology “Ignacio Chávez”, Mexico City, Mexico; 6School of Engineering and Sciences, Tecnológico de Monterrey, Campus Monterrey, Mexico City, Mexico
Correspondence: Óscar Pérez-Méndez
Molecular Biology Department, National Institute of Cardiology “Ignacio Chávez”, Mexico City, Mexico
Tel +52 55 55732911 ext 26300
Email [email protected]
Purpose: It has been proposed that the cardiovascular effects of obesity are related to epicardial adipose tissue (EAT), which seems to play an active role on the development and calcification of atherosclerotic plaques, but the mechanisms are still unknown. Therefore, the aim of this study was to determine whether the EAT expresses the genes of calcifying factors and whether such expression is associated with the body mass index (BMI) and with the presence of coronary artery calcium (CAC) in patients with coronary artery disease (CAD).
Patients and Methods: Forty-three patients with CAD were enrolled specifically for this study, and their CAC score and EAT volume were determined by computed tomography. As the group of comparison, 41 patients with aortic valve stenosis and CAC = 0 were included (control group). A representative subgroup of 16 CAD patients and 23 controls were selected to obtain EAT biopsies during the chirurgical procedure from the atrio-interventricular groove. The mRNA expression of bone morphogenetic protein-2 and -4 (BMP-2, BMP-4), osteopontin (OPN), osteonectin (ON), and osteoprotegerin (OPG) in EAT was determined by qPCR.
Results: The gene expression of OPN and BMP-2 was 70% and 52% higher in the EAT from CAD patients than that in controls, respectively, whereas the expression of OPG, ON, and BMP-4 was similar in both groups. The EAT volume positively correlated with OPG and with the BMI, suggesting a relationship of obesity with local higher expression of calcifying genes in the coronary territory. The logistic regression analysis showed that high levels of both OPN and BMP-2 increased about 6 and 8 times the odds of coronary calcification (CAC score > 0), respectively.
Conclusion: EAT correlated with BMI and expressed the mRNA of calcifying genes but only OPN and BMP-2 expression was higher in CAD patients. Higher levels of both OPN and BMP-2 statistically determined the presence of calcium in coronary arteries of CAD patients.
Keywords: obesity, adipocyte, calcifying proteins, coronary artery disease, atherosclerosis
Introduction
The coronary calcification is a common process observed in advanced atherosclerotic lesions;1,2 it has been proposed that the deposit of calcium in the artery is similar to that of the bone tissue, but the precise mechanism of atheroma calcification is still unknown. Obesity has been related with coronary calcification by the systemic low-grade inflammation characteristic of this condition.3 However, a systemic effect is not consistent with the fact that only certain, well-defined arteries are affected by the calcification process, thus suggesting a local participant at the affected area that contributes to calcium deposit. In this context, epicardial adipose tissue (EAT) emerges as a potential local organ that promotes the coronary calcification,4 since the atherosclerotic plaques are always situated in sections of the artery adjacent to this tissue. Accordingly, several studies have found that coronary artery calcification increases with EAT thickness or volume measured by echocardiography or multidetector computed tomography.5–8 In addition, EAT volume has been considered as a marker of visceral adiposity.9,10 Therefore, these evidences strongly suggest that obesity is linked to atherosclerosis calcification via EAT.
We have previously demonstrated that EAT expresses genes related with coronary calcification such as osteopontin (OPN), osteonectin (ON), and osteoprotegerin (OPG),11 thus suggesting that EAT directly participates on coronary calcification. However, it remains unknown whether the pro-calcifying factors expressed by EAT are associated with the amount of calcium deposited in the coronary arteries. Since the coronary artery calcification (CAC) score was not determined in that exploratory study,11 we recruited new groups of patients and controls in order to look for a potential biological impact of such mRNA expressions on coronary calcification. We quantified the CAC score and the EAT volume by tomography, as well as the gene expression in EAT from patients with coronary artery disease (CAD), including OPN, ON, OPG, and bone morphogenetic protein (BMP)-2 and BMP-4. The latter two are important potential participants in coronary calcification because both proteins are able to induce the osteogenic differentiation of vascular smooth muscle cells,12,13 and it has not been demonstrated whether EAT may express these bone morphogenic factors. Our results are confirmatory for the expression of OPN, OPG, and ON expression in EAT, and we found a statistical association between a determined expression level of OPN and BMP-2 and the presence of calcium in the coronary arteries.
Materials and Methods
Patients
Patients diagnosed with coronary artery disease (CAD) who were candidates to revascularization surgery were recruited for this study. We also included patients with diagnostic of aortic valve stenosis programmed for chirurgical aortic valve replacement as a group for comparison, named the control group; the main inclusion criterion was a CAC = 0 for controls. Women and men were included. The exclusion criteria were renal, thyroid, or hepatic disease, previous coronary angioplasty, and revascularization surgery.
EAT biopsies were obtained during the chirurgical procedure from the atrio-interventricular groove and placed immediately in tubes with RNAlaterTM Stabilization Solution (Life technologies, Carlsbad, CA, USA) and frozen at −70°C for further analysis.
All participants were recruited at the Instituto Nacional de Cardiología “Ignacio Chávez”, and the internal Institutional Committee of Ethics approved the present study with the registration number 15–914. Participants who agreed to participate signed a letter of informed consent.
Computed Tomography for CAC Score and Fat Volume Quantification
Computed tomography of the chest was performed using a 64-channel multi-detector helical computed tomography system (Somatom Sensation, Siemens), and images were interpreted by experienced radiologists. Scans were read to determine coronary artery calcium (CAC) scores using the Agatston method and EAT volume quantification by an automated algorithm previously described.14,15 The CAC score and EAT volume were determined previous to the chirurgical procedures.
Laboratory Assessment
Plasma concentrations of total cholesterol, triglycerides, and glucose were determined by commercially available enzymatic colorimetric methods (Randox LTD, Crumlin, UK). The concentrations of magnesium, alkaline phosphatase, inorganic phosphorus, and calcium were determined by automated methods in the hospital central laboratory.
Lipids associated to HDL (cholesterol, triglycerides, and phospholipids) were determined after precipitating apo B-containing lipoproteins by phosphotungstic acid-Mg2+ method (Wako Chemicals, Richmond, VA, USA). Low-density lipoprotein (LDL)-cholesterol was estimated with the formula of Friedewald in patients with triglycerides <300 mg/dL.
Quantification of mRNA
mRNA from EAT samples was quantified as previously described with slight modifications.16 Briefly, total RNA was isolated by using the Ribozol™ Plus RNA Purification Kit (Ameresco, OH, USA) following the manufacturer’s instructions. The contaminant DNA was removed from total RNA with RNAse-free DNAse (Invitrogen, Life Technologies, Carlsbad, CA, USA). The purity, quantity, and quality of the total RNA was determined spectrophotometrically using Nanodrop technology and agarose gels. RNA was reverse transcribed using SuperScript® VILOTM cDNA Synthesis Kit (Invitrogen, Life Technologies, Carlsbad, CA, USA) according to the manufacturer´s protocol.
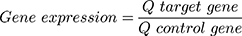
The gene expression level was performed by real time polymerase chain reaction (qPCR) using TaqMan Gene Expression Assays (Invitrogen/Life Technologies, Carlsbad, CA). The probes used were Hs00959010_m1 (SPP1), Hs00234160_m1 (SPARC), Hs00900358_m1 (TNFRSF11B), Hs00154192_m1 (BMP2), Hs01041266_m1 (BMP4), and Hs0275899_g1 (GAPDH), corresponding to genes that encode osteopontin, osteonectin, osteoprotegerin, bone morphogenetic proteins 2 and 4, and glyceraldehyde-3-phosphate dehydrogenase, respectively, all specific to humans. GAPDH was used as a housekeeping gene, and the quantification of gene expression was calculated by the standard curve method. Briefly, serial dilutions of a cDNA pool with a known concentration (ng/μL) were prepared to generate the respective standard curve, whose y-axis represents the cycle treasure (Ct), and the abscissae axis (x) corresponds to the logarithm of the concentration of cDNA (Q). The relative gene expression levels were then calculated as follows:
Statistical Analysis
Normally distributed data, determined with a Shapiro–Wilk test, were expressed as means and standard error (SE). The non-normally distributed variables were presented as median and interquartile range and were logarithmically or square root transformed for parametric analysis. The differences of the antidyslipidemic drugs consumption, gender, and the presence of diabetes were analyzed by a χ2 test, and the effect of these variables was evaluated by a general linear model. Student’s unpaired t-test or U-Mann Whitney test were used for comparison between groups. Pearson’s or Spearman correlations were performed to determine the relationship between variables. A logistic regression was performed to determine the variables associated with the presence of a CAC score >0; the parameters that were statistically different in the bivariate analysis were included in the logistic model as independent variables, which were dichotomized for logistic regression on the basis of the median of the whole individuals. In order to maintain the power of the test with respect to the number of subjects in the study, we limited the logistic regression model to four independent variables. All reported p-values were based on two-sided tests. p < 0.05 values were considered as significant. Analyses were performed with the Statistical Package for the Social Sciences version 21.0 (SPSS, Inc, Chicago, IL, USA).
Results
Clinical Characteristics of Patients
A total of 43 CAD and 41 aortic valve stenosis (controls) patients were initially enrolled in the study. Twenty-seven CAD and 18 controls were excluded because of complications during the chirurgical procedure that impede obtaining the biopsy or had physical limitations for the tomography. Therefore, 16 CAD patients and 23 controls were finally reported in this study; these subgroups were representative of the initial populations, as shown in Supplementary Table 1.
The anthropometric and clinical characteristics of patients are shown in Table 1. The number of women and the uric acid plasma levels in the control group were higher than in the CAD group, whilst the use of statins and systolic blood pressure was higher in the CAD patients compared with the control subjects.
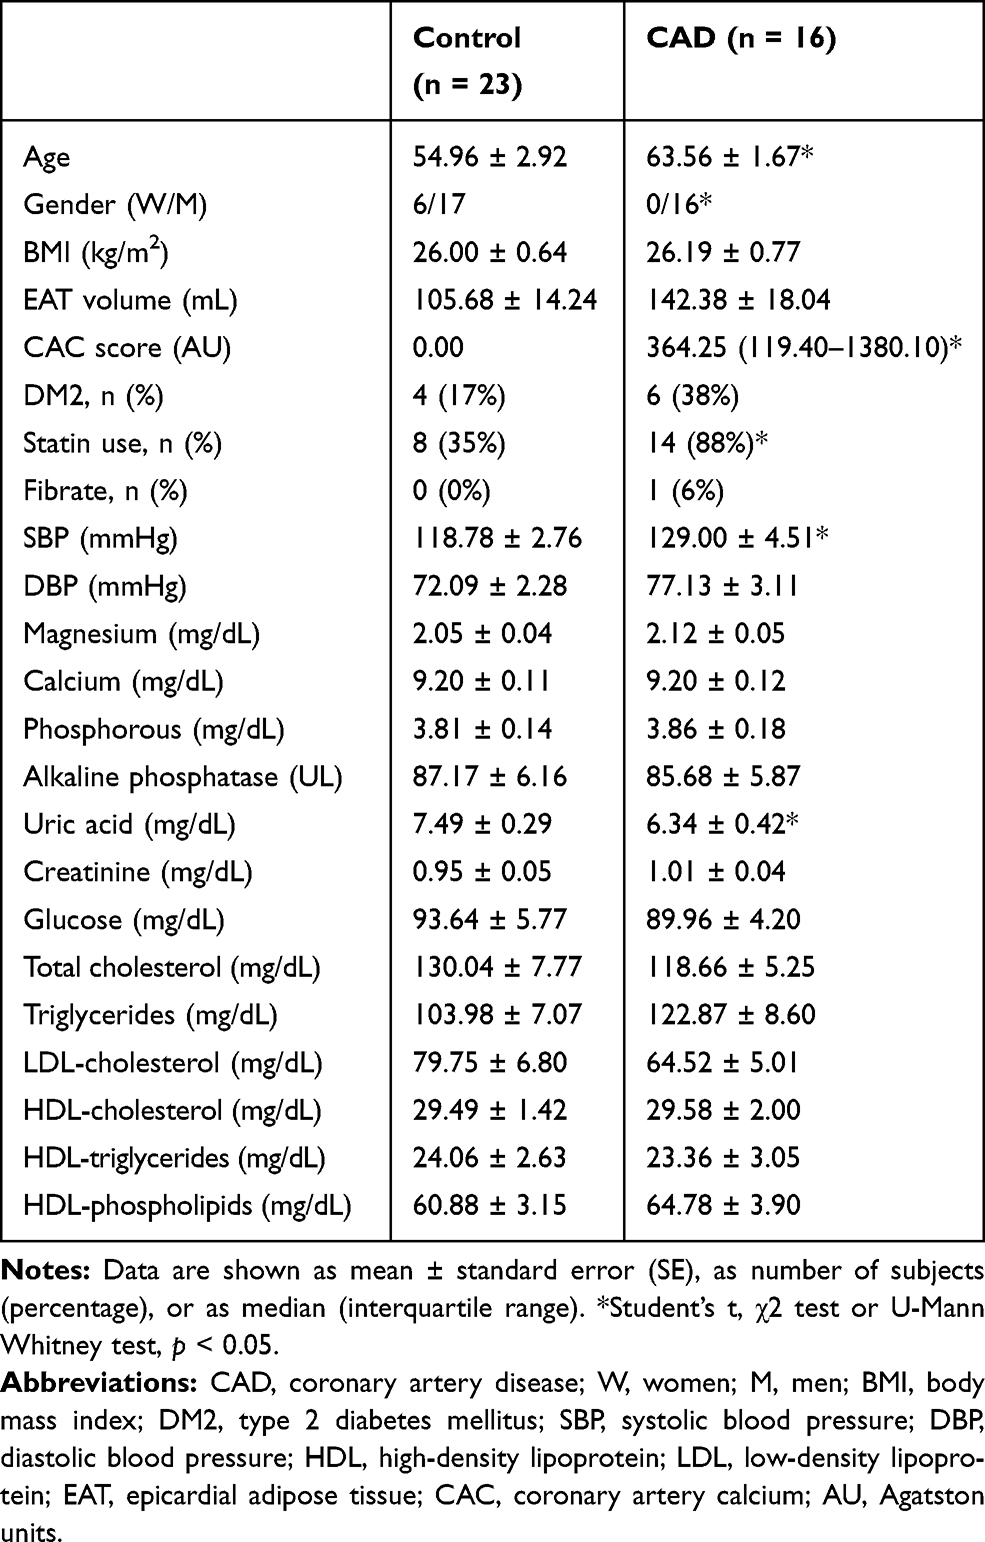 |
Table 1 Anthropometric Characteristics, Biochemical Data, and Pharmacological Treatment of the Included Subjects |
The plasma concentrations of calcium, phosphorus, and magnesium as well as alkaline phosphatase (analytes usually associated with the calcification of the atherosclerotic plaque) were similar in the control and CAD groups (Table 1). Regarding the CAC score, this value was 0 for the control group because of inclusion criterion, whereas the median was 364.25 Agatston units (AU) for the CAD group (Table 1). The EAT volume was not statistically different between groups.
Gene Expression in Epicardial Adipose Tissue
The gene expression of OPN and BMP-2 was 70 and 52% higher in the EAT from CAD patients than that in controls, respectively, whereas the expression of OPG, ON, and BMP-4 was similar in both groups (Figure 1).
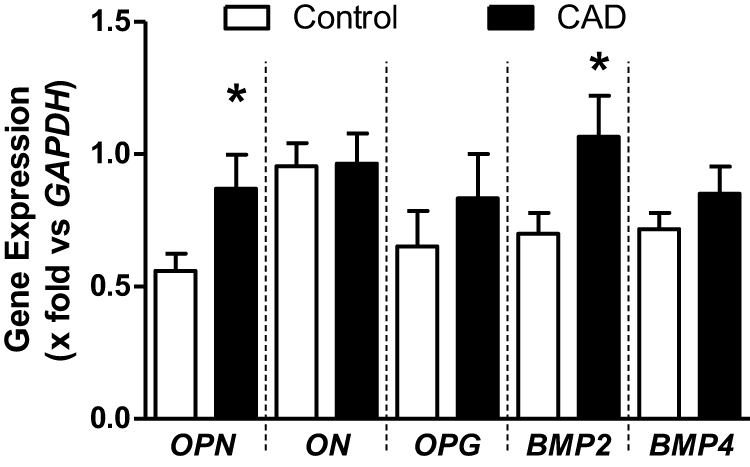 |
Figure 1 mRNA expression of genes related with calcification of atherosclerotic plaque. Data are shown as media ± SE. *Student´s t-test, p < 0.05. Abbreviations: OPN, osteopontin; ON, osteonectin; OPG, osteoprotegerin; BMP, bone morphogenetic protein; GAPDH, glyceraldehyde 3-phosphate dehydrogenase. |
Correlation Analyses
We found a positive correlation between the CAC score and age in the CAD group (Spearman correlation, r = 0.54, p = 0.031). Interestingly, we found a positive correlation of the EAT volume with OPG expression and with the BMI (Figure 2A and B, respectively). The two extreme values of OPG were omitted for the correlation analysis between EAT volume and OPG (Figure 2A); the correlation in with whole patients remains significant and is shown in Supplementary Figure S1. However, we did not find any correlation either between OPG and BMI (Figure 2C) or gene expression and CAC score (Supplementary Table 2).
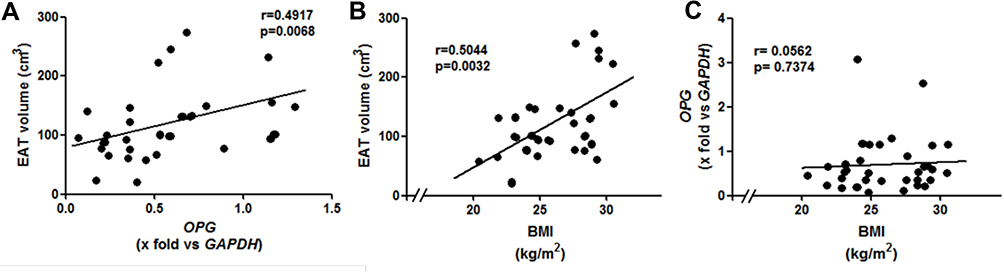 |
Figure 2 Correlations between (A) EAT volume and OPG (n = 37), (B) EAT volume and BMI (n = 39), and (C) OPG and BMI (n = 39). The two extreme values of OPG were omitted for the correlation analysis in panel A; the correlation in with the 39 patients remains significant and is shown in supplementary figure S1. Abbreviations: EAT, epicardial adipose tissue; OPG, osteoprotegerin; GAPDH, glyceraldehyde 3-phosphate dehydrogenase; BMI, body mass index. |
To determine if the CAC could be explained by the variables that were significantly different between groups, we performed a logistic regression analysis. We excluded SBP and uric acid because 1) both variables suggest a systemic effect, not a local one, as we have proposed, and 2) when we performed logistic regression analysis introducing age, gender, SBP and uric acid as independent variables, none of these parameters were retained as predictive parameters of a CAC >0 (data not shown). As a consequence, we introduced age, gender, BMP-2, and OPN as independent variables. This analysis showed that the values of gene expression of OPN and BMP-2 above the median of the studied group increased the odds ratio of coronary calcification between 6 and 8 times (CAC score > 0, Table 2).
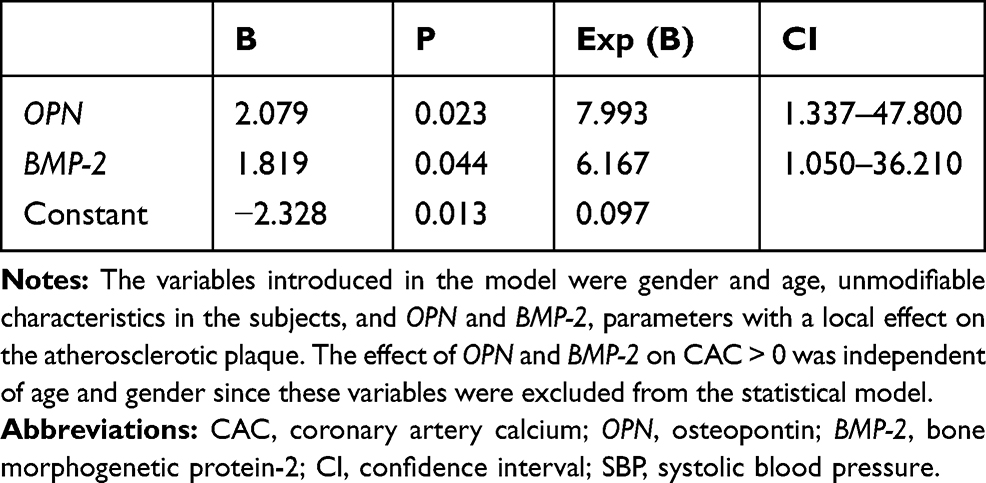 |
Table 2 Association of CAC > 0 with the Expression of Genes Related to Tissue Calcium Deposit |
Discussion
In this study, we demonstrated the gene expression of BMP-2 in EAT from patients with CAD, and the statistical association of the expression of this gene with the presence of a CAC score >0. Among the initially enrolled patients, only a subgroup of 16 CAD and 23 control individuals were reported; despite the apparent low number of patients, subgroups were representative of the whole group (n=43 CAD, and n=41 non-CAD subjects), since we did not find any difference between former and the latter. Therefore, our data could be considered as valid and describe the general characteristics of EAT concerning the gene expression of the calcifying factors.
We had previously demonstrated that EAT expressed the mRNA of OPN, ON, and OPG,11 three genes whose protein products have been found in the atherosclerotic lesions. On the basis of these evidences, the search of a correlation between the CAC score and the gene expression in EAT became imperative. For this purpose, in this study, we constituted two groups integrated with newly recruited CAD patients and controls, independently of our previous report, in order to determine the CAC score and the EAT volume. Moreover, besides OPN, ON, and OPG, we determined the gene expression of BMP-2 and BMP-4 in the EAT biopsies of both groups, since the corresponding proteins have also been found in calcified plaques.12 Therefore, this study allowed us to determine the possible association between the gene expression of pro-calcifying factors with both the CAC score and EAT volume. Though the mechanisms of calcification of the atheroma are not well understood, the genes in this study were selected because the presence of OPN, ON, OPG, BMP-2, and BMP-4 has been usually reported in human calcified atherosclerotic plaques.2,17-19
Our results confirmed that the EAT expresses OPN, ON, and OPG. We further demonstrated that the EAT also expressed both BMP-2 and BMP-4 mRNAs; the expression of both genes was higher in the EAT from CAD patients compared with controls, yet the difference for BMP-4 did not reach statistical significance. In vitro studies have demonstrated the ability of both BMPs to induce the trans-differentiation of vascular smooth muscle cells (VSMCs) into osteoblastic lineage.13,20,21 These evidences support the idea that EAT could act in a paracrine manner on the VSMC secreting pro-calcifying BMPs, thus contributing to the osteoblastic differentiation in coronary arteries and calcification of the atheroma.13,20,21 This possibility agrees with the fact that atherosclerotic plaques are usually adjacent to EAT.4,11,22 Besides the traditional pro-inflammatory adipokines,23,24 EAT seems to be an important source of the main pro-calcifying proteins in the atheroma.4,11 It should be emphasized that EAT is constituted of several cell types indeed, including adipocytes and stromal cells (endothelial progenitors, fibroblasts, lymphocytes, macrophages, pericytes, and stromal stem cells, among others), and it remains unknown as to which one is the main source of BMP-2 and BMP-4. There are some evidences suggesting that mature adipocytes, differentiated preadipocytes, and stromal vascular fraction from subcutaneous and omental adipose tissue express both BMP-2 and BMP-4.25–27 BMP4 transcript levels were high in mature adipocytes and correlated positively with the cell size.26 Importantly, those studies were performed with cell obtained from subcutaneous adipose tissue. Therefore, the adipocytes are the most likely source of expression and secretion of BMP-2 and BMP-4, but it cannot be discarded that other minor cell types, such as macrophages and endothelial cells, may also contribute with the expression of these proteins.
The role of ON in atheroma is still controversial;28,29 the present study supports the notion that ON is not involved in the coronary calcification process, since the EAT from both groups expressed similar levels of ON. These data agree with previous results from our research group.11 Therefore, it is likely that ON is expressed by some tissues, including EAT, but its expression may not be directly implicated in the coronary calcification process.
The expression of OPN in the EAT from CAD patients was significantly higher compared with the controls, supporting the previous findings from our group.11 Some authors have attributed an anti-calcifying role to OPN; however, it should be highlighted that the OPN is a very versatile protein due to a variety of post-translational modifications,4,30 and the phosphorylated form of OPN is able to inhibit the calcification process.30–32 Hence, further studies are needed to determine the isoforms of OPN specifically secreted by EAT in order to establish whether this tissue participates in calcium deposits in the arteries or counterbalances such a process.
Despite a similar OPG expression in controls and CAD patients, the OPG gene expression correlated positively with EAT volume. Recently, Sovová et al found a similar correlation in patients with ischemic heart disease.33 In addition, in our patients, the EAT volume correlated with the BMI. Considering that the secretory pattern of adipokines changes when the size of the adipocyte increases,4,34 the correlation between EAT volume and OPG gene expression suggests that the secretion of this protein depends on the size of the epicardial adipocytes; it is likely that the higher the EAT volume is, the larger the adipocytes and the greater the OPG expression. The role of OPG in the atherosclerotic process is still controversial; even if some studies have associated the elevated plasma levels of OPG with high cardiovascular risk,35,36 OPG-/- ApoE-/- double KO mice developed vascular calcification.37 Therefore, this protein seems to participate as a regulator of the vascular calcification process and the relationship between OPG gene expression, and EAT volume found in the present study may have an impact on cardiovascular risk stratification that merits exploration. On the other hand, it has been described that both BMP-2 and BMP-4 are able to stimulate the production of OPG in osteoblasts.38 We speculate, therefore, that EAT expresses higher quantities of OPG in CAD patients as a consequence of upregulation of the gene mediated by BMPs. The enhanced gene expression of OPG, in turn, could be intended to counterbalance the pro-calcifying effects of BMPs.
Despite the positive correlation between the CAC score and age, we did not observe any correlation between the gene expression and CAC score as was expected. Therefore, we postulated that, over a certain threshold of gene expression, calcification is favored. To test this idea, we dichotomized the independent variables based on the value of the median of the group, which guarantees the same number of subjects in each group. We then performed a binary logistic regression to determine which main variables are associated with the presence of a CAC score >0. The variables introduced in the model were gender and age, which are the subjects’ unmodifiable characteristics, and OPN and BMP-2, which have a local effect on the atherosclerotic plaque. We limited the number of variables that could be included in the model. This analysis revealed that both gene expression values of OPN and BMP-2 above the median of the group had an association with the presence of a CAC score >0, and this relationship was independent of gender and age. These results are consistent with the presence of both proteins in the calcified atherosclerotic plaque.12,17,39 However, the confidence intervals are wide because of the small number of patients finally enrolled in the study. We recognize that in this transversal study, the time of evolution of the calcification process is a parameter that could not be controlled. Moreover, this results only suggest a causal relationship between EAT and coronary calcification, but the subjacent mechanisms remain unexplored. Therefore, long-term follow-up and mechanistic studies are needed for this purpose.
We clearly demonstrated that EAT expressed the mRNA of genes that encode for pro-calcifying proteins. As a consequence, EAT may contribute to atheroma calcification via OPN and BMPs; however, it should be emphasized that other tissues may be involved in this process, since other cell types, including vascular endothelial cells and VSCMs express the same genes.40,41 Moreover, we recognize as a limitation of this study that the low number of studied patients may also have contributed to the lack of some of the expected correlations.
Despite the small number of subjects, we demonstrated that EAT volume has a positive correlation with BMI, confirming the association observed in previous studies.42,43 For a long time, the research has been focused on the role of abdominal visceral adipose tissue in cardiovascular diseases. However, due to contiguity with coronary arteries, the EAT could be decisive in the onset, progression, and calcification of atherosclerotic plaque.4 In this way, it has been proposed that each deposit of adipose tissue could act as a mini-organ and have a regulation and effect very different in adjacent tissues. Moreover, a common feature of the different deposits of adipose tissue is that their size increases almost simultaneously by the effect of the same stimuli. In this context, the BMI is a marker of EAT size, suggesting that the epicardial adipose tissue volume increases simultaneously with that of the other adipose tissue deposits. However, adipose tissues fulfill different roles in function with their anatomical localization, as suggested by the correlation of OPG with EAT volume, but not with BMI. These results agree with the idea that EAT controls the micro-environment of the adjacent arteries leading, for example, to the coronary calcification. Therefore, EAT may be a potential therapeutic target in cardiovascular disease, and it is necessary to determine the size and the adiposopathy grade of EAT as a risk factor of CAD.42 In addition, it should be considered that the anatomical location of EAT is related with its secretor pattern.44 This suggests that not only the EAT per se, but also its anatomical localization is crucial in the artery calcification. Currently, it is unknown if the anatomical area is associated with the EAT volume and with the calcification grade in the atheroma. In this context, we recognize that our study was not designed to obtain the biopsy from the region that had the highest levels of calcification.
Finally, in this study we did not consider to quantify the protein expression because previous reports have demonstrated that these proteins are secreted.12 As a consequence, the quantitation of the proteins within the adipose tissue is not representative of the amount of the secreted and accumulated proteins within the atherosclerotic lesion. Whether the mRNA correlates with the amount of translated proteins, should be explored in future studies.
Conclusions
In conclusion, we demonstrated that EAT expressed BMP-2 and BMP-4, two genes related with the calcification of the atherosclerotic plaque. Moreover, the EAT from patients with CAD expressed higher levels of BMP-2 and OPN compared with control subjects. Finally, we observed that BMP-2 and OPN expression values above the median of the group were statistically associated with a CAC score >0. This observation suggests a causal relationship between BMP-2 and OPN with coronary calcification that should be verified in prospective studies.
Acknowledgments
This study was supported by a CONACYT grant No. 233493. María de Jesús Luna Luna is a doctoral student from “Programa de Doctorado en Ciencias Biomédicas de la Universidad Nacional Autónoma de México” and received a fellowship from CONACYT, No. 408097. She is currently the recipient of a fellowship CONACYT No. EXP-AYTE-17345.
Disclosure
The authors report that there are no conflicts of interest in this work.
References
1. Erbel R, Möhlenkamp S, Moebus S, et al. Coronary risk stratification, discrimination, and reclassification improvement based on quantification of subclinical coronary atherosclerosis: the Heinz Nixdorf Recall study. J Am Coll Cardiol. 2010;56(17):1397–1406. doi:10.1016/j.jacc.2010.06.030
2. Doherty TM, Detrano RC. Coronary arterial calcification as an active process: a new perspective on an old problem. Calcif Tissue Int. 1994;54(3):224–230. doi:10.1007/BF00301683
3. Andrade MC, Carmo LS, Farias-Silva E, Liberman M. Msx2 is required for vascular smooth muscle cells osteoblastic differentiation but not calcification in insulin-resistant ob/ob mice. Atherosclerosis. 2017;265:14–21. doi:10.1016/j.atherosclerosis.2017.07.028
4. Luna-Luna M, Medina-Urrutia A, Vargas-Alarcón G, Coss-Rovirosa F, Vargas-Barrón J, Pérez-Méndez Ó. Adipose tissue in metabolic syndrome: onset and progression of atherosclerosis. Arch Med Res. 2015;46(5):392–407. doi:10.1016/j.arcmed.2015.05.007
5. Iwasaki K, Matsumoto T, Aono H, Furukawa H, Samukawa M. Relationship between epicardial fat measured by 64-multidetector computed tomography and coronary artery disease. Clin Cardiol. 2011;34(3):166–171. doi:10.1002/clc.20840
6. Djaberi R, Schuijf JD, van Werkhoven JM, Nucifora G, Jukema JW, Bax JJ. Relation of epicardial adipose tissue to coronary atherosclerosis. Am J Cardiol. 2008;102(12):1602–1607. doi:10.1016/j.amjcard.2008.08.010
7. Kim BJ, Kang JG, Lee SH, et al. Relationship of echocardiographic epicardial fat thickness and epicardial fat volume by computed tomography with coronary artery calcification: data from the CAESAR study. Arch Med Res. 2017;48(4):352–359. doi:10.1016/j.arcmed.2017.06.010
8. Iwasaki K, Urabe N, Kitagawa A, Nagao T. The association of epicardial fat volume with coronary characteristics and clinical outcome. Int J Cardiovasc Imaging. 2018;34(2):301–309. doi:10.1007/s10554-017-1227-7
9. Singh N, Singh H, Khanijoun HK, Iacobellis G. Echocardiographic assessment of epicardial adipose tissue–a marker of visceral adiposity. Mcgill J Med. 2007;10(1):26–30.
10. Iacobellis G, Assael F, Ribaudo MC, et al. Epicardial fat from echocardiography: a new method for visceral adipose tissue prediction. Obes Res. 2003;11(2):304–310. doi:10.1038/oby.2003.45
11. Luna-Luna M, Cruz-Robles D, Ávila-Vanzzini N, et al. Differential expression of osteopontin, and osteoprotegerin mRNA in epicardial adipose tissue between patients with severe coronary artery disease and aortic valvular stenosis: association with HDL subclasses. Lipids Health Dis. 2017;16(1):156. doi:10.1186/s12944-017-0550-2
12. Dhore CR, Cleutjens JP, Lutgens E, et al. Differential expression of bone matrix regulatory proteins in human atherosclerotic plaques. Arterioscler Thromb Vasc Biol. 2001;21(12):1998–2003. doi:10.1161/hq1201.100229
13. Shimizu T, Tanaka T, Iso T, et al. Notch signaling pathway enhances bone morphogenetic protein 2 (BMP2) responsiveness of Msx2 gene to induce osteogenic differentiation and mineralization of vascular smooth muscle cells. J Biol Chem. 2011;286(21):19138–19148. doi:10.1074/jbc.M110.175786
14. Agatston AS, Janowitz WR, Hildner FJ, Zusmer NR, Viamonte M, Detrano R. Quantification of coronary artery calcium using ultrafast computed tomography. J Am Coll Cardiol. 1990;15(4):827–832. doi:10.1016/0735-1097(90)90282-T
15. Ding X, Terzopoulos D, Diaz-Zamudio M, Berman DS, Slomka PJ, Dey D. Automated pericardium delineation and epicardial fat volume quantification from noncontrast CT. Med Phys. 2015;42(9):5015–5026. doi:10.1118/1.4927375
16. Mondragón-García A, Luna-Luna M, Flores-Castillo C, et al. Atorvastatin and fenofibrate exert opposite effects on the vascularization and characteristics of visceral adipose tissue in New Zealand white rabbits. J Cardiovasc Pharmacol Ther. 2019;24(6):559–566. doi:10.1177/1074248419838517
17. Bostrom K, Watson KE, Horn S, Wortham C, Herman IM, Demer LL. Bone morphogenetic protein expression in human atherosclerotic lesions. J Clin Invest. 1993;91(4):1800–1809. doi:10.1172/JCI116391
18. Hirota S, Imakita M, Kohri K, et al. Expression of osteopontin messenger RNA by macrophages in atherosclerotic plaques. A possible association with calcification. Am J Pathol. 1993;143(4):1003–1008.
19. Heymann MF, Herisson F, Davaine JM, et al. Role of the OPG/RANK/RANKL triad in calcifications of the atheromatous plaques: comparison between carotid and femoral beds. Cytokine. 2012;58(2):300–306. doi:10.1016/j.cyto.2012.02.004
20. Shao JS, Cai J, Towler DA. Molecular mechanisms of vascular calcification: lessons learned from the aorta. Arterioscler Thromb Vasc Biol. 2006;26(7):1423–1430. doi:10.1161/01.ATV.0000220441.42041.20
21. Mikhaylova L, Malmquist J, Nurminskaya M. Regulation of in vitro vascular calcification by BMP4, VEGF and Wnt3a. Calcif Tissue Int. 2007;81(5):372–381. doi:10.1007/s00223-007-9073-6
22. Cherian S, Lopaschuk GD, Carvalho E. Cellular cross-talk between epicardial adipose tissue and myocardium in relation to the pathogenesis of cardiovascular disease. Am J Physiol Endocrinol Metab. 2012;303(8):E937–E949. doi:10.1152/ajpendo.00061.2012
23. Gruzdeva OV, Akbasheva OE, Dyleva YA, et al. Adipokine and cytokine profiles of epicardial and subcutaneous adipose tissue in patients with coronary heart disease. Bull Exp Biol Med. 2017;163(5):608–611. doi:10.1007/s10517-017-3860-5
24. Iacobellis G, Malavazos AE, Corsi MM. Epicardial fat: from the biomolecular aspects to the clinical practice. Int J Biochem Cell Biol. 2011;43(12):1651–1654. doi:10.1016/j.biocel.2011.09.006
25. Gustafson B, Smith U. The WNT inhibitor Dickkopf 1 and bone morphogenetic protein 4 rescue adipogenesis in hypertrophic obesity in humans. Diabetes. 2012;61:1217–1224. doi:10.2337/db11-1419
26. Gustafson B, Hammarstedt A, Hediazifar S, et al. BMP4 and BMP antagonists regulate human white and beige adipogenesis. Diabetes. 2015;64(5):1670–1681. doi:10.2337/db14-1127
27. Guiu-Jurado E, Unthan M, Böhler N, et al. Bone morphogenetic protein 2 (BMP2) may contribute to partition of energy storage into visceral and subcutaneous fat depots. Obesity. 2016;24(10):2092–2100. doi:10.1002/oby.21571
28. Ciceri P, Elli F, Cappelletti L, et al. Osteonectin (SPARC) expression in vascular calcification: in vitro and ex vivo studies. Calcif Tissue Int. 2016;99(5):472–480. doi:10.1007/s00223-016-0167-x
29. Hao H, Hirota S, Ishibashi-Ueda H, Kushiro T, Kanmatsuse K, Yutani C. Expression of matrix Gla protein and osteonectin mRNA by human aortic smooth muscle cells. Cardiovasc Pathol. 2004;13(4):195–202. doi:10.1016/j.carpath.2004.03.607
30. Wolak T. Osteopontin - a multi-modal marker and mediator in atherosclerotic vascular disease. Atherosclerosis. 2014;236(2):327–337. doi:10.1016/j.atherosclerosis.2014.07.004
31. Jono S, Peinado C, Giachelli CM. Phosphorylation of osteopontin is required for inhibition of vascular smooth muscle cell calcification. J Biol Chem. 2000;275(26):20197–20203. doi:10.1074/jbc.M909174199
32. Jiménez-Corona AE, Pérez-Torres A, Mas-Oliva J, Moreno A. Effect of osteopontin, chondroitin sulfates (B, C), and human serum albumin in the crystalization behavior of hydroxyapatite in agarose and silica hydrogels. Cryst Growth Des. 2008;8:1335–1339. doi:10.1021/cg7011414
33. Sovová M, Sovová E, Zapletalová J, et al. [Epicardial fat and osteoprotegerin - does a mutual relation exist? Pilot study]. Vnitrni Lekarstvi. 2018;64(4):343–346.
34. Rutkowski JM, Stern JH, Scherer PE. The cell biology of fat expansion. J Cell Biol. 2015;208(5):501–512. doi:10.1083/jcb.201409063
35. Krzanowski M, Krzanowska K, Dumnicka P, et al. Elevated circulating osteoprotegerin levels in the plasma of hemodialyzed patients with severe artery calcification. Ther Apher Dial. 2018;22(5):519–529. doi:10.1111/1744-9987.12681
36. Hosbond SE, Poulsen TS, Diederichsen AC, Nybo M, Rasmussen LM, Mickley H. Osteoprotegerin as a marker of atherosclerosis: a systematic update. Scand Cardiovasc J. 2012;46(4):203–211. doi:10.3109/14017431.2012.685491
37. Bennett BJ, Scatena M, Kirk EA, et al. Osteoprotegerin inactivation accelerates advanced atherosclerotic lesion progression and calcification in older ApoE-/- mice. Arterioscler Thromb Vasc Biol. 2006;26(9):2117–2124. doi:10.1161/01.ATV.0000236428.91125.e6
38. Kawabata T, Otsuka T, Fujita K, et al. Suppression by HSP90 inhibitors of BMP‑4‑stimulated osteoprotegerin synthesis in osteoblasts: attenuation of p70 S6 kinase. Mol Med Rep. 2017;16(6):8507–8512. doi:10.3892/mmr.2017.7639
39. Isoda K, Nishikawa K, Kamezawa Y, et al. Osteopontin plays an important role in the development of medial thickening and neointimal formation. Circ Res. 2002;91(1):77–82. doi:10.1161/01.RES.0000025268.10302.0C
40. Abedin M, Tintut Y, Demer LL. Vascular calcification: mechanisms and clinical ramifications. Arterioscler Thromb Vasc Biol. 2004;24(7):1161–1170. doi:10.1161/01.ATV.0000133194.94939.42
41. Lee D. Vascular calcification: inducers and inhibitors. Mater Sci Eng B. 2011;176:1133–1141. doi:10.1016/j.mseb.2011.06.011
42. Aitken-Buck HM, Moharram M, Babakr AA, et al. Relationship between epicardial adipose tissue thickness and epicardial adipocyte size with increasing body mass index. Adipocyte. 2019;8(1):412–420. doi:10.1080/21623945.2019.1701387
43. Akbas EM, Hamur H, Demirtas L, et al. Predictors of epicardial adipose tissue in patients with type 2 diabetes mellitus. Diabetol Metab Syndr. 2014;6:55. doi:10.1186/1758-5996-6-55
44. Spiroglou SG, Kostopoulos CG, Varakis JN, Papadaki HH. Adipokines in periaortic and epicardial adipose tissue: differential expression and relation to atherosclerosis. J Atheroscler Thromb. 2010;17(2):
 © 2020 The Author(s). This work is published and licensed by Dove Medical Press Limited. The full terms of this license are available at https://www.dovepress.com/terms.php and incorporate the Creative Commons Attribution - Non Commercial (unported, v3.0) License.
By accessing the work you hereby accept the Terms. Non-commercial uses of the work are permitted without any further permission from Dove Medical Press Limited, provided the work is properly attributed. For permission for commercial use of this work, please see paragraphs 4.2 and 5 of our Terms.
© 2020 The Author(s). This work is published and licensed by Dove Medical Press Limited. The full terms of this license are available at https://www.dovepress.com/terms.php and incorporate the Creative Commons Attribution - Non Commercial (unported, v3.0) License.
By accessing the work you hereby accept the Terms. Non-commercial uses of the work are permitted without any further permission from Dove Medical Press Limited, provided the work is properly attributed. For permission for commercial use of this work, please see paragraphs 4.2 and 5 of our Terms.