")
Back to Journals » Open Access Journal of Sports Medicine » Volume 10
Bone health of middle-aged and older surfers
Authors Simas V , Hing WA, Rathbone E , Pope R , Beck BR , Climstein M
Received 17 March 2019
Accepted for publication 3 August 2019
Published 6 September 2019 Volume 2019:10 Pages 123—132
DOI https://doi.org/10.2147/OAJSM.S209043
Checked for plagiarism Yes
Review by Single anonymous peer review
Peer reviewer comments 2
Editor who approved publication: Prof. Dr. Andreas Imhoff
Vini Simas1, Wayne A Hing1,2, Evelyne Rathbone3, Rodney Pope4, Belinda R Beck5,6, Mike Climstein1,7,8
1Water Based Research Unit, Bond Institute of Health and Sport, Faculty of Health Sciences and Medicine, Bond University, Gold Coast, QLD, Australia; 2Department of Physiotherapy, Faculty of Health Sciences and Medicine, Bond University, Gold Coast, QLD, Australia; 3Faculty of Health Science and Medicine, Bond University, Gold Coast, QLD, Australia; 4School of Community Health, Charles Sturt University, Albury, NSW, Australia; 5School of Allied Health Sciences, Griffith University, Gold Coast, QLD, Australia; 6The Bone Clinic, Coorparoo, Brisbane, QLD, Australia; 7School of Health and Human Sciences, Southern Cross University, Gold Coast, QLD, Australia; 8Exercise Health and Performance Faculty Research Group, Faculty of Health Sciences, The University of Sydney, Lidcombe, NSW, Australia
Correspondence: Vini Simas
Water Based Research Unit, Bond Institute of Health and Sport, Faculty of Health Sciences and Medicine, Bond University, 2 Promethean Way, Robina, Gold Coast, QLD 4226, Australia
Tel +61 075 595 4186
Email [email protected]
Purpose: Given the lack of research investigating surfing and bone health, we aimed to assess the bone mineral density (BMD) of middle-aged and older surfers.
Patients and methods: In a cross-sectional observational design, we compared a group of middle-aged and older surfers to a group of non-surfers, age- and sex-matched controls. Participants were males, aged between 50 and 75 years. Volunteers were assessed for body mass index, bone-specific physical activity questionnaire (BPAQ) scores, daily calcium intake, and alcohol intake. Primary outcomes included BMD at the femur and lumbar spine (LS), and T-score, assessed via dual-energy X-ray absorptiometry. Bone biomarkers were also analyzed.
Results: A total of 104 participants (59 surfers and 45 controls) were assessed. Groups were similar with regards to all demographic characteristics except for percentage of lean mass (higher in surfers, mean difference [MD] +2.57%; 95% CI 0.05–5.09; p=0.046) and current BPAQ score (lower in surfers; MD −0.967; 95% CI −0.395 to −1.539; p=0.001). Surfers had a mean surfing experience of 41.2 (SD ±11.8) years and mean surfing exposure of 26.9 (SD ±15.0) hours/month. Controls were divided into two groups, according to their main physical activity: weight-bearing/high intensity (WBHI) and non-weight-bearing/low intensity (NWBLI). When compared to NWBLI controls, surfers had higher LS BMD (MD +0.064; 95% CI 0.002–0.126; p=0.041) and higher T-score (MD +0.40; 95% CI 0.01–0.80; p=0.042); however, surfers had a lower T-score than the WBHI group (MD −0.52; 95% CI −0.02 to −1.0; p=0.039). No other differences were found between groups.
Conclusion: The findings of this study support our hypothesis that regular surfing may be an effective physical activity for middle-aged and older men to decrease bone deterioration related to aging, as we identified positive results for surfers in relation to primary outcomes.
Keywords: surfing, bone mineral density, osteoporosis, DXA, preventive medicine, sports medicine
Introduction
A physically active lifestyle is recognized as a preventative strategy for age-related bone deterioration that can lead to osteopenia and osteoporosis. A vast variety of exercise modes has been evaluated; however, not all types of exercise promote positive effects on bones.1,2 For instance, walking, swimming, and cycling are associated with little, no, or even a negative effect on bone health.3–5
Surfing is a popular recreational activity and competitive sport. It is also one of the fastest growing sports in the world with participants estimated at 37 million worldwide in 2012,6 a statistic which has more than doubled if compared to the 18 million surfers estimated in 2002.7 Surfing is recognized as a quasi-weight bearing (ie, having a partial load-bearing component) aquatic-based physical activity.8,9 Time-motion analysis of recreational surfers has indicated that surfers typically spend only 3 mins standing up (ie. weight-bearing) on the board (ie, actually surfing) in a 60-min surf session.8 Such a short period of weight-bearing may not apply sufficient stimulus for positive bone remodeling. It could, therefore, be expected that participants in this aquatic activity may have an imbalance between osteoclastic (bone resorption) and osteoblastic (bone production) activity, resulting in degradation of bone mineral density (BMD) and consequently exposing surfers to premature development of osteoporosis and increased risk of fractures.
Nonetheless, surfing requires a wide range of physical qualities in order to paddle-out, pass through waves, “catch” a wave, balance on the surfboard, and execute and complete surfing maneuvers. It is possible that these additional actions, requiring considerable muscle exertions, enhance the stimulus to bone applied during a surfing session. Only one study has previously investigated bone health in surfers,10 and findings suggested that surfing may be advantageous for bone. However, this study had a small sample size and did not utilize standard clinical site testing (ie, femur and lumbar spine [LS]) for bone health; however, it suggests more data are required to examine the association.
Therefore, the bone health of surfers is unclear, as there is no consensus on the effect of long-term surfing on BMD. Additionally, should preventive measures and recommendations to reduce the risk of bone deterioration be in place for this cohort? Consequently, bone health of middle-aged and older surfers should be a principal concern for clinicians. The aim of the current study, therefore, was to compare femur and LS BMD of middle-aged and older long-term male surfers with non-surfers in a larger sample than previously examined. The results will begin to inform clinical decisions regarding exercise recommendations for the prevention of osteopenia and osteoporosis in older men.
Methods
Study design
This research used a cross-sectional observational design to compare middle-aged and older male surfers to non-surfing, age- and sex-matched controls. The study was approved by the Bond University Human Research Ethics Committee (BUHREC 15221).
Participants
Surfers were recruited through advertising in a local paper and from local boardrider clubs in the Gold Coast (GC) area (city of GC, Queensland, Australia). Additional support was obtained from surfing magazines, websites, and local surf shops in the GC area. Controls were recruited through advertisements at local community libraries, cafes, and clubs.
Eligibility criteria
Participants considered to be included in the study were males, aged between 50 and 75 years. Surfers were defined as those individuals who had been surfing for the past 15 years and were currently surfing regularly (at least twice a week). Surfers were excluded if they were currently participating in extensive resistance exercise, weight training or high impact activities, or if they were employed in or have been previously employed in a manual type of employment that would have a benefit for bone health. Participants in the control group were included if they were not surfers and did not have a history of surfing for more than 10 years.
For both groups, participants were excluded if they: had an existing diagnosis of osteopenia, osteoporosis, or any other medical condition known to affect bone health; had artificial bone implants (such as a hip replacement); had a history of hormone therapy; used any medication that could possibly affect bone density; were a current or past smokers; had a body mass index (BMI) over 30 kg/m2 or under 21 kg/m2; or had undergone a radiological examination which requires contrast dye within 7 days prior to the study, as perfusion imaging with dye is known to significantly affect BMD results.
All individuals who passed the initial screening were invited to participate in the study. The research took place at the Water Based Research Unit (WBRU), located at the Bond University Institute of Health and Sport (GC, Queensland, Australia). An explanatory statement and informed consent form were given to all participants upon arrival at the WBRU. Prior to providing written informed consent, all participants had the opportunity to ask any questions about the research and any of the testing procedures.
Procedures
At the WBRU, participants had their height and body mass measured and then completed two self-administered questionnaires. The bone-specific physical activity questionnaire (BPAQ)11 quantified the participants’ lifetime physical activity of relevance to bone, and it was calculated for current (cBPAQ), past (pBPAQ), and total (tBPAQ) scores. The second survey quantified current calcium intake, utilizing the calcium calculator from the International Osteoporosis Foundation (IOF) website.12 A third questionnaire assessed their current alcohol intake, family history of osteoporosis, and surfing characteristics (the latter specifically for surfers). Participants then underwent a dual-energy X-ray absorptiometry (DXA) scan at the bone health and body composition (BC) laboratory, for BMD analysis of the non-dominant hip and LS. Additionally, BC was assessed via a total body scan.
Following the DXA scans, a randomly allocated participant subsample provided a blood sample for analysis of two bone turnover biomarkers: serum carboxy-terminal collagen crosslinks (sCTx) and serum procollagen type 1 N-terminal propeptide (sP1NP). A standard blood test was collected and analyzed by a commercial pathology laboratory (Sullivan Nicolaides Pathology, GC, Queensland, Australia), for this purpose.
Outcome measures
Height, mass, and BMI
Participants were requested to remove their shirt, slacks, shoes, and socks to enable assessment of their height, which was measured using a stadiometer (Harpenden, Holtain Limited, Crymych, UK) to the nearest 0.01 m. Mass was then measured to the nearest 0.1 kg using a standard digital weighing scale (WM202, Wedderburn, Bilinga, Australia). BMI was then calculated using the traditional method: BMI=weight/height2 (kg/m2).
Physical activity
The BPAQ11 was used to capture past physical activity of relevance to bone across their whole lifetime, and specific to the previous 12 months. Physical activity was recorded by type and age when they participated, and the number of years they participated were recorded for each type. Information collected was entered into the BPAQ analysis software (freely available for download, http://www.fithdysign.com/BPAQ), generating current (cBPAQ), past (pBPAQ), and total (tBPAQ) physical activity scores (unitless) for each participant.
Calcium
Daily calcium intake was estimated using the IOF dietary questionnaire and the calcium calculator on the IOF website.12 Results were recorded as percentage of recommended daily intake (%RDI) according to guidelines of Osteoporosis Australia.13
Alcohol
Participants were asked about the number of standard (std) drinks they normally consume in a typical week, as excessive amounts of alcohol are known to negatively affect bone health.2,14
BC, BMD and T-score
A DXA scan (General Electric, GE, Lunar Prodigy, Madison, WI, USA) was conducted for each participant in order to determine the primary outcomes (femur BMD, LS BMD, and T-score) and BC (fat and lean mass). The scanner was calibrated each morning prior to any scans using a manufacturer’s “phantom” (quality assurance and quality control procedures). Prior to all DXA scans, participants were required to complete a short health questionnaire, to determine if for any reason the DXA scan should not take place. To avoid falsely elevated bone density, all metal objects were removed and participants were required to wear only light clothing. Participants were positioned according to the site that was to be measured. For the analysis of the LS, the participant lay supine on the scan bed, centered and straight, ensuring hips and shoulders were square, with the legs flexed over a support pad (supplied by the manufacturer), to create an angle of 60° to 90° between the table top and the participant’s thighs. For the analysis of the hip (unilateral, non-dominant side), the participant lay supine with the legs in internal rotation (approximately 15°) and slight abduction. This positioning is important in order to minimize the visibility of the lesser trochanter and to maintain the femoral axis straight. Estimates of BC were obtained from the total body scan. For the total body scan, the participant’s head was positioned directly below the horizontal line running across the top of the scan table. The entire participant’s body was positioned within the lateral region or interest lines on the table. BC was analyzed to determine percentage of lean mass (%lean mass) and fat mass (%fat mass). Results were analyzed using the commercial software provided with the DXA machine (enCORE software, version 17, GE, Lunar Prodigy, Madison, WI, USA).
The DXA scan yielded BMD (g/cm2) and T-score of the femur and LS, based on the regions of interest recommended by the International Society for Clinical Densitometry (ISCD) official position.15 The T-score recorded was the lowest result obtained between the two regions and was used to classify the participant according to the WHO criteria for the diagnosis of osteoporosis (T-score greater than −1.0 is considered normal, T-score between −1.0 and −2.5 is considered osteopenia, and T-score below −2.5 is considered osteoporosis).16
Intra-tester reliability
Before conducting the study, intra-rater reliability and precision of DXA in evaluating BC and BMD was assessed using a sample of 30 individuals. Assessment of BC and BMD in the LS, femoral neck and total hip yielded measurements with high intra-rater reliability, and the results were published recently.17,18
Surfing group characteristics
Surfers were assessed with regard to surfing-specific characteristics, which included: surfing ability, as measured by the Hutt scale;19 surfing experience in years; number of sessions per month; number of hours per session; surfing exposure (number of hours per session multiplied by number of sessions per month); stance while surfing (ie, “regular” if left foot forward or “goofy” if right foot forward); and type of surfboard (short, mini-mal/funboard or longboard).
Biochemical markers of bone turnover
Bone turnover markers sCTx (ng/L) and sP1NP (µg/L) were collected and analyzed via serum blood at a commercial pathology laboratory in a randomized subsample of participants. To date, the best marker for bone resorption is CTx,20 as it is primarily associated with osteoclastic activity. The best marker for bone formation is P1NP, due to its wide usage and high utility for fracture prediction.20,21 P1NP also has a shorter response time than other popular bone formation markers.22 In addition to this, these biomarkers have recently been assessed in older surfers.10
Data analysis
Initially, continuous variables were tested for normality by assessing skewness, kurtosis, Q-Q plots, and the Kolmogorov–Smirnov test, and were summarized using means and SD, if normally distributed. Independent samples t-tests were performed on normally distributed variables to assess differences in mean scores between the surfing and control groups, for each of the outcome measures. For non-normally distributed variable where the skewness could not be corrected through transformations, Mann–Whitney-U tests were used to assess differences between the groups for each of the outcome measures. Categorical outcomes, specifically diagnosis of osteopenia or osteoporosis based on the T-score, were summarized using counts (n) and percentages (%); Chi-square test of independence was used to assess any difference between groups. Correlation analyses were also conducted between participant characteristics and outcome variables using the parametric Pearson’s product-moment correlation, or the non-parametric Spearman’s rank-order correlation test, depending on the data distributions. The one-way multivariate analysis of variance (MANOVA) was used to determine whether there were any differences between types of physical activity in relation to the continuous primary outcomes. Statistically significant results were followed-up with univariate one-way ANOVA for each outcome variable. Multiple regression analyses were used to examine the relationships between BPAQ scores and the outcome variables. When required, a log transformation was performed. The level of significance, alpha, was set apriori at 0.05 for all statistical tests. Results are presented as mean±SD unless otherwise stated. All analyses were performed with SPSS statistical software (Version 25.0 for Windows, SPSS Inc., Chicago IL, 2017).
Results
A total of 104 participants were eligible to participate in the study and were divided into two groups. Group 1 (surfers) consisted of 59 surfers, and group 2 (controls) consisted of 45 controls.
Surfers had a mean surfing experience of 41.2 years (SD±11.8), surfing on average 16 times per month (mean 16.1±7.3), each session lasting on average 1.7 hrs (mean 1.7±0.4), with a mean surfing exposure of 26.9 hrs/month (SD±15.0). Over 80% of the surfers considered themselves to have advanced surfing skills (Hutt rating of 6 or more), 54.2% used a shortboard, and 43% had a “regular” stance.
Participants’ demographic characteristics are shown in Table 1. Groups were similar (ie, there were no significant differences between them) with regards to most of the demographic characteristics and measures of physical activity, BMD and BC (age, BMI, number of std drinks, calcium %RDI, %fat mass, pBPAQ score, tBPAQ score, femur BMD, LS BMD, and T-score). However, surfers had higher %lean mass (mean difference [MD] +2.57%; 95% CI 0.05–5.09%; p=0.046) and lower cBPAQ score (MD −0.967; 95% CI 0.395–1.539; p=0.001). On average, the lowest T-score was found at the femur for both groups (surfing group mean −0.6±0.8; control group mean −0.7±0.8; p=0.506). None of the participants were classified as having osteoporosis, based upon their T-scores; however, 41.3% of all participants were classified as having osteopenia (42.2% controls, 40.7% surfers), with no statistically significant difference between the groups in this regard ( =0.025, p=0.874).
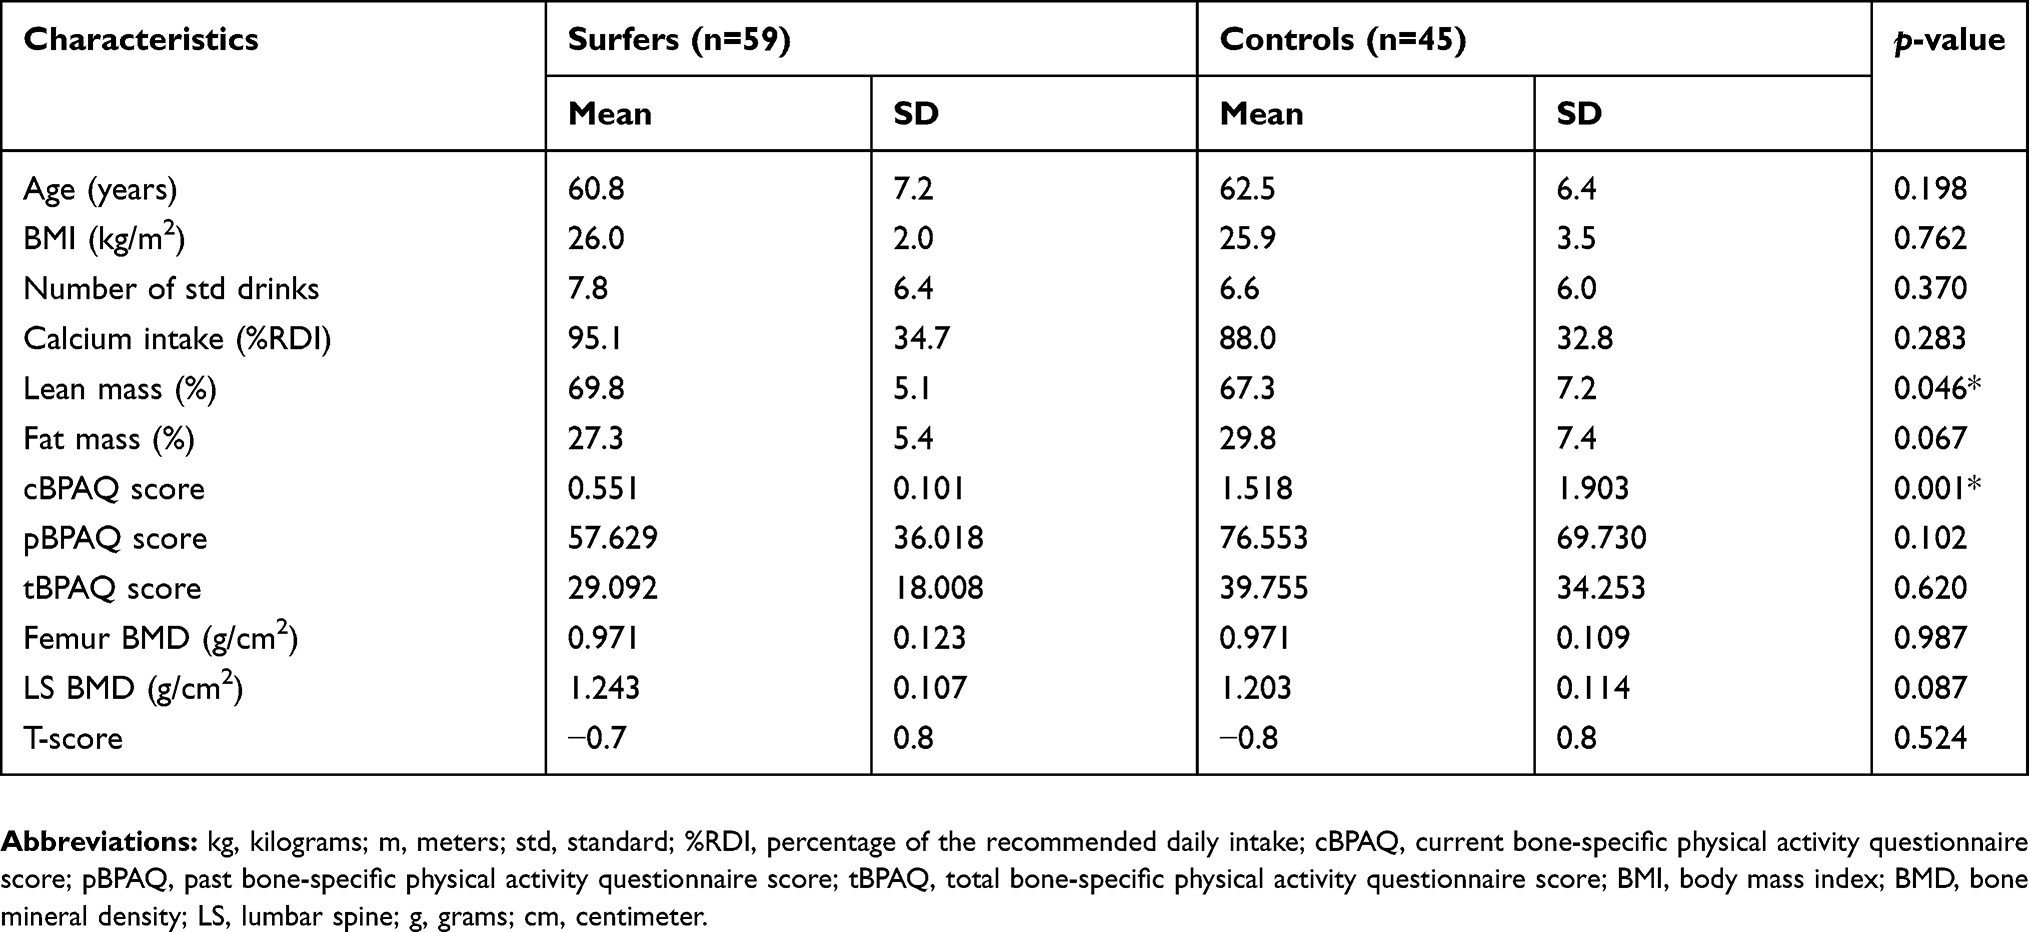 |
Table 1 Demographic and other characteristics |
No correlations were found between the primary outcomes (femur BMD, LS BMD, and T-score) and the demographic characteristics age, calcium intake (%RDI), and number of standard drinks. Likewise, surfing-specific characteristics (surfing ability, surfing experience, number of sessions per month, number of hours per session, surfing exposure, surfing stance, and type of surfboard) were not significantly associated with the primary outcomes. The relationships between scores on the BPAQ components and the outcomes BMD and T-score are shown in Table 2. For the surfing group, significant small positive relationships were found between femur BMD and both pBPAQ and tBPAQ scores (r 0.299, p<0.05 and r 0.299, p<0.05, respectively). Additionally, significant moderate positive relationships were found between T-score and both pBPAQ and tBPAQ scores (r 0.326 p<0.05 and r 0.326, p<0.05, respectively), but not between LS BMD and any of the components of the BPAQ. There was no statistically significant correlation between cBPAQ scores and the outcomes in surfers. When both groups were analyzed in combination, significant moderate positive relationships were found between femur BMD and both pBPAQ and tBPAQ scores (r 0.386, p<0.01 and r 0.385, p<0.01, respectively), and also between T-score and both pBPAQ and tBPAQ scores (r 0.430 p<0.01 and r 0.436, p<0.01, respectively). Similarly, a small positive relationship was found between LS BMD and both pBPAQ and tBPAQ scores (r 0.209 p<0.05 and r 0.221, p<0.05, respectively). By contrast, cBPAQ scores did not correlate with the primary outcomes when all participants were analyzed together.
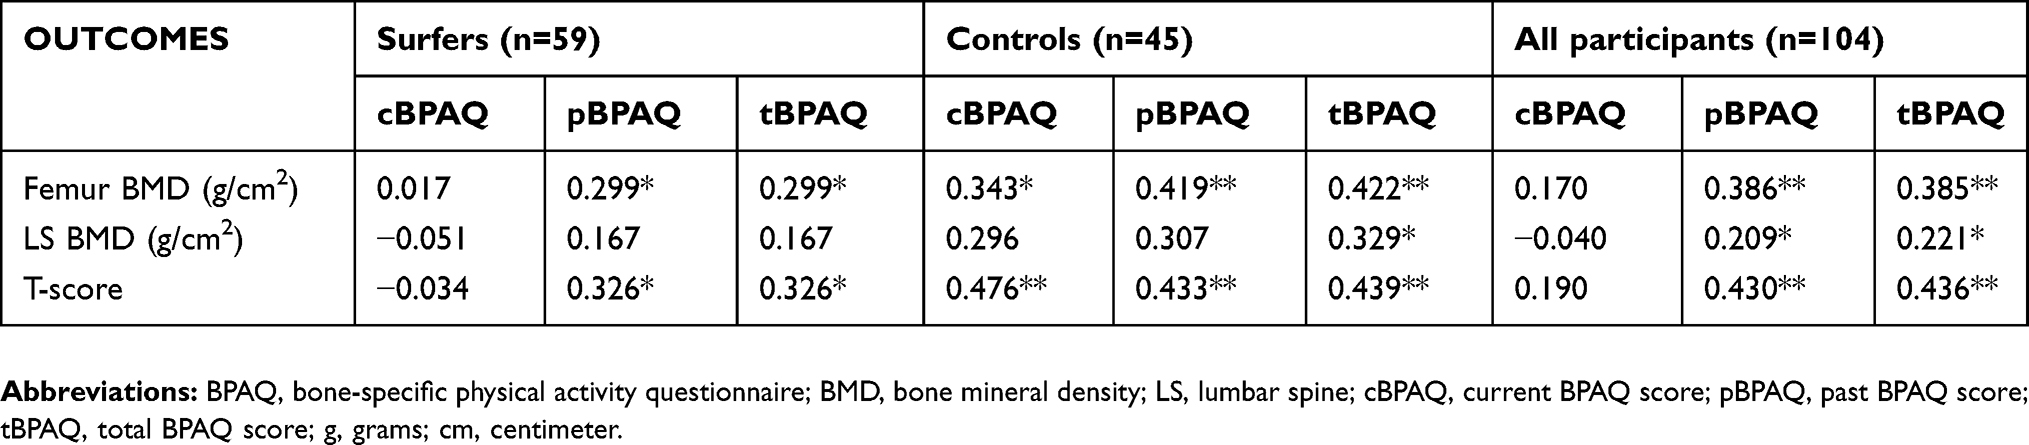 |
Table 2 Correlations between scores from BPAQ components and the outcomes femur BMD, LS BMD, and T-score |
The control group was composed of physically active individuals. Walking was the most common exercise (15 individuals), followed by cycling (14 individuals), running (8 individuals), swimming (3 individuals), resistance training (3 individuals), soccer (1 individual), and triathlon (1 individual). Participants were grouped according to their main current physical activity into three groups: surfing (n=59), non-weight-bearing/low intensity (NWBLI, n=32), and weight-bearing/high intensity (WBHI, n=13) as shown in Table 3. A Chi-square test of independence was conducted to examine the relationship between type of physical activity (surfing, WBHI, and NWBLI) and diagnosis of osteopenia based on the participants’ T-score. There was a statistically significant association between type of physical activity and diagnosis of osteopenia ( =13.464, p=0.001). The association was moderately strong, Cramer’s V=0.36.23 The group NWBLI had the highest prevalence of osteopenia (59.4%) when compared to surfing (40.7%) and WBHI (0%). A one-way MANOVA was conducted to determine if the dependent variables femur BMD, LS BMD, and T-score were different for the three different types of physical activity (surfing, WBHI, and NWBLI). Descriptive statistics summarizing the results for each of the primary outcomes in the physical activity groups are shown in Table 4. There were statistically significant differences between the groups reflecting type of physical activity in the combined dependent variables (femur BMD, LS BMD, and T-score), F(6, 188)=3.124, p=0.006; Pillai’s Trace=0.18; partial η2=0.091. Follow-up univariate ANOVAs showed that femur BMD (F[2, 95]=4.310, p=0.016; partial η2=0.083), LS BMD (F[2, 95] =3.960, p=0.022; partial η2=0.077), and T-score (F[2, 95]=7.40, p=0.001; partial η2=0.135) all differed significantly between the different physical activity groups. The primary outcomes improved from the NWBLI group to surfing, and from surfing to WBHI group, in that order.
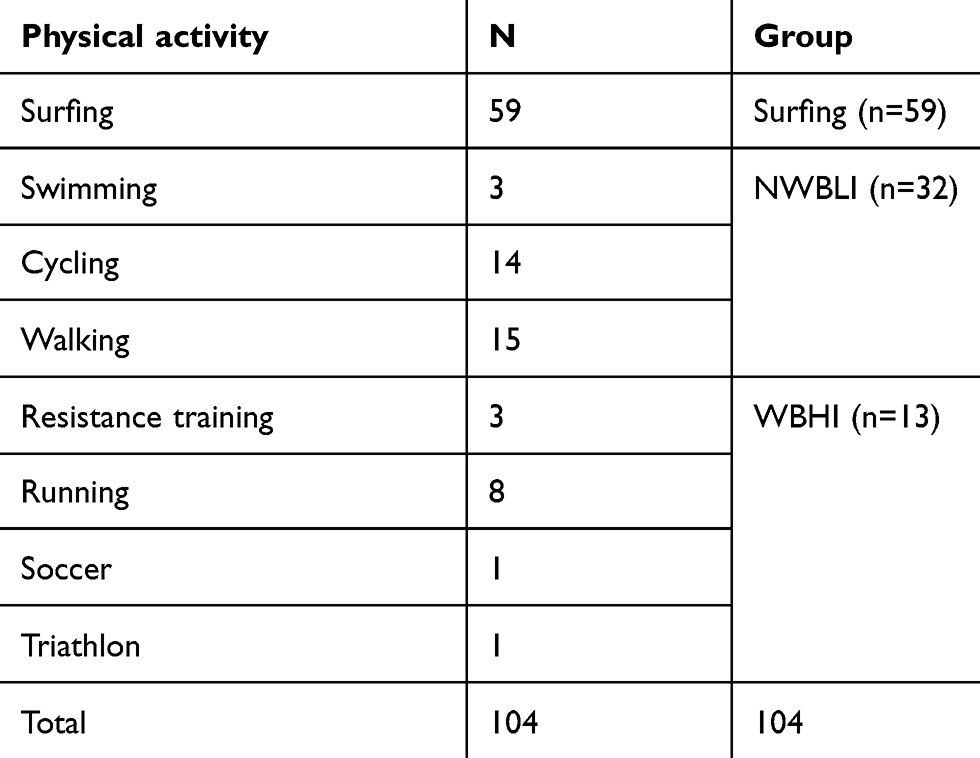 |
Table 3 Participants’ main current physical activity |
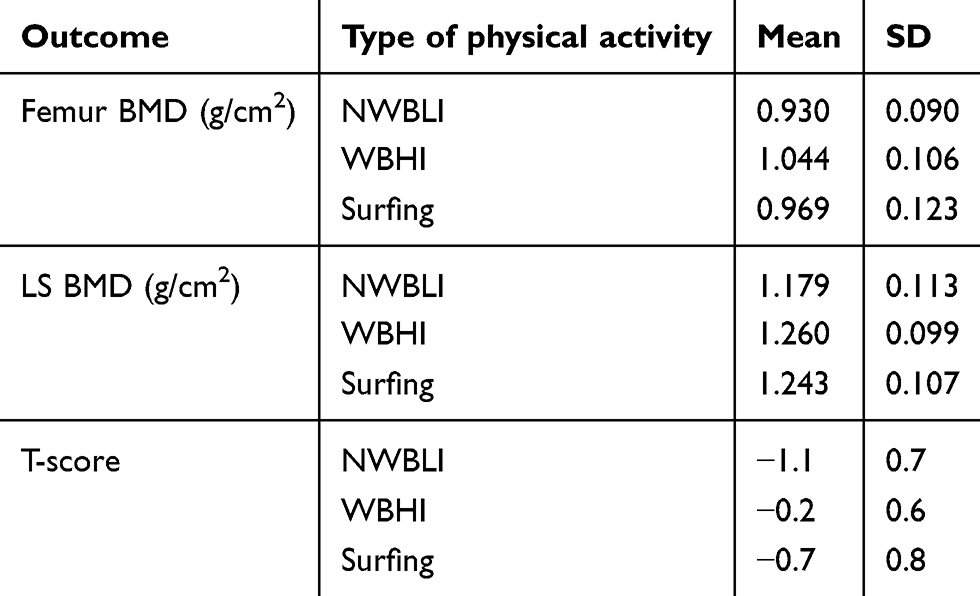 |
Table 4 Primary outcomes by type of physical activity |
Games-Howell post-hoc tests showed that for femur BMD, the WBHI group had a significantly higher mean than the NWBLI group (MD +0.114; 95% CI 0.025–0.203; p=0.011); however, no differences were found between the WBHI and surfing groups or between the surfing and NWBLI groups. For LS BMD, surfers had a significantly higher mean than the NWBLI group (MD +0.064; 95% CI 0.002–0.126; p=0.041), but no differences were found between surfing and WBHI or between WBHI and NWBLI. Lastly, for T-score, the WBHI group had a significantly higher mean than the NWBLI group (MD +0.918; 95% CI 0.389–1.446; p=0.001) and surfing (MD +0.516; 95% CI 0.024–1.009; p=0.039), and surfers had a significantly higher mean than the NWBLI group (MD +0.401; 95% CI 0.012–0.791; p=0.042). MD and 95% CI are shown in Table 5.
 |
Table 5 One-way MANOVA post-hoc analyses: mean differences in outcomes between activity types |
Multiple regression analyses were run to predict the primary outcomes from the cBPAQ, pBPAQ, and tBPAQ scores. The components of the BPAQ statistically significantly predicted T-score (F[3, 100]=8.048, p<0.0005) and femur BMD (F[3, 100]=5.688, p=0.001), but not LS BMD (F [3, 94]=2.036, p=0.114). For T-score, the R2 value for the overall model was 19.4% with an adjusted R2 of 17.0%, and for femur BMD the R2 value for the overall model was 14.6% with an adjusted R2 of 12.0%. Predictions were made to determine an average score required for each of the components of the BPAQ in order to result in a T-score within the lower bound of the normal range. Results revealed that a cBPAQ score of 0.969, a pBPAQ score of 68.817, and a tBPAQ of 33.705 would result in a mean T-score of −0.7 (95% CI, −0.8 to −0.6). A hierarchical multiple regression was run to determine whether the addition of %lean mass and type of physical activity improved the prediction of the primary outcomes over and above the components of BPAQ. Neither of these additional predictors led to a statistically significant improvement in predicting femur BMD, LS BMD, or T-score (p>0.05).
A randomized sample of 20 individuals, 10 in each group, was selected for analysis of serum biomarkers of bone turnover (CTx and P1NP). The mean results for both groups were within normal range for both CTx and P1NP, with no significant difference between groups (Table 6).
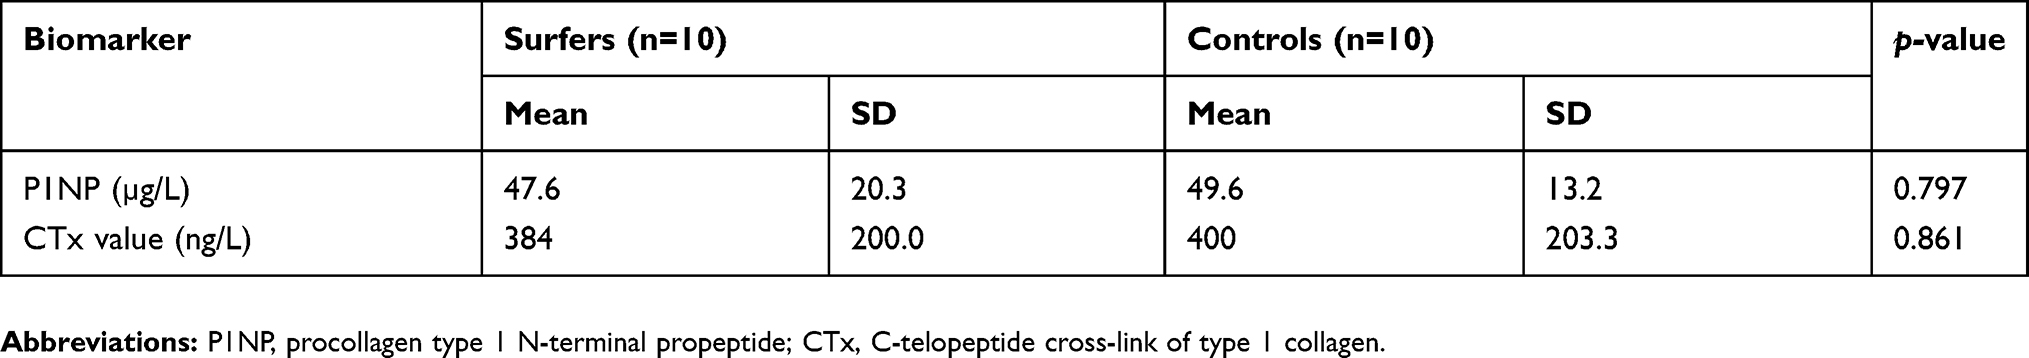 |
Table 6 Biochemical markers of bone turnover, mean and SD values by group |
Discussion
The primary goal of the present study was to assess the bone health of middle-aged and older male surfers and to compare the results with those from a control group comprised of age- and sex-matched active non-surfer individuals. To the best of our knowledge, this is the first study to investigate the bone health of middle-aged and older surfers by assessing the traditional clinical BMD sites (femur and LS), as recommended by the WHO16 and ISCD.15 The main findings of the present study support the hypothesis that surfing is associated with reduced age-related bone deterioration, as we identified positive results for surfers in relation to our primary outcomes (femur BMD, LS BMD, and T-score).
A strong relationship between exercise and bone health has been reported in the literature; however, different modalities of exercise have different effects on bone health. To date, the sport of surfing has not been adequately investigated in relation to its association with age-related bone loss. To address this gap, we recruited and compared a group of middle-aged and older surfers and a group of physically active individuals, who were non-surfers and age- and sex-matched, as controls. Demographic characteristics (Table 1) were similar between the groups, except for %lean mass and cBPAQ score. The cBPAQ score obtained from surfers was approximately one-third of the score obtained from individuals in the control group. This was expected as, consistent with our inclusion criteria, surfers included in the study could not be involved in any other type of physical activity. Additionally, surfing only receives a small score in the BPAQ, due to its relatively small peak ground reaction force. This may explain the smaller scores (although not significantly different) obtained by surfers in the pBPAQ and tBPAQ when compared to control participants, as surfing was the main physical activity for the majority of the surfers during their lifetime.
Individuals in the control group were engaged in different exercise modalities, and these activities were grouped based on their weight-bearing/intensity characteristics in two different groups: NWBLI (eg, swimming, cycling, and walking) and WBHI (eg, resistance training, running, soccer, triathlon) (Table 3). The NWBLI group had the lowest values for all three primary outcomes (Table 4). Additionally, surfers had significantly higher LS BMD and T-scores when compared to the NWBLI group; however, surfers had a lower mean T-score than the WBHI group (Table 5).
The current study found a prevalence of osteopenia of 41.3%, with no difference between surfing and control groups. This prevalence rate is lower than that previously reported for the Australian general population, which was 55% for men.24 However, this difference is likely to be mainly due to the exclusion of men with known osteopenia or osteoporosis from the study, so they would not have responded to invitations to participate if they knew they suffered from one of these conditions and understood it was an exclusion criterion. The same guidelines reported a prevalence of 3% of osteoporosis in men; however, none of the individuals in our study met the diagnostic criteria for osteoporosis, though this again might be due to the exclusion of men with known osteoporosis from participation in the study.
There is a paucity of available literature on bone health in mature-aged male aquatic athletes and available studies do not report findings specific to osteopenia and osteoporosis.25,26 Velez et al3 investigated the effects of swimming on bone health in senior athletes (72.6 years ±6.8). They reported the percentage of osteopenia amongst the male swimmers ranged from 14% in the spine to 48% in the femoral neck and osteoporosis ranging from approximately 7.5% in the hip to 15% in the 1/3 distal radius. Leigey et al27 conducted a large-scale study into the bone health of 560 senior athletes (65.9 years +8.53) participating in 18 different sports in the National Senior Games (ie, Senior Olympics). Unfortunately, these investigators used calcaneal quantitative ultrasound to assess BMD which cannot report BMD in g/cm2 for comparison, neither did they report T-scores. However, 6.7% of the athletes (mixed sports) were deemed to be osteoporotic based upon reporting a prescribed osteoporosis specific medication.
It is nevertheless possible that the differences we observed in the prevalence of osteopenia and osteoporosis may also in part be explained by the fact that all participants in our study were currently physically active, particularly given that osteoporosis and osteopenia are often undiagnosed and some participants would conceivably not have known they had it at the time they volunteered to participate and would, therefore, still have been recruited. When results of the present study were analyzed according to the type of physical activity (ie, surfing, NWBLI, and WBHI), the surfing group had a prevalence of osteopenia of 40.7%, almost 20% lower than that for the NWBLI group (χ2(2)=13.464, p=0.001), and nearly 15% lower than that previously reported in the literature.24 This difference cannot be explained by the study exclusion criteria, since all participants, in both groups, were subject to those criteria.
With regard to BPAQ scores, when all participants were analyzed in combination, pBPAQ and tBPAQ scores were correlated to the primary outcomes (Table 2); however, no association was found between the outcomes and cBPAQ scores. When only the surfing group was analyzed, there was no correlation between scores on the three components of the BPAQ and LS BMD, but there was correlation between pBPAQ and tBPAQ scores and both femur BMD (small correlation) and T-score (moderate correlation). For the control group, there was a moderate correlation between all components of the BPAQ and the primary outcomes, except for between cBPAQ and pBPAQ scores and LS BMD. Similar findings were reported by Bolam et al,28 who analyzed a group of healthy middle-aged and older men and reported moderate correlations between scores on the three components of the BPAQ and femoral neck BMD; however, the authors did not find a significant correlation between BPAQ scores and LS BMD.
On average, surfers had over 40 years of experience in the sport, with more than 25 hrs per month of surfing exposure. These characteristics are in line with the findings of the previous study in surfers.10 The main difference is the type of board used by the participants. In the present study, more than 54% of the individuals used a shortboard, which is associated with a more dynamic performance, whereas all surfers in the previous study were longboarders. Even though surfing characteristics were not correlated with our primary outcomes, increased neuromuscular activation, associated with muscle force production, in order to control movements and posture during the different physical demands associated with the sport, may be considered important contributors to the positive findings revealed by our analyses in the surfing group. Hwang et al29 propose that repetitive forceful muscular contractions against the resistance of the water may have a beneficial effect on BMD. Given the surfers are paddling and then weight-bearing, this short-term, intense activity may act as a stimulus for bone development. Based on the results for the primary outcomes in the surfing group, it seems that the BPAQ may not accurately score the impact of the sport on bone health. This can be illustrated by the relatively low mean scores for the surfing group for all three components of the BPAQ (Table 1).
In the analysis of biochemical markers of bone turnover, we were able to include 20 participants in the analyses – 10 surfers and 10 controls. We failed to find a significant difference between the groups, most likely due to the small sample size, and therefore no assumptions can be made on this basis. The only previous study10 which also investigated bone health in mature-aged male surfers also reported no significant differences with regard to CTx (0.28 µg/L ±0.076) and P1NP (45.4 µg/L ±15.9).
The main strength of this study is its eligibility criteria, allowing better control of confounding factors (eg, medical conditions and medications known to affect BMD, smoking status, calcium, and alcohol intake, very low or very high BMI) that could potentially interfere with the results. However, limitations should be highlighted. Firstly, the study design does not allow us to infer cause and effect; secondly, the sample size was small, due to the strict eligibility criteria; lastly, we did not assess vitamin D, due to budget limitations. Therefore, findings of the present study should be interpreted with caution and cannot be extrapolated to all individuals.
Conclusion
The purpose of the current study was to determine the bone health of middle-aged and older surfers. Results were compared to those for a physically active, age- and sex-matched control group. Surfers have statistically higher BMD at the LS and higher T-scores when compared to individuals engaged in non-weight-bearing/low impact physical activities. Overall, this study strengthens the idea that surfing might be an effective exercise to decrease the rate of bone loss associated with aging. A natural progression of this work is to conduct a longitudinal analysis of the bone health in this population.
Disclosure
Dr Vini Simas was supported by an Australian Government Research Training Program Scholarship. The authors report no other conflicts of interest in this work.
References
1. Gomez-Cabello A, Ara I, Gonzalez-Aguero A, Casajus JA, Vicente-Rodriguez G. Effects of training on bone mass in older adults: a systematic review. Sports Med. 2012;42(4):301–325. doi:10.2165/11597670-000000000-00000
2. Florence R, Allen S, Benedict L, Compo R, Jensen A, Kalogeropoulou D, et al. In: Diagnosis and Treatment of Osteoporosis. 8th ed. Bloomington: Institute for Clinical Systems Improvement; 2013. pp. 1–87.
3. Velez NF, Zhang A, Stone B, Perera S, Miller M, Greenspan SL. The effect of moderate impact exercise on skeletal integrity in master athletes. Osteoporos Int. 2008;19(10):1457–1464. doi:10.1007/s00198-008-0590-6
4. Nichols JF, Rauh MJ. Longitudinal changes in bone mineral density in male master cyclists and nonathletes. J Strength Cond Res. 2011;25(3):727–734. doi:10.1519/JSC.0b013e3181c6a116
5. Ma D, Wu L, He Z. Effects of walking on the preservation of bone mineral density in perimenopausal and postmenopausal women: a systematic review and meta-analysis. Menopause. 2013;20(11):1216–1226. doi:10.1097/GME.0000000000000100
6. Moran KWJ. Surfing injuries requiring first aid in New Zealand, 2007-2012. Int J Aquatic Res Educ. 2013. 7:192–203.
7. Nathanson A, Haynes P, Galanis D. Surfing injuries. Am J Emerg Med. 2002;20(3):155–160.
8. Watsford M, Murphy A, Coutts A. Energy expenditure and time–motion analysis during recreational surfing. J Sci Med Sport. 2006;9:9. doi:10.1016/j.jsams.2006.12.018
9. Secomb JL, Sheppard JM, Dascombe BJ. Time-motion analysis of a 2 hr surfing training session. Int J Sports Physiol Perform. 2015;10(1):17–22. doi:10.1123/ijspp.2014-0002
10. Climstein M, Pollard Z, Furness J, Walsh J, McLellan C, Meerkin J. Effects of long-term surfing on bone health in mature-aged males. Int J Aquatic Res Educ. 2015;9(1):24–37. doi:10.1123/ijare.2014-0069
11. Weeks BK, Beck BR. The BPAQ: a bone-specific physical activity assessment instrument. Osteoporos Int. 2008;19(11):1567–1577. doi:10.1007/s00198-008-0606-2
12. Iofbonehealth.org. Calcium Calculator | International Osteoporosis Foundation [online]. 2015. Available from: http://www.iofbonehealth.org/calcium-calculator. Accessed Aug 6, 2019.
13. Osteoporosis Australia Medical & Scientific Advisory Committee. What you need to know about osteoporosis: medical guide. Osteoporosis Australia; 2014. Available from https://www.osteoporosis.org.au/sites/default/files/files/oa_medical_brochure_2nd_ed.pdf.
14. Cosman F, de Beur SJ, LeBoff MS, et al. Clinician’s guide to prevention and treatment of osteoporosis. Osteoporos Int. 2014;25(10):2359–2381. doi:10.1007/s00198-014-2794-2
15. Shepherd JA, Schousboe JT, Broy SB, Engelke K, Leslie WD. Executive summary of the 2015 ISCD position development conference on advanced measures from DXA and QCT: fracture prediction beyond BMD. J Clin Densitom. 2015;18(3):274–286. doi:10.1016/j.jocd.2015.06.013
16. World Health Organization (WHO) Study Group. Assessment of fracture risk and its application to screening for postmenopausal osteoporosis. Report of a WHO study group. World Health Organ Tech Rep Ser. 1994;843:1–129.
17. Persson C, Shiel F, Climstein M, Furness J. Does a novice technician produce results similar to that of an experienced DXA technician when assessing body composition and bone mineral density? Int J Sport Nutr Exerc Metab. 2019;29(4):435–440. doi:10.1123/ijsnem.2018-0299
18. Shiel F, Persson C, Simas V, et al. Reliability and precision of the nana protocol to assess body composition using dual energy X-ray absorptiometry. Int J Sport Nutr Exerc Metab. 2018;28(1):19–25. doi:10.1123/ijsnem.2017-0174
19. Hutt J, Black K, Mead S. Classification of surf breaks in relation to surfing skill. Specl Issue J Coastal Res Surf. 2001;29:66–81.
20. Vasikaran S, Eastell R, Bruyere O, et al. Markers of bone turnover for the prediction of fracture risk and monitoring of osteoporosis treatment: a need for international reference standards. Osteoporos Int. 2011;22(2):391–420. doi:10.1007/s00198-010-1501-1
21. Meier C, Nguyen TV, Center JR, Seibel MJ, Eisman JA. Bone resorption and osteoporotic fractures in elderly men: the dubbo osteoporosis epidemiology study. J Bone Miner Res. 2005;20(4):579–587. doi:10.1359/JBMR.041207
22. Jilka RL. Molecular and cellular mechanisms of the anabolic effect of intermittent PTH. Bone. 2007;40(6):1434–1446. doi:10.1016/j.bone.2007.03.017
23. Cohen J. CHAPTER 4 - Differences between correlation coefficients. In: Cohen J, editor. Statistical Power Analysis for the Behavioral Sciences. NY: Academic Press; 1977:109–143.
24. The Royal Australian College of General Practitioners and Osteoporosis Australia. Osteoporosis prevention, diagnosis and management in postmenopausal women and men over 50 years of age. 2017. Available from: https://www.racgp.org.au/clinical-resources/clinical-guidelines/key-racgp-guidelines/view-all-racgp-guidelines/osteoporosis.
25. Gomez-Bruton A, Montero-Marin J, Gonzalez-Aguero A, Gomez-Cabello A, Garcia-Campayo J, Moreno LA. Swimming and peak bone mineral density: a systematic review and meta-analysis. J Sports Sci. 2018;36(4):365–377. doi:10.1080/02640414.2017.1307440
26. Orwoll ES, Ferar J, Oviatt SK, McClung MR, Huntington K. The relationship of swimming exercise to bone mass in men and women. Arch Intern Med. 1989;149(10):2197–2200.
27. Leigey D, Irrgang J, Francis K, Cohen P, Wright V. Participation in high-impact sports predicts bone mineral density in senior olympic athletes. Sports Health. 2009;1(6):508–513. doi:10.1177/1941738109347979
28. Bolam KA, Beck BR, Adlard KN, et al. The relationship between BPAQ-derived physical activity and bone density of middle-aged and older men. Osteoporos Int. 2014;25(11):2663–2668. doi:10.1007/s00198-014-2797-z
29. Hwang H, Bae J, Hwang S, Park H, Kim I. Effects of breath-hold diving on bone mineral density of women divers. Joint Bone Spine. 2006;73(4):419–423. Epub 2006 Mar 20. doi:10.1016/j.jbspin.2005.07.005
 © 2019 The Author(s). This work is published and licensed by Dove Medical Press Limited. The full terms of this license are available at https://www.dovepress.com/terms.php and incorporate the Creative Commons Attribution - Non Commercial (unported, v3.0) License.
By accessing the work you hereby accept the Terms. Non-commercial uses of the work are permitted without any further permission from Dove Medical Press Limited, provided the work is properly attributed. For permission for commercial use of this work, please see paragraphs 4.2 and 5 of our Terms.
© 2019 The Author(s). This work is published and licensed by Dove Medical Press Limited. The full terms of this license are available at https://www.dovepress.com/terms.php and incorporate the Creative Commons Attribution - Non Commercial (unported, v3.0) License.
By accessing the work you hereby accept the Terms. Non-commercial uses of the work are permitted without any further permission from Dove Medical Press Limited, provided the work is properly attributed. For permission for commercial use of this work, please see paragraphs 4.2 and 5 of our Terms.