")
Back to Journals » Journal of Blood Medicine » Volume 7
Body surface area: a predictor of response to red blood cell transfusion
Received 26 January 2016
Accepted for publication 15 April 2016
Published 21 September 2016 Volume 2016:7 Pages 199—204
DOI https://doi.org/10.2147/JBM.S105063
Checked for plagiarism Yes
Review by Single anonymous peer review
Peer reviewer comments 3
Editor who approved publication: Dr Martin Bluth
Louise Man,1 H Raymond Tahhan1–3
1Department of Internal Medicine, Eastern Virginia Medical School, 2Department of Pathology, Eastern Virginia Medical School, 3Department of Pathology, Sentara Norfolk General Hospital, Norfolk, VA, USA
Abstract: A current focus of transfusion medicine is a judicious strategy in transfusion of blood products. Unfortunately, our ability to predict hemoglobin (Hgb) response to transfusion has been limited. The objective of this study was to determine variability of response to red blood cell transfusion and to predict which patients will have an Hgb rise higher or lower than that predicted by the long-standing convention of “one and three”. This was a retrospective chart review in a single hospital. Data for 167 consecutive patient encounters were reviewed. The dataset was randomly divided into derivation and validation subsets with no significant differences in characteristics. DeltaHgb was defined as posttransfusion Hgb minus pre-transfusion Hgb per red blood cell unit. We classified all the patients in both the subsets as “high responders” (DeltaHgb >1 g/dL) or as “low responders” (DeltaHgb ≤1 g/dL). In univariate analysis, age, sex, body weight, estimated blood volume, and body surface area were significantly associated with response category (P<0.05). Different multivariate regression models were tested using the derivation subset. The probability of being a high responder was best calculated using the logarithmic formula eH / (1 + eH), where H is B0 + (B1 × variable 1) + (B2 × variable 2). Bis are coefficients of the models. On validation, the model H=6.5–(3.3 × body surface area), with the cutoff probability of 0.5, was found to correctly classify patients into high and low responders in 69% of cases (sensitivity 84.6%, specificity 43.8%). This model may equip clinicians to make more appropriate transfusion decisions and serve as a springboard for further research in transfusion medicine.
Keywords: hemoglobin, model, red blood cell, transfusion
Introduction
According to the American Red Cross, roughly 30 million blood products are transfused each year in the US. It is estimated that 41,000 blood donations are needed each day and five million patients need blood every year. Considering the risks associated with unnecessary transfusion of blood products, including infections, transfusion reactions, and, in some clinical situations, alloimmunization, a judicious approach to transfusion is of utmost importance.1,2 However, despite several decades of experience with red blood cell (RBC) transfusion, our ability to predict transfusion requirements based on the expected rise in hemoglobin (Hgb) has been limited. As a result, decisions regarding RBC transfusion have been based on clinical experience and gestalt.
To date, there has been no large generalizable study predicting Hgb or hematocrit increase after RBC transfusion. The number of studies on this subject is small or limited in generalizability.3–5 The purpose of this study was twofold: 1) to determine the variability of response to RBC transfusion and thus the utility of the commonly used rule of thumb that Hgb increases by 1 g/dL per RBC unit transfused and 2) to predict, using readily available demographic or anthropometric measures, which patients will have a Hgb rise of higher or lower than that predicted by the rule of thumb. Having an evidence-based method to predict subgroups of patients according to their predicted response to RBC transfusion would prevent unnecessary transfusions and thus help reduce any associated morbidity and improve patient outcomes.
Patients and methods
Study design and patient selection
The study protocol was approved by the Institutional Review Board of Sentara Norfolk General Hospital, Norfolk, VA, USA (IRB: 13-04-WC-0083). Informed consent was not required by the Institutional Review Board and was, thus, not obtained. Data from 167 consecutive patient encounters with RBC transfusions between January 7, 2013 and February 2, 2013 and who met the inclusion criteria were retrospectively collected and reviewed using our integrated electronic medical record. All analyses were performed by a single investigator (LM). The inclusion criteria were age greater than 18 years, pre-transfusion Hgb checked no earlier than 12 hours prior to transfusion, and posttransfusion Hgb checked between 3 and 24 hours after transfusion. Exclusion criteria were pregnancy, active hemolysis, active bleeding, disseminated intravascular coagulation, hemodynamic instability (defined as mean arterial pressure less than 60 mmHg or requiring vasopressors), or early termination of transfusion. Also, cases with a rise in Hgb per unit of transfused RBC greater than 3 g/dL were also excluded, as this was thought to be implausible.
The following data points were recorded for each RBC transfusion: patient age, sex, actual body weight, height, pre-transfusion Hgb, posttransfusion Hgb, number of units transfused, volume of each RBC unit, and time to posttransfusion Hgb check (rounded to the nearest half hour). If the same patient was transfused multiple units but more than 6 hours apart, then these were considered separate transfusion encounters.
Definitions
Body mass index (kg/m2) was defined as weight divided by the square of height. Estimated blood volume (EBV; mL) was conventionally defined as weight (kg) × 75 (mL/kg) for males and weight (kg) × 65 (mL/kg) for females. Body surface area (BSA; m2) was calculated using the DuBois and DuBois formula of 0.007184 × (height (cm))0.725 × (weight (kg))0.425. DeltaHgb was defined as posttransfusion Hgb minus pre-transfusion Hgb per unit of RBC. We classified patients with DeltaHgb >1 g/dL as “high responders” and those with DeltaHgb ≤1 g/dL as “low responders”.
Statistical analysis
Descriptive analyses were performed using mean (± standard deviation [SD]), median (standard error of the mean [SEM]), and frequency (%). Continuous variables with normal and skewed distributions were compared between the groups using the Student’s t-test and Mann–Whitney U test, respectively. Proportions were compared between the groups using a chi-square test with Fisher’s exact method.
We randomly divided the entire dataset into two subsets: the derivation subset (100 unique patients, 125 encounters) and the validation subset (34 unique patients, 42 encounters). We derived a formula from the derivation subset and tested its performance on the validation subset. There was no overlap between the two subsets. Both the subsets were stratified to contain similar proportions of high and low responders.
We first performed univariate analysis on the derivation subset to identify variables that were statistically significantly associated with response level (high vs low). Next, we included variables with significant associations in multiple binary logistic regression models to identify independent associations. We built several regression models using different combinations of variables. In all the developed models, the outcome variable was high vs low response. The performance of these models was measured against the validation subset in order to mitigate the risks of overfitting our model to a training dataset. Performance metrics were sensitivity, specificity, and classification accuracy. Receiver operating characteristic curves were used to identify the best cutoff criteria for the model, defined as the point on the curve that corresponds to the maximum sensitivity and specificity. We defined classification accuracy as the proportion of all cases that were classified correctly.
The statistical software program SPSS Statistics (IBM Corporation, Armonk, NY, USA), version 22, was used for all statistical analysis, with statistical significance defined as P<0.05.
Results
Table 1 shows demographic and transfusion characteristics of patients in the derivation subset, the validation subset, and the combined dataset. Collectively, patients (56.7% females) had a mean ± SD age of 65.9±16.0 years, with a mean ± SD body weight of 78.3±24.7 kg and mean ± SD height of 1.68±0.12 m, mean ± SD body mass index of 27.8±8.8 kg/m2, mean ± SD EBV of 5,446±1,802 mL, and mean ± SD BSA of 1.87±0.28 m2. The mean ± SD pre-transfusion Hgb was 7.2±0.9 g/dL, the median (SEM) time to posttransfusion Hgb was 7.0 (0.5) hours, and the mean ± SD DeltaHgb per RBC unit was 1.2±0.5 g/dL. In all, 54.5% of patients were high responders. Finally, 1, 2, 3, and 4 U of RBC was transfused in 87 (52.1%), 75 (44.9%), 4 (2.4%), and 1 (0.6%) encounters, respectively. The P-values in Table 1 relate to the null hypothesis that the derivation and validation subsets do not differ at a statistically significant level. For all evaluated characteristics, we were unable to reject this null hypothesis. The median (SEM) RBC unit volume was 310 (0.965) mL. Given the small variation in the volume of units, this variable was not considered in further analysis.
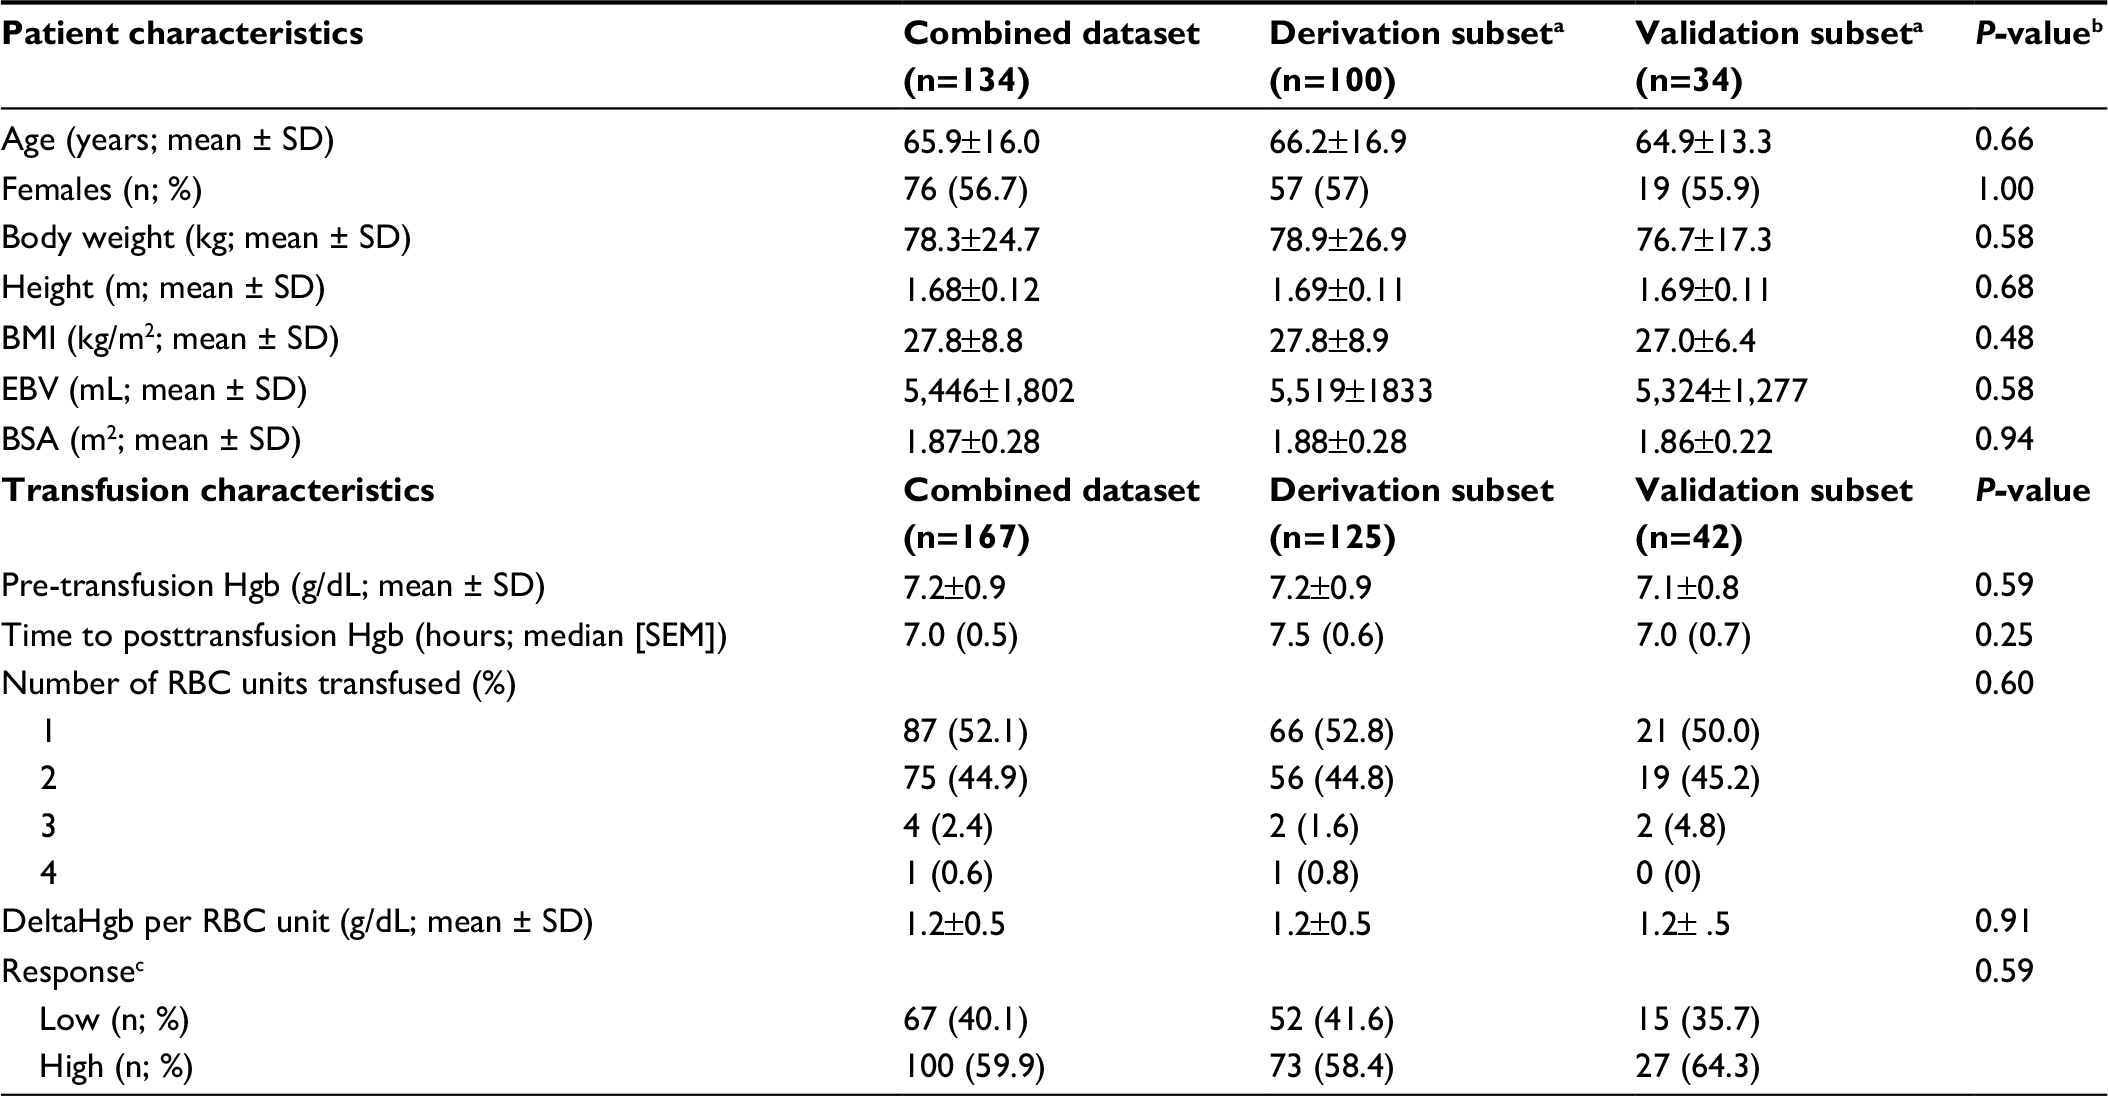 | Table 1 Patient and transfusion characteristics Notes: aPatients who received multiple RBC units were counted once in this section of the table to avoid repetition bias. bThe P-values relate to the null hypothesis that the derivation and validation subsets are not statistically significantly different. cHigh and low responders had DeltaHgb per RBC unit >1 g/dL and ≤1 g/dL, respectively. Abbreviations: BMI, body mass index; BSA, body surface area; EBV, estimated blood volume; Hgb, hemoglobin; RBC, red blood cell; SD, standard deviation; SEM, standard error of the mean. |
Derivation of formula
Univariate analysis was performed to identify variables that were statistically significantly associated with response level (high vs low). These variables included age (P=0.007), sex (P<0.001), body weight (P<0.001), EBV (P<0.001), and BSA (P<0.001). We built a variety of binary regression models to predict transfusion response using different combinations of these variables (Table 2). The probability of being a high responder was calculated using the logarithmic formula eH / (1 + eH), where H is B0 + (B1 × variable 1) + (B2 × variable 2). Bis are coefficients of the regression models, as shown in Table 2. We compared the receiver operating characteristic curves of these different models. Model 2 had the best performance with a cutoff probability value of 0.5 (Figure 1). The equation for Model 2 is H = 6.5 – (3.3 × BSA). Figure 2 depicts the sequential steps involved in predicting high vs low response.
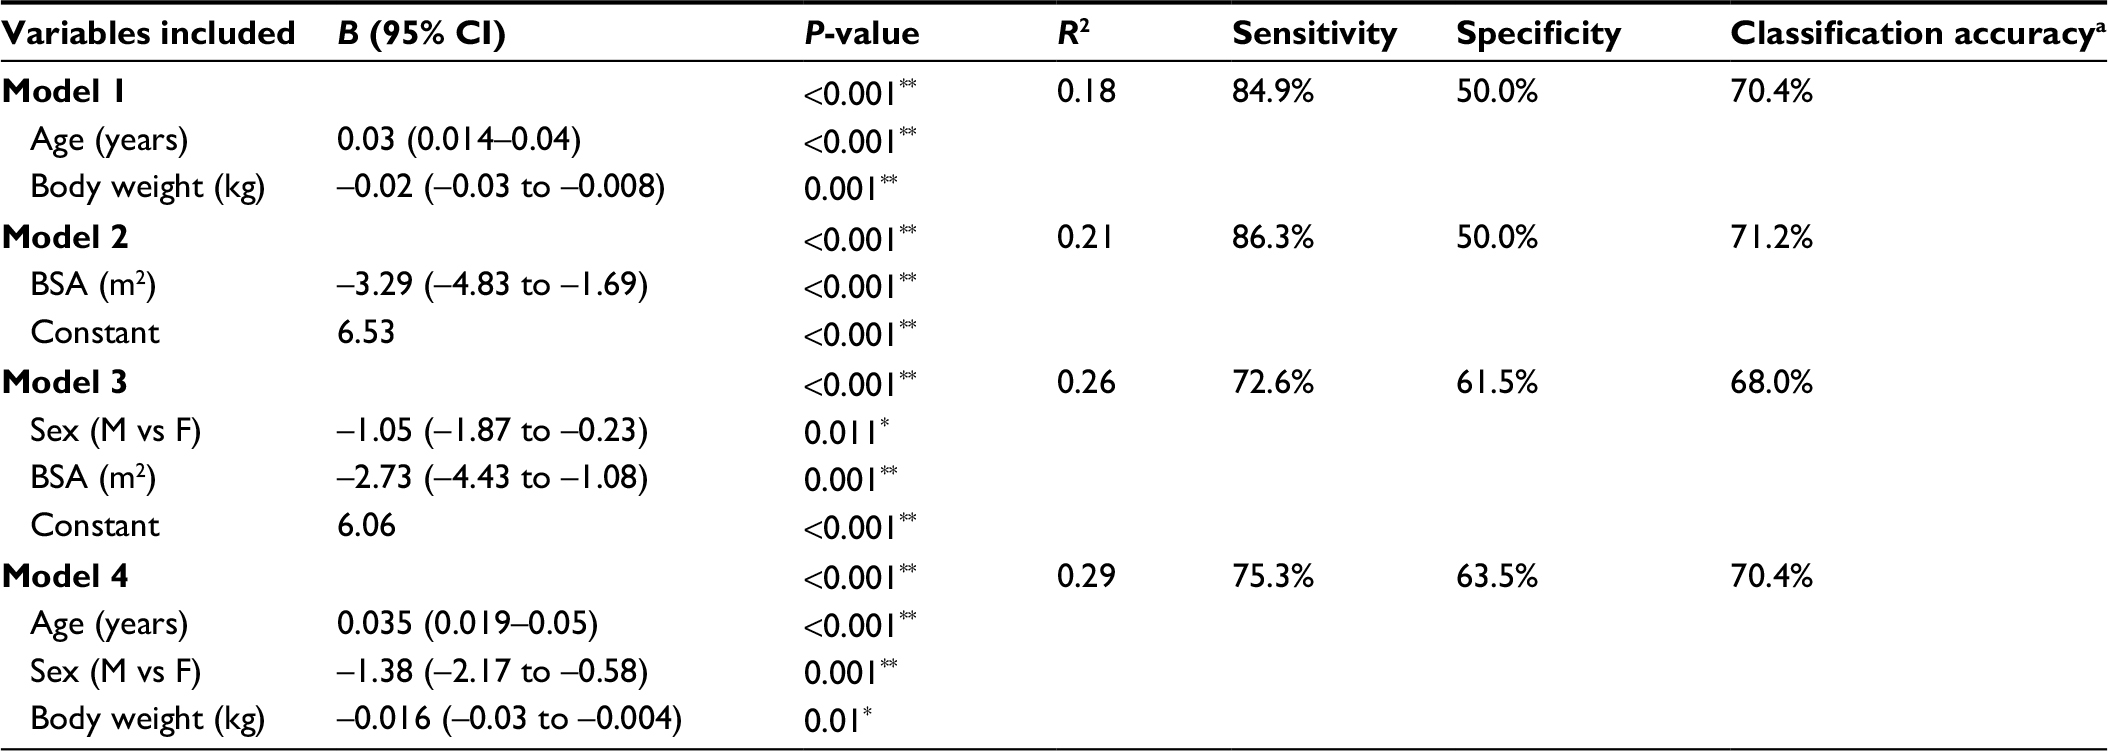 | Table 2 Regression models to predict response level (high vs low) using variables with significant associations in univariate analysis Notes: aPercentage of patients that were classified correctly; *P<0.05; **P<0.01 Abbreviations: BSA, body surface area; CI, confidence interval; F, female; M, male. |
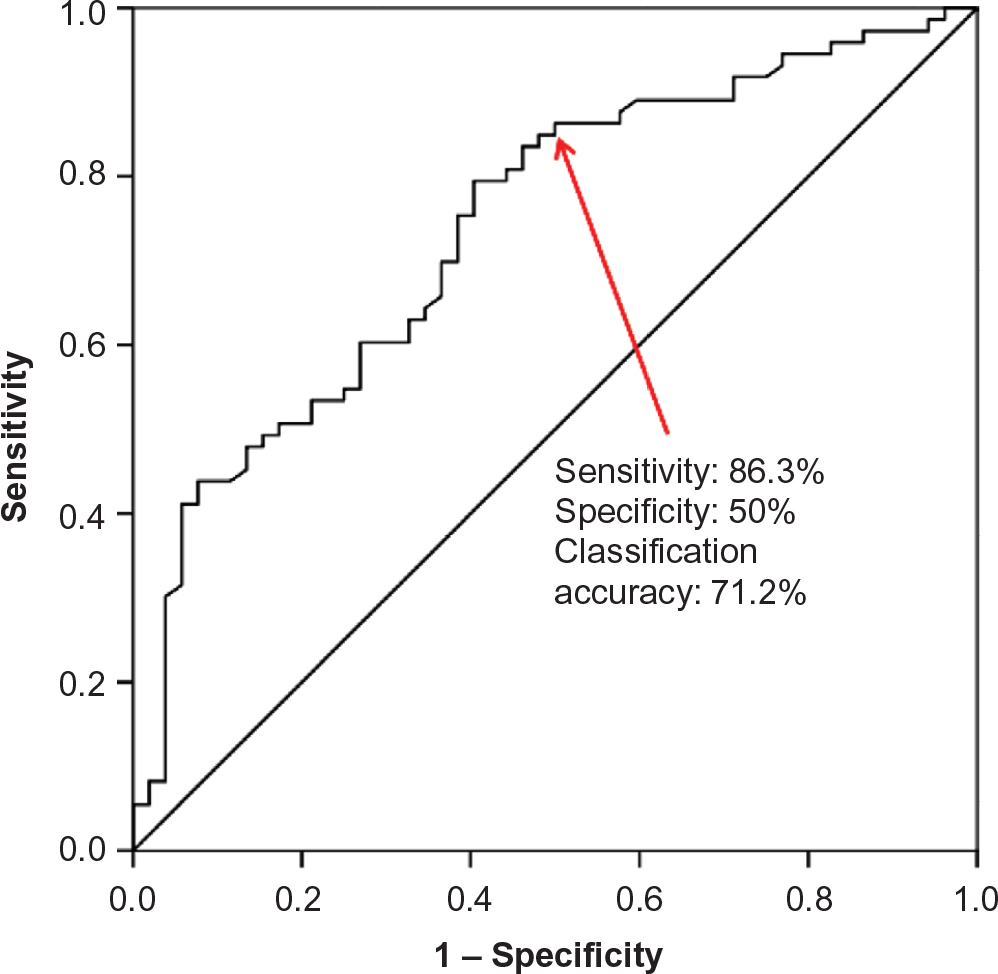 | Figure 1 ROC curve to identify the best cutoff probability value for Model 2. Note: A cutoff probability of 0.5 provides maximal sensitivity + specificity. Abbreviation: ROC, receiver operating characteristic. |
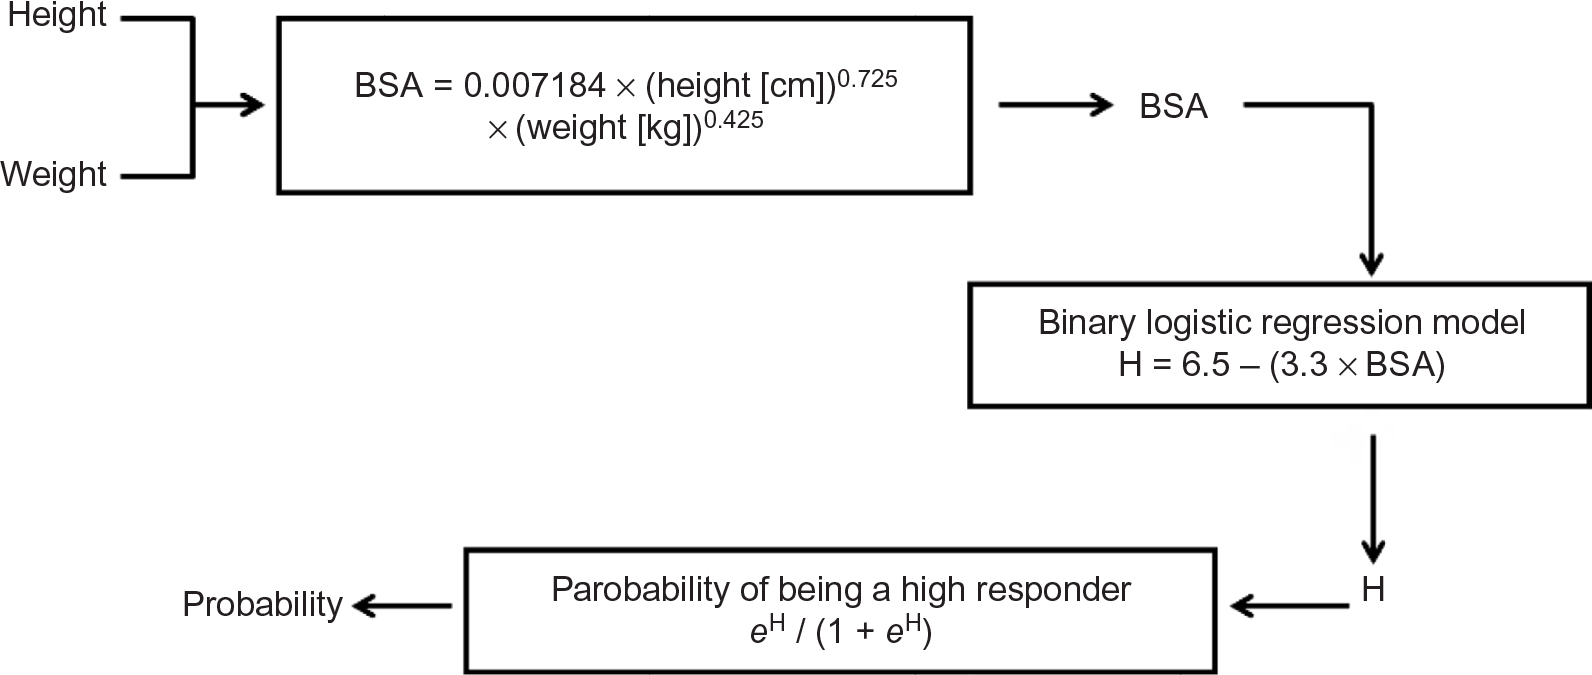 | Figure 2 Summary of sequential steps involved in predicting high vs low response. Notes: First, BSA is calculated using height and weight, as demonstrated by the DuBois and DuBois formula shown in the first box. Next, BSA is used in the regression model shown in the second box to derive H, which can subsequently be used to calculate the probability that the patient is a “high responder”, as shown in the third box. Abbreviation: BSA, body surface area. |
Validation of the formula
To validate the formula, we measured the sensitivity, specificity, and classification accuracy of Model 2 in predicting high vs low response among patients in the validation subset. We first used the sequence depicted in Figure 2 to assign patients to predicted high vs low response groups. Next, we determined sensitivity, specificity, and classification accuracy according to standard definitions. Using this strategy, the model correctly classified patients into high vs low responders in 69% of cases. Sensitivity and specificity were 84.6% and 43.8%, respectively. Finally, having validated the model on the validation subset, we calculated BSA, which corresponded to a high response probability of 0.50. This calculation yielded a cutoff BSA of 1.97 m2. This means that patients with a BSA less than 1.97 m2 have a probability that is greater than 0.50 of achieving a DeltaHgb per RBC unit of >1 g/dL. Conversely, patients with a BSA greater than 1.97 m2 have a probability less than 0.50 of achieving a DeltaHgb per RBC unit >1 g/dL. A nomogram depicting the probability of being a “high responder” based on BSA is shown in Figure 3.
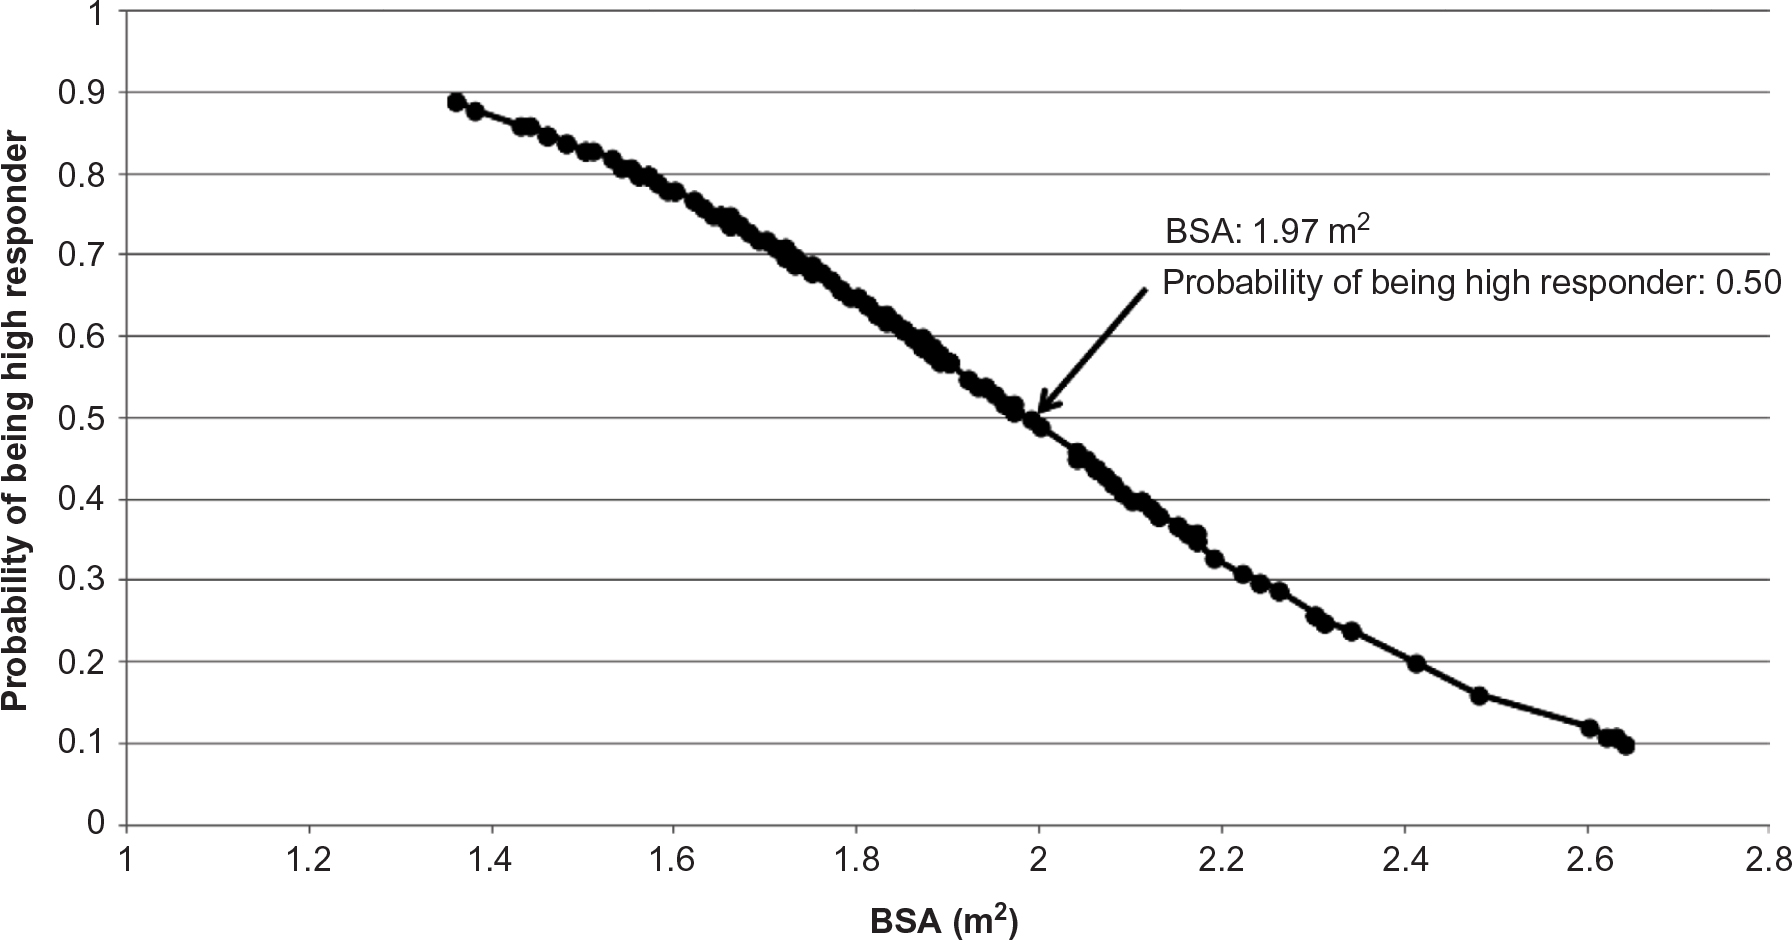 | Figure 3 Nomogram to predict the probability of being a “high responder” based on BSA. Note: This sigmoid nomogram was created to allow quick estimation of patients’ probability of being “high responder” based only on their BSA. Abbreviation: BSA, body surface area. |
Discussion
One of the long-standing challenges in transfusion medicine is limitation in ability to predict response to RBC transfusion. Prior studies looking to predict response to transfusion were small in sample size. For example, Huber et al3 proposed a DeltaHgb per RBC unit of 0.9±0.1 g/dL for their small sample of 16 patients. Using a sample size of 39 patients, Wiesen et al supported the previous results, and hence the conventional “1 and 3” rule of thumb was established, predicting that transfusion of one RBC unit increases the Hgb by 1 g/dL and the HCt by 3%.4 This half-century-old rule has endured to become the default formula in daily transfusion practice in many disciplines. The largest modern study on this subject was done in a pediatric population in the UK.5 The authors derived a formula to predict the volume of RBC transfusion required to achieve a desired Hgb increment. Despite the large sample size (n=379), the median age of the study population was 6.5 months, limiting the generalizability of the results to the adult population. The urgency to address this dogma was the main incentive to perform the present study.
In this study, we used a relatively large sample of patients to derive a formula to predict Hgb response after RBC transfusion. There was variability in response to RBC transfusion, and we classified the patients as “high responders” or “low responders”. The mean DeltaHgb per RBC unit in our series was 1.23 g/dL. This lends support to the rule of thumb, which lacks large published datasets to support this rule. Then, multiple different prediction models were tested using a variety of variables. The best-performing model used BSA and correctly classified 69% of patients, with a sensitivity of 84.6% and a specificity of 43.8% when tested on an independent dataset without any overlap with the derivation dataset. To our knowledge, the present study is the largest report of a formula to predict RBC transfusion response in the adult population.
We have recognized that despite the relatively large sample size, the classification accuracy and specificity from our derived model can be improved. Building improved prediction models will require not just larger studies but also use of a multicenter approach. Nonetheless, this remains one of the few larger studies with a formula to predict response to transfusion, and the anthropometric characteristics of our study population are largely representative of the adult population in the US.
We also acknowledge that there are several potential causes of variability in RBC transfusion response, including the age of the transfused RBCs, variability in quantitative measurements by different machines, low-grade hemolysis, occult blood loss, and hydration status of patients. Future studies should investigate these factors more broadly, such as the age of the stored RBCs, which may affect the effectiveness of a single RBC transfusion. This subset analysis was not performed in our study, but certainly future studies should investigate this effect. We have highlighted that one of the premises of the study was to identify variables affecting transfusion response in hemodynamically stable patients without active bleeding. Consequently, the exclusion of patients with active bleeding, overt hemolysis, or hemodynamic instability was intentional as these factors are known to cause inefficient RBC transfusion.
Overall, this study had the advantages such as relatively large sample size, careful multivariate analysis of a large number of relevant variables in several complex regression models, and having two non overlapping datasets for derivation and validation of the formula. As a result, we believe that the derived model is notable in an area that could benefit from more precise prediction tools. Evidence-based practice is important in medicine in general, and the present study serves as an important stepping stone to a better understanding of RBC transfusion outcomes. The validity of these results should be further investigated in larger and prospective studies. Formulas to more accurately predict RBC transfusion response could potentially be helpful to improve blood utilization in the blood blanks of large hospitals.
Author contributions
Both the authors had access to all the data in the study and take responsibility for the integrity and the accuracy of the data analysis. All authors contributed toward data analysis, drafting and revising the paper and agree to be accountable for all aspects of the work.
Disclosure
The authors report no conflicts of interest in this work.
References
Ward NS, Levy MM. Blood transfusion practice today. Crit Care Clin. 2004;20(2):179–186. | ||
Vamvakas EC, Blajchman MA. Transfusion-related immunomodulation (TRIM): an update. Blood Rev. 2007;21(6):327–348. | ||
Huber H, Lewis SM, Szur L. The influence of anaemia, polycythaemia and splenomegaly on the relationship between venous haematocrit and red-cell volume. Br J Haematol. 1964;10:567–575. | ||
Wiesen AR, Hospenthal DR, Byrd JC, Glass KL, Howard RS, Diehl LF. Equilibration of hemoglobin concentration after transfusion in medical inpatients not actively bleeding. Ann Intern Med. 1994;121(4):278–280. | ||
Davies P, Robertson S, Hegde S, Greenwood R, Massey E, Davis P. Calculating the required transfusion volume in children. Transfusion. 2007;47(2):212–216. |
 © 2016 The Author(s). This work is published and licensed by Dove Medical Press Limited. The full terms of this license are available at https://www.dovepress.com/terms.php and incorporate the Creative Commons Attribution - Non Commercial (unported, v3.0) License.
By accessing the work you hereby accept the Terms. Non-commercial uses of the work are permitted without any further permission from Dove Medical Press Limited, provided the work is properly attributed. For permission for commercial use of this work, please see paragraphs 4.2 and 5 of our Terms.
© 2016 The Author(s). This work is published and licensed by Dove Medical Press Limited. The full terms of this license are available at https://www.dovepress.com/terms.php and incorporate the Creative Commons Attribution - Non Commercial (unported, v3.0) License.
By accessing the work you hereby accept the Terms. Non-commercial uses of the work are permitted without any further permission from Dove Medical Press Limited, provided the work is properly attributed. For permission for commercial use of this work, please see paragraphs 4.2 and 5 of our Terms.