")
Back to Journals » OncoTargets and Therapy » Volume 9
Blood oxygenation level-dependent magnetic resonance imaging during carbogen breathing: differentiation between prostate cancer and benign prostate hyperplasia and correlation with vessel maturity
Authors Di N, Mao N, Cheng W, Pang H , Ren Y, Wang N, Liu X, Wang B
Received 31 January 2016
Accepted for publication 8 April 2016
Published 7 July 2016 Volume 2016:9 Pages 4143—4150
DOI https://doi.org/10.2147/OTT.S105480
Checked for plagiarism Yes
Review by Single anonymous peer review
Peer reviewer comments 2
Editor who approved publication: Professor Min Li
Ningning Di,1,2,* Ning Mao,3,* Wenna Cheng,4 Haopeng Pang,1 Yan Ren,1 Ning Wang,2 Xinjiang Liu,2 Bin Wang5
1Department of Radiology, Affiliated Huashan Hospital of Fudan University, Shanghai, 2Department of Radiology, Binzhou Medical University Affiliated Hospital, Binzhou, 3Department of Radiology, Yantai Yuhangding Hospital, Yantai, 4Department of Pharmacy, Binzhou Medical University Affiliated Hospital, Binzhou, 5Department of Medical Imaging and Nuclear Medicine, Binzhou Medical University, Yantai, People’s Republic of China
*These authors contributed equally to this work
Objective: The aim of this study was to investigate whether the blood oxygenation level-dependent (BOLD) contrast magnetic resonance imaging (MRI) can evaluate tumor maturity and preoperatively differentiate prostate cancer (PCa) from benign prostate hyperplasia (BPH).
Patients and methods: BOLD MRI based on transverse relaxation time*-weighted echo planar imaging was performed to assess PCa (19) and BPH (22) responses to carbogen (95% O2 and 5% CO2). The average signal values of PCa and BPH before and after carbogen breathing and the relative increased signal values were computed, respectively. The endothelial-cell marker, CD31, and the pericyte marker, α-smooth muscle actin (mature vessels), were detected with immunofluorescence, and were assessed by microvessel density (MVD) and microvessel pericyte density (MPD). The microvessel pericyte coverage index (MPI) was used to evaluate the degree of vascular maturity. The changed signal from BOLD MRI was correlated with MVD, MPD, and MPI.
Results: After inhaling carbogen, both PCa and BPH showed an increased signal, but a lower slope was found in PCa than that in BPH (P<0.05). PCa had a higher MPD and MVD but a lower MPI than BPH. The increased signal intensity was positively correlated with MPI in PCa and that in BPH (r=0.616, P=0.011; r=0.658, P=0.002); however, there was no correlation between the increased signal intensity and MPD or MVD in PCa than that in BPH (P>0.05).
Conclusion: Our results confirmed that the increased signal values induced by BOLD MRI well differentiated PCa from BPH and had a positive correlation with vessel maturity in both of them. BOLD MRI can be utilized as a surrogate marker for the noninvasive assessment of the degree of vessel maturity.
Keywords: BOLD, magnetic resonance imaging, prostate carcinoma, benign prostate hyperplasia, vessel maturity
Introduction
Prostate cancer (PCa) presents a global public health dilemma with increasing incidence and mortality. In 2002, ~679,000 men were diagnosed with PCa, and 221,000 patients died from this disease worldwide.1 Tumor angiogenesis characterized by immature blood vessels is one of the hallmarks of PCa development; thus, targeting tumor vasculature by “starving a tumor to death” was conceived over 4 decades ago and has led to the development of antiangiogenic drugs approved for use against various human malignancies.2 However, the rigorous depletion of tumor vessels leads to hypoxia, thereby promoting neovascularization and tumor regrowth. Thus, tumor vessels should not cause harm, particularly for mature vessels in the tumor.3 A detailed analysis demonstrated that mature vessels aid in tumor treatment because of their roles in improving drug delivery,4 increasing oxygenation of potentially sensitized tumor cells to the cytotoxic actions of chemoradiation,5,6 and enhancing native antitumor immune responses,7,8 suggesting that the evaluation of tumor vessel maturity in PCa is critical to antiangiogenic treatment and follow-up effectiveness.
Although biopsy is the standard diagnostic method to assess vessel maturity, it is not suitable for dynamic monitoring because of its invasive nature and the limited location without depicting the whole tumor. Thus, a noninvasive method must be developed. Functional magnetic resonance imaging (MRI) is a powerful technique with high spectral and spatial resolution, which enables the noninvasive imaging of the anatomy and function in vivo to understand the physiological processes better without using ionizing radiation and radioactive tracers. Clinically, combining dynamic contrast enhancement (Ktrans) and dynamic susceptibility contrast (relative cerebral blood volume [rCBV]/relative cerebral blood flow [rCBF]) MRI can be a “vascular normalization index” to assess the vessel maturity in tumor,9 but the MRI perfusion methods need contrast agents by intravenous injection, which was not suitable for the patients with renal failure.
As one functional MRI technique, blood oxygenation level-dependent (BOLD) MRI utilizes the paramagnetic properties of deoxyhemoglobin as an intrinsic contrast agent to affect the transverse relaxation time (T2) independently without giving an additional contrast agent.10 In BOLD MRI, the signal is low in T2* prior to carbogen inhalation, but the signal will increase after the patient inhales carbogen, which depends on the decreased concentration of deoxyhemoglobin. Mature vessels always expand after carbogen is inhaled, resulting in increased blood flow and reduced deoxyhemoglobin, thus elevating the signal. However, immature vessels always exhibit slight dilation and even distribute carried blood into adjacent tissues; this phenomenon is called the steal effect.11 Thus, the functional MRI approach can reflect vascular maturity by the altered signal in T2* because of the varying reactivity of vessels to carbogen and has been verified to evaluate the in vivo imaging of tumor vessel maturation in subcutaneous tumors initiated by the inoculation of C6-pTET-VEGF cells,12 ovarian carcinoma,13 glioma,14 and FSa II fibrosarcoma.15 To our knowledge, although some studies have been used to differentiate PCa from benign prostate hyperplasia (BPH), few studies have correlated the BOLD contrast with intrinsic pathology in PCa and BPH. In theory, PCa is featured by immature vessels, whereas BPH is characterized by mature vessels. Accordingly, we hypothesize that PCa will exhibit a lower increase in signal in BOLD MRI than BPH. The current study examined whether BOLD MRI can noninvasively differentiate PCa from BPH and evaluated the vessel maturity of PCa and BPH by analyzing the correlation between the changed signal and fluorescent staining results.
Patients and methods
Patients
A prospective clinical study was conducted in 23 patients with PCa aged 51–82 years (mean age, 63 years) and 25 patients with BPH aged 48–73 years (mean age, 60 years). Their pathologies were proved by two pathologists, who have worked at least 10 years in the pathology department. Protocols and informed consent provisions were reviewed and approved by the Shandong Medical Imaging Institutional Review Board. All patients provided written informed consent. All patients who did not receive any prior treatment underwent conventional MRI and BOLD MRI before diagnostic prostate biopsy. Histological identification was obtained from ultrasound-guided core biopsy in 32 patients and radical prostatectomy in 16 patients. The medium time interval between histological results and MRI examination was 12 days (ranging 7–53 days). The time interval between the date of prostate-specific antigen (PSA) measurement before MRI and the MRI examination ranged from 4 days to 17 days (median =7 days).
Magnetic resonance imaging
MRI was performed in the supine position by using a 3.0 T superconducting magnetic scanner (GE Healthcare Bio-Sciences Corp., Piscataway, NJ, USA) equipped with abdomen phased-array coils and endorectal coils. The conventional MRI protocol is composed of fast spin echo axial T2-weighted images (repetition time [TR]/echo time [TE] 7,000/120 ms, field of view 20×20 cm, matrix 256×512, four excitations, and 3 mm slice thickness with 0.6 mm slice gap) and T1-weighted spin echo MRI images in the axial plane (TR/TE 650/8.3 ms, field of view 20×20 cm, matrix 224×512, four excitations, and 3 mm slice thickness with 0.6 mm slice gap). BOLD MRI examinations were conducted between air and carbogen breathing (carbogen: 95% O2, 5% CO2) at the rate of 5 L/min. The images were acquired four times for 4 minutes of breathing in the following order: air, carbogen, air, and carbogen. In each episode, 60 images were acquired using a standard T2*WI echo planar imaging sequence with TR 3,000 ms, TE 40 ms, flip angle 90°, one excitation, and 3 mm slice thickness with 0.6 mm slice gap. However, only the last 20 images were utilized for analysis to avoid the transition periods.
Image and data analyses
For postprocessing, the qualified images were selected by two radiologists and transferred to a workstation (GE Healthcare Bio-Sciences Corp.; Advantage Workstation 4.2), followed by an analysis adopting a standard method in functional MRI of the brain and a commercially available tool provided by the manufacturer (Functool 2; GE Healthcare Bio-Sciences Corp.). Three different regions of interest (ROI) in both PCa and BPH samples were drawn by a radiologist in consultation with a pathologist regarding histological confirmation, which guaranteed the appropriateness of each ROI. Signal intensity–time curves (SI-TCs) during carbogen breathing were acquired from the ROI, and the signal enhancement was quantified.
Double fluorescence staining
The specimens were obtained from ultrasound-guided core biopsy TURP and radical prostatectomy. The location of every specimen was recorded. Prostate tissue samples were fixed in formalin for 5–6 hours for optimal immunostaining and embedded in paraffin. Up to 35 specimens of PCa and 46 specimens of BPH were obtained. A pathologist reviewed all the histological slides and selected the slides for quantitative evaluation.
Double fluorescence staining was performed using antibody against α-smooth muscle actin (α-SMA; 1:120, red) and CD31 (1:70, green). Microvessel density (MVD) was determined using CD31 stain (green), and microvessel pericyte density (MPD) was determined by double stain (CD31 green, α-SMA red). MVD and MPD were conducted using the “hot spot” method introduced by Weidner et al,16 in which the most vascularized areas are identified by the 10× microscope objective; three fields are selected to count vessels at 20× microscope objective, and the average is computed. Microvessel pericyte coverage index (MPI) was calculated by the MPD/MVD ratio.17
For the fluorescence staining, 4 μm thick sections of paraffin-embedded PCa and BPH tissues were adhered to silane-coated glass slides. After baking sections at 60°C for >60 minutes, all the sections were deparaffinized with xylene and rehydrated with graded alcohol solutions. The sections were washed with phosphate-buffered saline (PBS) and treated with 0.3% H2O2 in methanol for 10 minutes at room temperature to inactivate endogenous peroxidase. Antigen retrieval was performed by incubating the sections in 0.01 M citrate buffer (pH 6.0) and heating the sections at 95°C for 30 minutes in a water bath. After sufficient cooling, the samples were rinsed thrice for 5 minutes each with PBS. The sections were incubated in a nonspecific staining blocking reagent for 30 minutes at 37°C and incubated with α-SMA (1:150; Zhongshan Golden Bridge Biotechnology, Beijing, People’s Republic of China) and CD31 antibody (1:50; Zhongshan Golden Bridge Biotechnology) at 4°C for 12 hours. These sections were washed with PBS every 10 minutes. The specimens were washed thrice and incubated with FITC-conjugated anti-Rat IgG antibody (1:120) for 1 hour without light at 37°C. After washing the samples thrice again, the samples were stained with 4′,6-diamidino-2-phenylindole (1:200; Zhongshan Golden Bridge Biotechnology), mounted with gelatin, and photographed under a fluorescence microscope (Olympus Corporation, Tokyo, Japan).
Statistical analysis
All statistical analyses were performed using SPSS 17.0 software. Two-tailed Pearson correlation analysis was conducted to determine the correlation between the increased signal measured by BOLD MRI and the MVD, MPD, and MPI. Two-tailed paired t-tests were employed to compare the BOLD signal in response to carbogen, MVD, MPD, and MPI in PCa with that in BPH. A P-value <0.05 was considered to indicate a statistically significant difference.
Results
The examination and assessment procedures were successfully completed in 16 patients with PCa and 20 patients with BPH. Five examinations (two for PCa and three for BPH) had to be excluded as a result of significant susceptibility artifacts induced by the movement of bowels, whereas seven other patients (two BPH and five PCa) did not finish the examinations because of respiratory distress.
In fast spin-echo T2 weighted imaging (FS-T2WI), both PCa and BPH exhibited lower signal intensity than that of the peripheral zone and showed heterogeneity (Figures 1A and 2A).
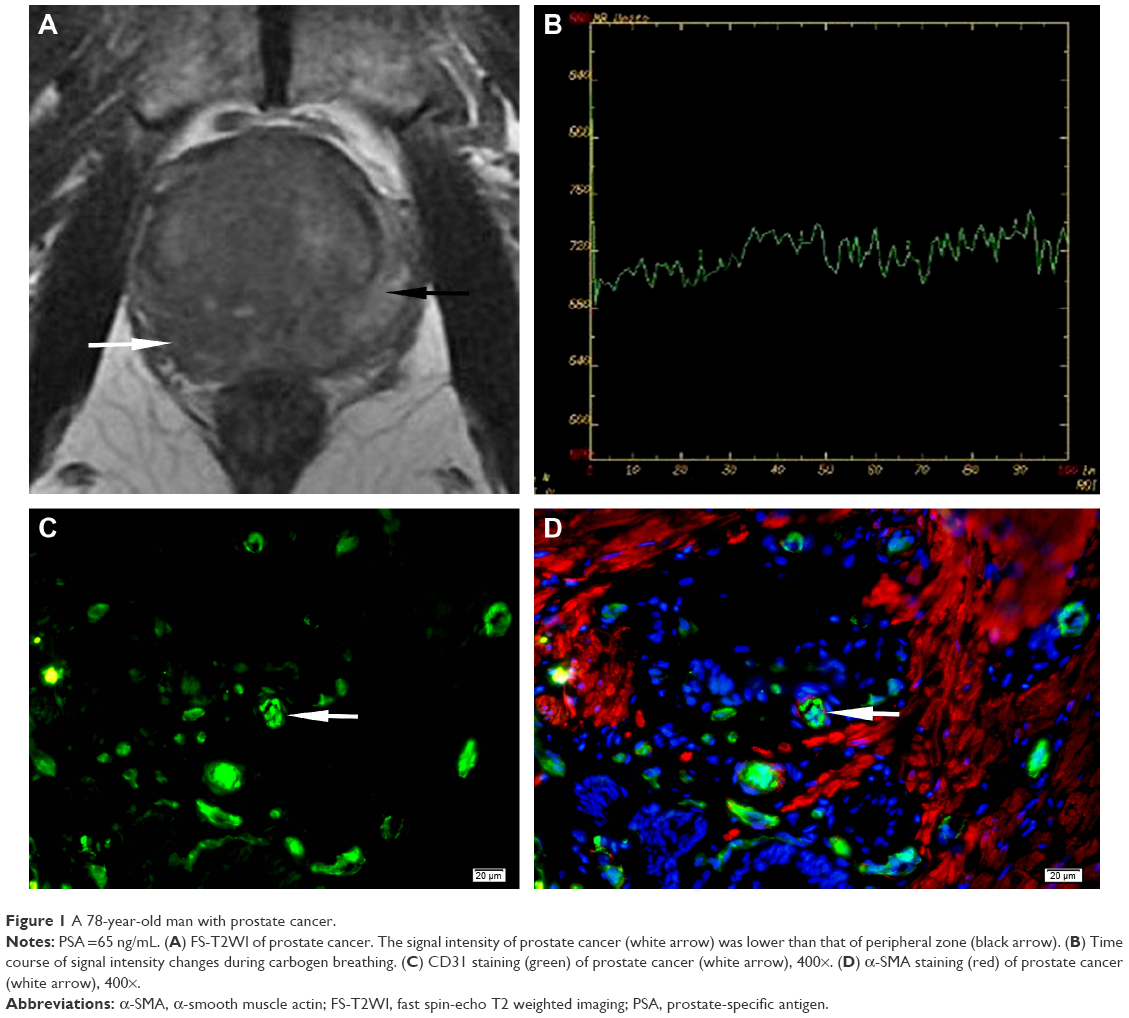 | Figure 1 A 78-year-old man with prostate cancer. |
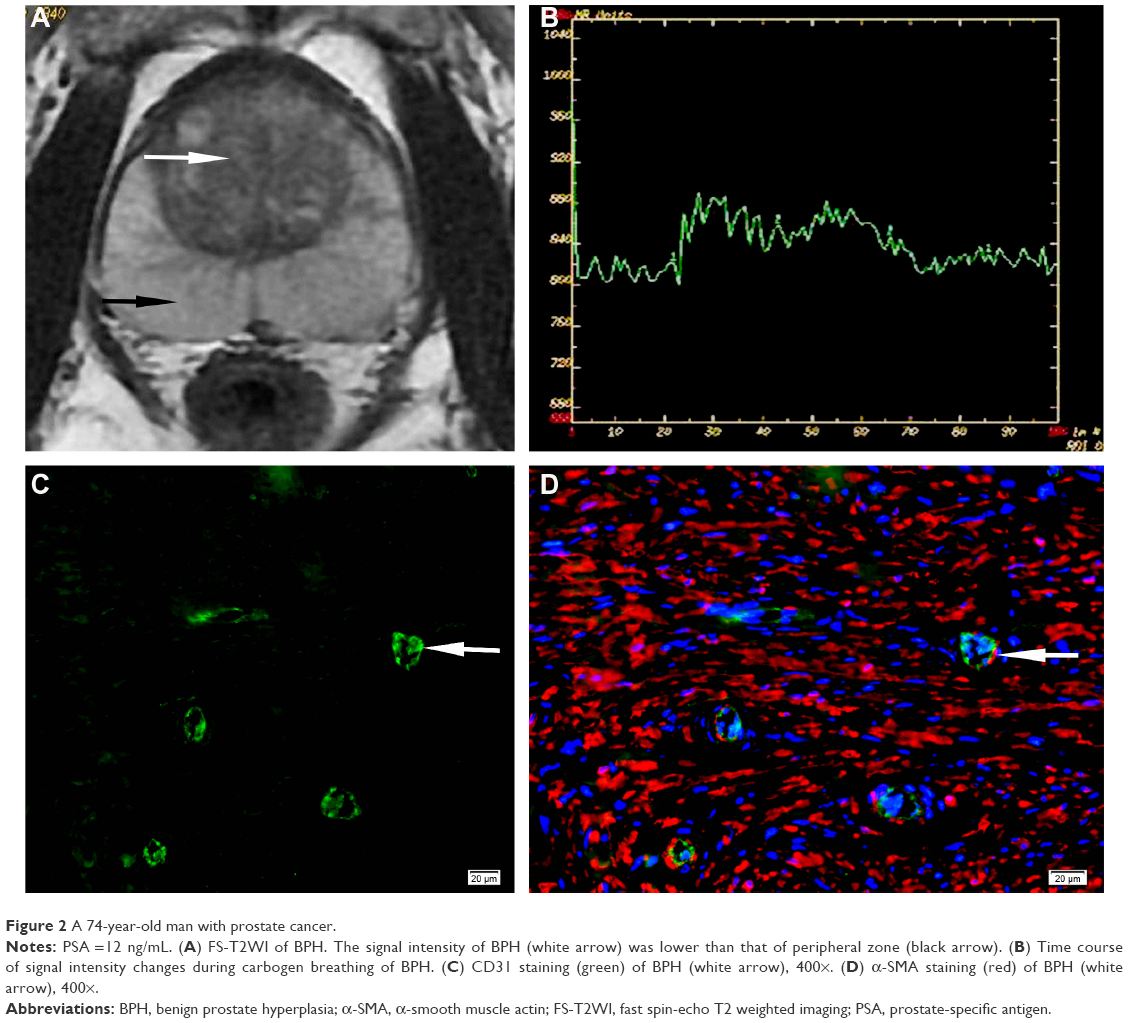 | Figure 2 A 74-year-old man with prostate cancer. |
The exemplary SI-TC can be observed in PCa and BPH by using a standard echo planar imaging sequence during carbogen breathing. Echo planar images exhibited pronounced SI changes during carbogen breathing. Figures 1B and 2B demonstrate that the tendency of SI-TC in PCa is the same as that in BPH, in which the curves elevated when carbogen was inhaled and declined when air was inhaled. However, the increased slope in PCa was lower than that in BPH. The mean values of the increased signal in PCa and BPH during carbogen breathing were 32.32±8.85 and 71.08±19.12, respectively, and the mean increased signal value in PCa is lower than that in BPH (t=−8.05, P=0.000; Table 1).
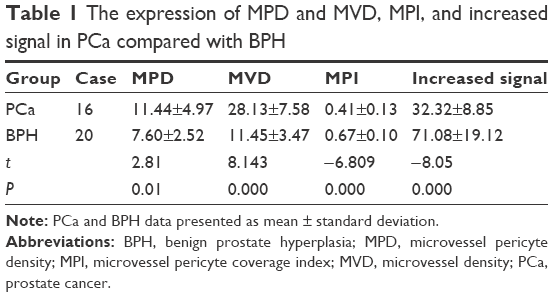 | Table 1 The expression of MPD and MVD, MPI, and increased signal in PCa compared with BPH |
Fluorescence staining results (Figures 1C and D and 2C and D) indicated that the mean values of MVD, MPD, and MPI are 28.13±7.58/400× and 11.45±3.47/400×, 11.44±4.97/400× and 7.60±2.52/400×, and 0.41±0.13 and 0.67±0.10 in PCa and BPH, respectively. The MVD, MPD, and MPD/MVD ratio showed significant difference between PCa and BPH (t=8.143, P=0.000; t=2.810, P=0.010; t=−6.809, P=0.000; Table 1).
As shown in Figures 3 and 4, the mean values of the increased signal in both PCa and BPH are positively correlated with the corresponding MPI (r=0.616, P=0.011; r=0.658, P=0.002). However, no statistical difference existed between the mean values of the increased signal and MPD or MVD in PCa and BPH (P>0.05; Table 2).
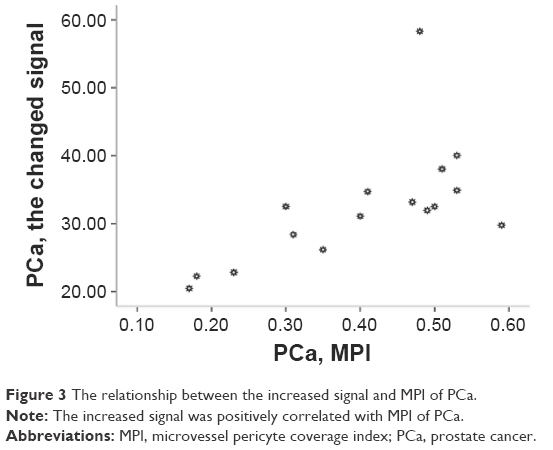 | Figure 3 The relationship between the increased signal and MPI of PCa. |
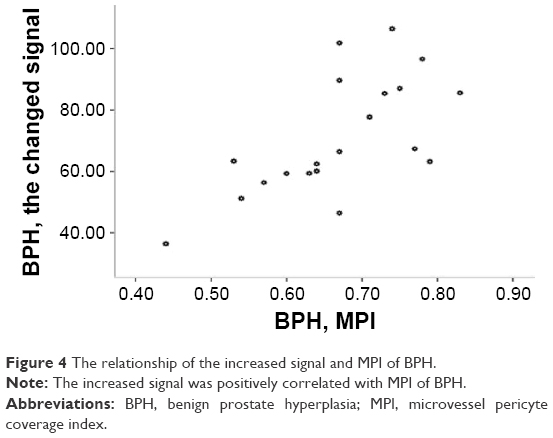 | Figure 4 The relationship of the increased signal and MPI of BPH. |
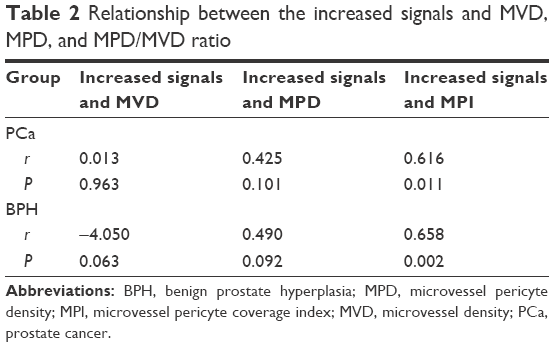 | Table 2 Relationship between the increased signals and MVD, MPD, and MPD/MVD ratio |
Discussion
Angiogenesis is crucial for the development of PCa and is featured with not only the immature vessels initiated by VEGF but also the mature vessels labeled by pericytes can be found.17 The present study used CD31 and α-SMA to label the endothelial cells and pericytes and quantified these cells by MVD and MPD. CD31 and α-SMA fluorescence staining results were identified in both PCa and BPH. Our results showed that the number of MVD in PCa is higher than that in BPH, which corresponds to the growth of the solid tumor depending on the nutrition from new vessels.18 We determined that the value of MPD was lower than that of PCa. This result may be attributed to the relatively smaller number of vessels in BPH than those in the tumor areas with a significant number of various stages of maturation blood vessels.19 However, in measuring MPI to test the degree of vessel maturity, we determined that PCa exhibited lower proportion than BPH, suggesting that the degree of vessel maturity in PCa was lower than that in BPH.
Carbogen can alter the signal intensities observed on T2*-weighted MRI images by two ways, namely, by increasing the oxy/deoxyhemoglobin ratio and by elevating the blood perfusion. However, the most important effect demonstrated on the T2*-weighted MRI images of tumors is attributed to the signal alteration resulting from blood oxygenation saturation changes.20 As the oxygen saturation of blood decreases, the amount of deoxyhemoglobin increases. The magnetic susceptibility of deoxyhemoglobin (caused by the unpaired electrons of iron) leads to susceptibility gradients that decrease signal intensity in T2*-weighted MR images. Any increase in hemoglobin oxygen saturation is expected to increase the signal. Our results indicated that most of the PCa samples exhibited a lower increase in signal values than BPH. The possible reasons for this observation are described as follows: first, the abnormality of tumor vessels characterized with immature vessels devoid of pericytes reduced the reactivity to carbogen. Second, although many tumor vessels in PCa are covered with pericytes or smooth muscle cells, some of the α-SMA-positive cells are not sufficiently functional to maintain vessel integrity, and these pericytes were loosely attached and exhibited multiple abnormalities in contrast to normal tissues,21 thus reducing reactivity to carbogen gas. The effects caused by the vasomotion of tumor vessels will decrease blood perfusion and limit red cell flux,22,23 thus reducing the level of blood O2 saturation. Third, the blood from immature vessels in the tumor will flow to the mature vessels in the adjacent normal tissue when carbogen is inhaled; this phenomenon is called “steal effect” by Rijpkema et al,11 which can further decrease blood perfusion and the level of O2 saturation in the blood of the tumor. Finally, the unbalanced oxygen consumption in PCa results from the rapid development of the malignant tumor, and reduced oxygen supply aggravates the decrease in O2 saturation. Thus, a decrease in blood O2 saturation results in a relative increase in the oxy/deoxy hemoglobin, causing a relatively lower increase in signal.
Accordingly, we hypothesized that the degree of mature vessels may play an important role in determining the change in signal. To test this hypothesis, MPI was employed to measure the degree of mature vessels, and a correlation analysis was performed with the increased signal. We determined that a relatively positive correlation exists between MPI and the increased signal in PCa or BPH. Our result corroborates the work of Neeman et al,12 who demonstrated that tumor blood flow may respond heterogeneously after exposure to carbogen as a result of the varying proportions of blood vessels with smooth muscle cells. However, in our study, we found no correlation between the increased signal and MPD or MVD. The possible reason for this observation is that the changed signal value that we measured was the average of all the pixels of ROI, and the signal induced by mature and immature vessels in the same ROI can affect each other. Thus, the signal value we obtained cannot represent the signal induced by mature or immature vessels individually.
In our study, we also found that the signal was heterogeneous in PCa. Such phenomenon can be explained by the study of Rijpkema et al,11 which demonstrated that the heterogeneous signal in the tissue was induced by the redistribution blood flow from immature vessels to the mature carbogen vessels because carbogen may cause the vasodilatation in mature vessels of the tumor or noncarcinoma tissues but not in the immature vessels of the tumor. Thus, this phenomenon may be an additional source of functional information concerning individual tumor vascularization.
Additionally, we draw a conclusion that the changed signal obtained from BOLD MRI during carbogen breathing can reflect the vascular maturity owning to the positive correlation between the pericytes coverage and the changed signal obtained from BOLD MRI. Based on this point, the BOLD MR technique may help monitor the effectiveness of antiangiogenic therapy, because the “normalized” tumor vascular characterized with more pericytes coverage was one of the pathologic hallmarks in the process of antiangiogenic therapy24 and the more pericytes coverage, the better outcome for patients with cancer.4–8
However, there are some limitations in our study. The most serious limitation was that we cannot correlate the signals of BOLD-MR with CD31 and α-SMA in a point-by-point manner, which possibly caused mismatch between histopathology and radiology correlation because heterogeneity is a hallmark of tumor. Thus, the PCa sample from BOLD MRI-guided biopsy is needed for further work. Additionally, the individual improper mask fitting may be an important limiting factor in the accurate determination of carbogen-induced signal intensity changes by PCa and BPH.
Conclusion
Monitoring of the response to carbogen breathing measured by BOLD MRI can reflect the degree of vessel maturity, which not only can help differentiate PCa from BPH but also may be useful in monitoring the effectiveness of antiangiogenic therapy.
Disclosure
The authors report no conflicts of interest in this work.
References
Parkin DM, Bray F, Ferlay J, Pisani P. Global cancer statistics, 2002. CA Cancer J Clin. 2005;55(2):74–108. | ||
Jain RK. Antiangiogenesis strategies revisited: from starving tumors to alleviating hypoxia. Cancer Cell. 2014;26(5):605–622. | ||
Rivera LB, Bergers G. CANCER. Tumor angiogenesis, from foe to friend. Science. 2015;349(6249):694–695. | ||
Jain RK. Normalizing tumor vasculature with anti-angiogenic therapy: a new paradigm for combination therapy. Nat Med. 2001;7(9):987–989. | ||
Batchelor TT, Gerstner ER, Emblem KE, et al. Improved tumor oxygenation and survival in glioblastoma patients who show increased blood perfusion after cediranib and chemoradiation. Proc Natl Acad Sci U S A. 2013;110(47):19059–19064. | ||
Winkler F, Kozin SV, Tong RT, et al. Kinetics of vascular normalization by VEGFR2 blockade governs brain tumor response to radiation: role of oxygenation, angiopoietin-1, and matrix metalloproteinases. Cancer Cell. 2004;6(6):553–563. | ||
Huang Y, Yuan J, Righi E, et al. Vascular normalizing doses of antiangiogenic treatment reprogram the immunosuppressive tumor microenvironment and enhance immunotherapy. Proc Natl Acad Sci U S A. 2012;109(43):17561–17566. | ||
Huang Y, Goel S, Duda DG, Fukumura D, Jain RK. Vascular normalization as an emerging strategy to enhance cancer immunotherapy. Cancer Res. 2013;73(10):2943–2948. | ||
Sorensen AG, Batchelor TT, Zhang WT, et al. A “vascular normalization index” as potential mechanistic biomarker to predict survival after a single dose of cediranib in recurrent glioblastoma patients. Cancer Res. 2009;69(13):5296–5300. | ||
Prasad PV, Edelman RR, Epstein FH. Noninvasive evaluation of intrarenal oxygenation with BOLD MR. Circulation. 1996;94(12):3271–3275. | ||
Rijpkema M, Kaanders JH, Joosten FB, van der Kogel AJ, Heerschap A. Effect of breathing a hyperoxic hypercapnic gas mixture on blood oxygenation and vascularity of head-and-neck tumors as measured by magnetic resonance imaging. Int J Radiat Oncol Biol Phys. 2002;53(5):1185–1191. | ||
Neeman M, Dafni H, Bukhari O, Braun RD, Dewhirst MW. In vivo BOLD contrast MRI mapping of subcutaneous vascular function and maturation: validation by intravital microscopy. Magn Reson Med. 2001;45(5):887–898. | ||
Gilead A, Meir G, Neeman M. The role of angiogenesis, vascular maturation, regression and stroma infiltration in dormancy and growth of implanted MLS ovarian carcinoma spheroids. Int J Cancer. 2004;108(4):524–531. | ||
Abramovitch R, Dafni H, Smouha E, Benjamin LE, Neeman M. In vivo prediction of vascular susceptibility to vascular susceptibility endothelial growth factor withdrawal: magnetic resonance imaging of C6 rat glioma in nude mice. Cancer Res. 1999;59(19):5012–5016. | ||
Baudelet C, Cron GO, Ansiaux R, et al. The role of vessel maturation and vessel functionality in spontaneous fluctuations of T2*-weighted GRE signal within tumors. NMR Biomed. 2006;19(1):69–76. | ||
Weidner N, Carroll PR, Flax J, Blumenfeld W, Folkman J. Tumor angiogenesis correlates with metastasis in invasive prostate carcinoma. Am J Pathol. 1993;143(2):401–409. | ||
Eberhard A, Kahlert S, Goede V, Hemmerlein B, Plate KH, Augustin HG. Heterogeneity of angiogenesis and blood vessel maturation in human tumors: implications for antiangiogenic tumor therapies. Cancer Res. 2000;60(5):1388–1393. | ||
Folkman J. Tumor angiogenesis. Adv Cancer Res. 1974;19(0):331–358. | ||
Killingsworth MC, Wu X. Vascular pericyte density and angiogenesis associated with adenocarcinoma of the prostate. Pathobiology. 2011;78(1):24–34. | ||
Powell ME, Collingridge DR, Saunders MI, et al. Improvement in human tumor oxygenation with carbogen of varying carbon dioxide concentrations. Radiother Oncol. 1999;50(6):167–171. | ||
Morikawa S, Baluk P, Kaidoh T, Haskell A, Jain RK, McDonald DM. Abnormalities in pericytes on blood vessels and endothelial sprouts in tumors. Am J Pathol. 2002;160(3):985–1000. | ||
Dewhirst MW, Kimura H, Rehmus SW, et al. Microvascular studies on the origins of perfusion-limited hypoxia. B J Cancer Suppl. 1996;27:S247–S251. | ||
Intaglietta M, Myers RR, Gross JF, Reinhold HS. Dynamics of microvascular flow in implanted mouse mammary tumors. Bibl Anat. 1977;15(15 pt 1):273–276. | ||
Jain RK. Normalization of tumor vasculature: an emerging concept in antiangiogenic therapy. Science. 2005;307(5706):58–62. |
 © 2016 The Author(s). This work is published and licensed by Dove Medical Press Limited. The full terms of this license are available at https://www.dovepress.com/terms.php and incorporate the Creative Commons Attribution - Non Commercial (unported, v3.0) License.
By accessing the work you hereby accept the Terms. Non-commercial uses of the work are permitted without any further permission from Dove Medical Press Limited, provided the work is properly attributed. For permission for commercial use of this work, please see paragraphs 4.2 and 5 of our Terms.
© 2016 The Author(s). This work is published and licensed by Dove Medical Press Limited. The full terms of this license are available at https://www.dovepress.com/terms.php and incorporate the Creative Commons Attribution - Non Commercial (unported, v3.0) License.
By accessing the work you hereby accept the Terms. Non-commercial uses of the work are permitted without any further permission from Dove Medical Press Limited, provided the work is properly attributed. For permission for commercial use of this work, please see paragraphs 4.2 and 5 of our Terms.