")
Back to Journals » Diabetes, Metabolic Syndrome and Obesity » Volume 14
Blood Levels of Glycated Hemoglobin, D-Dimer, and Fibrinogen in Diabetic Retinopathy
Authors Zhao H, Zhang LD, Liu LF, Li CQ, Song WL, Pang YY, Zhang YL, Li D
Received 2 March 2021
Accepted for publication 5 May 2021
Published 2 June 2021 Volume 2021:14 Pages 2483—2488
DOI https://doi.org/10.2147/DMSO.S309068
Checked for plagiarism Yes
Review by Single anonymous peer review
Peer reviewer comments 3
Editor who approved publication: Professor Ming-Hui Zou
Heng Zhao,1,* Li-Dan Zhang,2,* Li-Fang Liu,1 Chun-Qing Li,3 Wei-Li Song,3 Yong-Yang Pang,1 Yun-Liang Zhang,1 Dan Li4
1Endocrinology Laboratory, The First Central Hospital of Baoding, Baoding, Hebei Province, 071000, People’s Republic of China; 2Department of Nuclear Medicine, The First Central Hospital of Baoding, Baoding, Hebei Province, 071000, People’s Republic of China; 3Outpatient Department, The First Central Hospital of Baoding, Baoding, Hebei Province, 071000, People’s Republic of China; 4Department of Ophthalmology, Affiliated Hospital of Hebei University, Baoding, Hebei Province, 071000, People’s Republic of China
*These authors contributed equally to this work
Correspondence: Dan Li
Department of Ophthalmology, Affiliated Hospital of Hebei University, Baoding, Hebei Province, 071000, People’s Republic of China
Tel +86 189 31251885
Fax +86 031 25981539
Email [email protected]
Yun-Liang Zhang
Endocrinology Laboratory, The First Central Hospital of Baoding, Baoding, Hebei Province, 071000, People’s Republic of China
Tel +86 137 31251133
Fax +86 0312-5976520
Email [email protected]
Purpose: This study aimed to describe the levels of glycated hemoglobin (HbA1c), D-dimer (D-D), and fibrinogen (FIB) in different types of diabetic retinopathy (DR).
Methods: A total of 61 patients with diabetes, who were treated in our department between November 2017 and May 2019, were selected. According to their non-mydriatic fundus photography and fundus angiography results, patients were divided into three groups, ie, the non-DR (NDR) group (n=23), the non-proliferative DR (NPDR) group (n=17), and the proliferative DR (PDR) group (n=21). A control group of 20 people who had tested negative for diabetes was also included. The levels of HbA1c, D-D, and FIB were measured and compared, respectively.
Results: The mean values of HbA1c were 6.8% (5.2%, 7.7%), 7.4% (5.8%, 9.0%), and 8.5% (6.3%, 9.7%) in the NDR, NPDR, and PDR groups, respectively. The control group values were 4.9% (4.1%, 5.8%). These results indicated a significant statistical difference between groups. The mean values of D-D were 0.39 ± 0.21 mg/L, 1.06 ± 0.54 mg/L, and 1.39 ± 0.59 mg/L in the NDR, NPDR, and PDR groups, respectively. The control group result was 0.36 ± 0.17 mg/L. The values of the NPDR and PDR groups were significantly higher than those of the NDR and control groups, and the value of the PDR group was significantly higher than that of the NPDR group, indicating a significant difference between the groups (P < 0.001). The mean values of FIB were 3.07 ± 0.42 g/L, 4.38 ± 0.54 g/L, and 4.46 ± 1.09 g/L in the NDR, NPDR, and PDR groups, respectively. The control group result was 2.97 ± 0.67 g/L. The difference between the groups was statistically significant (P < 0.05).
Conclusion: Blood levels of HbA1c, D-D, and FIB in the PDR group were significantly higher than in the NPDR group.
Keywords: glycated hemoglobin, HbA1c, D-dimer, D-D, fibrinogen, FIB, diabetic retinopathy, DR, microangiopathy
Introduction
Diabetes mellitus (DM) has in recent years become a frequently occurring disease with complications that can cause multisystem lesions, among which is microangiopathy, the main cause of death among diabetics.1 Glycated hemoglobin (HbA1c), a major marker of blood glucose control, primarily reflects the average blood glucose level of patients in the preceding two-to-three months and has become an internationally recognized gold standard for indicating long-term blood glucose monitoring for diabetes. In coagulation function examination, D-dimer (D-D) can specifically reflect secondary hyperfibrinolysis and a hypercoagulable state in the body and serves as an index sensitive to reflecting thrombosis. Fibrinogen (FIB) concentration can indicate a prethrombotic state in the body. Existing studies suggested that monitoring coagulation function and HbA1c in patients with DM played a role in judging the progression of complications of the condition,2,3 particularly for microangiopathy.4 Diabetic retinopathy (DR) is one of the most common microvascular complications and also a major cause of diabetic blindness. The above three examination types present advantages in that they are simple to operate and widely popular within clinical settings. In this study, we observed the HbA1c, D-D, and FIB values in patients with different degrees of DR and compared the results with those of non-DR DM patients and non-DM physical examinees, thereby exploring the significance of HbA1c, D-D, and FIB tests in the monitoring of the occurrence and development of DR.
Materials and Methods
Clinical Materials
A total of 61 diabetic patients (122 eyes) treated between November 2017 and May 2019 in the Outpatient Department of the First Central Hospital of Baoding City (China) were selected for the study. Patient inclusion criteria were as follows: patients diagnosed with diabetes according to the China Guidelines for the Prevention and Treatment of Type 2 Diabetes (2017), and healthy physical examination subjects who are excluded from diabetes. Exclusion criteria were as follows: (1) patients who were pregnant; (2) patients who were pre-diabetic; (3) patients younger than 14 years; (4) the presence of special drug effects, such as recent glucocorticoid application. According to their non-mydriatic fundus photography and fluorescein fundus angiography results, the participants were divided into three groups as follows: a non-DR (NDR) group comprising 23 patients (46 eyes), 11 male and 12 female, aged 43–76 years old with an average age of 61.78 ± 6.28 years; a non-proliferative DR (NPDR) group, comprising 17 patients (34 eyes), 10 male and 7 female, aged 47–70 years old with an average age of 60.89 ± 4.27 years; a proliferative DR (PDR) group comprising 21 patients (42 eyes), 9 male and 12 female, aged 51–73 years old with an average age of 62.24 ± 7.91 years. The control group comprised 20 people (40 eyes) in total who had tested negative for diabetes, 8 male and 12 female, aged 50–75 years with an average age of 64.54 ± 3.11 years. None of the patients had any complicated macroangiopathy, such as coronary heart disease or cerebral infarction, and patients who had had recent trauma, surgery, infection, malignant tumor, or other general organic diseases were excluded. All participants provided written informed consent for inclusion in the study.
Diagnostic and Staging Criteria
The DR patients conformed to the diagnostic criteria issued by the Ophthalmology Group of the Ophthalmology Branch and the Chinese Medical Association.5 We used a non-mydriatic fundus camera (Canon CR-2, Tokyo, Japan) to record the posterior pole of the patient’s fundus and captured a single 30°–45° fundus photo. A trained ophthalmologist provided a written diagnostic report, based on the image. In the case of DR, fundus angiography was performed using Heidelberg retinal angiography-2 (HRA-2) (Heidelberg Engineering, Germany), and seven-field early treatment diabetic retinopathy study (ETDRS) fluorescein angiography (FA) was used to confirm NPDR or PDR. Participants were divided into NPDR and PDR groups, based on whether they exhibited retinal neovascularization. The non-DR diabetic patients were labeled as the NDR group; patients who had tested negative for diabetes were regarded as the control group.
Sample Collection
Blood Glycated Hemoglobin Determination
In the morning, 1.8 mL fasting venous blood was collected and placed in an anticoagulant tube. After 2 h, it was centrifuged for 20 min to detect the HbA1c level.
Blood D-Dimer and Fibrinogen Determination
In the morning, 1.8 mL fasting venous blood was collected, injected into an anticoagulant tube, and centrifuged for 10 min. Following on, its supernatant was used to carry out D-D and FIB detection.
Detection Method and Reagent
The HbA1c detection was performed using the Beckman AU5821 automatic biochemical analyzer and its supported reagent. The diabetic cut-off value was >6.20%, and the normal value was 3.00%–6.20%.
The D-D and FIB detection was carried out using the STA Compact Max® automatic coagulation analyzer (Stago, France) and its supported reagent. The positive reference values were D-D > 0.5 mg/L and FIB > 4 g/L, while the normal values were D-D ≤ 0.5 mg/L and FIB 2–4 g/L.
Statistical Analysis
The SPSS Statistics (v.11.5) software program was used to process the results; the data were expressed with mean ± standard deviation (± s). Based on the normality test, the above data conformed to a normal distribution. For the HbA1c, D-D, and FIB in the four groups, one-way analyses of variance were carried out between the groups. Additionally, D-D and FIB levels with a statistical significance were further compared with one another; P < 0.05 indicated a difference with statistical significance.
Results
A Comparison of the Ages of the Four Groups of Patients
The subjects in the NDR group, NPDR group, PDR group and control group were 61.78±6.28, 60.89±4.27, 62.24±7.91 and 64.54±3.11 years of age, respectively, and their ages showed a normal distribution with a normal distribution test. One-way analysis of variance showed that the difference was of no statistical significance (P=0.157) (Table 1).
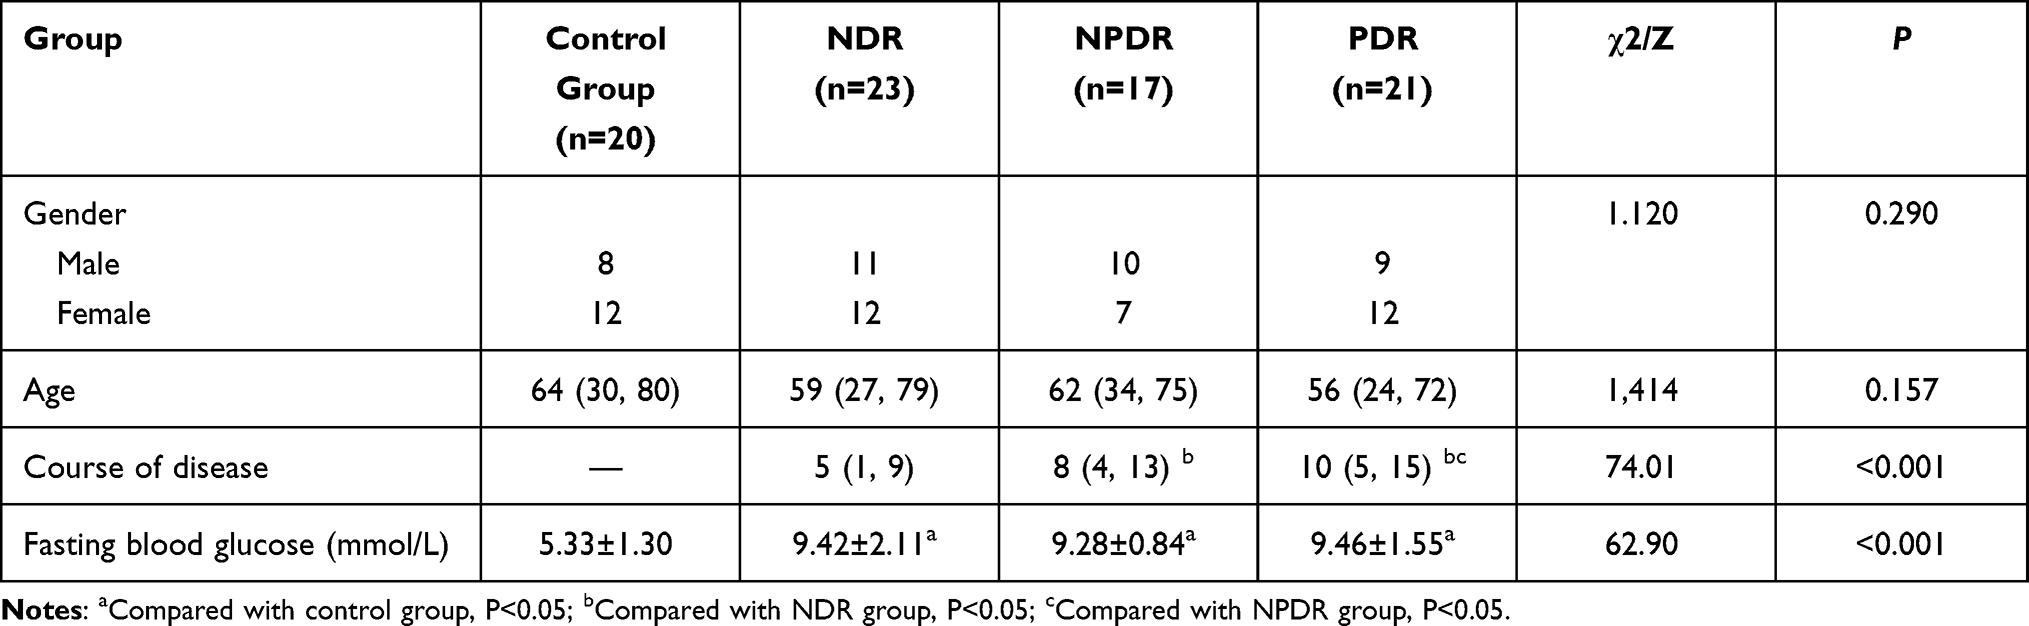 |
Table 1 Comparison of Baseline Clinical and Ophthalmic Characteristics Between the Control Group and the NDR, NPDR, and PDR Groups |
A Comparison of the Average Values of HbA1c, D-D and FIB in the Four Groups of Patients
The average values of HbA1c in the NDR group, NPDR group, PDR group, and control group were 6.58±0.95%, 7.45±1.21%, 8.04±1.81% and 4.53±0.41%, respectively. The HbA1cs of these four groups showed a normal distribution with the normal distribution test. Using one-way analysis of variance, the difference was shown to be of statistical significance (P<0.001) (Table 2). Further comparison between the four groups indicated the difference between the groups was significant (P<0.05) (Table 3).
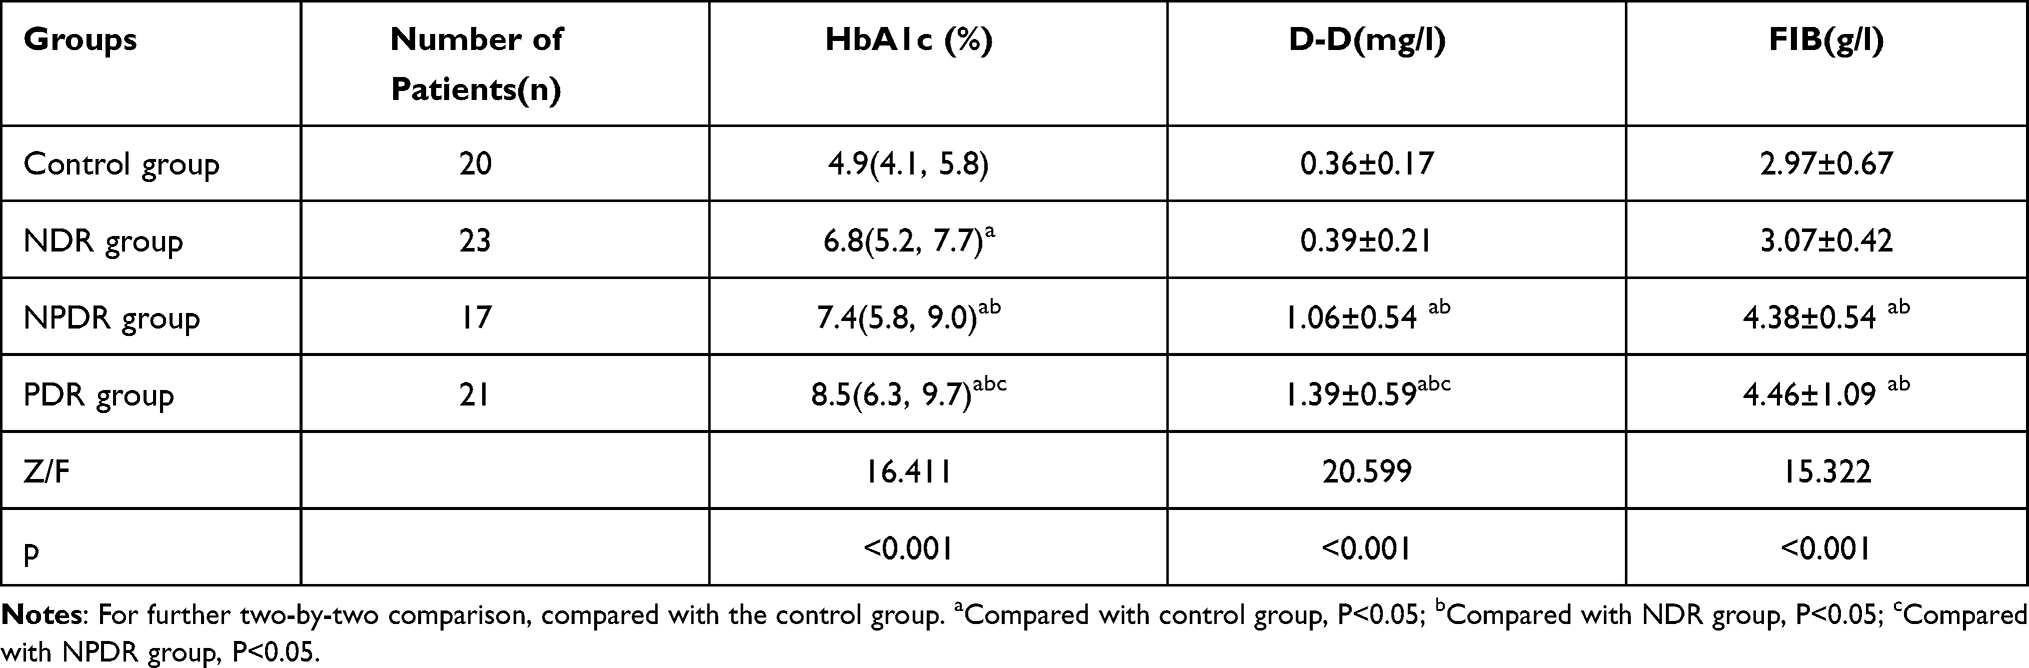 |
Table 2 Comparison of HbA1c, D-D, FIB Between Control Group and NDR, NPDR and PDR Groups |
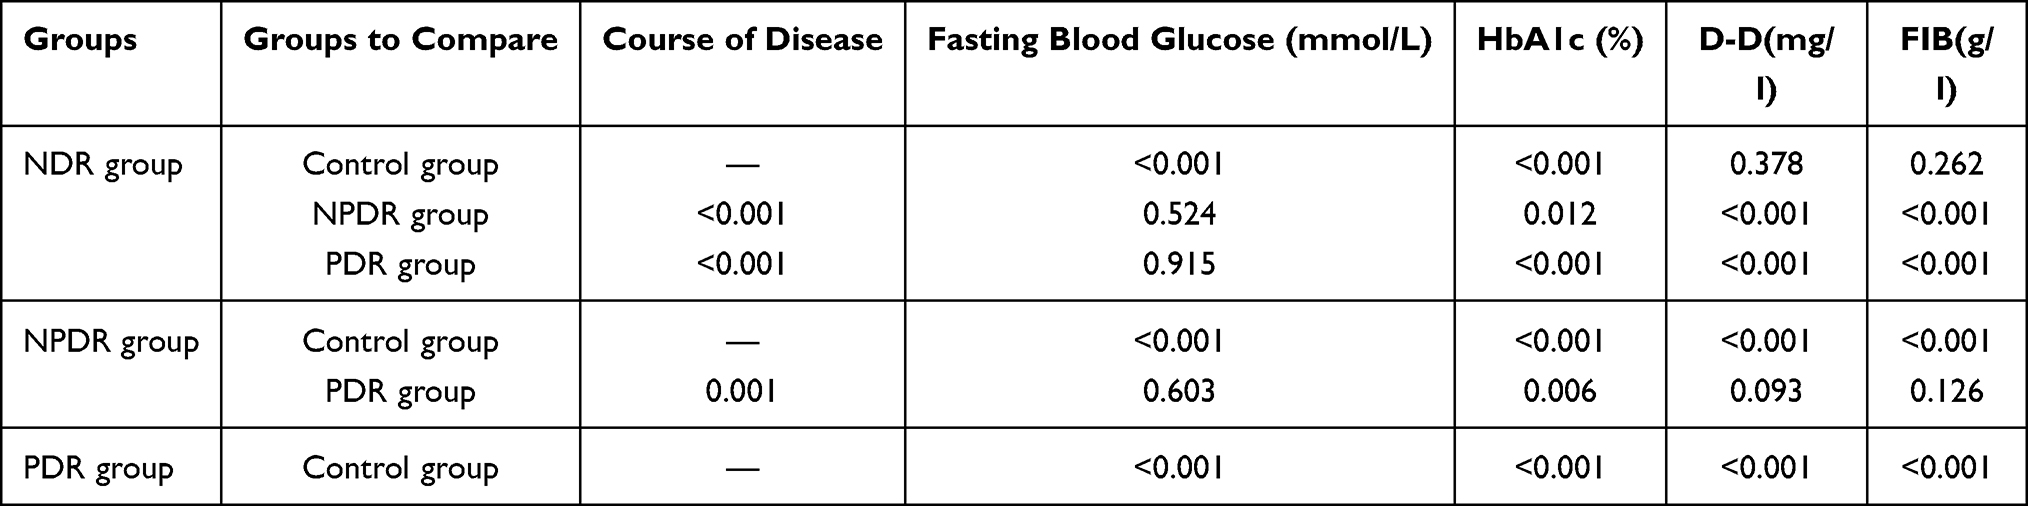 |
Table 3 The Pairwise Comparison Between the Control Group, NDR, NPDR, and PDR Groups |
The average value of D-D in the NDR group, NPDR group, PDR group, and control group were 0.39±0.21mg/L, 1.06±0.54mg/L, 1.39±0.59mg/L and 0.36±0.17mg/L, respectively, and the D-Ds of these four groups showed a normal distribution with the normal distribution test. Using one-way analysis of variance, the difference was shown to be of statistical significance (P<0.001) (Table 2). Through further comparison between the four groups, the results showed that the values of the NPDR and PDR groups were significantly higher than those of the NDR and control groups, and the value of the PDR group was significantly higher than that of the NPDR group, indicating that the difference between groups was significant (P<0.05). However, the difference between the NDR group and the control group was of no statistical significance (P>0.05) (Table 3).
The average value of FIB in the NDR group, NPDR group, PDR group and control group were 3.07±0.42 g/L, 4.38±0.54 g/L, 4.46±1.09 g/L and 2.97±0.67g/L, respectively and the FIBs of these four groups showed a normal distribution with a normal distribution test. Using one-way analysis of variance, the difference was of statistical significance (P<0.001) (Table 2). Further comparison between the four groups showed that the values of the NPDR and PDR groups were significantly higher than those of the NDR and control groups, indicating that the difference between the groups was significant (P<0.05). However, the differences between the NPDR group and PDR group, the NDR and the control group were of no statistical significance (P>0.05) (Table 3).
Discussion
In recent years, diabetes incidence rates have increased annually while that of DR has also risen. DR is currently the most common blindness-causing oculopathy.6 A drastic fluctuation in blood glucose (BG)/sugar can cause hypercoagulability of blood, resulting in a series of vascular complications.7 Therefore, monitoring BG levels and the blood coagulation state of diabetic patients as DR develops is of significant interest to researchers in China and elsewhere.
Glycated hemoglobin is produced when hemoglobin in red blood cells combines with blood glucose and typically reflects the patient’s blood glucose control within the preceding 8–12 weeks. The generation of HbA1c occurs slowly but once completed, it cannot be easily decomposed; as such, its presence can assist in diabetes BG monitoring.8 A long-term hyperglycemic state may cause irreversible vascular change but HbAlc remains a good index of BG levels in diabetic patients.9 The HbAlc level not only reflects BG content but is also closely linked to diabetic complications such as microangiopathy and macroangiopathy.10 In this study, a comparison was made between HbAlc in different types of DR patients. Based on the results, the values in the NPDR and PDR groups were significantly higher than those in the NDR and control groups, and the value of the PDR group was significantly higher than that of the NPDR group. Recent research has shown that when the HbAlc level constantly rises, it can influence the ability of hemoglobin to combine with and carry oxygen, thus affecting retinal function.11 A rise in the HbA1c level is linked to an increase in the risk of diabetic complications,12 while a drop in the HbA1c level can reduce the risk of DR.13 An et al14 found that the HbA1c level of DR patients was significantly higher than that of NDR patients. In DR patients, particularly PDR patients, BG and HbA1c levels were relatively high and with an increase in the BG and HbA1c levels, the degree of patients’ visual impairment increased.15 The above study is consistent with our results. However, the HbA1c level can be affected by anemia, hemoglobin life, age, gestation, ethnic group, and other factors, and it cannot reflect rapid changes in blood glucose in the short term as it has a “delayed effect.” Therefore, some scholars believe that there are limitations to its reference value.16
The pathological characteristics of DR are retinal neovascularization formation and blood–retinal barrier damage; however, the mechanism of how diabetes can lead to DR onset is complex. Currently, it is believed that functional damage to smooth muscle and endothelial cells, as well as fibrinolytic function abnormality in the retinal microvascular are two pathological basic causes among diabetic patients suffering from retinopathy.17 A change in coagulation function may be an important indicator of the progression of diabetic microangiopathy. Concurrently, D-D is the specific degradation product of cross-linked fibrin by fibrinolytic enzymes, and determining D-D concentration in plasma can be done rapidly, simply, and cost-effectively. Based on these and other advantages, D-D testing is commonly performed. In the current study, a comparison of the average D-D values showed that those in the NPDR and PDR groups were significantly higher than in the NDR and control groups, and the value of the PDR group was significantly higher than in the NPDR group. Additional Chinese studies have shown that the coagulation function of diabetic patients does not initially change; however, if the patient develops microangiopathy the coagulation function will change significantly.4 As the degree of DR degradation increased, the D-D level also gradually rose and reached a peak value in PDR patients.18 This finding was consistent with those of the current study.
Fibrinogen is an indicator of hypercoagulability and decreased fibrinolytic activity, and its increased level can seriously affect blood coagulation and blood hemorheology. It is a thrombosis precursor substance, and the blood FIB in diabetic patients is an important basis for the formation of a hypercoagulable state in diabetic plasma. A comparison of the average FIB value in this study showed that the NPDR and PDR group values were considerably higher than those in the NDR and control groups. Additional research found that the FIB level of DR patients was much higher than in NDR patients, indicating that an increase in the FIB level has a role in the occurrence and development of DR and may speed up its progress; however, the specific mechanism involved in this process is not yet entirely clear.19,20
The above results are consistent with those of the current study. In addition, related studies indicated that the combined detection of D-D and FIB can be used to monitor and observe changes in the hypercoagulable state and hemorheology of the body, which is conducive to the early diagnosis, treatment, and prognosis of type 2 diabetes combined with microangiopathy.21
Several limitations in the current study that may have influenced its outcomes should be noted. As this was an interdisciplinary study, the number of patients willing to concurrently conduct ophthalmology and blood examination during the study period was limited. Additionally, some patients who required fundus fluorescence angiography required blood pressure control and had to undertake an allergic history prior to examination. The refusal of further examination resulted in the loss of participants. Accordingly, the sample size was small. We will continue expanding the observation sample size in future research. Furthermore, the ophthalmic examinations were performed as a qualitative grouping only; no additional quantitative examinations, such as optical coherence tomography measurements of macular thickness or visual acuity tests were performed. Finally, this study represents cross-sectional observations, which could not reflect changes in the disease process; further dynamic observations are needed in future research.
Conclusions
In summary, the blood levels of HbA1c, D-D, and FIB among patients with different degrees of DM showed significant differences. Blood levels in the NPDR and PDR groups were significantly higher compared with the NDR and normal blood glucose groups. Therefore, in the process of diagnosing and treating patients with DM, the combined detection of HbA1c, D-D, and FIB can improve the detection rate of early microvascular injury in diabetic patients and facilitate assessing the risk of microvascular complications, which will contribute to the early diagnosis of diabetes combined with retinopathy.
Ethics Statement
This study was conducted with approval from the Ethics Committee of Affiliated Hospital of Hebei University (Approval No. 2019063), and it was conducted in accordance with the declaration of Helsinki. Written informed consent was obtained from all participants.
Funding
2021 Baoding City Science and Technology Bureau Science and Technology Development Plan Projects.
Disclosure
The authors report no conflicts of interest in this work.
References
1. Aryan Z, Ghajar A, Faghihi -kashani S, et al. Baseline High-Sensitivity C-reactive protein predicts macrovascular and microvascular complications of Type 2 Diabetes: a population-based study. Ann Nutr Metab. 2018;72(4):287–295. doi:10.1159/000488537
2. Dikshit S. Fibrinogen degradation products and periodontitis:deciphering the connection. J Clin Diagn Res. 2015;9(12):ZCl0–12.
3. Matuleviciene-Anangen V, Rosengren A, Svensson AM, et al. Glycaemic control and excess risk of major coronary events in persons with type 1 diabetes. Heart. 2017;103(21):1687–1695.
4. Zhang J, Shuxia H. The value of glycated hemoglobin and coagulation monitoring in determining the progression of diabetes mellitus. J Ningxia Med Univ. 2016;38(11):1333–1335.
5. Chinese Medical Association Ophthalmology Group. Clinical guidelines for the treatment of diabetic retinopathy in China (2014) [J]. Zhong Hua Yan Ke Za Zhi. 2014;50(11):
6. Ogurtsova K, Da RFJ, Huang Y, et al. IDF Diabetes Atlas: global estimates for the prevalence of diabetes for 2015 and 2040. Diabetes Res Clin Pract. 2017;128:
7. Liu M, Ao L, Hu X, et al. Influence of blood glucose fluctuation, C-peptide level and conventional risk factors on carotid artery intima -media thickness in Chinese Han patients with type 2 diabetes mellitus. Eur J Med Res. 2019;24(1):13.
8. Erem C, Hacihasanoglu A, Celik S, et al. Coagula. tion and fibrinoly-sis parameters in type 2 diabetic patients with and without diabetic vascular complications. Med Princ Pract. 2005;14(1):22–30.
9. Catalani E, Cervia D. Diabetic retinopathy: a matter of retinal ganglion cell homeostasis. Neural Regen Res. 2020;15(7):1253–1254.
10. Wang SY, Andrews CA, Herman WH, et al. Incidence and risk factors for developing diabetic retinopathy among youths with Type 1 or Type 2 diabetes throughout the United States. Ophthalmology. 2017;124(4):424–430.
11. Jorgensen CM, Hardarson SH, Bek T. The oxygen satura‐ tion in retinal vessels from diabetic patients depends on the severity and type of vision‐threatening retinopathy. Acta Ophthalmol. 2014;92(1):
12. Lind M, Pivodic A, Svensson AM, et al. HbA1c level as a risk factor for retinopathy and nephropathy in children and adults with type 1 diabetes: swedish population based cohort study. BMJ. 2019;366:l4894.
13. Calderon GD, Juarez OH, Hernandez GE, et al. Oxidative stress and diabetic retinopathy:development and treatment. Eye. 2017;10(47):963–967.
14. Jingsi A, Lu L, An G, et al. Risk factors for diabetic retinopathy in combination with diabetic foot. Zhong Guo Lao Nian Xue Za Zhi. 2019;8(39):3916–3920.
15. Wang Y, Cui L, Song Y. Levels of blood sugar and glycosylated hemoglobin and their correlations with degree of visual impairment in patients with diabetic retinopathy. J PLA Med. 2019;31(12):73–76.
16. Yazdanpanah S, Rabiee M, Tahriri M, et al. Evaluation of glycated albumin (GA) and GA/HbA1c ratio for diagnosis of diabetes and glycemic control: a comprehensive review. Crit Rev Clin Lab Sci. 2017;54(4):219–232.
17. Sorrentino FS, Matteini S, Bonifazzi C, Sebastiani A, Parmeggiani F. Diabetic retinopathy and endothelin system: microangiopathy versus endothelial dysfunction. Eye (Lond). 2018;32(7):1157–1163.
18. Yang A, Zheng H, Liu H. Changes in plasma PAI-1 and D-dimer levels in patients with diabetic retinopathy and their significance. Shan Dong Yi Yao. 2011;51(38):89–90.
19. Fu G, Xu B, Hou J, Zhang M. Analysis of coagulation in patients with type 2 diabetes mellitus combined with retinopathy. Lab Med Clin. 2015;7:885–887.
20. Tomic M, Ljubic S, Kastelan S, et al. Inflammation,haemostatic disturbance,and obesity:possible link to pathogenesis of diabetic retinopathy in type 2 diabetes. Mediators Inflamm. 2013;2013:818671.
21. Hua L, Sijiang L, Feng Z, Shuxin Y. Application of the joint detection of glycosylated hemoglobin A1c, D-dimer and fibrinogen in diagnosis of microangiopathy in patients with type 2 diabetes mellitus. Int J Lab Med. 2013;34(11):1382–1383.
 © 2021 The Author(s). This work is published and licensed by Dove Medical Press Limited. The full terms of this license are available at https://www.dovepress.com/terms.php and incorporate the Creative Commons Attribution - Non Commercial (unported, v3.0) License.
By accessing the work you hereby accept the Terms. Non-commercial uses of the work are permitted without any further permission from Dove Medical Press Limited, provided the work is properly attributed. For permission for commercial use of this work, please see paragraphs 4.2 and 5 of our Terms.
© 2021 The Author(s). This work is published and licensed by Dove Medical Press Limited. The full terms of this license are available at https://www.dovepress.com/terms.php and incorporate the Creative Commons Attribution - Non Commercial (unported, v3.0) License.
By accessing the work you hereby accept the Terms. Non-commercial uses of the work are permitted without any further permission from Dove Medical Press Limited, provided the work is properly attributed. For permission for commercial use of this work, please see paragraphs 4.2 and 5 of our Terms.