")
Back to Journals » OncoTargets and Therapy » Volume 13
Bit1 Silencing Enhances the Proliferation, Migration, and Invasion of Glioma Cells Through Activation of the IL-6/STAT3 Pathway
Authors Wang Z, Yin M, Wang R, Liu X, Yan D
Received 27 November 2019
Accepted for publication 12 February 2020
Published 24 March 2020 Volume 2020:13 Pages 2469—2481
DOI https://doi.org/10.2147/OTT.S240081
Checked for plagiarism Yes
Review by Single anonymous peer review
Peer reviewer comments 2
Editor who approved publication: Dr Carlos E Vigil
Zhengfeng Wang,1,* Menglei Yin,1,* Ruihua Wang,2 Xianzhi Liu,1 Dongming Yan1
1Department of Neurosurgery, The First Affiliated Hospital of Zhengzhou University, Zhengzhou 450052, People’s Republic of China; 2Department of Nuclear Medicine, The First Affiliated Hospital of Zhengzhou University, Zhengzhou 450052, People’s Republic of China
*These authors contributed equally to this work
Correspondence: Zhengfeng Wang; Dongming Yan
Department of Neurosurgery, The First Affiliated Hospital of Zhengzhou University, No. 1 East Jianshe Road, Zhengzhou, Henan 450052, People’s Republic of China
Email [email protected]; [email protected]
Background: Several studies have indicated that the anoikis effector Bcl-2 inhibitor of transcription 1 (Bit1) can promote or inhibit tumor progression depending on the nature of the malignancy. However, its regulatory effects on gliomas are unknown.
Methods: This study aimed at assessing Bit1 expression in glioma tissues and cells, its subsequent effects on glioma cell apoptosis, proliferation, invasion, and migration, and the underlying molecular mechanisms.
Results: The findings showed that lower Bit1 expressions in glioma tissues as well as a negative correlation between Bit1 expression and glioma grade. Additional findings also revealed that Bit1 silencing significantly inhibited anoikis and enhanced glioma cell proliferation, invasion, and migration. Further analysis showed that the decrease in Bit1 expressions led to malignancy proliferation and anoikis resistance through activation of the IL-6/STAT3 signaling pathway.
Conclusion: Our data suggested that Bit1 may play an anti-oncogenic role in glioma cells and that a decrease in its expressions might induce glioma cell proliferation, migration, and invasion through the IL-6/STAT3 signaling pathway.
Keywords: glioma, anoikis, Bcl-2 inhibitor of transcription 1, IL-6/STAT3 signaling pathway
Introduction
Gliomas account for about 80% of all intracranial malignancies and are the most commonly encountered primary intracranial tumors.1–3 Several methods have been used to treat gliomas throughout the years with little effects on their high recurrence rate prognosis poor. The 5-year survival rate of high-grade gliomas such as GBM is only 5%.4,5 Therefore, understanding their molecular mechanisms might hold the key to new and more effective therapeutic methods. Bcl-2, an inhibitor of transcription (Bit1), is a mitochondrial protein crucial for cell-detachment-induced apoptosis or anoikis. Its gene is located on locus 17q23.2, which encodes for the protein 179aa.6 It has been demonstrated that the cytoplasmic concentration of Bit1 rapidly increases after the loss of cell adhesion, therefore, leading to anoikis.7 Previous studies have shown that Bit1 is closely related to the occurrence and development of tumors and plays an anti-oncogenic or oncogenic role depending on the nature of the malignancy. Indeed, studies have shown that it plays an anti-oncogenic role in non-small cell lung cancer, invasive breast cancer, and malignant melanoma, with such patients having significantly lower Bit1 expressions.8–10 While patients with esophageal, oral, and ovarian cancers have significantly higher Bit1 expressions, further exacerbating their condition.11,12 Unfortunately, to date, there are no reports on the role of Bit1 in the pathogenic processes of gliomas.Previous studies indicated that the IL-6/STAT3 signaling pathway plays a crucial role in gliomas.13–17 Its activation enhances the anti-anoikis properties of tumor cells, which in turn leads to anchorage-independent tumor growth.18–20 The present study examined Bit1 expressions in glioma tissues, and cells, and studied its impact on their biological activities such as cell proliferation, invasion, and migration. It not only aimed to investigate the connection between Bit1 and the IL-6/STAT3 signaling pathway in gliomas, but also its role in their biological processes as well as the underlying molecular mechanisms.
Materials and Methods
Tissue Samples
Different grade glioma specimens (WHO-II, n = 5; WHO-III, n = 5; WHO-IV, n = 5) and control brain tissues (from patients with cerebral lacerations, n = 5) were obtained from the neurosurgical department of the First Affiliated Hospital of Zhengzhou University, from September 2016 to September 2017. All samples underwent checking and confirmation through pathology. Tissue specimens were stored at - 80°C. Informed consent was obtained from all involved subjects or their guardians. Our research was approved by the independent ethics committee of the First Affiliated Hospital of Zhengzhou University, Henan, China and was in accordance with the Declaration of Helsinki.
Cell Lines and Culture
Human glial cell line HEB and human glioma cell lines (U251, U87, SHG44, LN229, and A172) were purchased from the Cancer Cell Bank of the Chinese Academy of Sciences (Shanghai, China). All cell lines contained 10% FBS (Gibco; Thermo Fisher Science, Inc.), 50U/mL penicillin, and 50µg/mL streptomycin in DMEM (Gibco; Thermo Fisher Science, Inc., USA) medium. Cells were cultured in 37°C high humidity incubator with a 5% CO2 saturation. Bit1 shRNA and control shRNA plasmids were synthesized and sequenced by Wuhan Buffer Biotechnology Services Co., Ltd.
Western Blotting
The total protein was extracted by RIPA (Beyotime, Shanghai, China). BCA kit (Beyotime, Shanghai, China) was used to determine the protein concentration. Denatured protein samples were separated by SDS-PAGE and transferred to a PVDF membrane (BD Pharmingen Corp, CA, USA). The PVDF membrane was then blocked (blocking solution: 5% skimmed milk powder) for one hour at room temperature and incubated overnight on a shaker with the primary antibody (anti-Bit1 (1:1,1000), IL-6 (1:1,2000), IL-6R (1:1,1000), STAT3 (1:1,1000), p-STAT3 (1:1,1000) and β-actin (1:500)) at 4°C. The membrane was later labeled with a secondary antibody (1:1000 dilution), washed, and visualized. Quantity One software was used for gray value analysis. All experiments were repeated three times.
Real-Time PCR
cDNA was synthesized by a reverse transcriptase kit after total RNA extraction (Trizol, Aidlab, Beijing, China). Real-time reverse transcription RT-PCR was performed per the manufacturer instructions (SYBR Green PCR Master Mix, Vazyme, Nanjing, China) using ABI Prism 7500 sequence detection system (Applied Biosystems, Foster City, CA). The primers sequences are shown in Table 1. The process consisted of an initial denaturation cycle (95°C, 10 mins) and 50 annealing and extension cycles (95°C, 15 seconds; 60°C, 1 min; 72°C 40 seconds). The relative expression of each gene was calculated with β-actinas the internal control.
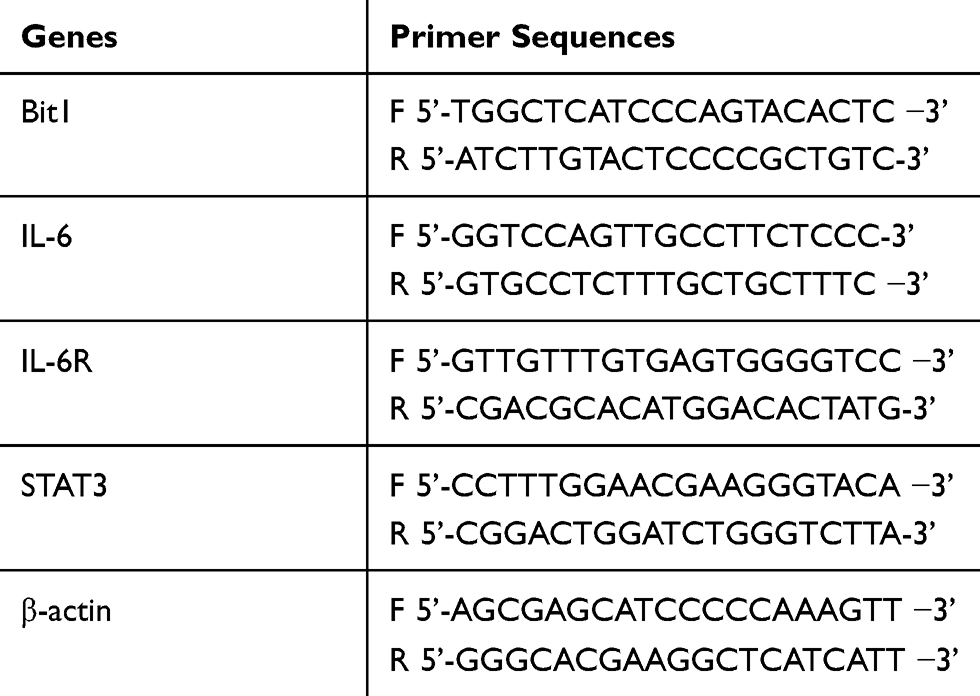 |
Table 1 Primer Sequences for RT-PCR |
Bit1 Silencing
Three interference sequences were designed, synthesized, and cloned into pLVX-shRNA2-Puro vectors from the Bit1 gene mRNA sequence provided by GenBank. The recombinant pLVx-shRNA2-puro-Bit1 vector was determined to be the high yield sequence and was therefore used as the lentivirus packaging vector.
U87/Bit1shRNA cells were screened in a complete medium containing 1µg/mL puromycin after 24 hrs of transfection with viral supernatant to differentiate stably transfected cells. Meanwhile, U87/control shRNA cells were used as negative control.
MTT Assay
MTT assay was used to detect cell proliferation. Growth phase cells were inoculated (1 *104 cells/well) in 96-well plates and cultured overnight at 37°C. Cells were then cultured in an incubator at 37°C, and 5% CO2 for one day, two days, three days, four days, five days, and six days. 1µL MTT was added to each well and left for four more hours at 37°C. The culture medium was then discarded, and 150 µL DMSO was added to each well (incubation period of 10 min). MTT ELISA was used to measure OD values (568 nm).
Transwell Migration and Invasion Assays
Cells were digested by trypsin and suspended in serum-free DMEM medium. The suspended solution was transferred in a Matrigel-coated Transwell upper chamber (BD Biosciences), while a DMEM containing 10% FBS was added to the lower chamber. Cells were cultured afterward in a 5% CO2 incubator at 37°C for 24 hrs. The subsequent culture was then fixed in 70% cold ethanol solution and stained with 0.5% crystal violet dye after PBS cleaning. Finally, the stained cells were visualized for image acquisition. The aggregate of 5 counts was used to estimate cells’ invasive ability (200-fold). The Transwell migration test was similar to the invasion test except that the upper chamber was not coated with Matrigel. All experiments were repeated three times.
Flow Cytometry Analysis
An AnnexinV-APC/7-AAD cell apoptosis detection kit (Nanjing Kaiji Biology, KGA1026) was used to detect cell apoptosis. The procedure was as follows: cells were digested by EDTA free trypsin and centrifuged. The supernatant was then discarded, and the PBS washed cells pre-cooled at 4°C. The binding buffer suspended cells were then added to the flow tube along with 5µL ANNEXIV-APC and 5µL 7-AAD, respectively. The final solution was shielded from light exposure and left to react at room temperature for 5–15 mins. Flow cytometry was used to assess apoptosis in each group.
TUNEL Assay
TUNEL cell apoptosis detection kit (Roche Applied Science) was used to detect cell apoptosis per the manufacturers’ instruction. Paraffin-embedded tissue sections were obtained from subcutaneous tumors and dewaxed. TUNEL staining was performed after protease K (20µg/mL) reaction. Tissue samples were then immersed in DAPI (1:30, Beyotime Biotechnology, China) solution for nuclear staining. Relevant images (microscope, Olympus, Fluoview 1000, Tokyo, Japan) and data were acquired and analyzed. The apoptotic rate was determined as the ratio of positive cells to that of all visualized cells.
In vivo Experimentation
Female BALB/c nude mice (6–7 weeks old) were purchased from Hunan Relaxation Laboratory Animal Co., Ltd and randomly divided into two groups of 6 mice each. The two groups were labeled as control shRNA group and Bit1shRNA group. Control shRNA cells (5*106) or Bit1shRNA cells (5*106) were injected subcutaneously into the right axilla of nude mice, depending on their group. The day of injection was marked as day 0. Tumor sizes were measured with a vernier caliper and subsequent data recorded starting from day 1. All subjects were sacrificed after 28 days. All procedures, which complied with the NIH guidelines for the care and use of laboratory animals, were approved by the Animal Care and Use Committees of the First Affiliated Hospital of Zhengzhou University.
Statistical Analysis
Prism 6.0 software (GraphPad Software, SanDiego, CA, USA) was used for statistical analysis. All experiments were performed at least three times. Final data were expressed as means ± SEM. A P value of < 0.05 was considered statistically significant.
Results
Expression of Bit1 and IL-6 in Glioma Tissues
The expressions of Bit1 and IL-6 in various grade glioma tissues were determined by Western blot and Real-Time PCR. The analyses indicated significantly lower Bit1 mRNA and protein levels in glioma tissues compared to the control. Additionally, this tendency is negatively correlated with the WHO grade (P < 0.05) (Figure 1A, D, and E). These findings suggest that a decrease in Bit1 expressions might be closely related to the degree of glioma malignancy. Analysis of IL-6 expressions not only showed that compared to control brain tissues, glioma tissues have higher IL-6 levels but also that IL-6 expression might be positively correlated with glioma grades (Figure 1B, D, and F). The results also showed a negative correlation between Bit1 and IL-6 expressions in control brain tissues as well as in different grade gliomas (Figure 1C).
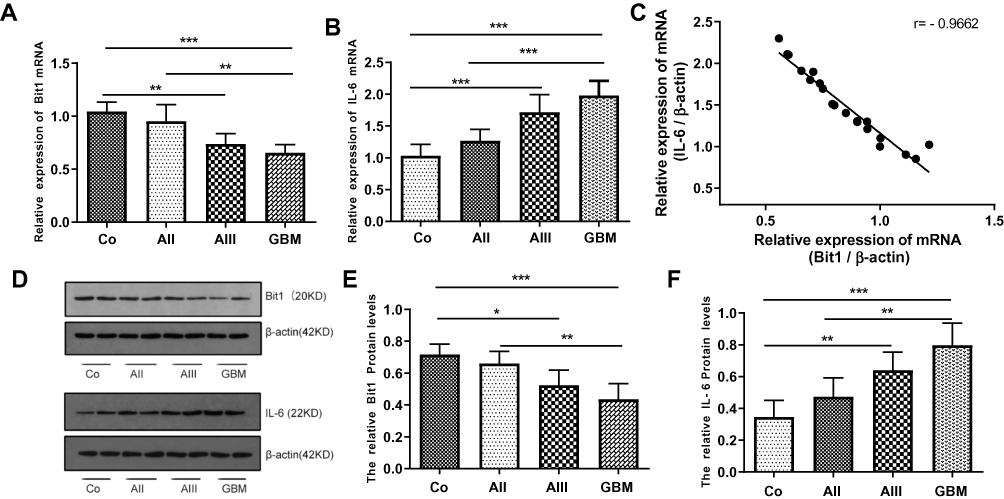 |
Figure 1 Expression of Bit1 and IL-6 in glioma tissues. (A) Association between decreased Bit1 mRNA expressions and tumor grade in glioma tissues. (B) Correlation between an increase in IL-6 mRNA expressions and tumor grade in glioma tissues. (C) A negative correlation between Bit1 and IL-6 in glioma tissues. (D) Western blot analysis of Bit1 and IL-6 expressions in normal brain and glioma tissues. (E) Correlation between decreased Bit1 expressions and tumor grade in glioma tissues. (F) Correlation between IL-6 expressions and tumor grade in glioma tissues. All results were repeated three times. Co, control; AII, WHO Grade II, low-grade astrocytoma;AIII,WHO Grade III, anaplastic astrocytoma; GBM, WHO Grade IV, glioblastoma multiforme. *P < 0.05, **P < 0.01, ***P < 0.001. |
Expression of Bit1 in Glioma Cell Lines
The results showed that Bit1 mRNA and protein expressions are significantly lower in glioma cell lines as compared to those in normal glial cell lines (p < 0.05) (Figure 2A–C). Additional analysis also indicated significant variations in Bit1 expression among glioma cells depending on their lines, with U87 cells having a relatively higher Bit1 expression. Consequently, U87 cells were chosen for the assessment of Bit1 effects on the biological processes of glioma tissues.
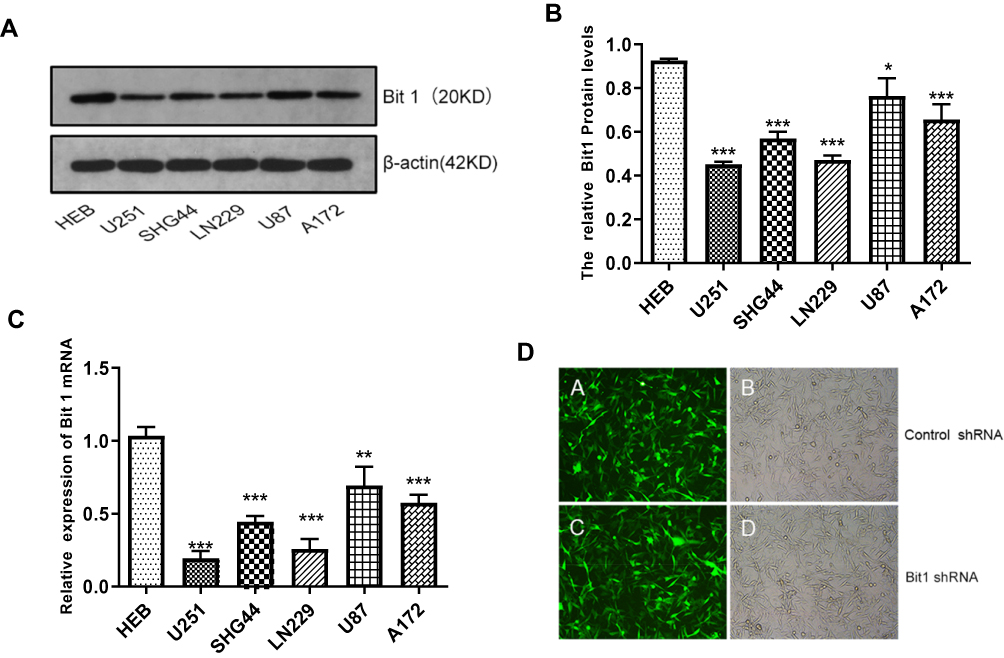 |
Figure 2 Expression of Bit1 in different glioma cell lines. (A) Western blotting was used to detect the expression of Bit1 protein in different glioma cell lines, including U251, SHG44, LN229, U87, A172, and HEB. (B) Relative Bit1 protein levels were calculated as the ratio of Bit1 levels to β-actin levels. (C) Bit1 mRNA expressions in different glioma cell lines as well as in normal glial cells HEB were determined by RT-PCR. (D) Silencing of Bit1 expression in U87 glioma cell line by lentiviral transfection. The transfection efficiency as detected by fluorescence microscopy and optical microscopy was > 90%, in the Bit1 shRNA group as well as the Control shRNA group. All results were independently replicated three times. *P < 0.05, **P < 0.01, ***P < 0.001. |
Transfection Efficiency Evaluation and Bit1 Silencing
Various groups of U87 cell lines with stably transfected plasmids were established.
The fluorescence microscopy indicated a transfection efficiency of over 90%, and almost all the cells expressed GFP. Bit1 shRNA and control shRNA expressing U87 cell lines were established (Figure 2D). Western blot results showed that Bit1 expression in the Bit1 shRNA group was significantly lower than the control shRNA group and the blank group (p < 0.01). No significant differences in Bit1 expressions between the control shRNA group and the blank group were observed (p > 0.05) (Figure 3A and B). These results were further confirmed by Real-Time PCR (p<0.01) (Figure 3C).
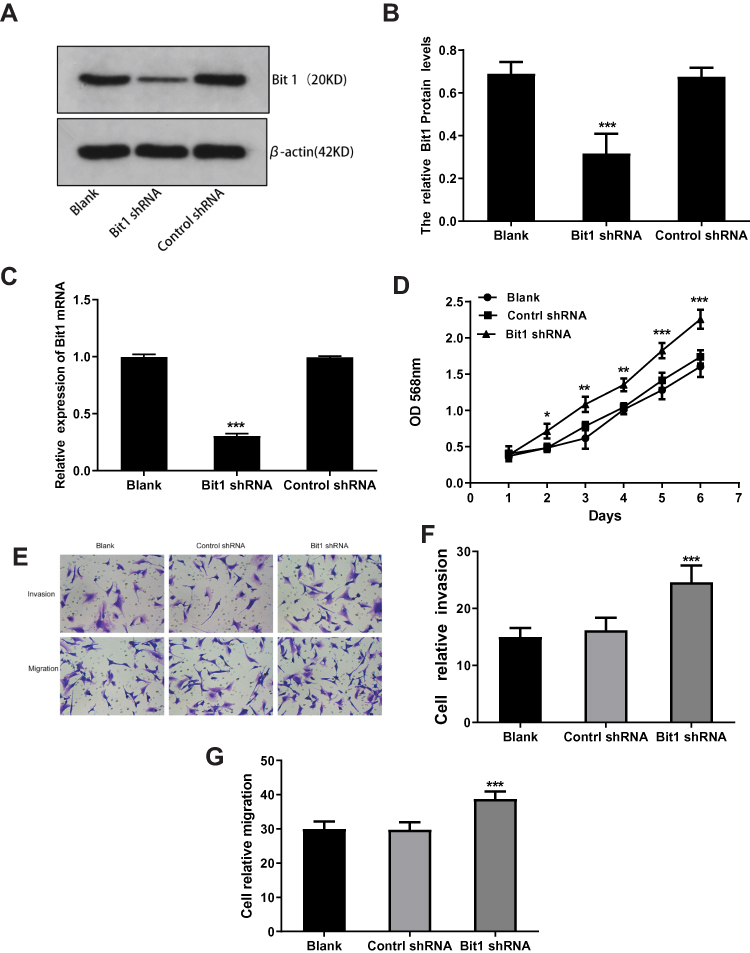 |
Figure 3 Effects of Bit1 silencing on U87 cells proliferation, migration, and invasion. (A and B) The expression of Bit1 protein in the blank, control shRNA, and Bit1 shRNA group. (Determined by the ratio of Bit1 levels to β-actin levels). (C) Comparison of Bit1 mRNA expressions between the three groups (Real-time PCR). (D) Assessment of cell proliferation at each indicated time (1d, 2d, 3d, 4d, 5d, 6d, and 7d). (E) Effects of Bit1 silencing on U87 cell invasion and migration capacities. (F and G) Quantification of invading and migrating cells for the evaluation of Bit1 silencing impact on U87 cells. All experiments were replicated three times. *P < 0.05, **P < 0.01, ***P < 0.001. |
Bit1 Silencing Enhances Cell Proliferation, Migration, and Invasion in U87 Cells
MTT, Transwell invasion, and migration tests were used to study the effects of Bit1 silencing on U87 cell proliferation, migration, and invasion. The MTT test results showed that compared to the blank or the control shRNA groups, U87 cells in the Bit1shRNA group exhibited enhanced proliferative abilities on the 2nd, 3rd, 4th, 5th, and 6th days of the experiment (p < 0.05). No significant differences between the blank and the control shRNA groups were observed (p > 0.05) (Figure 3D). Additionally, the Transwell invasion and migration test results also showed that cells in the Bit1shRNA group had enhanced invasive and migratory abilities compared to their blank or control shRNA counterparts (p < 0.01). There were no significant differences between the blank and the Control shRNA groups (p > 0.05) (Figure 3E–G).
Bit1 Silencing Increases IL-6, IL-6R, and p-STAT3 Levels in U87 Cells
The quantification analysis of IL-6, IL-6R, STAT3, and p-STAT3 expressions after Bit1 silencing showed that the Bit1 shRNA group had significantly higher IL-6, IL-6R, and p-STAT3 protein expressions than the control shRNA group (p < 0.01). However, no significant difference in STAT3 protein levels was seen between groups (Figure 4B–D). These findings were further confirmed by the Real-Time PCR results (p<0.01 (Figure 4A). Consequently, anoikis resistance might be the product of Bit1-induced activation of the IL-6/STAT3 signaling pathway in glioma tissues.
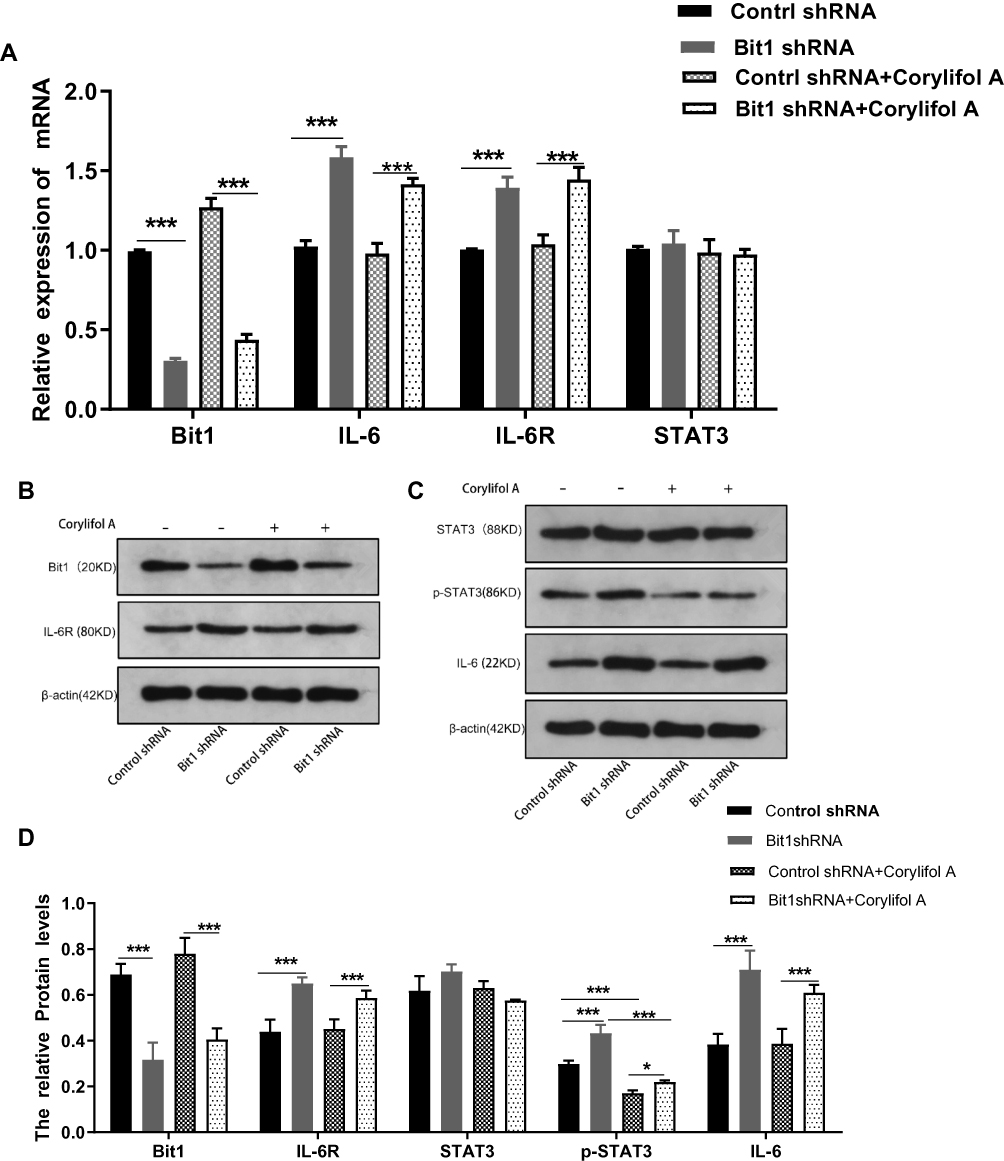 |
Figure 4 Bit1 Silencing contributed to the activation of the IL-6/STAT3 Signaling pathway. (A) Relative levels of Bit1, IL-6, IL-6R, and STAT3 mRNAs in different groups (Real-time PCR). The relative levels of mRNAs were evaluated according to 2−ΔΔCt. (B, C and D) Various groups Western blotting assays for Bit1, IL-6, IL-6R, STAT3, and p-STAT3 protein levels. Control shRNA, Negative Control; Bit1 shRNA, lentivirus containing the cDNA sequence of Bit1; sh, short hairpin; Corylifol A. Inhibits IL-6-induced STAT3 activation and phosphorylation.*P < 0.05, ***P < 0.001. |
Suppressing the IL-6/STAT3 Pathway Enhances Anoikis in Gliomas
Corylifol A, a member of the isoflavone subclass, has been shown to possess specific inhibitory effects on IL-6-induced activation and phosphorylation of STAT3, thereby blocking the IL-6/STAT3 signaling pathway. In this study, 10μm of Corylifol A was used to treat Bit1shRNA cells and control shRNA cells for 40 mins. Apoptosis-related changes, changes in migratory and invasive abilities of U87 cells, as well as, mRNAs and protein levels were assessed by flow cytometry, Transwell invasion, and migration tests, real-Time PCR, and Western blot, respectively. The flow cytometry results showed that Bit1shRNA cells had significantly lower apoptotic rates than the control shRNA cells (p < 0.01). This result further confirmed that Bit1 could promote anoikis in glioma cells. The results also showed that Bit1shRNA and control shRNA cells had significantly higher post-Corylifol A apoptotic rates compared to their pre-Corylifol A rates (p < 0.01) (Figure 5A and B). Additionally, the Transwell invasion and migration test results indicated that the Corylifol A significantly reduced Bit1shRNA and control shRNA cells’ invasive and migratory abilities (p < 0.05) (Figure 5C–F). Moreover, the Western blot results showed that Corylifol A significantly suppressed p-STAT3 protein expressions (p < 0.01), while the expressions of IL-6, IL-6R, and STAT3 proteins did not significantly differ (p > 0.05) (Figure 4B–D). These results were further confirmed by RT-PCR (Figure 4A).
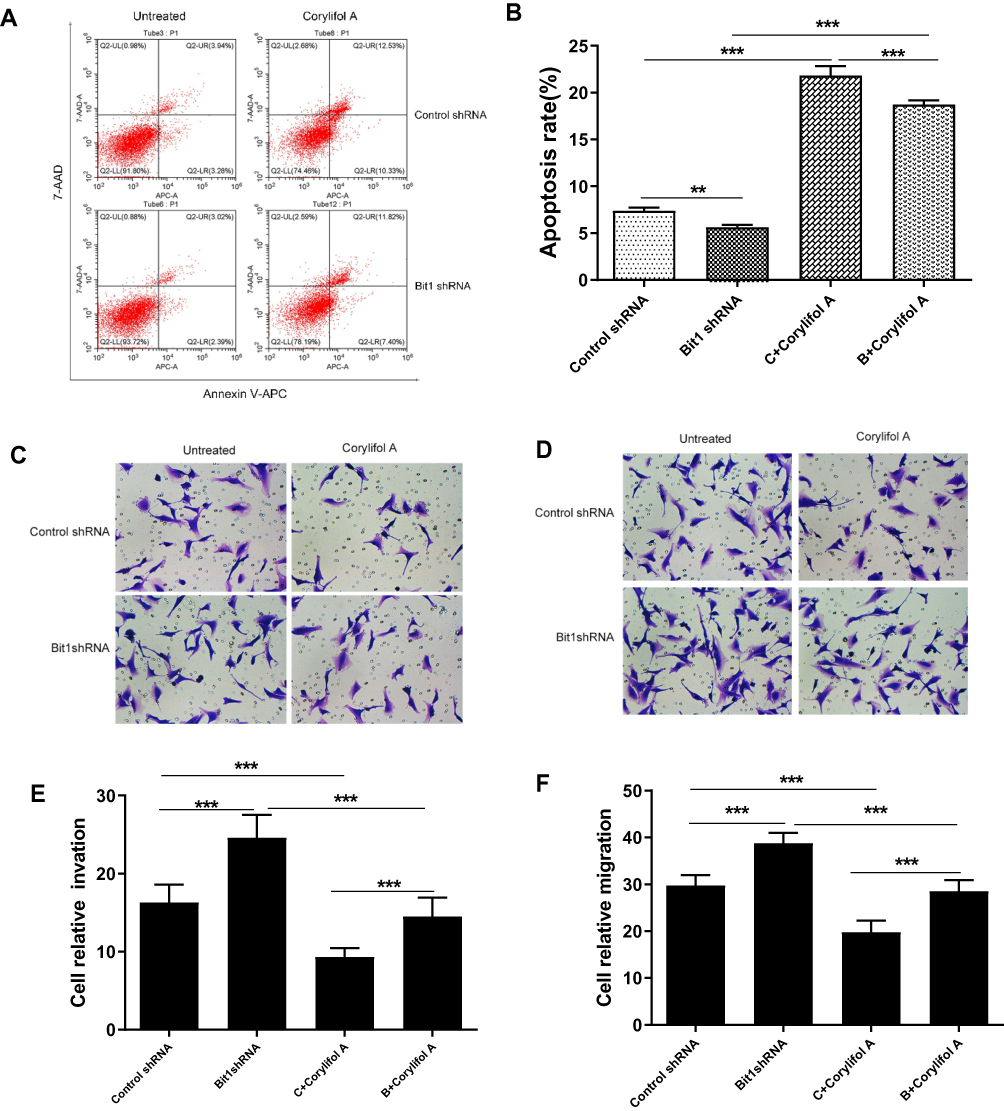 |
Figure 5 Effect of IL-6/STAT3 signaling pathway suppression on U87 cells apoptosis, invasion, and migration. (A and B) Flow cytometry assays for cell apoptosis in different cell groups. (C and E) Invasive ability of different cell groups (transwell assay). (D and F) Migrational ability of different cell groups (transwell assay). Control shRNA, Negative Control; Bit1 shRNA, lentivirus containing the cDNA sequence of Bit1; sh, short hairpin; Corylifol A. Inhibits IL-6-induced STAT3 activation and phosphorylation. **P < 0.01, ***P < 0.001. |
Bit1 Silencing Enhances Tumorigenesis in U87 Xenograft Nude Mice
For the assessment of Bit1 silencing effects on tumor growth, nude mice were randomly divided into two groups of 6 subjects each. Control shRNA and Bit1 shRNA cells were implanted into their right axilla depending on their assigned group. The results showed that the Bit1 shRNA group exhibited significantly enhanced tumor growth compared to the control shRNA group (Figure 6A and B). Therefore, indicating that Bit1 silencing could promote tumor growth in xenotransplanted nude mice.
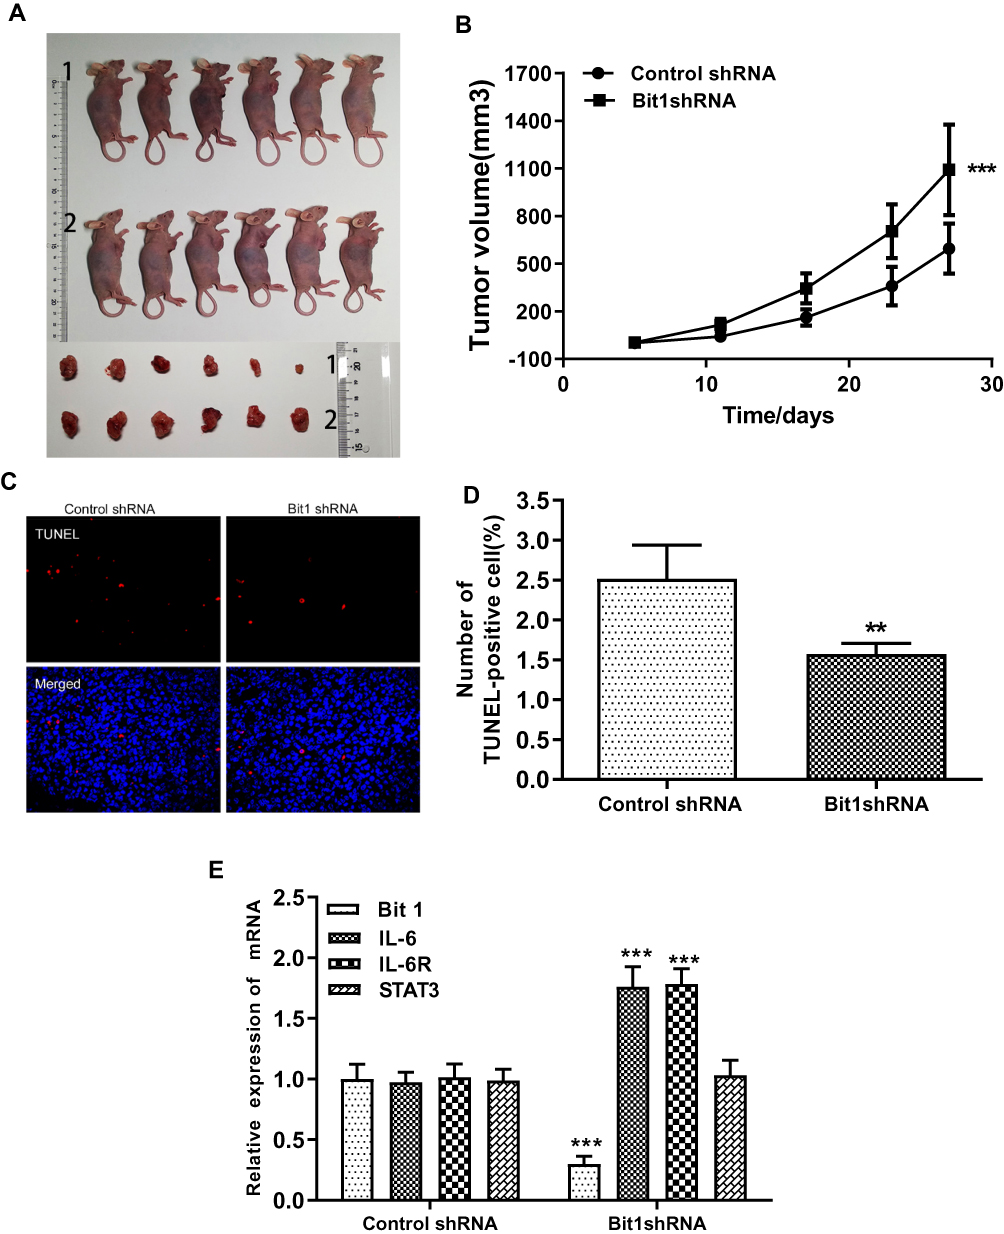 |
Figure 6 Bit1 silencing enhanced U87 cell growth in mouse xenografts. (A) Sacrificed animals and corresponding tumors. (B) Tumor growth curves. (C and D) The TUNEL assay was carried out to analyze cellular death. (E) Relative levels of Bit1, IL-6, IL-6R, and STAT3 mRNAs in Control shRNA and Bit1 shRNA group. (Real-time PCR). The relative levels of mRNAs were determined according to 2−ΔΔCt. **P <0.01, ***P < 0.001. |
Bit1 Silencing Increases IL-6, IL-6R, and p-STAT3 Levels as Well as Suppresses Cell Apoptosis in U87 Xenograft Nude Mice
To further study the effects of Bit1 silencing on IL-6, IL-6R, STAT3, and p-STAT3 expressions, tumor tissues of xenotransplanted nude mice were analyzed by Western blot, Real-Time PCR, and TUNEL tests. The Western blot results indicated that mice in the Bit1shRNA group had significantly higher IL-6, IL-6R, and p-STAT3 protein levels than those in the control shRNA group (p < 0.05). STAT3 protein levels remained similar in both groups (Figure 7A–C). The Real-time PCR results were consistent with those of Western blot (Figure 6E). Additionally, the TUNEL tests indicated that tumor tissues from the Bit1 shRNA group exhibited significantly lower apoptotic abilities compared to the control shRNA group tissues (p < 0.05) (Figure 6C and D).
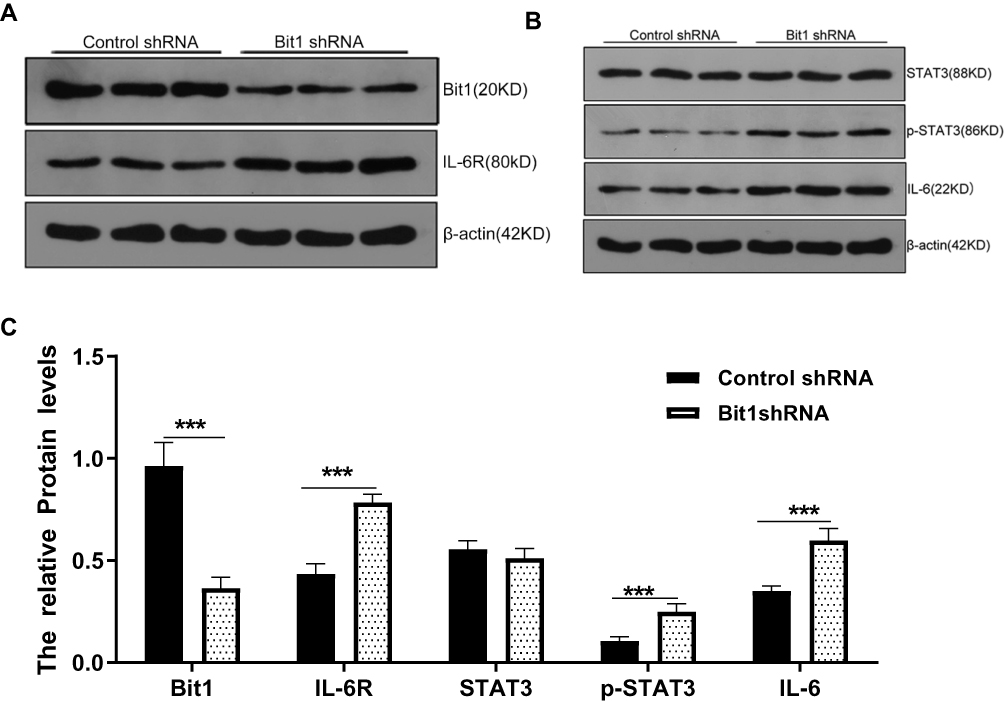 |
Figure 7 Bit1 silencing increased IL-6, IL-6R, and p-STAT3 expressions in xenograft nude mice. (A and B) Western blots results of Bit1, IL-6, IL-6R, STAT3, and p-STAT3 protein expressions in Control shRNA and Bit1 shRNA group. (C) Relative quantification of Bit1, IL-6, IL-6R, STAT3, and p-STAT3 protein levels. ***P < 0.001. |
Discussion
The mitochondrial protein Bit1 is usually located within the mitochondria. It is released in the cytoplasm upon loss of cell adhesion and binds to the amino-terminal enhancer of split (AES), leading to a caspase-independent apoptosis.21 Previous studies have shown that tissues from malignant melanoma, invasive breast cancer, and non-small cell lung cancer have significantly lower Bit1 expressions.8–10 while oral and esophageal cancer tissues have significantly higher Bit1 expressions.11,12 This shows that although the gene encoding the Bit1 protein is highly conservative, its expression is extremely dependent on the nature of encountered malignancy. This study results showed that glioma tissues had significantly lower Bit1 expressions and that this decrease is negatively correlated with the glioma grade (P < 0.05), suggesting that Bit1 might play an anti-oncogenic role in gliomas.
Studies have shown that Bit1 is deeply connected with the occurrence and development of tumors and that it can positively or negatively regulate tumor progression depending on the circumstances. However, the specific mechanisms tying Bit1 to anoikis are currently unclear. Previous studies performed on non-small cell lung cancer samples showed that Bit1 played an anti-oncogenic role by promoting cancer cell apoptosis. They also indicated that a decrease in Bit1 expressions resulted in a significant increase in A549 cells proliferation.22 Contrarily, another study done by Fan et al on esophageal squamous cell carcinoma concluded that Bit1 promoted tumor proliferation and that a decrease in Bit1 expressions significantly increased EC9706 and TE1 cells apoptotic rates.11 In light of these heterogeneous findings, we used flow cytometry, MTT, and xenografted nude mice to assess the effects of Bit1 and Bit1 silencing on the anoikis process and glioma cell growth. The results indicated that Bit1 silencing significantly suppressed apoptosis and promoted the proliferation of U87 cells. These findings suggested that Bit1 might play an anti-oncogenic role in gliomas and that a reduction in its expression can significantly promote malignant proliferation.
The anoikis process is an essential mechanism for normal cell functions and plays a key role in preventing metastasis and local infiltration. Studies have found that cancer cells can become resistant to anoikis under certain conditions and can subsequently acquire anchorage-independent growth abilities.7,23,24 Previous studies have shown that anoikis resistant glioma cells, coupled with their high invasiveness, are the main reason for adjacent brain parenchyma infiltration and poor patients’ prognosis.25,26 This study findings, consistent with the study performed by Karmali et al, showed that glioma U87 cells invasion and migration rates increased significantly after Bit1 silencing.10 Interestingly, Xiao et al, in their study of oral squamous cell carcinoma, found that the upregulation of Bit1 expressions significantly enhanced Tca8113 cell invasive and migratory abilities.12 Thus, Bit1 might play an important, type-dependent role in cell invasion and migration.
To date, several signaling pathways such, as the ERK/MAPK, the NF-kB, the integrin-mediated, and the FAK-paxillin, have been connected to the regulatory mechanisms of Bit1 on tumorigenesis.9,11,27 Therefore, understanding Bit1 functions and the underlying mechanisms in gliomas might represent a new avenue for treatment. A growing number of studies have shown that interleukin-6 (IL-6) expression is upregulated in the presence of tumors and that its increase not only mediated immune responses but also played a key role in tumor growth.28,29 The JAK/STAT3 signaling pathway is an IL-6 regulated pathway. IL-6 induces STAT3 activation and phosphorylation through its receptor IL-6R. The abnormally activated STAT3 then inhibits cancer cells apoptosis by regulating the activation of downstream cyclin Dl, Bcl-xl, survivin, and other genes, therefore enabling their anchorage-independent growth abilities.30–34 Anchorage-independent growth is closely related to anoikis resistance and plays a crucial role in adjacent tissue infiltration and distant metastasis.
Researches have demonstrated that IL-6/STAT3 signaling pathway activation in melanoma, pancreatic cancer, and hepatocellular carcinoma cells enhances their anti-anoikis activities, further accelerating tumor growth or metastasis.18–20 Consequently, this establishes the key role of the IL-6/STAT3 signaling pathway in the development of anoikis resistance. This study showed that Bit1 expressions are negatively correlated with IL-6 expressions in glioma tissues. Additionally, it indicated that Bit1 silencing can significantly upregulate IL-6, IL-6R, and p-STAT3 expressions in U87 cells and that Corylifol A is effective in limiting Bit1shRNA cells’ proliferation, invasion, and migration. In summary, the current findings suggested that a decrease in Bit1 expressions can lead to the activation of the IL-6/STAT3 signaling pathway, which further promotes glioma cell proliferation, invasion, and migration. However, the precise mechanisms of Bit1 silencing-induced IL-6/STAT3 signaling pathway activation and regulation still need further study.
Conclusions
This study showed that Bit1 enhances anoikis and plays an anti-oncogenic role in glioma cells. It also indicated that a decrease in its expression leads to the activation of the IL-6/STAT3 signaling pathway, further promoting glioma cell proliferation, invasion, and migration. Therefore, our findings pave a new avenue to understanding Bit1 role in the pathogenesis of gliomas.
Ethics Statement
All procedures performed in studies involving animal work were approved by the Ethics Committee of the First Affiliated Hospital of Zhengzhou University,which were in accordance with the ethical standards of the institutional and/or national research committee and with the 1964 Helsinki declaration and its later amendments or comparable ethical standards.
Author Contributions
All authors contributed to data analysis, drafting or revising the article, gave final approval of the version to be published, and agree to be accountable for all aspects of the work.
Funding
The present study was supported by the Science and Technology Department of Henan Province, (grants no. 172102310081).
Disclosure
Zhengfeng Wang and Menglei Yin are co-first authors for this study. The authors report no conflicts of interest in this work.
References
1. Ostrom QT, Gittleman H, Fulop J, et al. CBTRUS statistical report: primary brain and central nervous system tumors diagnosed in the United States in 2008–2012. Neuro Oncol. 2015;17 Suppl 4:iv1–iv62.
2. Weller M, van den Bent M, Tonn JC, et al. European Association for Neuro-Oncology (EANO) guideline on the diagnosis and treatment of adult astrocytic and oligodendroglial gliomas. Lancet Oncol. 2017;18(6):e315–e329. doi:10.1016/S1470-2045(17)30194-8
3. Delgado-López PD, Corrales-García EM, Martino J, Lastra-Aras E, Dueñas-Polo MT. Diffuse low-grade glioma: a review on the new molecular classification, natural history and current management strategies. Clin Transl Oncol. 2017;19(8):931–944. doi:10.1007/s12094-017-1631-4
4. Linder B, Weirauch U, Ewe A, et al. Therapeutic targeting of stat3 using lipopolyplex nanoparticle-formulated siRNA in a syngeneic orthotopic mouse glioma model. Cancers. 2019;11(3):undefined.
5. Du Y, Li J, Xu T, Zhou DD, Zhang L, Wang X. MicroRNA-145 induces apoptosis of glioma cells by targeting BNIP3 and Notch signaling. Oncotarget. 2017;8(37):61510–61527. doi:10.18632/oncotarget.18604
6. Jan Y, Matter M, Pai JT, et al. A mitochondrial protein, Bit1, mediates apoptosis regulated by integrins and Groucho/TLE corepressors. Cell. 2004;116(5):751–762. doi:10.1016/S0092-8674(04)00204-1
7. Frisch SM, Francis H. Disruption of epithelial cell-matrix interactions induces apoptosis. J Cell Biol. 1994;124(4):619–626. doi:10.1083/jcb.124.4.619
8. Yao X, Pham T, Temple B, et al. The anoikis effector Bit1 inhibits EMT through attenuation of TLE1-mediated repression of E-cadherin in lung cancer cells. PLoS One. 2016;11(9):e0163228. doi:10.1371/journal.pone.0163228
9. Yao X, Gray S, Pham T, et al. Downregulation of Bit1 expression promotes growth, anoikis resistance, and transformation of immortalized human bronchial epithelial cells via Erk activation-dependent suppression of E-cadherin. Biochem Biophys Res Commun. 2018;495(1):1240–1248. doi:10.1016/j.bbrc.2017.11.126
10. Brunquell C, Biliran H, Jennings S, Ireland SK, Chen R, Ruoslahti E. TLE1 is an anoikis regulator and is downregulated by Bit1 in breast cancer cells. Mol Cancer Res. 2012;10(11):1482–1495. doi:10.1158/1541-7786.MCR-12-0144
11. Fan T, Chen J, Zhang L, et al. Bit1 knockdown contributes to growth suppression as well as the decreases of migration and invasion abilities in esophageal squamous cell carcinoma via suppressing FAK-paxillin pathway. Mol Cancer. 2016;15(1):23. doi:10.1186/s12943-016-0507-5
12. Xiao Y, Yang Y, Wang J, Li W. Bit1 regulates cell migration and survival in oral squamous cell carcinoma. J Oral Maxillofac Surg. 2017.
13. Qiu B, Zhang D, Wang Y, et al. Interleukin-6 is overexpressed and augments invasiveness of human glioma stem cells in vitro. Clin Exp Metastasis. 2013;30(8):1009–1018. doi:10.1007/s10585-013-9599-0
14. Loeffler S, Fayard B, Weis J, Weissenberger J. Interleukin-6 induces transcriptional activation of vascular endothelial growth factor (VEGF) in astrocytes in vivo and regulates VEGF promoter activity in glioblastoma cells via direct interaction between STAT3 and Sp1. Int J Cancer. 2005;115(2):202–213. doi:10.1002/(ISSN)1097-0215
15. Michaud-Levesque J, Bousquet-Gagnon N, B R. Quercetin abrogates IL-6/STAT3 signaling and inhibits glioblastoma cell line growth and migration. Exp Cell Res. 2012;318(8):925–935. doi:10.1016/j.yexcr.2012.02.017
16. Kesanakurti D, Chetty C, Dinh D, G M, Rao JS. Role of MMP-2 in the regulation of IL-6/Stat3 survival signaling via interaction with α5β1 integrin in glioma. Oncogene. 2013;32(3):327–340. doi:10.1038/onc.2012.52
17. Wang Y, Chen X, Tang G, et al. AS-IL6 promotes glioma cell invasion by inducing H3K27Ac enrichment at the IL6 promoter and activating IL6 transcription. FEBS Lett. 2016;590(24):4586–4593. doi:10.1002/feb2.2016.590.issue-24
18. Lee S, Lee M, Kim JB, et al. 17β-estradiol exerts anticancer effects in anoikis-resistant hepatocellular carcinoma cell lines by targeting IL-6/STAT3 signaling. Biochem Biophys Res Commun. 2016;473(4):1247–1254. doi:10.1016/j.bbrc.2016.04.049
19. Fofaria NM, Srivastava S. STAT3 induces anoikis resistance, promotes cell invasion and metastatic potential in pancreatic cancer cells. Carcinogenesis. 2015;36(1):142–150. doi:10.1093/carcin/bgu233
20. Fofaria NM, Srivastava S. Critical role of STAT3 in melanoma metastasis through anoikis resistance. Oncotarget. 2014;5(16):7051–7064. doi:10.18632/oncotarget.2251
21. Jennings S, Pham T, Ireland SK, Ruoslahti E, Biliran H. Bit1 in anoikis resistance and tumor metastasis. Cancer Lett. 2013;333(2):147–151. doi:10.1016/j.canlet.2013.01.043
22. Yao X, Jennings S, Ireland SK, et al. The anoikis effector Bit1 displays tumor suppressive function in lung cancer cells. PLoS One. 2014;9(7):e101564. doi:10.1371/journal.pone.0101564
23. Jin L, Chun J, Pan C, et al. The PLAG1-GDH1 axis promotes anoikis resistance and tumor metastasis through CamKK2-AMPK signaling in LKB1-deficient lung cancer. Mol Cell. 2018;69(1):87–99.e87. doi:10.1016/j.molcel.2017.11.025
24. Pan Y, Zhu X, Wang K, Chen Y. MicroRNA-363-3p suppresses anoikis resistance in human papillary thyroid carcinoma via targeting integrin alpha 6. Acta Biochim Biophys Sin (Shanghai). 2019;51(8):807–813. doi:10.1093/abbs/gmz066
25. Russo MA, Paolillo M, Sanchez-Hernandez Y, et al. A small-molecule RGD-integrin antagonist inhibits cell adhesion, cell migration and induces anoikis in glioblastoma cells. Int J Oncol. 2013;42(1):83–92. doi:10.3892/ijo.2012.1708
26. Talukdar S, Pradhan AK, Bhoopathi P, et al. MDA-9/Syntenin regulates protective autophagy in anoikis-resistant glioma stem cells. Proc Natl Acad Sci U S A. 2018;115(22):5768–5773. doi:10.1073/pnas.1721650115
27. Fan T, Tian F, Yi S, et al. Implications of Bit1 and AIF overexpressions in esophageal squamous cell carcinoma. Tumor Biology. 2014;35(1):519–527. doi:10.1007/s13277-013-1073-8
28. Ham IH, Oh HJ, Jin H, et al. Targeting interleukin-6 as a strategy to overcome stroma-induced resistance to chemotherapy in gastric cancer. Mol Cancer. 2019;18(1):68. doi:10.1186/s12943-019-0972-8
29. Weissenberger J, Loeffler S, Kappeler A, et al. IL-6 is required for glioma development in a mouse model. Oncogene. 2004;23(19):3308–3316. doi:10.1038/sj.onc.1207455
30. Lee HH, Jung J, Moon A, Kang H, Cho H. Antitumor and anti-invasive effect of apigenin on human breast carcinoma through suppression of IL-6 expression. Int J Mol Sci. 2019;20(13):3143.
31. Gao X, Liu X, Lu Y, et al. PIM1 is responsible for IL-6-induced breast cancer cell EMT and stemness via c-myc activation. Breast Cancer. 2019;26(5):663–671.
32. Wang Y, Jing Y, Ding L, et al. Epiregulin reprograms cancer-associated fibroblasts and facilitates oral squamous cell carcinoma invasion via JAK2-STAT3 pathway. J Exp Clin Cancer Res. 2019;38(1):274. doi:10.1186/s13046-019-1277-x
33. Wang Y, Chu Y, Ren X, et al. Epidural adipose tissue-derived mesenchymal stem cell activation induced by lung cancer cells promotes malignancy and EMT of lung cancer. Stem Cell Res Ther. 2019;10(1):168. doi:10.1186/s13287-019-1280-3
34. Kim MS, Lee HS, Kim YJ, Lee DY, Kang SG, Jin W. MEST induces Twist-1-mediated EMT through STAT3 activation in breast cancers. Cell Death Differ. 2019;26(12):2594–2606.
 © 2020 The Author(s). This work is published and licensed by Dove Medical Press Limited. The full terms of this license are available at https://www.dovepress.com/terms.php and incorporate the Creative Commons Attribution - Non Commercial (unported, v3.0) License.
By accessing the work you hereby accept the Terms. Non-commercial uses of the work are permitted without any further permission from Dove Medical Press Limited, provided the work is properly attributed. For permission for commercial use of this work, please see paragraphs 4.2 and 5 of our Terms.
© 2020 The Author(s). This work is published and licensed by Dove Medical Press Limited. The full terms of this license are available at https://www.dovepress.com/terms.php and incorporate the Creative Commons Attribution - Non Commercial (unported, v3.0) License.
By accessing the work you hereby accept the Terms. Non-commercial uses of the work are permitted without any further permission from Dove Medical Press Limited, provided the work is properly attributed. For permission for commercial use of this work, please see paragraphs 4.2 and 5 of our Terms.