")
Back to Journals » Clinical Epidemiology » Volume 9
Birth weight, sex, and celiac disease: a nationwide twin study
Authors Kuja-Halkola R, Lebwohl B, Halfvarson J , Emilsson L , Magnusson PK , Ludvigsson JF
Received 15 August 2017
Accepted for publication 25 September 2017
Published 10 November 2017 Volume 2017:9 Pages 567—577
DOI https://doi.org/10.2147/CLEP.S149181
Checked for plagiarism Yes
Review by Single anonymous peer review
Peer reviewer comments 2
Editor who approved publication: Professor Henrik Sørensen
Ralf Kuja-Halkola,1 Benjamin Lebwohl,1,2 Jonas Halfvarson,3 Louise Emilsson,4–6 Patrik K Magnusson,1 Jonas F Ludvigsson1,2,7,8
1Department Medical Epidemiology and Biostatistics, Karolinska Institutet, Stockholm, Sweden; 2Department of Medicine, Celiac Disease Center, Columbia University Medical Center, Columbia University, New York, NY, USA; 3Department of Gastroenterology, Faculty of Medicine and Health, Örebro University, Örebro, Sweden; 4Department of Health Management and Health Economy, Institute of Health and Society, University of Oslo, Oslo, Norway; 5Department of Epidemiology, Harvard T.H. Chan School of Public Health, Boston, MA, USA; 6Centre for Clinical Research, Vårdcentralen Värmlands Nysäter, County Council of Värmland, Värmland, 7Department of Pediatrics, Örebro University Hospital, Örebro, Sweden; 8Division of Epidemiology and Public Health, School of Medicine, City Hospital, University of Nottingham, Nottingham, UK
Objective: Earlier research suggests that birth weight may be associated with celiac disease (CD), but the direction of association has been unclear potentially due to confounding effect from genetic and intrafamilial factors. Through within-twin analyses, we aimed to minimize confounding effects such as twins that share genetic and early environmental exposures.
Materials and methods: Using the Swedish Twin Registry, we examined the birth weight of 146,830 twins according to the CD status. CD was defined as having villous atrophy according to a small intestinal biopsy reports.
Results: The prevalence of diagnosed CD was 0.5% (n=669), and we included 407 discordant pairs of CD–non-CD twins. Comparing the 669 CD patients with non-CD twins, the association between birth weight and future CD was not statistically significant (odds ratio [OR] per 1000 g increase in birth weight: 1.16; 95% confidence interval [CI]=0.97–1.38). In males, the association was positive and statistically significant (OR=1.50; 95% CI=1.11–2.02). However, the association was not significant in within-pair analyses for both dizygotic and monozygotic twins and for both sexes.
Conclusion: This population-based study found that in male twins, higher birth weight was associated with higher risk of CD. However, when comparing discordant twin pairs in within-twin pair analyses, there was no statistically significant association between birth weight, intrauterine growth, and future risk of CD.
Keywords: autoimmune, gestational age, gluten, registries, risk factors, twins
Introduction
Celiac disease (CD) is a chronic immune-mediated disorder triggered by the exposure to gluten in genetically predisposed individuals. On gluten exposure, the individual typically develops small intestinal villous atrophy (VA) and mucosal inflammation.1 Individuals with CD are at increased risk of a number of disorders2 including lymphoproliferative disease3 and adverse pregnancy outcome,4 and in most populations also death.5 Up until recently, both age at gluten introduction and breastfeeding were regarded as important risk factors for future CD,6,7 but two large randomized clinical trials have reported a null association between duration of breastfeeding, age at gluten introduction, and the risk of later CD.8,9 Since heritability cannot explain all the variance in risk for CD,10 other environmental factor(s) are likely to contribute to the celiac pathogenesis.11
Considering that CD often debuts at young age, perinatal conditions may contribute to CD pathogenesis. In one of the first studies on newborn characteristics and later CD, Sandberg-Bennich et al12 found a negative association between birth weight and CD (low birth weight [≤2499 g] increased the risk of CD [odds ratio {OR}=1.27; 95% confidence interval {CI}=1.07–1.52]). In contrast, two recent studies have reported a positive association between birth weight and CD. In the Norwegian study by Emilsson et al,13 both low birth weight (<2500 g; OR=0.79) and “very” low birth weight (<1500 g; OR=0.45) were linked to a lower risk of future CD. However, none of the risk estimates reached statistical significance (the analysis of very low birth weight only contained one case of CD), and z-scores for birth weights were similar in patients with CD and their controls. In a Swedish dataset, Namatovu et al14 found an inverse relationship between very low birth weight and CD, but this relationship failed to reach statistical significance after adjustment for covariates (OR=0.8; 95% CI=0.5–1.2). Meanwhile, Mårild et al15 found that a very low birth weight may protect against future CD (OR=0.87; 95% CI=0.63–1.21), while their study showed a neutral relationship between low birth weight and CD (adjusted OR=1.02). Interestingly, Mårild et al15 observed an increased risk of CD in small for gestational age (SGA) children (OR=1.21; 95% CI=1.09–1.35).
The Swedish Twin Registry (STR) collects data on all twins in Sweden.16 Through zygosity data (where monozygotic [MZ] twin pairs share 100% of their genes and dizygotic [DZ] twin pairs on average 50% of the genome), it allows researchers to disentangle genetic and environmental factors in the etiology of complex diseases. In this study, we examined the association between birth weight and CD in twins with biopsy-verified CD.
Materials and methods
CD
In 2006–2008, we contacted all 28 pathology departments in Sweden and obtained data on small intestinal biopsies performed in 1969–2008. We then updated the data collection in 2013 to include individuals undergoing biopsy up until this year. Data included date of biopsy, biopsy site (duodenum and jejunum), VA (Marsh grade III), and personal identity number.17 We defined CD as having VA in the duodenum or jejunum at histopathology examination. This definition has been validated, and in a Swedish setting,18 95% of all individuals with VA have CD (this is in fact higher than having a physician-assigned diagnosis in the National Patient Register19). The histopathology examination was based on an average of three small intestinal specimens20 which should detect 95% of all CD patients. Additional details on the collection of biopsy data have been published previously. In total, 39,935 individuals with CD were identified and then matched to the STR. This study was approved by the regional ethics review board in Stockholm on June 14, 2006 (2006/633-31/4). This was a registry-based study, and for this reason, no participant was contacted.26 The study did not include any identifying information.
The STR
The STR started in the 1950s and contains information about twins born in Sweden since 1886.16 Zygosity is determined through questionnaire data about intrapair similarities in childhood, being of opposite sex, or DNA analyses, and has an estimated accuracy of >98%.21
In this study, we identified all twins alive in 2007 (N=146,830 from 80,296 pairs) and born since 1906 (so that participants were ≤100 years at the end of the study) whose birth year and sex were known, out of whom 669 (0.5%) had a diagnosis of CD (VA; Table 1). In addition to birth weight, we obtained information on sex, birth length, birth year, and zygosity from the STR. The study was not restricted to Caucasians. Swedish regulations prohibit registers on religion or race.
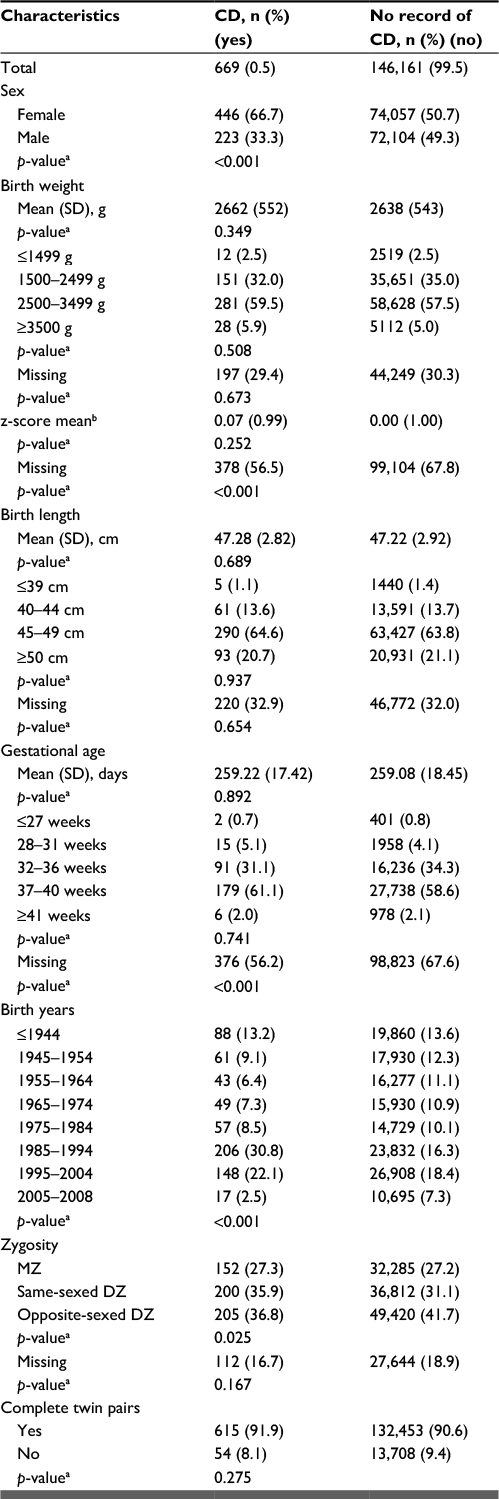 | Table 1 Descriptive information, number (percentage of non-missing values within each variable) if not else stated Notes: ap-values from either a Student’s t-test (continuous) or a Pearson chi-square test (categorical) for difference between the group with CD and the group without CD. The p-values refer to variables presented above each p-value row. bz-score refers to sex and gestational age-standardized birth weight. Abbreviations: CD, celiac disease; DZ, dizygotic; MZ, monozygotic. |
Swedish Medical Birth Registry
This registry started in 1973 and contains data on >98% of all births. Data were collected on standardized forms. Only birth weights ≥300 g and ≤7000 g were accepted in the registry to decrease errors. Through this register, we obtained data on birth weight and gestational length (in days). When the information was not available in the Medical Birth Registry, we retrieved the corresponding data from the STR, collected through questionnaires. The Medical Birth Registry is regularly audited and has a high quality.22
Birth weight and z-scores
Data on birth weight were available, from either the Medical Birth Registry or the STR, for 102,384 twins. We calculated gestational age-standardized birth weight, henceforth called z-scores; separately for males and females, we standardized birth weight for each gestational day by subtracting the gestational day-specific mean and dividing by the gestational day-specific SD. Where fewer than five observations were available in a gestational day, we combined adjoining days until at least five observations were accumulated before calculating the z-score.
Descriptive
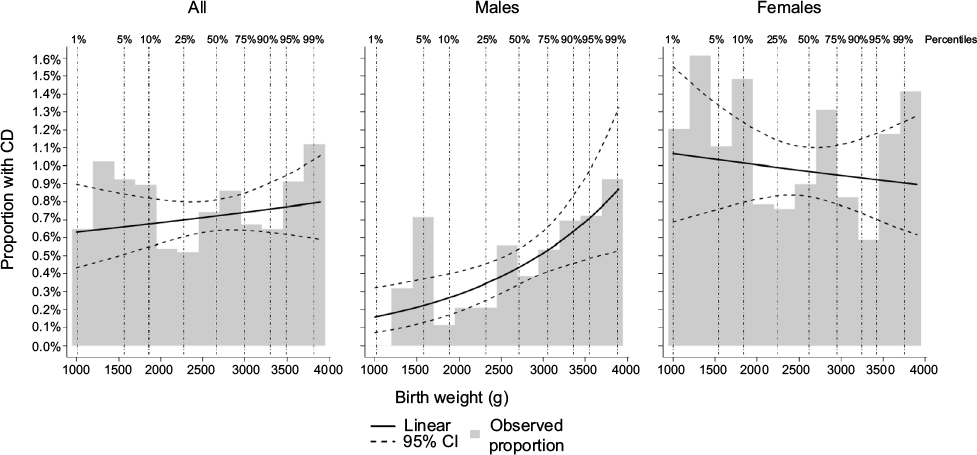
We summarized all variables in the groups with and without CD. Specifically, we counted the number of twins of each sex, calculated the mean birth weight, categorized birth weight into very low (≤1499 g), low (1500–2499 g), normal (2500–3499 g), and high (≥3500 g), and calculated mean z-scores. We calculated the mean birth length and gestational age, as well as categorized according to predefined groups. Furthermore, we categorized twins as birth year, zygosity, and based on whether the twin had an observed co-twin (i.e., representing a complete pair). We plotted observed proportions of CD by birth weight (as a histogram in 250 g increments from 1200 to 3950 g) and added a modeled effect from a logistic regression model, where birth weight was included as a linear predictor on the log-odds scale – first on the total sample, then for males and females separately (Figure 1). Finally, we plotted a similar plot using the z-scores (in 0.5 increments from -2.5 to 2.5 SD; Figure 2).
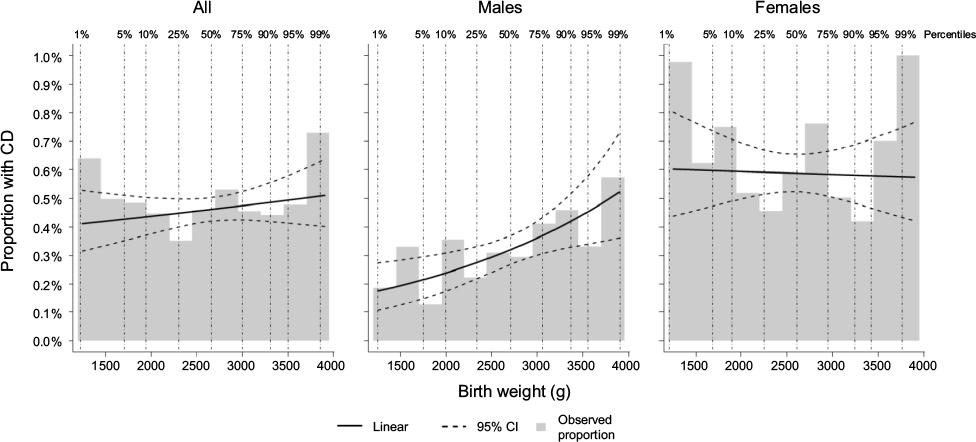 | Figure 1 Observed proportion with CD by birth weight. Notes: Percentiles refer to the percentage of individuals with a birth weight lower than indicated. Linear refers to a modeled proportion in a logistic regression with an effect that is linear on the log-odds scale. 95% CI refers to 95% bootstrap CIs of modeled proportion with CD based on 10,000 repeats. Abbreviations: CD, celiac disease; CI, confidence interval. |
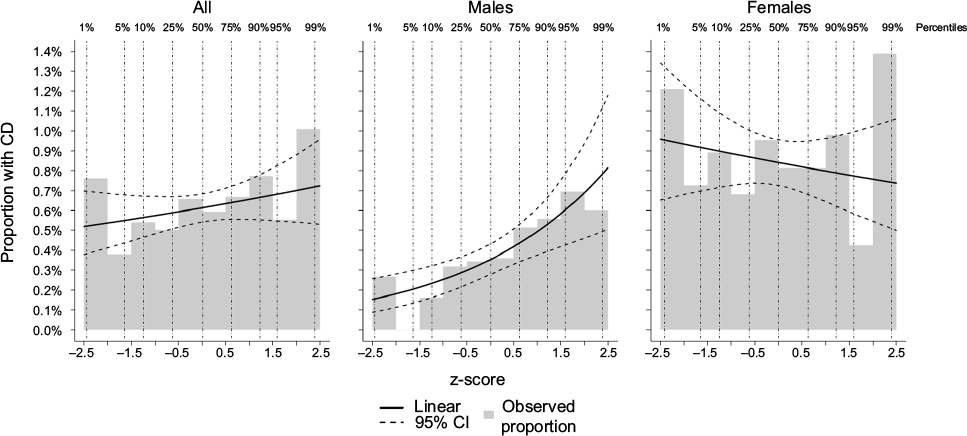 | Figure 2 Observed proportion with CD by gestational age-standardized birth weight (z-scores). Notes: Percentiles refer to the percentage of individuals with a birth weight lower than indicated. Linear refers to a modeled proportion in a logistic regression with an effect that is linear on the log-odds scale. 95% CI refers to 95% bootstrap CIs of modeled proportion with CD based on 10,000 repeats. Abbreviations: CD, celiac disease; CI, confidence interval. |
Statistical analyses
Birth weight: all twins
We performed logistic regression with CD as outcome and birth weight as exposure, where birth weight was assumed to have a linear effect on the log-odds scale. We then fitted a model where we adjusted for the potentially confounding effect of the covariates sex and birth year (in the same categories as for the descriptive; Table 1).
Intrauterine growth: all twins
We added the covariate gestational age (same categories as given in Table 1) to the abovementioned model. We then continued to perform logistic regression using z-scores (gestational age-standardized birth weight), first crudely and then with adjustment for sex and birth year.
Low birth weight
We then performed all mentioned analyses using low birth weight (≤2499 g, including individuals with very low birth weight) as predictor in a logistic regression model.
Within-twin pair analyses
To investigate whether potential associations seen were due to factors shared by the two twins within each pair, we performed the so-called within-pair analyses. In these analyses, each pair is considered a cluster in a conditional logistic regression; thus, each twin’s co-twin acts as a control and is matched on (and thus adjusted for) all factors shared between the twins; specifically shared confounders and shared mediators are adjusted for in the analyses.23 We analyzed birth weight, z-scores, and low birth weight, separately for DZ and MZ twins, representing increased adjustment of genetic factors.
Finally, we performed all statistical analyses stratified by sex.
Sensitivity analyses
To investigate whether the association between birth weight and CD differed between MZ and DZ twins, we estimated the associations separately, and by sex, with continuous birth weight as predictor. We used this approach since causes of differences in birth weight between twins who are MZ and DZ may differ due to differences in intrauterine environment – where MZ twins may share placenta and/or amniotic sac, while DZ twins do not. If MZ and DZ twins do not have a similar association between birth weight and CD, an analysis combining the subpopulations may not be advisable.
Since birth weight has increased with time, and practice in diagnosing CD has changed, we performed analyses on the subsample born in 1980–2004 – a population where CD was primarily diagnosed in childhood since CD used to be regarded as a pediatric diagnosis. In this subsample, we plotted the observed proportion of CD by birth weight and analyzed the crude and sex and birth year-adjusted association between birth weight and CD using logistic regression, for both sexes combined and stratified by sex.
To ensure that inclusion of opposite-sexed DZ twin pairs did not bias the results, we performed an analysis of birth weight and CD excluding twins from opposite-sexed pairs, stratified by sex. Finally, we stratified our analyses according to the following: if twin pairs were complete or incomplete.
All statistical analyses were performed in a generalized estimation equation setting, using a cluster–robust sandwich estimator to adjust the precision of the estimates (CIs) by eliminating distributional assumptions and accounting for dependencies between twins in pairs. To this end, we used the gee function from the drgee package24 in R.25
Results
Descriptive
Descriptive information on the study population is presented in Table 1. Of the 146,830 twins included in the study, 669 (0.5%) had biopsy-verified CD, with an overrepresentation of females (66.7% of CD cases were females versus 50.7% of non-CD twins; p<0.001). The mean birth weight was 2662 g in CD twins and 2638 g in non-CD twins. The z-scores did not differ significantly (p=0.252). The lengths at birth, 47.3 cm and 47.2 cm, respectively, were also similar (p=0.689). The gestational age did not differ significantly between CD and non-CD twins (p=0.741). While the majority of twins with CD were born in 1985–2004, likely reflecting that the diagnosis of CD used to take place primarily in childhood and computerized data on VA are scarce before this period, the birth years of non-CD twins were more evenly distributed. Zygosity was similar in CD and non-CD twins. When plotting the proportions of CD cases against categorized birth weight, no clear pattern was observed in the total sample and among females, but a positive association was detectable among males (Figure 1); the pattern was similar when plotting against z-scores (Figure 2).
Main results
Birth weight: all twins
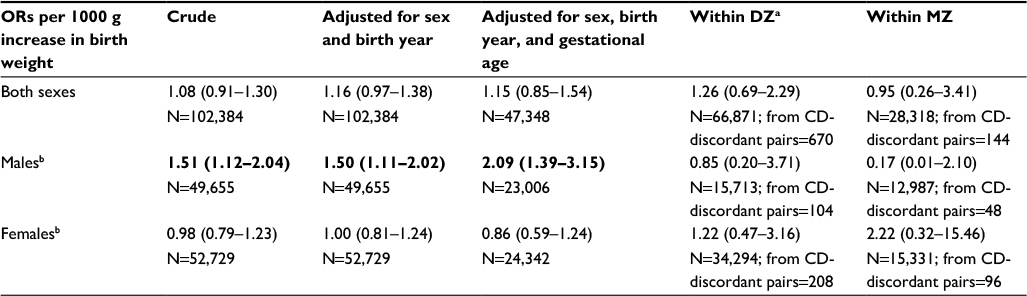
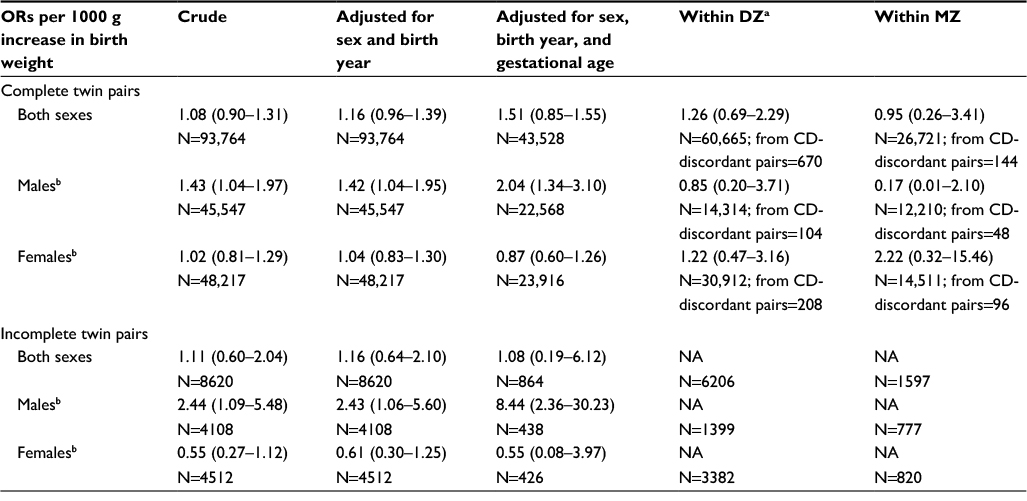
For each 1000 g increase in birth weight, the odds of CD increased by a factor of 1.08 (crude OR=1.08; 95% CI=0.91–1.30; Table 2). This association was stronger, and statistically significant in males (OR=1.51; 95% CI=1.12–2.04) and practically null for females (OR=0.98; 95% CI=0.79–1.23). Adjustments for sex and birth year changed the association somewhat (OR=1.16; 95% CI=0.97–1.38), but not notably so in the sex-specific analyses.
 | Table 2 Analyses of the association between birth weight and CD, estimate (95% CI) Notes: Birth year and gestational days are treated as categorical variables. The number of observations differs between columns because of missing data in variables adjusted for. aAdjusted for sex where applicable. bTwins from same-sexed and opposite-sexed pairs. Bold figures indicate statistically significant (p<0.05). Abbreviations: CD, celiac disease; CI, confidence interval; DZ, dizygotic; MZ, monozygotic; OR, odds ratio. |
Intrauterine growth: all twins
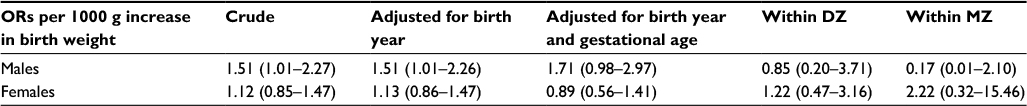
The association with birth weight remained similar when adjusting for gestational age (OR=1.15; 95% CI=0.85–1.54), while it became stronger in males (OR=2.09; 95% CI=1.39–3.15) and with a lower risk for CD in females (OR=0.86; 95% CI=0.59–1.24; Table 2). However, the crude estimates were covered by the CIs from the adjusted analyses and vice versa. In the analysis of z-scores, the association of a one SD increase in z-score was not significant, in both crude (OR=1.07; 95% CI=0.95–1.21; Table 3) and adjusted (OR=1.06; 95% CI=0.93–1.19) analyses. Similar to analyses of birth weight, the association was positive and significant for males (OR=1.40; 95% CI=1.17–1.67) and close to null for females (OR=0.95; 95% CI=0.82–1.10).
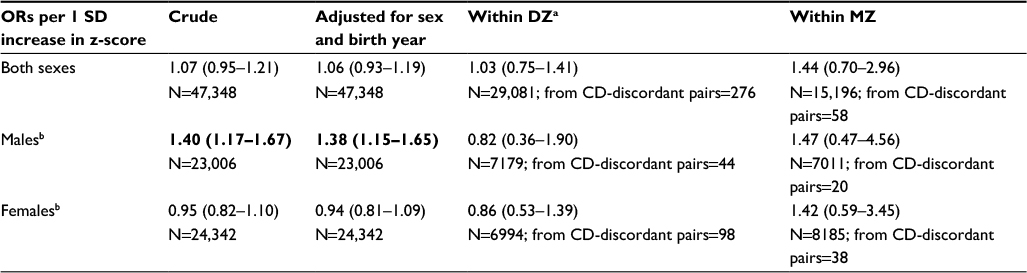 | Table 3 Analyses of the association between z-score (birth weight standardized per gestational age) and CD, estimate (95% CI) Notes: Birth year is treated as categorical variable. aAdjusted for sex where applicable. bTwins from same-sexed and opposite-sexed pairs. Bold figures indicate statistically significant (p<0.05). Abbreviations: CD, celiac disease; CI, confidence interval; DZ, dizygotic; MZ, monozygotic; OR, odds ratio. |
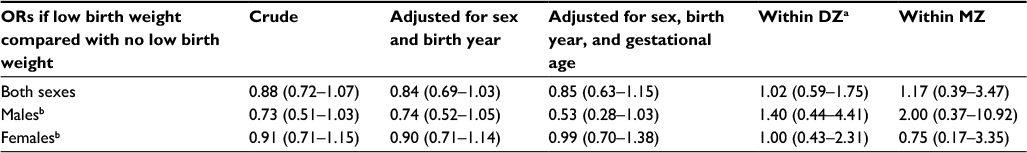
Low birth weight
In analyses with low birth weight (≤2499 g) as binary exposure, the patterns of results were similar; low birth weight was associated with a lower risk of CD, particularly in males (Table 4). However, the power was lower in this analysis, and no estimate was significantly different from zero.
 | Table 4 Analyses of the association between low birth weight (≤2499 g) and CD, estimate (95% CI) Notes: Birth year and gestational days treated as categorical variables. The number of observations differs between columns because of missing data in variables adjusted for (sample sizes equal to Table 2). aAdjusted for sex where applicable. bTwins from same-sexed and opposite-sexed pairs. Abbreviations: CD, celiac disease; CI, confidence interval; DZ, dizygotic; MZ, monozygotic; OR, odds ratio. |
Within-twin pair analyses
In the within-twin pair analyses, no ORs differed significantly from 1, neither in combined nor in sex-specific analyses and neither in DZ nor in MZ twin pairs (Tables 2–4). This may reflect that genetic and/or shared environmental factors confound the association between birth weight and CD, at least among males. However, the CIs were wide since the informative pairs for within analysis are those who are discordant on outcome, as well as on exposure, making it difficult to draw any decisive inferences from the analyses.
Sensitivity analyses
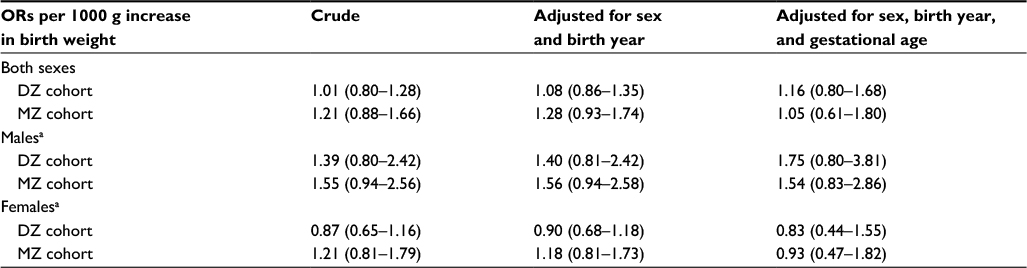
The association appeared similar in DZ and MZ twins as indicated by the CI of the estimate in one zygosity overlapping the CI of the other (Table S1).
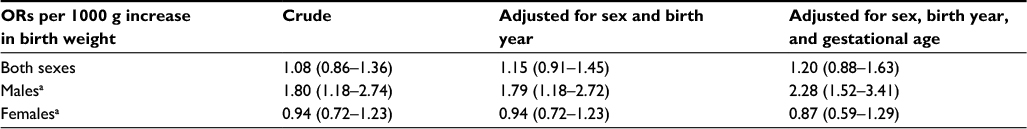
Results from analyses of subsample born in 1980–2004 are presented in Table S2 and Figure S1. The results were very similar as in the full cohort.
Analyses excluding the opposite-sexed DZ twins showed similar estimates as in the main analysis, but with wider CIs (Table S3).
Data stratified for complete versus incomplete twin pairs were similar to those in the main analyses (Table S4).
Discussion
In this nationwide cohort of twins, we found no overall association between birth weight, intrauterine growth, or low birth weight (≤2499 g) and later CD. While a statistically significant association was found between birth weight and intrauterine growth and later CD among males, that association disappeared in within-twin analyses. Within-twin analyses allowed us to consider shared environmental and genetic factors, but with limited statistical power. While several individuals in our study may also have been included in earlier Swedish studies14,15 (all three studies took place in Sweden), the current study used a larger dataset, identifying cases through biopsy registers, and used an innovative twin method to minimize the confounding effect from genetic and early environmental factors.
In a recent Swedish study by Namatovu et al14 based on 6596 children with CD, low birth weight (≤1499 g) was inversely associated with later CD (p=0.01), but this association was not statistically significant after adjustment for potential confounders.14 Furthermore, that study also found protective effects of high maternal age, high income, and average body mass index of the pregnant woman (25–29 years). Several of these factors may covary with child birth weight, and therefore confound relationships with CD. Comparing twins with the same mother, and especially MZ twins with identical genetic background, allowed us to eliminate the influence of maternal background characteristics.
As opposed to Namatovu et al,14 two other Scandinavian studies13,15 have explored the influence of SGA. In the first and so far largest study on pregnancy outcome and CD,15 Mårild et al found a small excess risk of CD in SGA children. No similar increase was seen in the Norwegian study by Emilsson et al.13 Although the authors of these studies used slightly different definitions, risk estimates were actually similar in the two most similar analyses on SGA (Sweden: OR=1.21; 95% CI=1.09–1.35, and Norway: OR=1.12; 95% CI=0.70–1.80).13,15 None of the two studies did however find any association between birth weight and future CD.
We used two approaches when examining birth weight and intrauterine growth and risk of CD. First, we examined our “full twin cohort” and observed a borderline increased risk of CD with increasing birth weight (a positive association among males). A positive association between birth weight and CD in males was also seen in the study by Namatovu et al.14 Several studies have demonstrated sex differences with regard to prevalence,27,28 clinical presentation,29 and histopathological features30 of autoimmune disease, and the immune system is not identical in males and females31 potentially due to differences in sex hormones.32 Either or several of these factors may contribute to an increased susceptibility to CD in males with high birth weight. But the association could also be a chance finding due to multiple comparisons and should be explored in future larger analyses.
Second, we examined birth weight within twins to control for potential shared genetic and environmental confounders. Considering that an increase in birth weight was not associated with CD in our male within-twin analyses (neither among DZ nor among MZ twins), we find it unlikely that birth weight plays more than a marginal role for CD pathogenesis in either sex, although we acknowledge the limited power of our within-twin analyses. Median birth weights are similar within Europe,33 while the prevalence of CD varies substantially.34 This supports our findings that, on a population level, birth weight is unlikely to influence the prevalence of CD more than marginally, if at all.
Among the strengths of our study is the large number of affected twins (n=669), of which 140 belonged to 106 MZ twin pairs. By comparison, the study by Nistico et al35 on twin genetics was based on 23 MZ twin pairs, but neither that study35 nor any other twin study has to our knowledge evaluated the importance of perinatal factors in CD development. In our study, data on zygosity, birth weight, and CD status were collected independently, thereby decreasing the risk of bias.
We used biopsy record data to identify CD. Biopsies were up until 2012 the reference standard for diagnosis in both adults and children36 and has remained so in adults1,37 (but with an option to abstain from biopsy in a subset of children). Earlier validation has shown that small intestinal biopsies have a high sensitivity for CD (96% of gastroenterologists and 100% of pediatricians reported performing a biopsy before assigning the CD diagnosis during the study period),18 and when examining patient charts of 114 patients with VA, 108 had CD (95%).18 Even though we did not require a positive serology for the CD diagnosis, 88% of VA individuals with available data were positive for transglutaminase, endomysium, or gliadin antibodies.17
Among the limitations of our study is the risk of misclassification. Undiagnosed CD (now classified as absent) in discordant twin pairs will drive the difference in birth weight toward null. This is similar to all studies based on diagnosed CD, and our prevalence of diagnosed CD (0.5%) is consistent with previous reports from other European countries. A second limitation is our limited statistical power. Despite taking advantage of the nationwide STR with almost 150,000 twins, CIs for within-twin analyses were wide.
Conclusion
Our population-based study found that in male twins higher birth weight was associated with higher risk of CD. However, when comparing discordant twin pairs in within-twin pair analyses, there was no association between birth weight, intrauterine growth, and future risk of CD.
Acknowledgments
JFL was supported by grants from the Swedish Society of Medicine and the Swedish Research Council. None of the funders had any influence on this study.
Author contributions
Agreed with the manuscript’s results and conclusion and approved the final version of the manuscript: JFL, RK-H, BL, JH, LE, and PKM. Designed the study: JFL, RK-H, LE, and PKM. Analyzed the data: RK-H. Wrote the first draft of the manuscript: JFL and RK-H. Contributed to the revision of the paper: BL, JH, LE, and PKM. Contributed to the design of the study and interpretation of the data analyses: BL and JH. Responsible for data integrity: JFL, RK-H, and PKM. Obtained funding: JFL. All the authors approved the final version of the manuscript.
Disclosure
The authors report no conflicts of interest in this work.
References
Ludvigsson JF, Leffler DA, Bai JC, et al. The Oslo definitions for coeliac disease and related terms. Gut. 2013;62(1):43–52. | ||
Abenavoli L, Delibasic M, Peta V, Turkulov V, De Lorenzo A, Medic-Stojanoska M. Nutritional profile of adult patients with celiac disease. Eur Rev Med Pharmacol Sci. 2015;19(22):4285–4292. | ||
Elfstrom P, Granath F, Ekstrom Smedby K, et al. Risk of lymphoproliferative malignancy in relation to small intestinal histopathology among patients with celiac disease. J Natl Cancer Inst. 2011;103(5):436–444. | ||
Ludvigsson JF, Montgomery SM, Ekbom A. Celiac disease and risk of adverse fetal outcome: a population-based cohort study. Gastroenterology. 2005;129(2):454–463. | ||
Ludvigsson JF, Montgomery SM, Ekbom A, Brandt L, Granath F. Small-intestinal histopathology and mortality risk in celiac disease. JAMA. 2009;302(11):1171–1178. | ||
Ivarsson A, Hernell O, Stenlund H, Persson LA. Breast-feeding protects against celiac disease. Am J Clin Nutr. 2002;75(5):914–921. | ||
Akobeng AK, Ramanan AV, Buchan I, Heller RF. Effect of breast feeding on risk of coeliac disease: a systematic review and meta-analysis of observational studies. Arch Dis Child. 2006;91(1):39–43. | ||
Vriezinga SL, Auricchio R, Bravi E, et al. Randomized feeding intervention in infants at high risk for celiac disease. N Engl J Med. 2014;371(14):1304–1315. | ||
Lionetti E, Castellaneta S, Francavilla R, et al; SIGENP (Italian Society of Pediatric Gastroenterology, Hepatology, and Nutrition) Working Group on Weaning and CD Risk. Introduction of gluten, HLA status, and the risk of celiac disease in children. N Engl J Med. 2014;371(14):1295–1303. | ||
Kuja-Halkola R, Lebwohl B, Halfvarson J, Wijmenga C, Magnusson PK, Ludvigsson JF. Heritability of non-HLA genetics in coeliac disease: a population-based study in 107 000 twins. Gut. 2016;65(11):1793–1798. | ||
Lebwohl B, Ludvigsson JF, Green PH. The unfolding story of celiac disease risk factors. Clin Gastroenterol Hepatol. 2014;12(4):632–635. | ||
Sandberg-Bennich S, Dahlquist G, Kallen B. Coeliac disease is associated with intrauterine growth and neonatal infections. Acta Paediatr. 2002;91(1):30–33. | ||
Emilsson L, Magnus MC, Stordal K. Perinatal risk factors for development of celiac disease in children, based on the prospective Norwegian Mother and Child Cohort Study. Clin Gastroenterol Hepatol. 2015;13(5):921–927. | ||
Namatovu F, Olsson C, Lindkvist M, et al. Maternal and perinatal conditions and the risk of developing celiac disease during childhood. BMC Pediatr. 2016;16(1):77. | ||
Mårild K, Stephansson O, Montgomery S, Murray JA, Ludvigsson JF. Pregnancy outcome and risk of celiac disease in offspring: a nationwide case-control study. Gastroenterology. 2012;142(1):39–45.e3. | ||
Magnusson PK, Almqvist C, Rahman I, et al. The Swedish Twin Registry: establishment of a biobank and other recent developments. Twin Res Hum Genet. 2013;16(1):317–329. | ||
Ludvigsson JF, Otterblad-Olausson P, Pettersson BU, Ekbom A. The Swedish personal identity number: possibilities and pitfalls in healthcare and medical research. Eur J Epidemiol. 2009;24(11):659–667. | ||
Ludvigsson JF, Brandt L, Montgomery SM, Granath F, Ekbom A. Validation study of villous atrophy and small intestinal inflammation in Swedish biopsy registers. BMC Gastroenterol. 2009;9(1):19. | ||
Ludvigsson JF, Andersson E, Ekbom A, et al. External review and validation of the Swedish national inpatient register. BMC Public Health. 2011;11(1):450. | ||
Ludvigsson JF, Brandt L, Montgomery SM. Symptoms and signs in individuals with serology positive for celiac disease but normal mucosa. BMC Gastroenterol. 2009;9:57. | ||
Lichtenstein P, De Faire U, Floderus B, Svartengren M, Svedberg P, Pedersen NL. The Swedish Twin Registry: a unique resource for clinical, epidemiological and genetic studies. J Intern Med. 2002;252(3):184–205. | ||
The Swedish Medical Birth Register: A Summary of Content and Quality. Stockholm, Sweden: Swedish National Board of Health and Welfare; 2003. Available from: http://www.socialstyrelsen.se/Lists/Artikelkatalog/Attachments/10655/2003-112-3_20031123.pdf. Accessed October 13, 2017. | ||
Sjölander A, Zetterqvist J. Confounders, mediators or colliders – what types of shared covariates does the sibling comparison design control for? Epidemiology. 2017;28(4):540–547. | ||
Zetterqvist J, Sjölander A, Ploner A. Drgee: Doubly Robust Generalized Estimating Equations. 1.1.0 ed. R Package; 2015. | ||
R Core Team. R: A Language and Environment for Statistical Computing. Vienna, Austria: R Foundation for Statistical Computing; 2013. ISBN 3-900051-07-0. | ||
Ludvigsson JF, Haberg SE, Knudsen GP, et al. Ethical aspects of registry-based research in the Nordic countries. Clin Epidemiol. 2015;7:491–508. | ||
Eaton WW, Rose NR, Kalaydjian A, Pedersen MG, Mortensen PB. Epidemiology of autoimmune diseases in Denmark. J Autoimmun. 2007;29(1):1–9. | ||
Ngo ST, Steyn FJ, McCombe PA. Gender differences in autoimmune disease. Front Neuroendocrinol. 2014;35(3):347–369. | ||
Ciacci C, Cirillo M, Sollazzo R, Savino G, Sabbatini F, Mazzacca G. Gender and clinical presentation in adult celiac disease. Scand J Gastroenterol. 1995;30(11):1077–1081. | ||
Fairweather D, Frisancho-Kiss S, Rose NR. Sex differences in autoimmune disease from a pathological perspective. Am J Pathol. 2008;173(3):600–609. | ||
McCombe PA, Greer JM, Mackay IR. Sexual dimorphism in autoimmune disease. Curr Mol Med. 2009;9(9):1058–1079. | ||
Trigunaite A, Dimo J, Jorgensen TN. Suppressive effects of androgens on the immune system. Cell Immunol. 2015;294(2):87–94. | ||
Hemming K, Hutton JL, Glinianaia SV, Jarvis SN, Platt MJ. Differences between European birthweight standards: impact on classification of “small for gestational age”. Dev Med Child Neurol. 2006;48(11):906–912. | ||
Mustalahti K, Catassi C, Reunanen A, et al; Coeliac EU Cluster, Project Epidemiology. The prevalence of celiac disease in Europe: results of a centralized, international mass screening project. Ann Med. 2010;42(8):587–595. | ||
Nistico L, Fagnani C, Coto I, et al. Concordance, disease progression, and heritability of coeliac disease in Italian twins. Gut. 2006;55(6):803–808. | ||
Husby S, Koletzko S, Korponay-Szabo IR, et al; ESPGHAN Working Group on Coeliac Disease Diagnosis; ESPGHAN Gastroenterology Committee; European Society for Pediatric Gastroenterology, Hepatology, and Nutrition. European Society for Pediatric Gastroenterology, Hepatology, and Nutrition guidelines for the diagnosis of coeliac disease. J Pediatr Gastroenterol Nutr. 2012;54(1):136–160. | ||
Ludvigsson JF, Bai JC, Biagi F, et al; BSG Coeliac Disease Guidelines Development Group; British Society of Gastroenterology. Diagnosis and management of adult coeliac disease: guidelines from the British Society of Gastroenterology. Gut. 2014;63(8):1210–1228. |
Supplementary materials
 | Table S1 Analyses of the association between birth weight and CD, estimate (95% CI) Notes: Length, birth year, and gestational days are treated as categorical variables. The number of observations differs between columns because of missing data in variables adjusted for. aTwins from same-sexed and opposite-sexed pairs. Abbreviations: CD, celiac disease; CI, confidence interval; DZ, dizygotic; MZ, monozygotic; OR, odds ratio. |
 | Table S2 Analyses of the association between birth weight and CD in subsample born in 1980–2004 (N=58,771), estimate (95% CI) Notes: Birth year and gestational days are treated as categorical variables. The number of observations differs between columns because of missing data in variables adjusted for. aTwins from same-sexed and opposite-sexed pairs. Abbreviations: CD, celiac disease; CI, confidence interval; OR, odds ratio. |
 | Table S3 Analyses of the association between birth weight and CD among same-sexed twin pairs, estimate (95% CI) Notes: Birth year and gestational days are treated as categorical variables. The number of observations differs between columns because of missing data in variables adjusted for. Abbreviations: CD, celiac disease; CI, confidence interval; DZ, dizygotic; MZ, monozygotic; OR, odds ratio. |
 | Table S4 Analyses of the association between birth weight and CD stratified by whether twin pair was complete, estimate (95% CI) Notes: The within estimates cannot be calculated in incomplete pairs. Birth year and gestational days treated as categorical variables. The number of observations differs between columns because of missing data in variables adjusted for. aAdjusted for sex where applicable. bTwins from same-sexed and opposite-sexed pairs. Abbreviations: CD, celiac disease; CI, confidence interval; DZ, dizygotic; MZ, monozygotic; NA, not applicable; OR, odds ratio. |
(Continued)
 | Figure S1 Observed proportion with CD by birth weight in subsample born in 1980–2004. Notes: Percentiles refer to the percentage of individuals with a birth weight lower than indicated. Linear refers to a modeled proportion in a logistic regression with an effect that is linear on the log-odds scale. 95% CI refers to 95% bootstrap CIs of modeled proportion with CD based on 10,000 repeats. Abbreviations: CD, celiac disease; CI, confidence interval. |
 © 2017 The Author(s). This work is published and licensed by Dove Medical Press Limited. The full terms of this license are available at https://www.dovepress.com/terms.php and incorporate the Creative Commons Attribution - Non Commercial (unported, v3.0) License.
By accessing the work you hereby accept the Terms. Non-commercial uses of the work are permitted without any further permission from Dove Medical Press Limited, provided the work is properly attributed. For permission for commercial use of this work, please see paragraphs 4.2 and 5 of our Terms.
© 2017 The Author(s). This work is published and licensed by Dove Medical Press Limited. The full terms of this license are available at https://www.dovepress.com/terms.php and incorporate the Creative Commons Attribution - Non Commercial (unported, v3.0) License.
By accessing the work you hereby accept the Terms. Non-commercial uses of the work are permitted without any further permission from Dove Medical Press Limited, provided the work is properly attributed. For permission for commercial use of this work, please see paragraphs 4.2 and 5 of our Terms.