")
Back to Journals » International Journal of Nanomedicine » Volume 12
Biotransport kinetics and intratumoral biodistribution of malonodiserinolamide-derivatized [60]fullerene in a murine model of breast adenocarcinoma
Authors Lapin NA , Vergara LA , Mackeyev Y , Newton JM, Dilliard SA, Wilson LJ, Curley SA, Serda RE
Received 2 April 2017
Accepted for publication 21 May 2017
Published 15 November 2017 Volume 2017:12 Pages 8289—8307
DOI https://doi.org/10.2147/IJN.S138641
Checked for plagiarism Yes
Review by Single anonymous peer review
Peer reviewer comments 4
Editor who approved publication: Dr Thomas Webster
Supplementary video corresponding to image sequence, images and graphs in Figure 4 and Figure 5A and B.
Views: 181
Norman A Lapin,1 Leoncio A Vergara,1,2 Yuri Mackeyev,3,4 Jared M Newton,1,5 Sean A Dilliard,6 Lon J Wilson,3,4 Steven A Curley,1 Rita E Serda1,7
1Michael E DeBakey Department of Surgery, Baylor College of Medicine, 2Institute of Biosciences & Technology, Texas A&M University, 3Department of Chemistry, Rice University, 4The Smalley-Curl Institute for Nanoscale Science and Technology, Rice University, 5Interdepartmental Program in Translational Biology and Molecular Medicine, Baylor College of Medicine, 6Department of Chemical and Biomolecular Engineering, Rice University, Houston, TX, 7Department of Chemical and Biological Engineering, University of New Mexico, Albuquerque, NM, USA
Abstract: [60]Fullerene is a highly versatile nanoparticle (NP) platform for drug delivery to sites of pathology owing to its small size and both ease and versatility of chemical functionalization, facilitating multisite drug conjugation, drug targeting, and modulation of its physicochemical properties. The prominent and well-characterized role of the enhanced permeation and retention (EPR) effect in facilitating NP delivery to tumors motivated us to explore vascular transport kinetics of a water-soluble [60]fullerene derivatives using intravital microscopy in an immune competent murine model of breast adenocarcinoma. Herein, we present a novel local and global image analysis of vascular transport kinetics at the level of individual tumor blood vessels on the micron scale and across whole images, respectively. Similar to larger nanomaterials, [60]fullerenes displayed rapid extravasation from tumor vasculature, distinct from that in normal microvasculature. Temporal heterogeneity in fullerene delivery to tumors was observed, demonstrating the issue of nonuniform delivery beyond spatial dimensions. Trends in local region analysis of fullerene biokinetics by fluorescence quantification were in agreement with global image analysis. Further analysis of intratumoral vascular clearance rates suggested a possible enhanced penetration and retention effect of the fullerene compared to a 70 kDa vascular tracer. Overall, this study demonstrates the feasibility of tracking and quantifying the delivery kinetics and intratumoral biodistribution of fullerene-based drug delivery platforms, consistent with the EPR effect on short timescales and passive transport to tumors.
Keywords: fullerene, intravital microscopy, breast cancer, enhanced permeation and retention, drug delivery
Introduction
[60]Fullerenes, first prepared from graphite vaporization by laser irradiation in 19851 and later scaled-up for chemical modification,2 are spherical cages composed of 60 carbon atoms with a diameter of <1 nm and can be classified as the smallest of nanoparticles (NPs). For >25 years, derivatives of this class of NP have served as a platform for a variety of biomedical applications including X-ray and magnetic resonance imaging (MRI) contrast agents,3–6 drug delivery,5–13 antioxidant neuroprotection,14,15 and free radical formation for cancer cytotoxicity with16–18 and without19 [60]fullerene photoexcitation. The small size of [60]fullerene derivatives makes them ideal candidates for drug delivery, potentially offering an increased penetration of tissues and rapid cellular uptake20–25 with minimal toxicity to normal cells.8,18,19,26,27 Owing to their spheroidal shape, [60]fullerenes have been functionalized at as many as 48 locations on a single NP28 and even branched at individual derivative locations to provide multisite drug attachment per [60]fullerene NP,8 potentially boosting therapeutic dose at lower NP concentration.3 Hence, [60]fullerene is a highly flexible NP platform that is potentially a drug delivery vector and dose-tunable depending on the therapeutic application.
One such application of [60]fullerene derivatives is in the treatment of solid malignant tumors.9,11–13 However, there are numerous biological barriers that must be overcome for efficacious delivery of these NPs to the tumor site all of which depend on NP solubility in each biological compartment. These transport barriers include uptake by the mononuclear phagocyte system (MPS), systemic clearance, tumor vasculature extravasation, interstitial transport in cancerous tissues, and tumor cell uptake. Furthermore, to activate the bioavailability of this hydrophobic fullerene platform, it is necessary to chemically modify it by the attachment of polar functional groups.8 Additional obstacles to tumor drug and NP delivery include high tumor interstitial fluidic pressure,29 intratumoral variability in blood vessel diameter, permeability, number density, and volumetric distribution,30,31 all of which cause highly heterogeneous distribution of drug and NP in the tumor.32
Despite the promise of water-soluble fullerene derivatives as drug delivery vectors, there have been a limited number of investigations of the biokinetics of water-soluble fullerene derivatives. At the cellular level, investigators demonstrated that upon cellular uptake of PromoFluor-633-conjugated malonodiserinolamide-derivatized [60]fullerene (C60-serPF) by liver cancer cells and HeLa cells in vitro, aggregates of C60-serPF were found in the nuclei of those cells21,25 and that for liver cancer cells, the uptake was molecular pathway dependent.21 C60-serPF uptake and biodistribution was further studied in mice, and this agent was found to predominantly accumulate in the kidney and liver as well as in hepatic tumors on the scale of hours.21 Toxicity studies show that some types of water-soluble fullerene derivatives conjugated to antineoplastic agents can be toxic to both normal cells and cancer cells,8 and solubility is tunable such that increases in solubility negate their toxicity by up to seven orders of magnitude.19 Malonodiserinolamide-derivatized [60]fullerene (C60-ser) itself (consisting of a hydrophobic core surrounded symmetrically by hydrophilic serinol groups) exhibits low cytotoxicity to both normal and cancer cells yet demonstrates cytotoxicity when covalently modified with the chemotherapeutic, Taxol® (paclitaxel).8
To gain further insight into the behavior and biokinetics of water-soluble fullerene derivatives in vivo, real-time dynamic information is needed beyond what endpoint analyses can offer. Such time-resolved studies can provide specific information about the temporal mechanisms behind intratumoral barriers to drug and NP delivery and related heterogeneity that lead to poor or nonuniform intratumoral drug and NP biodistribution.33 Intravital microscopy (IVM) is a powerful tool that can provide detailed information about tumor and drug or NP interactions over time and hence supplement the missing temporal information. IVM applies the optical sectioning power of confocal microscopy to image the real-time delivery of fluorescently labeled drugs and NPs in the microvasculature of live animals with micron scale resolution.
In this study, we perform continuous quantification of fullerene dynamics at a temporal resolution of ~1 fps across micron-scale spatially resolved intra- and extravascular regions. Specifically, we employ IVM to investigate the intratumoral biotransport kinetics of C60-ser delivered intravenously to the microvasculature of subcutaneously allografted 4T1-luc breast cancer tumors versus normal tissue in live mice. Conjugation of C60-ser with the fluorescent dye PromoFluoro-633 (C60-serPF) enabled fluorescence-based tracking and relative quantification of C60-ser in vivo. As this fluorophore (~650 Da) is comparable in size and structure to small molecule cancer drugs such as paclitaxel (854 Da), it can further be considered sterically as a model drug for the study of C60-serPF as a drug carrier. With high spatial resolution and time-resolved confocal microscopy imaging, quantitative analysis of the biotransport kinetics involved in the microvascular delivery, extravasation, and tumor interstitial transport of C60-serPF were conducted both globally across video images and spatially localized at specific intravascular regions of interest (iROIs) and extravascular regions of interest (eROIs) corresponding to regions in and around individual blood vessel segments. In developing these methods of spatiotemporal quantification of real-time in vivo biodynamics, our investigation is best regarded as a pilot study for such a framework.
To our knowledge, no intravital biokinetic studies of any fullerene derivative have previously been reported. Furthermore, while many IVM studies quantitatively monitor drug or NP kinetics with temporal resolution on the order of minutes to hours34–37 and even days,35 no study has quantitatively tracked initial NP or drug delivery influx dynamics in the tumor microenvironment at a resolution on the timescale of seconds. As C60-serPF clears rapidly from the blood stream (as evidenced by the color change of mouse urine occurring within 15 min of C60-serPF injection21), capture of C60-serPF dynamics within the first several minutes postinjection at high temporal resolution is critical to the observation of its biokinetic behavior. Herein, we demonstrate that the water-soluble fullerene derivative C60-serPF exhibits rapid extravasation from vessels within the tumor microenvironment, capturing the biokinetics of these NPs by IVM with temporal resolution on the scale of a second. With respect to NP and drug delivery, various IVM studies have used a variety of methods to partition intravascular and extravascular regions over the course of imaging including image segmentation,37–39 selection of specific regions of interest (ROIs) within video field of view (FOV),31,34 or intensity profiles across regions.37,40 However, while these studies have performed global analyses across the entire image FOV31 and/or combined data from multiple specific ROIs,34 to our knowledge, no studies have explicitly tracked local extravasation dynamics from specific blood vessels as we do in this study.
To better understand the solution phase behavior of C60-ser, we conducted ex vivo characterization of C60-ser physicochemical properties including dynamic light scattering (DLS), zeta potential measurements, and scanning electron microscopy (SEM). We found that C60-ser molecules may exist as both aggregates and free NPs, where aggregate geometrical arrangement is a function of hydrophilic and hydrophobic parts of the C60-serPF molecule, giving the NP special aggregation properties.
Methods
Synthesis and characterization of molecular agents and dyes
Malonodiserinolamide-derivatized [60]fullerene (C60-ser, 2.21 kDa) was prepared as previously described.41 C60-serPF (2.87 kDa), formed by the covalent attachment of fluorescent dye, PromoFluor-633 (PromoCell GmbH, Heidelberg, Germany) to C60-ser, was synthesized and purified according to the procedure described in Raoof et al.21 Fluorescein isothiocyanate (FITC)-conjugated dextran (FITC–dextran; 70 kDa) purchased from Thermo Fisher Scientific (Waltham, MA, USA) served as a nonextravasating blood vessel tracer with peak excitation at 488 nm and emission in the FITC channel (525±25 nm). PromoFluor-633 of C60-serPF has peak excitation at 633 nm and emission in the Cy5 channel (700±38 nm). High performance liquid chromatography (HPLC) data of Figure S1 validate that this compound is present in high quantity relative to other isomers. The HPLC data further verifies that the covalently bound PromoFluor-633 dye remains attached to C60-serPF in aqueous and biological environments and that no free dye is present with the C60-serPF NP.
Characterization of C60-ser included dynamic light scattering (DLS), zeta potential, and scanning electron microscopy (SEM) measurements. DLS and zeta potential measurements were performed on a Malvern Zetasizer Nano (Malvern Instruments, Malvern, UK). To collect DLS and zeta potential readings over time, C60-ser was dissolved in an aqueous solvent (as stated), agitated briefly, and placed immediately in a cuvette and into the Zetasizer where it remained for the duration of readings up to 66 h. Measurements of C60-serPF are not included here due to inability of the Zetasizer to obtain consistently stable readings. This limitation is likely due to interference between the PromoFluor-633 emission spectrum and the frequency of the Zetasizer laser used to collect DLS (633 nm), which overlap.
To collect SEM images of C60-ser, a solution of 10 mg/mL C60-ser in deionized water (DIW) was lyophilized and subsequently coated onto a 300-mesh transmission electron microscopy (TEM) grid.
Images were acquired using a Hitachi SU8230 scanning electron microscope (Hitachi High-Technologies, Hillsboro, OR, USA) equipped with a secondary electron detector.
Animal model
Female BALB/c mice purchased from Harlan Sprague Dawley, Inc. (Houston, TX, USA) were housed in standard temperature and lighting conditions with free access to food and water. Acclimated mice were injected subcutaneously with 4T1-luc breast cancer cells (5×10⁵ cells/50 μL PBS; Caliper Life Sciences, Hopkinton, MA, USA) into the left abdominal wall to establish allograft breast tumors. When tumors reached a size of ~10 mm in diameter, mice were selected for IVM experiments. All animal procedures were performed in accordance with protocols approved by the Institutional Animal Care and Use Committee at the Baylor College of Medicine and in accordance with the 8th edition of the Guide for the Care and Use of Laboratory Animals (NRC, 1996).
IVM
IVM was used to monitor the transport kinetics of C60-ser in vivo delivered to subcutaneous 4T1 breast cancer tumors in a murine animal model. All animal experiments performed in this study were end-point terminal experiments, involving nonsurvival surgery. Animals were anesthetized by the inhalation of isoflurane in oxygen to a deep plane of anesthesia. The anesthesia level was subsequently maintained by the adjustment of isoflurane concentration from 2 to 3%. Animals were then secured in the supine position on a heated plate (to maintain body temperature throughout the entire experiment) and a midline abdominal incision was made, followed by a careful separation of abdominal cutaneous layers with a cotton swab to form a skin flap, exposing the tumor and blood vessels growing in the flap. The skin flap was then affixed to the surface of a rubber pad support. The preparation was next transferred to the microscope stage and maintained moist by periodic irrigation with PBS. To allow high resolution imaging with water immersion lenses and to reduce motion, a coverslip was set on top of the samples using a micro-positioning device.
A Nikon A1R laser scanning confocal microscope (Nikon Instruments, Melville, NY, USA) fitted with a water-immersion objective lens (CFI75 LWD 16× W, 0.8NA) was used to collect time lapse images of tumor microvasculature and local microenvironment of 4T1 breast adenocarcinoma in live mice. Once tumor microvasculature was in focus in bright field, the microscope was switched to confocal mode and image capture was performed at 0.5 fps in either Galvano (high resolution) or Resonant (high speed) image collection mode. A bolus dose of 20–50 μL of 70 kDa FITC–dextran, too large to extravasate appreciably (10 mg/mL), and an equal volume of C60-serPF (2 mg/mL) were injected intravenously via retro-orbital injection. These molecular agents were coinjected in the tumor-bearing mice, while in the normal mouse, FITC–dextran was injected prior to C60-serPF. Imaging commenced just prior to the injection of C60-serPF (with or without coinjection of FITC–dextran) and continued until fluorescence changes appeared to stabilize (~2 min after C60-serPF injection). Vascular delivery, extravasation, and interstitial (ie, extravascular and extracellular) transport of C60-serPF in the tumor microenvironment were imaged continuously in real time. At the termination of the imaging session, animals were euthanized in accordance with approved protocols.
Image analysis
Local ROIs were selected from each time-lapse video to quantify representative extravasation dynamics from individual blood vessel regions. Global ROIs were created across the entire FOV for all frames in each video to capture global extravasation and extravascular transport dynamics. Relative changes in fluorescence intensity were assumed to be proportional to changes in NP concentrations.
Note that where fluorescence background intensity is high (eg, as for mouse #2), the pattern of intensity increase in the diffusing NP still follows that expected for intravascular transport and extravascular diffusion across a barrier. These dynamics are typically characterized by a rapid influx to the intravascular region (observed in both local and global ROIs) followed immediately by increases in extravascular ROIs adjacent to intravascular ROIs and subsequently for iROIs (in local ROI analysis only) that are further still from the iROI where NP influx was initially tracked.
Selection of local ROIs
The topology of the tumor microenvironment, characterized by a high density of blood vessels in three-dimensional space, presents a challenge for the quantitative analysis of intratumoral dynamics and biodistribution. Quantification of NP extravasation is especially challenging because of the multidirectional superposed regions of influx of NPs into the tumor interstitial region. A number of IVM studies have approached fluorescence quantification of intratumoral NP dynamics selecting ROIs through 2D and 3D image segmentations (eg, thresholding) of features including blood vessels, cancer cells, and tumor-associated macrophages,37–39 NP counts in intra- and extravascular regions42 and by selecting specific ROIs34 or intensity profiles37,40 within image frames. With ROIs defined as such, these investigators have studied tumor intravascular dynamics, extravasation, and interstitial and intracellular accumulation of NPs. However, error in the quantification of NP transport kinetics and accumulation may arise from factors including tissue autofluorescence, movement of vascular structures between image frames, and extraneous NP fluorescence in ROIs. Such extraneous fluorescence may arise from the fluorescence of neighboring blood vessels in adjacent optical planes, as well as extravasation may arise from blood vessels that have not been properly taken into account.
In this study, fullerene extravasation dynamics were assessed in local micron-scale ROIs through the selection of iROI and eROI adjacent pairs. Extravascular transport was monitored further away from the vasculature by the creation of contiguous eROIs extending at perpendicular distances to the iROI. Therefore, for the evaluation of extravasation from a particular blood vessel segment (defined by an iROI) free of fluorescence from other sources (as discussed), iROI/eROIs pairs were selected in regions that appeared clear of any extraneous fluorescence for the duration of each video.
Selection of ROIs is further constrained by limitations of the confocal imaging region when surfaces are curved, uneven, and/or non-level under high numerical aperture (NA) giving a very thin depth of field or optical slice. Many IVM studies use a window chamber in the animal, which sandwiches tissue between two plates keeping it flat, but this artificially constrains tumor growth. In this study, exposed subcutaneous tumor was imaged free of a window chamber, and thus, certain regions present a curved surface. In this case, the optical section is smaller than the full FOV because tumor tissue extending too far above the imaging plane toward the objective lens prevents imaging in that region, while the tumor surface on the opposite side falls away from the imaging plane.43 For a curved tumor surface, fluorescence in the optical slice exists within a curved region. If ROIs stray out of this region, reduction in fluorescence intensity will contain artifact. ROIs in this study were selected to minimize such artifacts.
Local ROI analysis and avoidance of movement artifacts
To study the dynamics of extravasation, localized ROIs were selected to avoid imaging artifacts and distribution across connected tumor regions, both within blood vessels at the scale of vessel dimensions, and extravascularly with incrementally increasing distance perpendicular to specific C60-serPF-permeable vessels. The spatially localized data sets obtained from these ROIs permit approximation of the type of transport occurring in various biological compartments. Extensive heterogeneity of tumor tissue across animals, tumors, and even within the same tumor can make valid comparisons between experiment and control samples challenging to obtain. This method of selection of local ROIs enables the analysis of regions over time relative to earlier time points and, thus, avoids the problems of incorrectly comparing NP kinetics across morphologically variable structures that may interact differently with the NPs. Furthermore, we are free to choose regions that will avoid or minimize optical artifacts, making the most of the strengths of confocal microscopy in localizing regions in three-dimensional space while minimizing its limitations, such as by avoiding regions in the FOV where light cannot penetrate due to an uneven tissue surface.43
Because local ROIs are static, a small amount of error occurred where blood vessels briefly moved in and out of the focal plane or translated slightly in the X and Y directions. This was minor overall for the ROIs selected, and eROIs were trimmed to avoid contamination of eROI by extraneous blood vessel fluorescence in cases where blood vessels not directly involved in the measurements moved into eROIs. Vessel diameter was determined based on blood vessel perfusion with FITC–dextran, assuming a negligible amount extravasated within the timeframe imaged (2 min).
Global ROI analysis
A global thresholding algorithm was developed to segment C60-serPF fluorescence in the IVM images into two regions, the intravascular region, defined by fluorescence in the FITC channel, and the extravascular region, the inverse of the former region, to quantify NP extravasation. NIS-Elements software was used to produce the mask of the vasculature, which was then superimposed on a second mask created from C60-serPF fluorescence in the Cy5 channel of the same image FOV. The threshold of C60-serPF fluorescence was calculated from a single frame in the image sequence shortly after the appearance of C60ser-PF fluorescence in the image FOV. This threshold was then applied to C60-serPF fluorescence in each frame of the entire image sequence to create the C60-serPF mask. We had found that voxels of intensity values present at high frequency throughout an image tended to be noise or artifact, as could be demonstrated by visual inspection. Therefore, threshold selection criteria for C60-serPF were based on finding a minimum intensity value with a low enough frequency (low number of voxels) in the image to contain useful information.
Having defined masks representing both the intravascular and extravascular space, as well as the region occupied by C60-serPF, these masks were applied to measure C60-serPF mean intensities in the intravascular and extravascular compartments (the global iROI and the global eROI) respectively over the course of an image sequence. To establish a baseline at zero for each of the graphs produced, the minimum intensity across the entire time interval was taken as background and subtracted from each of the points in both ROIs for all images in the series.
Results
Physicochemical characterization of C60-ser
As a basis for understanding the aqueous-phase behavior of C60-ser, its physicochemical properties were characterized in terms of aggregate morphology (by SEM), aggregate size distribution (by DLS), and zeta potential, a measure of surface charge. With a solubility in water exceeding 250 mg/mL, C60-ser is an amphipathic molecule composed of a hydrophobic [60]fullerene core derivatized with six hydrophilic malonodiserinolamide chains bearing a total of 24 hyroxyls (Figure 1A). Due to this special amphipathic geometry, C60-ser aggregates in aqueous solutions in shell-like arrangements. Figure 1 shows aggregates of C60-ser in SEM, where lyophilization (flash freezing and drying) of C60-ser has preserved its aqueous-phase aggregate morphology. Hollow shells ranging from ~100 nm to several microns in diameter are shown in Figure 1B at 15,000× magnification. Arrows indicate transparency and breakage of the shells (due to rapid escape of water under high vacuum conditions during lyophilization), revealing that shell thickness is likely on the order of a monolayer of C60-ser molecules. Figure 1C and D shows SEM images at 1,000,000× magnification elucidating grains in the structure of the shells believed to be single C60-ser molecules with sizes corresponding closely to its hydrodynamic diameter of ~3 nm.
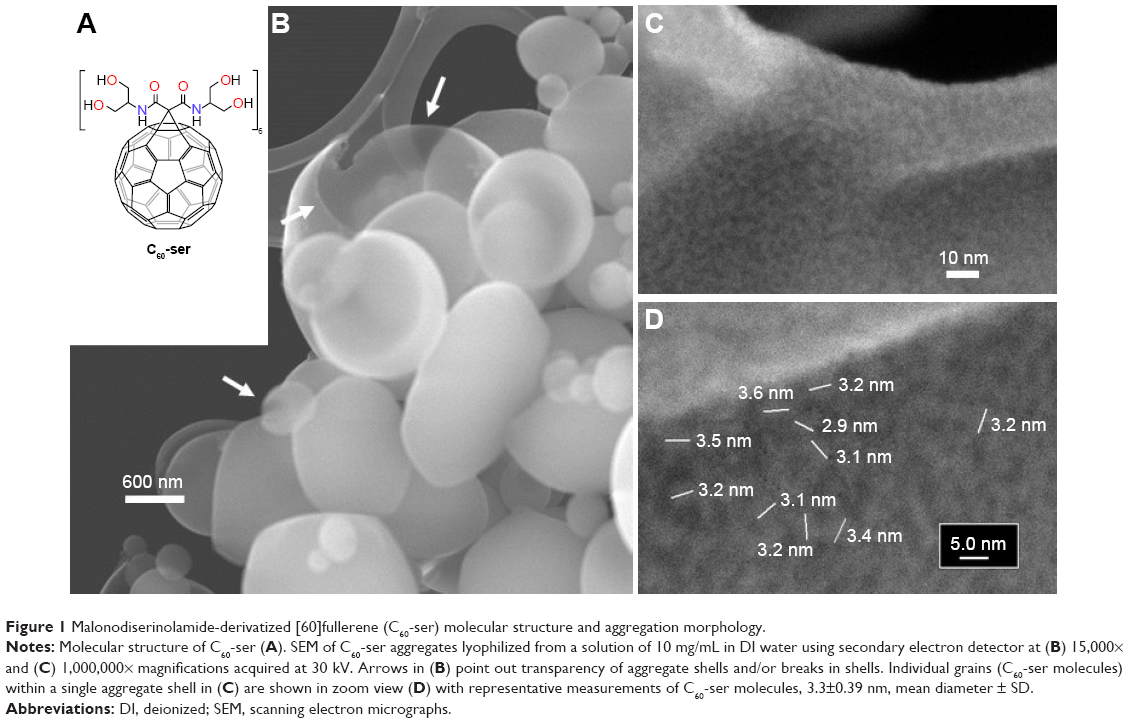 | Figure 1 Malonodiserinolamide-derivatized [60]fullerene (C60-ser) molecular structure and aggregation morphology. |
DLS measurements performed on a Malvern Zetasizer Nano illustrate the dynamics of particle size distributions of C60-ser aggregates and C60-ser single molecules dissolved in either DIW or phosphate-buffered saline (PBS) at pH 7.2. In Figure 2, particle size distribution is plotted against time beginning immediately after dissolution of C60-ser powder at various concentrations. Based on the limitations of DLS to accurately size particles <20 nm in diameter,44 particles in this size range are taken to be single C60-ser molecules and particles above this size range are taken to be aggregates. In DIW at the concentrations of 0.5, 1, and 10 mg/mL (top row of Figure 2), aggregates had already formed within the earliest possible reading at ~2.5 min after dissolution from dry powder and these aggregates stayed within a constant size range for the duration of the experiment. The median aggregate size was observed to be ~100–200 nm. At 0.5 and 1.0 mg/mL, a small percentage of single C60-ser molecules coexisted with aggregates, while at 10 mg/mL, no single molecules were detected. A small percentage of larger C60-ser aggregates, several microns in size, are also observed in the DLS graphs.
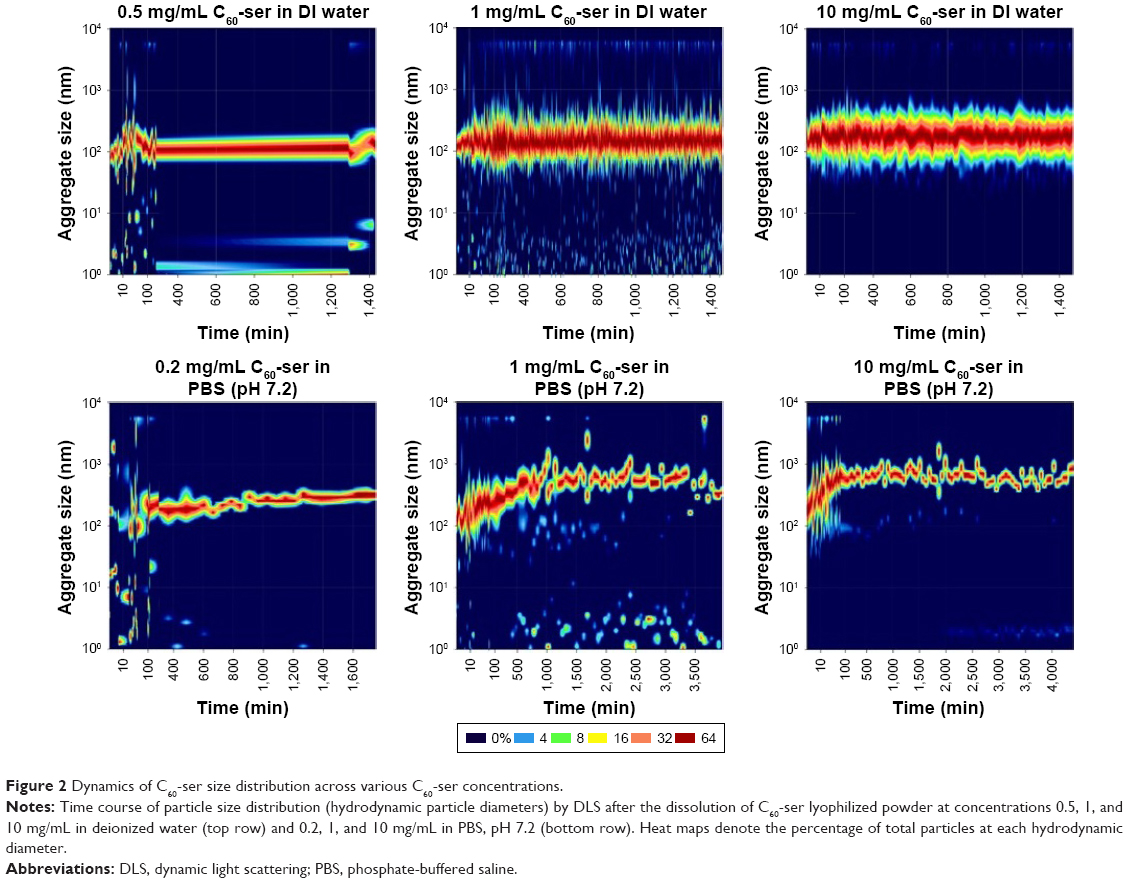 | Figure 2 Dynamics of C60-ser size distribution across various C60-ser concentrations. |
In contrast, in PBS (bottom row of Figure 2), aggregate behavior differed somewhat from that in deionize water. The graphs show that after the first several hours, C60-ser aggregates increased in size by several hundred nanometers and subsequently stabilized, with a narrowing of the size range and reaching dynamic equilibrium with a small percentage of single C60-ser molecules (1 and 10 mg/mL; Figure 2) or no free C60-ser molecules (at 0.2 mg/mL in PBS).
Figure 3 shows dynamics of zeta potential of C60-ser over time at concentrations 0.05, 1, and 10 mg/mL after dissolution in DIW. Initially, at all concentrations of C60-ser, zeta potential distributions were centered near −50 mV. At lower concentrations (0.05 and 1 mg/mL), the distribution of zeta potentials was initially unstable and then stabilized over several hours. At the very low concentration of 0.05 mg/mL (near the lower limit of Zetasizer readings), the zeta potential drifted toward neutral and eventually stabilized near ~−25 mV. At 1 mg/mL, the zeta potential drifted more subtly toward neutral, stabilizing ~−30 mV, while at the high concentration of 10 mg/mL, the zeta potential stayed relatively constant between approximately −40 and −60 mV. Zeta potential can be taken as a measure of surface charge, with these negative readings suggesting that the C60-ser aggregates carry a negative surface charge in DIW.
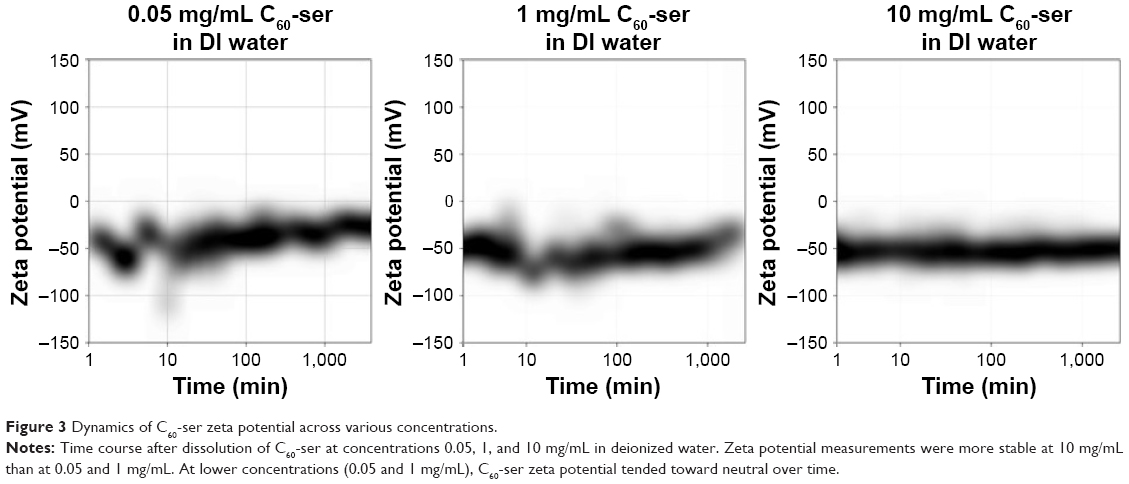 | Figure 3 Dynamics of C60-ser zeta potential across various concentrations. |
Intratumoral vascular, extravasation, and extravascular transport kinetics of C60-serPF in vivo
In Figure 4, a time series of confocal images shows vascular delivery and extravasation of C60-serPF to tumor microvasculature of mouse #1 at 10 s intervals, with the first frame 10 s after coinjection of FITC-conjugated dextran (FITC–dextran) and C60-serPF. Fluorescence images from each channel are shown together in false color (top series) and separately in FITC (FITC–dextran, middle series) and Cy5 channels (bottom series). At 10 s postinjection, both particles are imaged entering an arteriole (top left of all images) followed by filling of the capillary bed 30–50 s postinjection. From 30 to 50 s postinjection, C60-serPF extravasates and diffuses through the interstitial region. This extravasation is evident in the top panel series, where false color red (C60-serPF fluorescence) bleeds out through the false color yellow capillaries (colocalization of red and green dyes). Of interest, at ~30 s postinjection, additional vessels appear in the video (such as those directly below the large diameter blood vessel at the upper left of the images), with a greater relative fluorescence intensity of FITC to Cy5 compared to that of vessels appearing in the first pass at ~10 s postinjection. Both the delay in perfusion of certain tumor blood vessels and differences in relative fluorescence intensities of FITC–dextran and C60-serPF in these blood vessels are analyzed in the following sections (Figure 8). Imaging proceeded for 2 min postinjection.
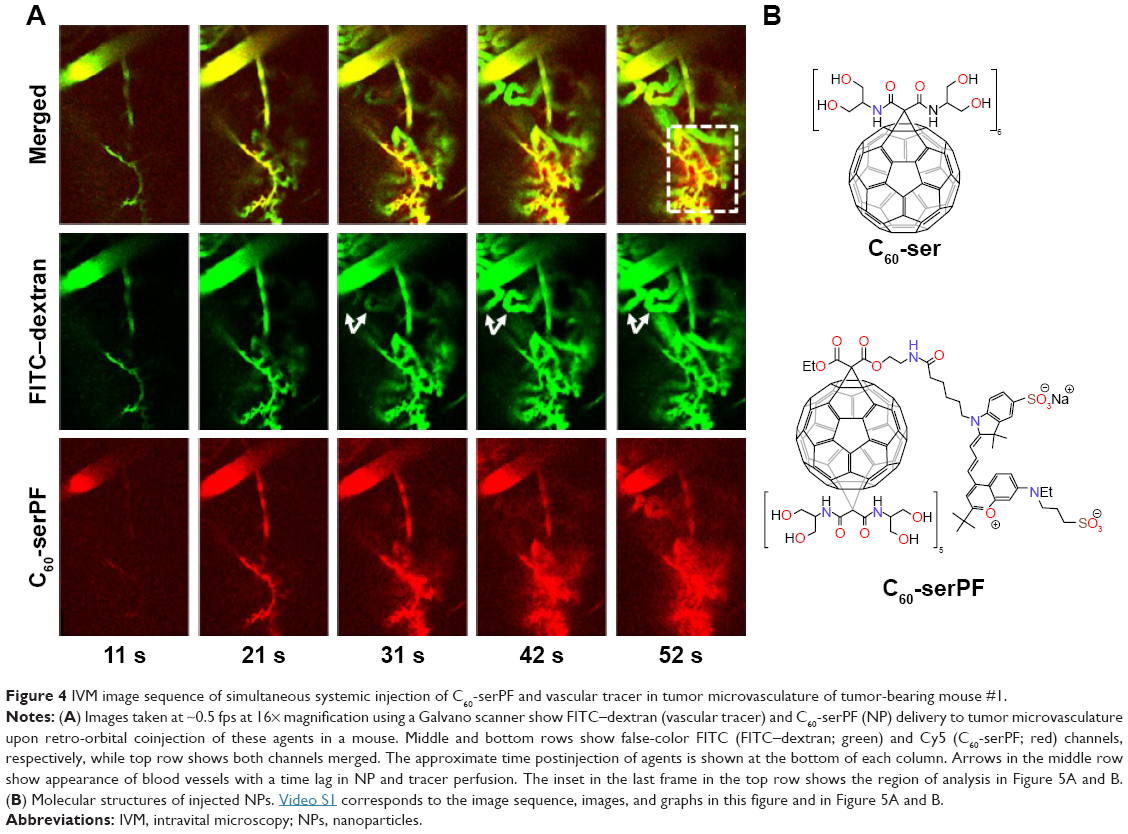 | Figure 4 IVM image sequence of simultaneous systemic injection of C60-serPF and vascular tracer in tumor microvasculature of tumor-bearing mouse #1. |
To quantify extravasation and transport kinetics of C60-serPF in the tumor interstitium, mean fluorescence intensity (assumed proportional to dye concentration) was measured in ROIs within microvasculature (iROIs) and immediate surrounding extravascular regions (eROIs) in the focal plane (Figure 5). In Figure 5A, ROI-1 is an iROI in an 11 μm diameter capillary and ROIs 2–4 are similarly sized eROIs at successively increasing perpendicular distances from the capillary wall. The graph of fluorescence intensity of C60-serPF in the Cy5 channel versus time (bottom of Figure 5B) shows that shortly after bolus injection (t=0), the fluorescence intensity of ROI-1 in mouse #1 underwent a pulse increase from background level, while eROIs with increasing distance from the vasculature underwent successively gradual increases in intensity. Due to preset laser power and gain settings, saturation of the fluorescence signal occurred in both Cy5 and FITC channels intravascularly in certain regions, although not in the eROIs.
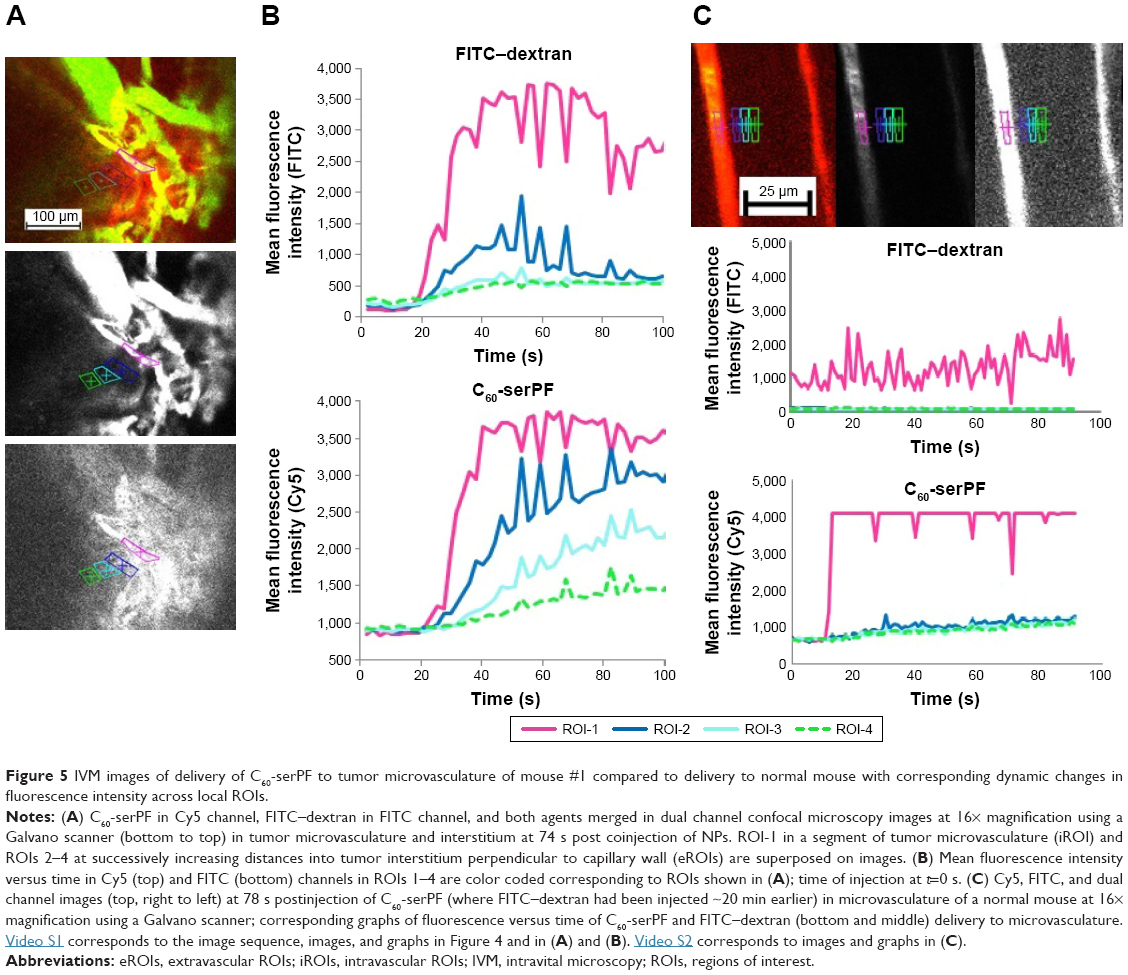 | Figure 5 IVM images of delivery of C60-serPF to tumor microvasculature of mouse #1 compared to delivery to normal mouse with corresponding dynamic changes in fluorescence intensity across local ROIs. |
Intravascular signal saturation occurred in ROI-1 (Figure 5A of mouse #1 and RO1-1 of Figure 5C in the subcutaneous microvasculature of a normal mouse). Imaging in the FITC channel across the same ROIs as in the Cy5 channel serves as an important internal control for C60-serPF extravasation, as there is a comparatively negligible extravasation of FITC–dextran. While confocal microscopy has the distinct advantage over epifluorescence microscopy of fluorescence imaging in a single well-defined plane, fluorescence from adjacent parallel planes is excluded only by a pinhole at the detector and some light leakage (visible in the imaging plane) can occur. In this figure (graph at top of Figure 5B and corresponding to the image in the middle of Figure 5A), a similar pulse of FITC–dextran fluorescence intensity is observed in ROI-1 in the capillary vessel, but the dynamics of fluorescence intensity in eROIs 2–4 do not follow the same smooth pattern as that of C60-serPF in the Cy5 channel ROIs. A moderate amount of fluorescence in the FITC channel within these ROIs may be due to the perfusion of capillaries near the imaging plane as well as some small amount of extravasation. Since the capillary bed of a tumor is extremely tortuous and dense, it is often impossible to completely avoid fluorescence from nearby out-of-plane vessels. However, comparison of changes in fluorescence between FITC and Cy5 channels in extravascular regions suggests that there is likely only a minimal contribution of out-of-plane fluorescence to the fluorescence intensity of C60-ser extravasation.
Tumor vascular permeability was also assessed in comparison to C60-serPF permeability in normal vasculature. Figure 5C shows images and corresponding graphs of changes in fluorescence intensity in corresponding iROIs and eROIs in the subcutaneous vasculature and tissue of a normal mouse. Normal vasculature is far less dense and more organized than tumor vasculature, and therefore, it is not difficult to select ROIs that avoid the overlap of fluorescence from the proximity of other vessels either within or across focal planes. Upon injection of C60-serPF after preinjection of FITC–dextran, minimal fluorescence increase is observed in the Cy5 channel compared with that in previous figures, indicating that substantially less extravasation of C60-serPF occurs from normal vasculature.
To avoid intravascular signal saturation so that intravascular dynamics of C60-ser delivery could be observed, in a second experiment (Figure 6, a different animal), high voltage (HV) gain and laser power were reduced to avoid saturation upon C60-serPF bolus injection. In ROI-1 in Figure 6 where intravascular fluorescence intensity did not saturate, a decrease in Cy5 channel fluorescence begins immediately after the bolus pulse delivery of C60-serPF to blood vessels in mouse #2. Observation of these kinetics was likely blocked by signal saturation in the previous experiment. With fluorescence intensity in adjacent extravascular regions increasing with a similar trend to those in the previous experiment, fluorescence intensity of C60-serPF across iROIs and eROIs nearly equalizes after ~1 min. In this run, in the FITC channel for the same ROIs, differences from Cy5 channel kinetics were even more salient. After bolus pulse increase in the iROI (ROI-1), FITC–dextran fluorescence intensity did not dissipate over the time period sampled. There was also negligible fluorescence intensity increase above background in FITC channel eROIs and less than in the previous run.
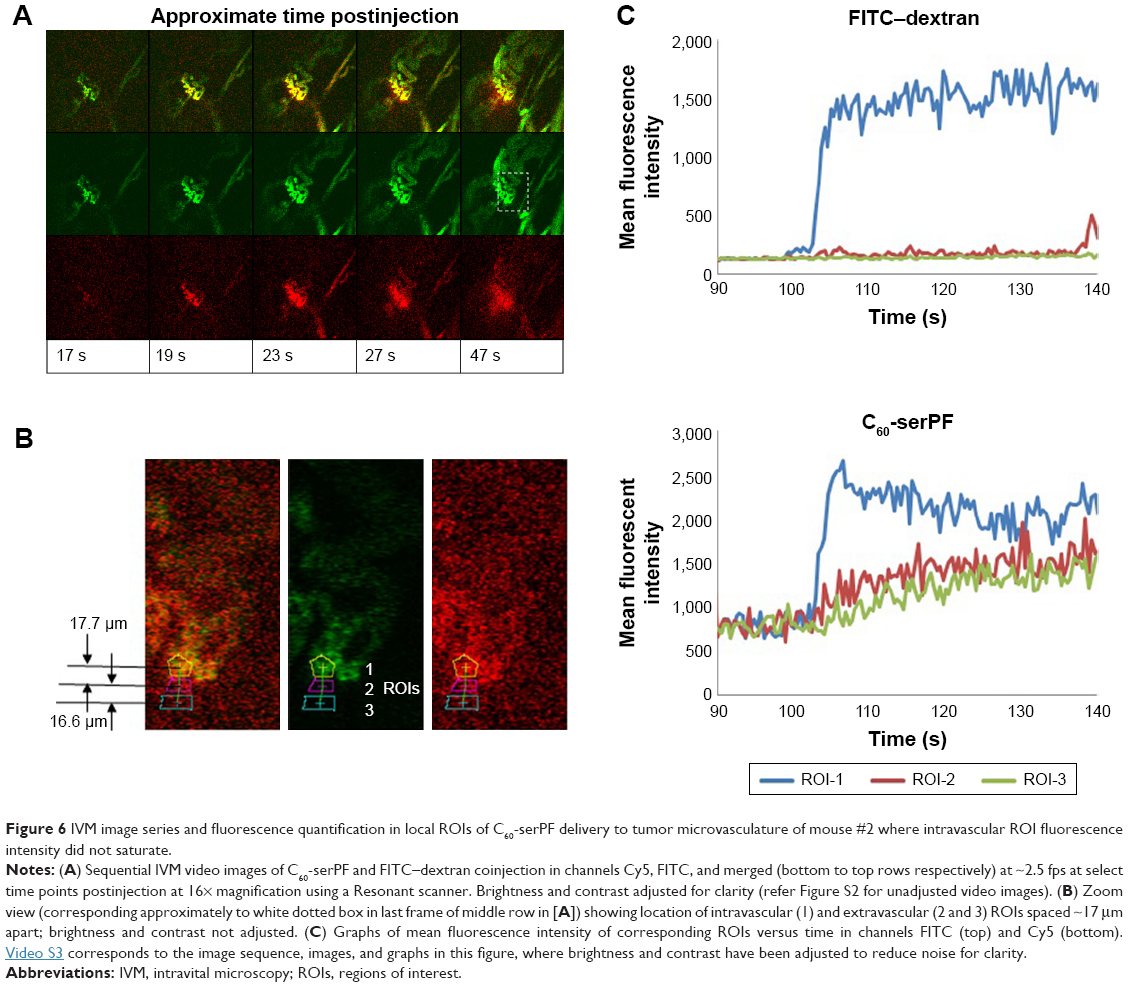 | Figure 6 IVM image series and fluorescence quantification in local ROIs of C60-serPF delivery to tumor microvasculature of mouse #2 where intravascular ROI fluorescence intensity did not saturate. |
Global image ROI analysis
A global ROI analysis across the entire FOV of all images in the imaging series of the two tumor-bearing mice and one normal mouse was conducted to validate the data acquired in the local ROI analysis, extending the analysis to a substantially larger imaged region (Figure 7). Only the kinetics of the C60-serPF was tracked during the global ROI analysis as the local analysis sufficiently displayed the reliability of FITC–dextran as a vascular tracer. The measurements acquired using the NIS-Elements software were used to plot mean fluorescence intensity versus time for the global ROIs for each of the three image sets. Mean fluorescence intensity was selected as it is proportional to the concentration of C60ser-PF within the z-slice of the FOV.
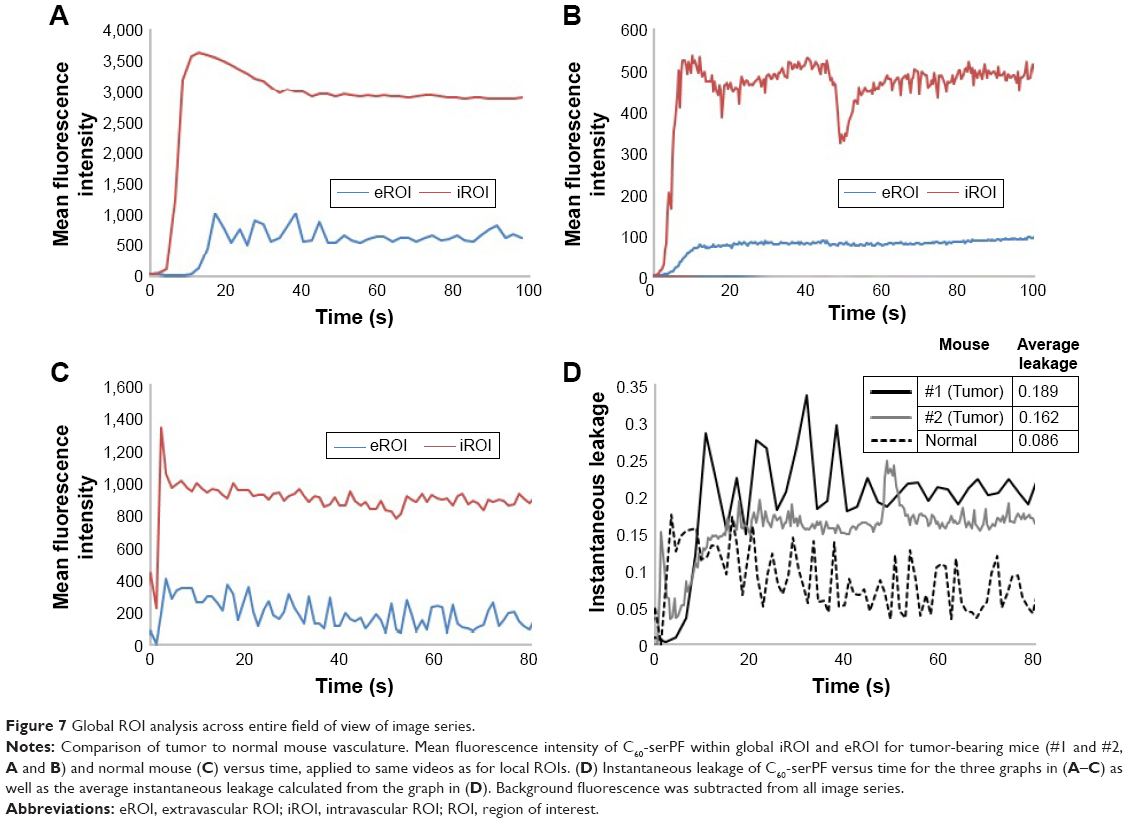 | Figure 7 Global ROI analysis across entire field of view of image series. |
For mouse #1, the first ~10 s recorded in the global ROIs displayed a rapid rise in the amount of C60-serPF present within the vasculature until reaching a maximum mean fluorescence intensity following 12.8 s of imaging. Mean fluorescence intensity of the global iROI then decayed steadily until reaching a steady state following ~40 s of imaging. A notable increase in the mean fluorescence intensity of C60-serPF in the extravascular region lagged behind that of the intravascular C60-serPF, following 10.6 s of imaging before oscillating about a maximum value and eventually converging upon a steady state following 55.3 s of imaging. The sharpest increase in the mean fluorescence intensity within the extravascular region corresponds to the decline in mean fluorescence intensity in the intravascular region.
Mouse #2 displayed similar initial dynamics with a rapid increase in the mean fluorescence intensity of the intravascular C60-serPF in the first 10 s of imaging reaching a steady state following ~60 s of imaging. Similar to mouse #1, the increase in the mean fluorescence intensity of extravascular C60-serPF lags behind that of intravascular C60-serPF.
For the normal mouse, there was a sudden spike in the mean fluorescence intensity for C60-serPF in both the intravascular and extravascular regions followed by a decline in both. Changes in the mean fluorescence intensity in the extravascular region appear to have paralleled those within the vasculature. Most notably, there was not a lag time prior to the quick increase in extravascular C60-serPF mean fluorescence intensity.
The dimensionless quantity “instantaneous leakage” was defined to provide an instant-to-instant comparison over time of the amount of the NP contained in each global ROI. As mean fluorescence intensity is proportional to NP concentration, instantaneous leakage provides a sample of the local biodistribution of extravasated NP relative to the amount in the vasculature at a given time within the FOV. Instantaneous leakage, L(t), was computed as the ratio of the mean intensity within the area occupied by the NP in the global eROI, Ie(t), to the mean intensity within the area occupied by the NP in the global iROI, Ii(t), at each instant in time in the image series. Background subtracted mean intensities were used. The higher the value of L(t), the greater the NP fluorescence within the eROI compared to the iROI. At any value >1, the mean fluorescence intensity of C60-serPF in the extravascular region exceeds that of the intravascular region:
|
|

Times were aligned to t=0 for each mouse based on the frame in which C60-serPF fluorescence first appeared, allowing for a direct comparison of the instantaneous leakage of C60-serPF for each mouse. Statistical outliers for mouse #1 and mouse #2 were removed from Figure 7. Furthermore, these values were not included in determining the average leakage as presented in the table within Figure 7. After the first several seconds of NP transport, the instantaneous leakage for the tumor vasculature of the tumor-bearing mice was greater than that of the normal vasculature of the normal mouse. Furthermore, as time progressed, the instantaneous leakage for mouse #1 and mouse #2 increased. This trend has implications for drug delivery over time in this model system, namely that C60-serPF extravasated more from tumor vasculature than from the selected type of normal vasculature. The table in Figure 7D solidifies this point, showing that the average of the instantaneous leakage across time for each mouse is substantially more in tumor compared with normal vasculature. The average leakage of C60-serPF from the vasculature of mouse #1 was 2.2 times greater than from the vasculature of the normal mouse, while the average leakage from the vasculature of mouse #2 was 1.9 times greater than from the normal mouse.
Intravascular dynamics
Returning to IVM imaging series of the first animal (Figures 4 and 5), additional information about drug delivery dynamics can be gleaned from changes in intravascular fluorescence where extensive extravasation is not evident. Additionally, certain blood vessels (highlighted by white arrows in Figure 4) appear in the FOV at various time points lagging behind the initial bolus delivery of C60-serPF and FITC–dextran, indicating spatial and temporal heterogeneity in the delivery of these NPs to the tumor. Figure 8 follows the dynamics of select iROIs over time from Figure 4 (Video S1) where no noticeable extravasation through blood vessel walls was observed. To assess changes in fluorescence intensity in these ROIs, regions of fluorescence intensity saturation within the imaged FOV were avoided. The ROIs selected (Figure 8A) included one interior to an arteriole (diameter =~100 μm) and two other ROIs in tumor blood vessels to which FITC–dextran and C60-serPF were delivered in succession lagging 20–30 s. Figure 8B tracks the dynamics of mean fluorescence intensity in each of these ROIs in both FITC and Cy5 channels.
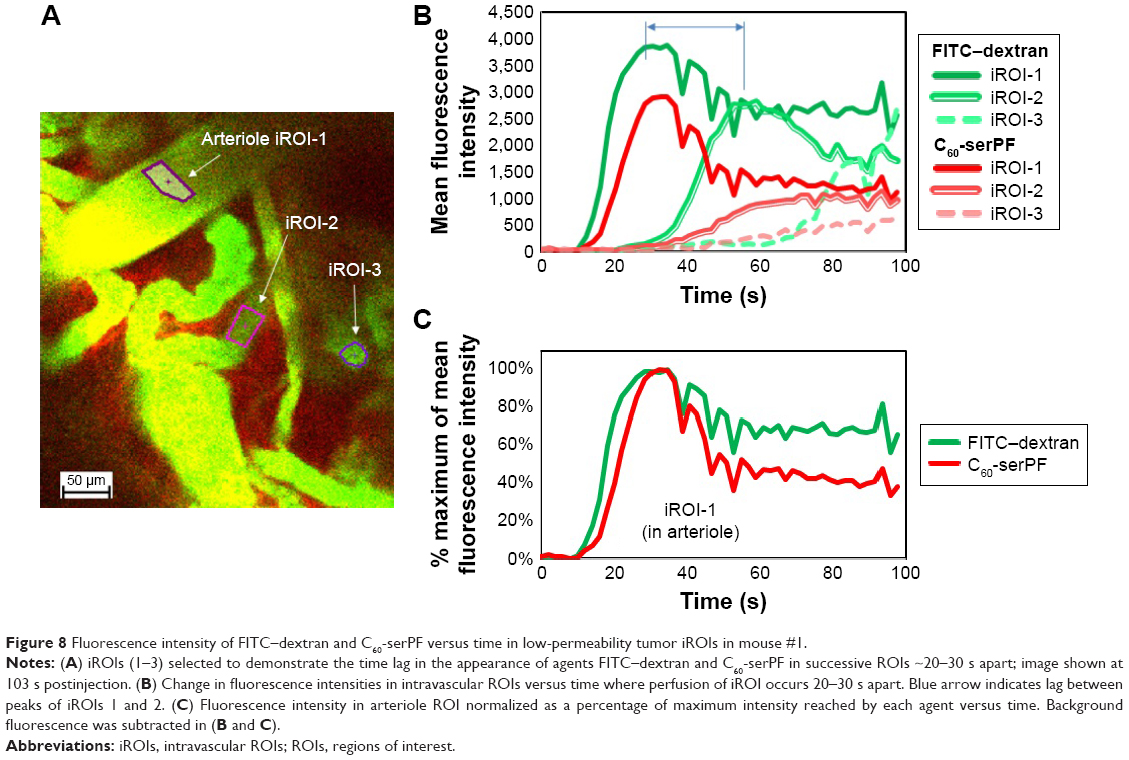 | Figure 8 Fluorescence intensity of FITC–dextran and C60-serPF versus time in low-permeability tumor iROIs in mouse #1. |
To quantify relative changes in the concentration of C60-serPF compared with FITC -dextran in each of the selected ROIs in Figure 8A and C shows the relative fluointensities of C60-serPF and FITC -dextran as a percentage of their respective maximum intensities within the same ROI over time. By normalizing fluorescence intensities to their own maximum values within a single ROI, dyes in different channels (FTIC and Cy5) can be compared directly. Since blood flow carries new dye continuously across the FOV, photobleaching is minimized. Note that in the first (arteriole) ROI, after initial bolus increase brings both FITC-dextran and C60-serPF to their respective maximum values, by 100 s postinjection, C60-serPF dropped to ~40% of its maximum value, while FITC -dextran reduced to ~70% of its maximum. As shown in Figure 8B, C60-serPF displays different dynamics in the second and third vessels. In both cases, there is a steady rise in fluorescence, although each is diminished in intensity compared to other vessels coming into view earlier in Video S1.
Discussion
Physicochemical characterization of C60-ser
Water soluble [60]fullerene derivatives, with outer-to-inner hydrophilic-to-hydrophobic structure, exhibit differential physicochemical behavior versus amphiphilic molecules with other geometries and form larger aggregates believed to result from the strongly hydrophobic fullerene core.45 Fullerene aggregate diameters have been reported with an average hydrodynamic diameter ranging from 120 to 145 nm7 in accordance with the DLS data in our study; however, the dynamic nature of aggregate formation had not been emphasized. In addition to concentration dependence, aggregation behavior of water-soluble fullerenes has been observed to be pH4 and salt concentration46 dependent. Based on the physicochemical behavior of water-soluble fullerenes in the physiological regime, aggregation phenomena may play a role in the behavior of water-soluble fullerenes when introduced to biological systems.4
The wide range and dynamic variability in C60-ser aggregate sizes observed in our study may have implications for its intratumoral bioactivity and bioavailability. The enhanced permeation and retention (EPR) effect occurs for NPs between ~10 and 100 nm in diameter, where the upper bound is due to the removal of large NPs from circulation by the MPS (limiting NP access to the tumor) and the lower bound is required to hinder transport of NPs that have been delivered to the tumor from returning to circulation.47,48 The DLS data in Figure 2 show that the broad range of C60-ser sizes observed within the first hour of its dissolution in PBS at various concentrations includes some percentage within the EPR regime (<100 nm), and therefore, some aggregates may undergo the EPR effect intratumorally. Dynamic equilibrium between aggregates and single C60-ser molecules may also have implications for bioavailability. For example, disaggregation of water-soluble fullerenes may contribute to the bioavailability of C60-ser and its potential drug payload at the cellular and subcellular levels and possibly offer an explanation for cellular uptake of C60-ser aggregates, such as observed previously.21,25
Intratumoral extravasation and extravascular transport dynamics of C60-serPF
While NP vascular delivery, extravasation and changes in intravascular and extravascular NP concentration have been quantified over various time scales from minutes31,34,39 to days35 using time lapse imaging, this article presents time lapse imaging with continuous quantification of NP extravasation on a second-to-second timescale in select and global ROIs, representing water-soluble fullerene derivative biotransport dynamics. At the tumor periphery, where IVM imaging has captured these transport dynamics, convective forces play a role in microvascular delivery,32 while both convection and diffusion contribute to extravascular transport. Trends in ROI fluorescence versus time observed in the quantification of IVM time lapse images suggest that convective transport dominates during initial intravascular delivery. Both molecular agents (FITC–dextran and C60-serPF in FITC and Cy5 channels, respectively) exhibit a pulse increase in fluorescence intensity occurring in local and global iROIs shortly after bolus intravenous injection of C60-serPF and FITC–dextran in both tumor-bearing and normal mice (Figures 5B and C and 6C). In contrast, in the tumor-bearing mice (Figures 5B and 6C), fluorescence intensity curves for C60-serPF in the local eROIs have substantially gentler slopes that become progressively gentler with increasing perpendicular distance from the local iROI, indicating diffusive transport.49 These findings are consistent with previous assertions that due to high interstitial fluidic pressure in tumors, interstitial NP transport is diffusive overall.32 Global eROIs (Figure 7) do not appear to consistently elucidate these dynamics. This difference between local and global dynamics is likely due to the inclusion of nonextravasating blood vessels present in the FOV in global ROI calculations.
Variability in tumor characteristics including size, shape, and tissue density along with imaging variability due to tumor positioning under the objective lens and penetration of fluorescence through tissue to the microscope may lead to the unpredictability of optimal data collection settings including laser power and gain (experiential observations). Suboptimal imaging settings can result in the loss of information due to signal saturation at one extreme and low signal-to-noise ratio at the other. In Figure 5A and C, while saturation of intravascular C60-serPF fluorescence intensity upon bolus delivery limits information on intravascular kinetics, extravascular kinetic information was preserved, since the intensity of extravasated fluorescent C60ser-PF fell within the dynamic range.
Given the limitations on confocal microscopy in terms of imaging unlevel surfaces and limited penetration depth, precise quantitative analysis of NP and molecular transport in the tumor microenvironment can be especially challenging due to dense and heterogeneous vasculature and ECM. The vascular tracer, FITC–dextran, therefore, serves as an important internal control in this analysis in the following respects: 1) on a short timescale, it delineates iROIs from eROIs and 2) in cases where fluorescence in eROIs occurs in the FITC channel possibly due to small amounts of FITC–dextran extravasation or light leakage from perfusion of blood vessels in adjacent optical planes, its dynamic behavior was observed to be qualitatively different than that of C60-serPF. For example, in the FITC channel of tumor-bearing mice (Figures 5A and B and 6), relative to iROI fluorescence intensity in each respective channel, the fluorescence intensity of FITC–dextran in the eROIs in the FITC channel is far less than that of C60-serPF in the Cy5 channel in these experiments.
Differential extravasation between tumor and normal microvasculature
While extravasation clearly occurs in the tumor microenvironments shown in Figures 6A and 8 with extravascular intensities nearly reaching that of the iROI, negligible extravasation of C60-serPF was observed in the imaged normal vasculature of the mouse with no tumor (Figure 6C) upon injection of C60-serPF at a concentration equal or greater than given to the tumor-bearing mice. While intravascular fluorescence intensity saturation of C60-serPF did occur in the imaged normal vasculature, this saturation could only have amplified eROI fluorescence intensities due to extravasation. Differential extravasation between tumor and normal microvasculature could have important implications for C60-ser as a drug delivery agent. The differential extravasation observed in this study between tumor and one type of non-tumor tissue microvasculature suggests that this methodology could help determine the extent of extravasation within tumor versus normal tissues. While further studies with additional normal tissue types are needed for this determination, the permeability of tumor microvasculature is generally higher than that of normal tissues.32,50 As NP shape,34 size,39 and both vascular and NP surface charges,51 and hydrophilicity36,52 are well-established contributors to NP extravasation, differential extravasation of C60-serPF between normal microvasculature and tumor microvasculature is likely to be highly dependent on the physicochemical characteristics of C60-serPF. Differential dosing of C60-serPF to organs and tumor has been observed previously.21
Implications of global ROI analysis
Overall, trends in the dynamics displayed in the global ROI analyses of the two tumor and one normal mouse C60-serPF delivery videos were in agreement with those of the local ROI analyses. Furthermore, within the global analyses, the IVM data for tumor-bearing mouse #2 show a similar filling of the vessels as seen in tumor-bearing mouse #1, accounting for the similar spike in the presence of intravascular C60-serPF, followed by a delay in the mass transfer of the NP into the extravascular region. The rapid increase in the extravasation becomes muted once the mean fluorescence intensity reaches a steady state, reducing to a slight trickle after steady state is reached. Hence, the driving force for the mass transfer of C60-serPF across the endothelium (the concentration gradient between the two ROIs) was greatest in the first few seconds of imaging.
A comparison of the individual graphs of mean fluorescence intensity versus time for mice #1 and #2 reveals that C60-serPF dynamics were governed by similar kinetics across tumor microvasculature. Kinetics is notably different however between tumor and normal microvasculature. The instantaneous and average leakage parameters serve to characterize these differences. For both tumor-bearing mice, the average leakage of the NP through tumor microvasculature was approximately twice as high as that of the normal mouse vessels. Examination of the profile of instantaneous leakage over time revealed that the amount of NP in the global eROI relative to that in the global iROI increased with time for both tumor-bearing mice #1 and #2. In contrast, the instantaneous leakage for the vasculature of the normal mouse diminished as time progressed. Based on both local and global ROI analyses, extravasation of C60-serPF more readily from the tumor microvasculature tested in this study could support its use as a drug delivery agent in terms of minimizing side effects resulting from undesirable extravasation. However, given the diversity of permeabilities of the multiple types of normal vasculature encountered in systemic NP delivery, it would be necessary to repeat this study with a number of other types of normal vasculature to confirm such a drug delivery benefit of this NP. If such an effect is confirmed, since the tumor microenvironment appears to retain C60-serPF, its attachment to anticancer drugs may preferentially target tumor over normal tissue.
Time-resolved fluorescence intensity data elucidate tumor intravascular transport dynamics and clearance
Further information about tumor intravascular NP dynamics can be gained from the analysis of nonleaking blood vessels. In iROIs where direct extravasation of NPs through vessel walls is not evident, intravascular NP dynamics can be tracked over time. In the arteriole ROI in Figure 8, pulse increases in the fluorescence of both FITC–dextran and C60-serPF are followed by monotonic decrease, in agreement with similar trends observed in other IVM studies of tumor microenvironments.38,39,53 In rough agreement with Dreher et al (2006), C60-serPF was cleared from tumor vasculature faster than the larger FITC–dextran. Upon reaching peak intensity within the arteriole iROI, C60-serPF fluorescence decreased to 50% maximum within ~18 s, whereas FTIC-Dextran intensity dropped to only ~70% maximum within 60 s (Figure 8B and C). Dreher et al (2006) circulation half-lives of 3.3 and 70 kDa dextrans were 4 and 20 min, respectively.39 However, these times are ~12 times and ~9 times slower than the respective clearance times in our study. It is not clear from Dreher et al (2006) whether these plasma clearance rates were measured from tumor or normal vasculature, which may account for the difference in clearance rates. In our study, extravasation of C60-serPF and FITC–dextran through leaky vessels may have contributed to the faster clearance rates, although substantial FITC–dextran extravasation was not observed. Whether or not C60-serPF aggregates in vivo in the blood and in what size distribution could also be a factor if large aggregates were cleared by the MPS, although these questions remain unanswered. If the study by Dreher et al measured tumor vascular permeability as well, the departure from our study may simply reflect tumor to tumor variation.
The appearance of fluorescence in two additional iROIs in Figure 8A each lag the arteriole ROI by ~21 and ~30 s, respectively. These time lags within different vessels may demonstrate temporal heterogeneity in intravenous NP delivery to the tumor. Furthermore, the longer the time past the original bolus NP delivery, the less intense the maximum fluorescence of both C60-serPF and FITC–dextran. This observation suggests that the later NP or drug is delivered via microvasculature to a region of the tumor, the lower the concentration reaching that region. An alternate explanation is that these iROIs may be in blood vessel segments that fill sequentially, such that the filling of early segments may be on the arterial side and late ones on the venous side. The lower C60-serPF concentrations observed in late filling segments may thus be those on the venous side, after extravasation of C60-serPF through tumor capillaries. However, as the systemic circulation time of mice is reported to be as fast as 7–8 times per minute54 (and approximately the same under anesthesia55) it is possible that the molecular agents in the time-lagging tumor blood vessels had already undergone 2–3 rounds of circulation and partial clearance, which may support the former explanation.
Although clearance may play a role in fluorescence decrease, relative intensities in the lagging ROIs may reflect the role of extravasation and possible early evidence of EPR. In the iROI perfused second to the arteriole ROI, the intensity of FITC–dextran was 70% of FITC arteriole ROI maximum intensity, whereas the corresponding C60-serPF peak intensity dropped to 34% of the arteriole iROI value. Extravasation and EPR of C60-serPF in the tumor microenvironment may indeed account for this difference. However, since the pharmacokinetic significance of drug and NP EPR is most relevant over hours to days, further study will be necessary to determine whether an EPR effect of fullerenes is observable on those timescales.
Conclusion
In this study, we have imaged in real-time and quantified the intravascular, extravasation, and extravascular biokinetics of a water-soluble [60]fullerene derivative in the tumor microenvironment. We have further shown that C60-serPF extravasates rapidly and to a great extent in tumor vasculature, while substantially less in normal vasculature over the timescales measured. Through further analysis of (2.87 kDa) C60-serPF intratumoral intravascular dynamics compared to a 70 kDa FITC–dextran tracer (serving as a control), we have shown that blood clearance of C60-serPF may not be explained by renal clearance alone. New methods developed for both local microvascular region and global image analyses were found to be in general agreement in their respective quantification of the biokinetics of C60-serPF. These findings provide an indication of the degree of local tumor vascular permeability to NPs in this size range.
Acknowledgments
JMN acknowledges support from T32 training grant in translational biology (2T32GM088129) from the National Institute of General Medical Sciences. The authors at Rice University thank the Welch Foundation (Grant C-0627, LJW) for the support of this work. The authors would like to thank Mr Muto Atsushi of Hitachi High Technologies (Clarksburg, MD, USA) for his assistance in collecting the SEM images, as well as Dr Merlyn Pulikkathara of Baylor College of Medicine (Houston, TX, USA) for her skill in manipulation of the SEM images to provide measurements of individual fullerene NPs.
Disclosure
The authors report no conflicts of interest in this work.
References
Kroto HW, Heath JR, O’Brien SC, Curl RF, Smalley RE. C60: buckminsterfullerene. Nature. 1985;318:162–163. | ||
Krätschmer W, Lamb LD, Fostiropoulos K, Huffman DR. Solid C60: a new form of carbon. Nature. 1990;347:354–358. | ||
Wharton T, Wilson LJ. Highly-iodinated fullerene as a contrast agent for X-ray imaging. Bioorg Med Chem. 2002;10(11):3545–3554. | ||
Sitharaman B, Bolskar RD, Rusakova I, Wilson LJ. Gd@C60 [C(COOH)2]10 and Gd@C60(OH)x: nanoscale aggregation studies of two metallofullerene MRI contrast agents in aqueous solution. Nano Lett. 2004;4:2373–2378. | ||
Rašović I. Water-soluble fullerenes for medical applications. Mater Sci Technol. 2016;44:1–18. | ||
Lalwani G, Sitharaman B. Multifunctional fullerene- and metallofullerene-based nanobiomaterials. Nano Life. 2013;3:1342003. | ||
Zakharian TY, Seryshev A, Sitharaman B, Gilbert BE, Knight V, Wilson LJ. A fullerene – paclitaxel chemotherapeutic: synthesis, characterization, and study of biological activity in tissue culture. J Am Chem Soc. 2005;127(36):12508–12509. | ||
Mackeyev Y, Raoof M, Cisneros B, et al. Toward paclitaxel-[60]Fullerene immunoconjugates as a targeted prodrug against cancer. Nanosyst Phy Chem Math. 2014;5:67–75. | ||
Panchuk RR, Prylutska SV, Chumakl VV, et al. Application of C60 fullerene-doxorubicin complex for tumor cell treatment in vitro and in vivo. J Biomed Nanotechnol. 2015;11:1139–1152. | ||
Joshi M, Kumar P, Kumar R, et al. Aminated carbon-based “cargo vehicles” for improved delivery of methotrexate to breast cancer cells. Mater Sci Eng C Mater Biol Appl. 2017;75:1376–1388. | ||
Prylutska SV, Skivka LM, Didenko GV, et al. C60 fullerene enhances cisplatin anticancer activity and overcomes tumor cell drug resistance. Nano Res. 2017;10:652–671. | ||
Prylutska SV, Skivka LM, Didenko GV, et al. Complex of C60 fullerene with doxorubicin as a promising agent in antitumor therapy. Nanoscale Res Lett. 2015;10(1):499. | ||
Samanta PN, Das KK. Noncovalent interaction assisted fullerene for the transportation of some brain anticancer drugs: a theoretical study. J Mol Graph Model. 2017;72:187–200. | ||
Dugan LL, Turetsky DM, Du C, et al. Carboxyfullerenes as neuroprotective agents. Proc Natl Acad Sci U S A. 1997;94(17):9434–9439. | ||
Lu T, Kao P, Lee C, Huang S, Lin C. C60 fullerene nanoparticle prevents β-amyloid peptide induced cytotoxicity in neuro 2A cells. J Food Drug Anal. 2011;19:151–158. | ||
Prylutska SV, Burlaka AP, Matyshevska OP, et al. Effect of the visible light irradiation of fullerene-containing composites on the ROS generation and the viability of tumor cells. Exp Oncol. 2006;28(2):160–162. | ||
Davydenko MO, Radchenko EO, Yashchuk VM, et al. Sensibilization of fullerene C60 immobilized at silica nanoparticles for cancer photodynamic therapy. J Mol Liq. 2006;127:145–147. | ||
Scharff P, Ritter U, Matyshevska OP, et al. Therapeutic reactive oxygen generation. Tumori. 2008;94:278–283. | ||
Sayes CM, Fortner JD, Guo W, et al. The differential cytotoxicity of water-soluble fullerenes. Nano Lett. 2004;4:1881–1887. | ||
Foley S, Crowley C, Smaihi M, et al. Cellular localisation of a water-soluble fullerene derivative. Biochem Biophys Res Commun. 2002;294:116–119. | ||
Raoof M, Mackevey Y, Cheney MA, Wilson LJ, Curley SA. Internalization of C60 fullerenes into cancer cells with accumulation in the nucleus via the nuclear pore complex. Biomaterials. 2012;33(10):2952–2960. | ||
Prylutska S, Bilyy R, Overchuk M, et al. Water-soluble pristine fullerenes C60 increase the specific conductivity and capacity of lipid model membrane and form the channels in cellular plasma membrane. J Biomed Nanotechnol. 2012;8(3):522–527. | ||
Prylutskyy Y, Bychko A, Sokolova V, et al. Interaction of C60 fullerene complexed to doxorubicin with model bilipid membranes and its uptake by HeLa cells. Mater Sci Eng C. 2016;59:398–403. | ||
Misra C, Thotakura N, Kumar R, et al. Improved cellular uptake, enhanced efficacy and promising pharmacokinetic profile of docetaxel employing glycine-tethered C60-fullerenes. Mater Sci Eng C. 2017;76:501–508. | ||
Huang F, Mackeyev Y, Watson E, Cheney MA, Wilson LJ, Suh J. Evidence for nuclear internalisation of biocompatible [60]fullerene. Eur J Nanomed. 2013;5:51–55. | ||
Prylutska SV, Matyshevska OP, Golub AA, et al. Study of C60 fullerenes and C60-containing composites cytotoxicity in vitro. Mater Sci Eng C. 2007;27:1121–1124. | ||
Tolkachov M, Sokolova V, Loza K, et al. Study of biocompatibility effect of nanocarbon particles on various cell types in vitro. Materwiss Werksttech. 2016;47:216–221. | ||
Boltalina OV, Abdul-Sada AK, Taylor R. Hyperfluorination of [60]fullerene by krypton difluoride. J Chem Soc Perkin Trans. 1995;2:981–985. | ||
Kim M, Gillies RJ, Rejniak KA. Current advances in mathematical modeling of anti-cancer drug penetration into tumor tissues. Front Oncol. 2013;3:1–10. | ||
Hak S, Reitan NK, Haraldseth O, De Lange Davies C. Intravital microscopy in window chambers: a unique tool to study tumor angiogenesis and delivery of nanoparticles. Angiogenesis. 2010;13(2):113–130. | ||
Tozer GM, Ameer-Beg SM, Baker J, et al. Intravital imaging of tumour vascular networks using multi-photon fluorescence microscopy. Adv Drug Deliv Rev. 2005;57(1):135–152. | ||
Jain R. Delivery of molecular and cellular medicine to solid tumors. Adv Drug Deliv Rev. 2012;64(suppl):353–365. | ||
Jain RK. Understanding barriers to drug delivery: high resolution in vivo imaging is key. (Editorial). Clin Cancer Res. 1999;5:1605–1606. | ||
Smith BR, Kempen P, Bouley D, et al. Shape matters: intravital microscopy reveals surprising geometrical dependence for nanoparticles in tumor models of extravasation. Nano Lett. 2013;18:1199–1216. | ||
Smith BR, Zavaleta C, Rosenberg J, et al. High-resolution, serial intravital microscopic imaging of nanoparticle delivery and targeting in a small animal tumor model. Nano Today. 2013;8. doi:10.1016/j.nantod.2013.02.004. | ||
Cheng SH, Li FC, Souris JS, et al. Visualizing dynamics of sub-hepatic distribution of nanoparticles using intravital multiphoton fluorescence microscopy. ACS Nano. 2012;6(5):4122–4131. | ||
Thurber GM, Yang KS, Reiner T, et al. Single-cell and subcellular pharmacokinetic imaging allows insight into drug action in vivo. Nat Commun. 2013;4:1504. | ||
Miller MA, Gadde S, Pfirschke C, et al. Predicting therapeutic nanomedicine efficacy using a companion magnetic resonance imaging nanoparticle. Sci Transl Med. 2015;7(314):314ra183. | ||
Dreher MR, Liu W, Michelich CR, Dewhirst MW, Yuan F, Chilkoti A. Tumor vascular permeability, accumulation, and penetration of macromolecular drug carriers. J Natl Cancer Inst. 2006;98(5):335–344. | ||
Tong L, He W, Zhang Y, Zheng W, Cheng J-X. Visualizing systemic clearance and cellular level biodistribution of gold nanorods by intrinsic two-photon luminescence. Langmuir. 2009;25(21):12454–12459. | ||
Wharton T, Kini VU, Mortis RA, Wilson LJ. New non-ionic, highly water-soluble derivatives of C60 designed for biological compatibility. Tetrahedron Lett. 2001;42:5159–5162. | ||
van de Ven AL, Wu M, Lowengrub J, et al. Integrated intravital microscopy and mathematical modeling to optimize nanotherapeutics delivery to tumors. AIP Adv. 2012;2(1):11208. | ||
Pawley JB. Handbook of Biological Confocal Microscopy. Handbook of Biological Confocal Microscopy. Berlin: Springer; 2006. | ||
Berne BJ, Pecora R. Dynamic Light Scattering. With Applications to Chemstriy, Biology, and Physics. Hoboken, NJ: Wiley-Interscience; 1976. | ||
Song T, Dai S, Tam K, Lee S, Goh S. Aggregation behavior of two-arm fullerene-containing poly(ethylene oxide). Polymer (Guildf). 2003;44:2529–2536. | ||
Laus S, Sitharaman B, Tóth E, et al. Destroying gadofullerene aggregates by salt addition in aqueous solution of Gd@C60(OH)x and Gd@C60[C(COOH 2)]10. J Am Chem Soc. 2005;127(26):9368–9369. | ||
Petros RA, DeSimone JM. Strategies in the design of nanoparticles for therapeutic applications. Nat Rev Drug Discov. 2010;9(8):615–627. | ||
Nie S. Understanding and overcoming major barriers in cancer nanomedicine (Editorial). Nanomedicine. 2010;5(4):523–528. | ||
Hunter RJ. Introduction to Modern Colloid Science. Oxford: Oxford University Press; 1993. | ||
Nagy JA, Benjamin L, Zeng H, Dvorak AM, Dvorak HF. Vascular permeability, vascular hyperpermeability and angiogenesis. Angiogenesis. 2008;11(2):109–119. | ||
Dellian M, Yuan F, Trubetskoy VS, Torchilin VP, Jain RK. Vascular permeability in a human tumour xenograft: molecular charge dependence. Br J Cancer. 2000;82:1513–1518. | ||
Yuan F, Dellian M, Fukumura D, et al. Vascular permeability in a human tumor xenograft: molecular size dependence and cutoff size advances in brief vascular permeability in a human tumor xenograft: molecular size dependence and cutoff size1. Cancer Res. 1995;55:3752–3756. | ||
Pearce ML, Lewis AE, Kaplan MR. The Factors Influencing Circulation Time. Circulation. 1952;5:583–588. | ||
Janssen B, Debets J, Leenders P, Smits J. Chronic measurement of cardiac output in conscious mice. Am J Physiol Regul Integr Comp Physiol. 2002;282(3):R928–R935. | ||
Kreissl MC, Wu HM, Stout DB, et al. Noninvasive measurement of cardiovascular function in mice with high-temporal-resolution small-animal PET. J Nucl Med. 2006;47(6):974–980. |
Supplementary materials
Materials and methods
HPLC analysis of C60-serPF, PF dye and HeLa cell homogenate
Separation chromatography of C60-serPF was performed using Waters Acquity UPLC I class system (Milford, MA, USA) comprising a quaternary solvent manager, equipped with flow through needle autosampler, fluorescence detector and column manager using two Acquity BEH C18 Columns, consecutively connected, 130 Å, 1.7 μm, 3.0×100 mm column with an BEH C18 1.7 μm VanGuard pre-column (2.1×5 mm) and Waters fractions collector III. The columns were re-equilibrated with initial conditions for 5 min. Columns temperature was maintained at 30°C. Excitation of fluorescence detector was set at 630 nm, emission recorded at 666 nm. Mobile phase compositions: A = ammonium formate/formic acid buffer at 0.015 M with pH =3.8, B = methanol, C = acetonitrile, D = acetic acid/acetonitrile at 1:9 ratio. Gradients were applied linearly as follows: 0 min – 99% A, 1% D at 0.25 mL/min; 2 min – 90% A, 9% B, 1% D at 0.25 mL/min; 14 min – 65% A, 25% B, 9% C, 1% D at 0.2 mL/min; 21 min – 90% B, 9% C, 1% D at 0.15 mL/min; 24 min – 99% A, 1% D at 0.2 mL/min. The maximum flow-rate error was ±2% over the gradient range.
Exposure of HeLa cells to C60-serPF and preparation of homogenate for HPLC
HeLa cervical cancer cells (ATCC, Manassas, VA, USA) were incubated with C60-serPF (at 1 mg/mL, in PBS) for 24 h using 96-well plate. On the following day the cells (~106) were pelleted, washed twice in phosphate-buffered saline, and suspended in 2 mL of 1% Triton X-100 in glass vial, homogenized by repeated uptake into a pipette tip and then sonicated using bath sonicator for 20 min. After centrifugation at 10,000× g for 20 min at RT, the supernatant was subjected to 0.05 mm filtration using 0.05 mm Anotop 10 Plus syringe filter (Sigma-Aldrich, St Louis, MO, USA), and resulting filtrate analyzed by HPLC.
Results
In Figure S2, Panel A, the HPLC separation chromatogram C60-serPF shows only one group of bands between 7 and 8 min retention time. The slight difference in retention times is due to the presence of hexakis-substituted [60]fullerene, (of the expected C60-serPF structure) and a small admixture of pentakis-adduct. Further chromatographic separation of these two almost identical [60]fullerene derivatives is difficult. The C60-serPF product consists of 90%±2.0% of hexakis-adduct, 6%±2.0% of pentakis-adduct, subtracting out ~4% water due to C60-ser hygroscopicity.
Figure S2, Panel B shows the HPLC chromatogram of the free PF dye, with a single band and a retention time nearly double that of C60-serPF. The absence of this band in Panel A, demonstrates that the PF dye, which is covalently bound to the fullerene does not detach from the fullerene, nor is it present after purification of the conjugate. To demonstrate that C60-serPF does not undergo hydrolysis by cell cytoplasm, HeLa cervical cancer cells were incubated with C60-serPF (at 1 mg/mL in PBS) for 24 h using 96-well plate. The next day the cells (106 in average) were pelleted, homogenized, and the resulting filtrate analyzed by HPLC, Figure S2, Panel C. The chromatogram of C60-serPF extracted from cells shows the same band positions as the original C60-serPF with no band present from the PF dye. Additionally, C60-serPF has been tested in 0.1 M and 1 M acetic acid solutions, and porcine liver esterase (Sigma-Aldrich) in 0.1 M phosphate buffer (pH 6.8) with the same result in each case.
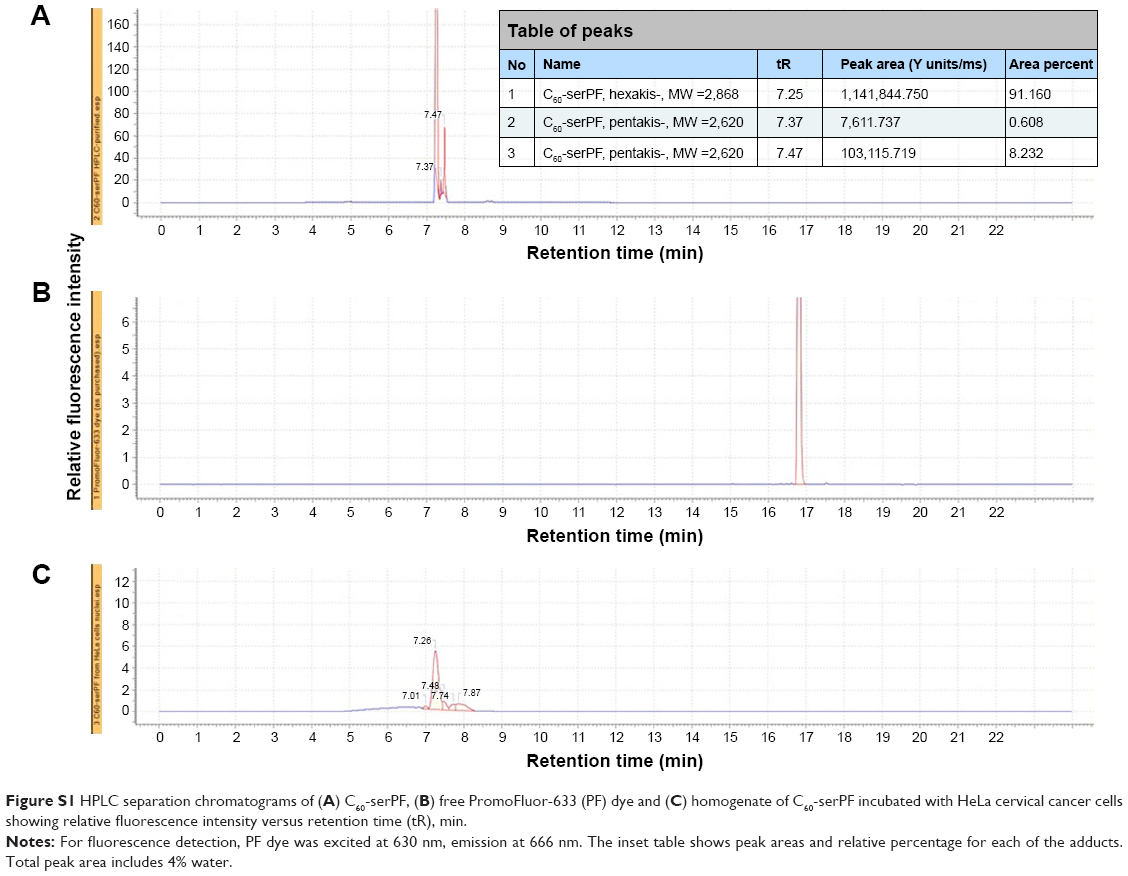 | Figure S1 HPLC separation chromatograms of (A) C60-serPF, (B) free PromoFluor-633 (PF) dye and (C) homogenate of C60-serPF incubated with HeLa cervical cancer cells showing relative fluorescence intensity versus retention time (tR), min. |
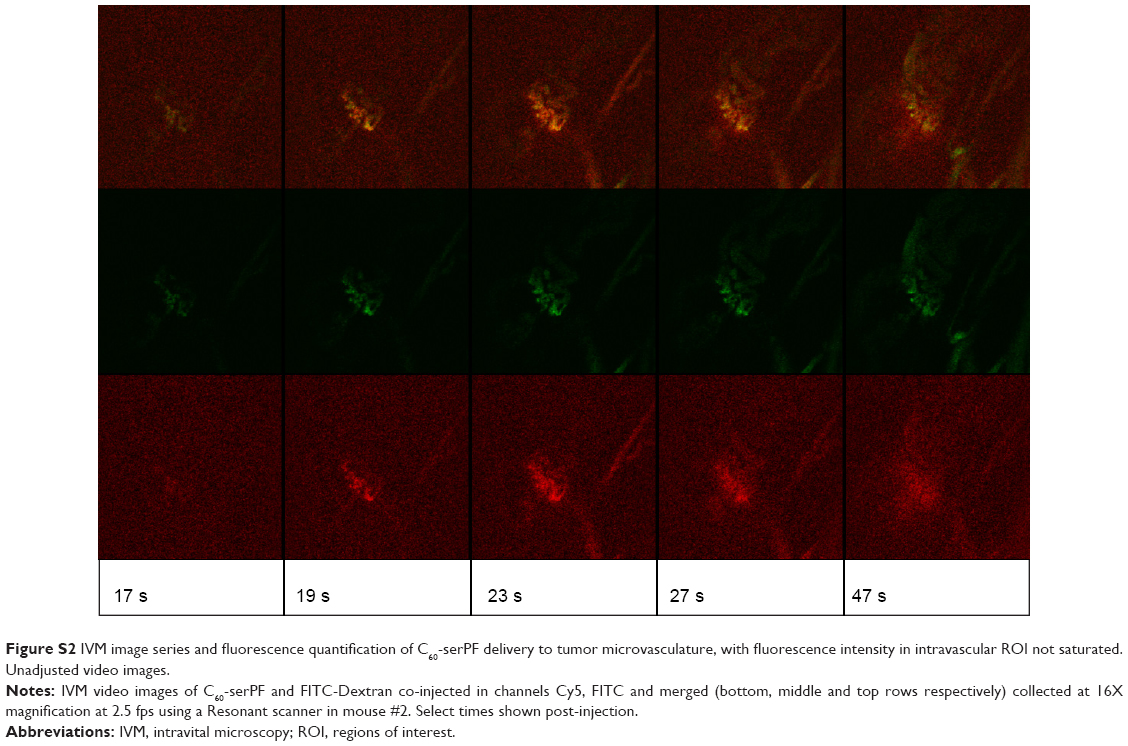 | Figure S2 IVM image series and fluorescence quantification of C60-serPF delivery to tumor microvasculature, with fluorescence intensity in intravascular ROI not saturated. Unadjusted video images. |
 © 2017 The Author(s). This work is published and licensed by Dove Medical Press Limited. The full terms of this license are available at https://www.dovepress.com/terms.php and incorporate the Creative Commons Attribution - Non Commercial (unported, v3.0) License.
By accessing the work you hereby accept the Terms. Non-commercial uses of the work are permitted without any further permission from Dove Medical Press Limited, provided the work is properly attributed. For permission for commercial use of this work, please see paragraphs 4.2 and 5 of our Terms.
© 2017 The Author(s). This work is published and licensed by Dove Medical Press Limited. The full terms of this license are available at https://www.dovepress.com/terms.php and incorporate the Creative Commons Attribution - Non Commercial (unported, v3.0) License.
By accessing the work you hereby accept the Terms. Non-commercial uses of the work are permitted without any further permission from Dove Medical Press Limited, provided the work is properly attributed. For permission for commercial use of this work, please see paragraphs 4.2 and 5 of our Terms.