")
Back to Journals » International Journal of Nanomedicine » Volume 17
Biosynthetic Gas Vesicles Combined with Focused Ultrasound for Blood–Brain Barrier Opening
Authors Zhang J, Yan F, Zhang W, He L , Li Y, Zheng S, Wang Y, Yu T, Du L, Shen Y, He W
Received 25 May 2022
Accepted for publication 24 November 2022
Published 28 December 2022 Volume 2022:17 Pages 6759—6772
DOI https://doi.org/10.2147/IJN.S374039
Checked for plagiarism Yes
Review by Single anonymous peer review
Peer reviewer comments 2
Editor who approved publication: Dr Mian Wang
Jinghan Zhang,1 Fei Yan,2 Wei Zhang,1 Lei He,1 Yi Li,3 Shuai Zheng,1 Yuanyuan Wang,4 Tengfei Yu,1 Lijuan Du,1 Yuanyuan Shen,5 Wen He1
1Department of Ultrasound, Beijing Tiantan Hospital, Capital Medical University, Beijing, People’s Republic of China; 2Center for Cell and Gene Circuit Design, CAS Key Laboratory of Quantitative Engineering Biology, Shenzhen Institute of Synthetic Biology, Shenzhen Institutes of Advanced Technology, Chinese Academy of Sciences, Shenzhen, People’s Republic of China; 3Department of Radiology, Peking Union Medical College Hospital, Beijing, People’s Republic of China; 4Department of Ultrasound, The Second Hospital of Hebei Medical University, Shijiazhuang, People’s Republic of China; 5National-Regional Key Technology Engineering Laboratory for Medical Ultrasound, School of Bio Medical Engineering, Health Science Center, Shenzhen University, Shenzhen, People’s Republic of China
Correspondence: Yuanyuan Shen; Wen He, Email [email protected]; [email protected]
Background: Focused ultrasound (FUS) combined with microbubbles (MBs) has emerged as a potential approach for opening the blood–brain barrier (BBB) for delivering drugs into the brain. However, MBs range in size of microns and thus can hardly extravasate into the brain parenchyma. Recently, growing attention has been paid to gas vesicles (GVs), which are genetically encoded gas-filled nanostructures with protein shells, due to their potential for extravascular targeting in ultrasound imaging and therapy. However, the use of GVs as agents for BBB opening has not yet been investigated.
Methods: In this study, GVs were extracted and purified from Halobacterium NRC-1. Ultrasound imaging performance of GVs was assessed in vitro and in vivo. Then, FUS/GVs-mediated BBB opening for small molecular Evans blue or large molecular liposome delivery across the BBB was examined.
Results: The results showed a good contrast performance of GVs for brain perfusion ultrasound imaging in vivo. At the acoustic negative pressure of 1.5 MPa, FUS/GVs opened the BBB safely, and effectively enhanced Evans blue and 200-nm liposome delivery into the brain parenchyma.
Conclusion: Our study suggests that biosynthetic GVs hold great potential to serve as local BBB-opening agents in the development of new targeted drug delivery strategies for central nervous system disorders.
Keywords: gas vesicles, blood–brain barrier, focused ultrasound, drug delivery, nanoparticles
Introduction
The blood–brain barrier (BBB) plays a vital role in maintaining the homeostasis of the central nervous system (CNS) by protecting brain tissue from pathogens and toxic substances from the blood.1,2 However, it also limits the ability of all large-molecule therapeutics and over 98% of small-molecule drugs to reach the brain.3 Consequently, it is important to tackle the efficient administration of drugs into the brain without affecting the normal structure and function of BBB.
Extensive preclinical and clinical studies have demonstrated the outstanding capability of focused ultrasound combined with systemically circulating microbubbles (FUS/MBs) to enhance macromolecular delivery to the brain across BBB temporarily, noninvasively, and reversibly.4–11 This approach has tremendous potential for enhancing the delivery of chemotherapeutic drugs,4–6 antibodies,6,7 genes,8,9 and cells.10,11 However, MBs range in size of microns and thus can hardly extravasate into the extravascular compartment, leading to limitations in potential therapeutic applications.12,13 Recently, there has been growing attention paid to agents with smaller sizes to extend FUS-mediated applications beyond that of the larger MB counterparts. Gas vesicles (GVs) are nanoscale biconical cylinders with a width of 45–250 nm and a length of 100–600 nm,14 and they are formed by some prokaryotic cells in lakes and oceans to regulate their buoyancy for harvesting light. Structurally, they have a thin (~2 nm) protein shell that is hydrophobic on the inner surface and hydrophilic on the outer surface.14–17 This special structure allows GVs to exclude water but to make gas exchange through the protein shell, endowing them with robust physical stability.14,18
An increasing number of studies have shown that GVs may be an acoustic contrast agent with great potential for ultrasound imaging and therapeutic applications.14,16,18,20–24 The submicron size of GVs considerably expands their potential range to extravascular and intracellular targets.19 Aside from being a reporter for in vitro and in vivo ultrasound imaging,16,18,19 it has been shown that GVs may promote gene transfection20 and may be used as cavitation nuclei for tumor sonodynamic therapy21 as well as photodynamic therapy.21,22 Conspicuously, the latest studies have extended the application of GVs in the CNS, including brain functional imaging23 and ultrasound neuromodulation.24 However, to the best of our knowledge, there has been so far no report of any investigation on FUS combined with nanoscale GVs (FUS/GVs) to open the BBB. Halo-bacterium NRC-1 (Halo) is a type of archaeophage which could produce bubbles inside the body. Referring to previous studies, the GVs obtained from Halo have stable properties, harmonic properties, and cavitation effects.7,8 Thus, GVs from Halo were used in this study.
To investigate the effect of FUS/GVs on BBB disruption, GVs from Halobacterium NRC-1 (Halo) were first extracted and purified in this study. The ultrasound imaging performance of GVs was assessed in vitro and in vivo. Then, FUS/GVs-mediated BBB opening was evaluated, and the effect on liposome delivery across the BBB was examined.
Material and Methods
Materials
Halobacterium NRC-1 (Halo) was purchased from ATCC (Manassas, VA, USA). Sodium chloride (NaCl) and diluted hydrochloric acid (HCl) were obtained from Lingfeng (Shanghai, China). Tryptone, yeast extract, magnesium sulfate heptahydrate (MgSO4∙7H2O), copper sulfate pentahydrate (CuSO4∙5H2O), magnesium chloride (MgCl2), and calcium chloride (CaCl2) were purchased from Aladdin (Shanghai, China). Trisodium citrate, sulfuric acid ferrous ammonium ((NH4)2Fe(SO4)2∙6H2O), potassium chloride (KCl), manganese sulfate (MnSO4∙H2O), zinc sulfate heptahydrate (ZnSO4∙7H2O), and Tris were purchased from Sigma-Aldrich (St. Louis, MO, USA). Phosphate-buffered saline (PBS) was purchased from Hyclone (Logan, UT, USA). CCK-8 assay kit was purchased from Beyotime Biotechnology (Shanghai, China). Cholesterol, 1,2-dipalmitoyl-sn-glycero-3-phosphocholine (DPPC), and 1,2-distearoyl-sn-glycero-3-phosphoethanolamine-N-(methoxy (polyethylene glycol)-2000) (DSPE-PEG2000) were obtained from Avanti (Birmingham, AL, USA). Indocyanine green was purchased from Ruixi Biotechnology (Xi’an, China).
Animals
Male C57BL6J mice (8–10 weeks old, 22–25 g, Beijing Weitong Lihua Laboratory Animal Base) were used. The mice were maintained under specific pathogen-free laboratory conditions (relatively constant temperature of 23–25°C, humidity of 55% ± 5%, and 12 h light/dark cycle) with food and water available ad libitum. The above breeding conditions were strictly in accordance with the national standards of the People’s Republic of China (Laboratory animal—Requirements of environment and housing facilities [GB 14925–2010]) to ensure the survival and welfare of experimental animals.
All animal experiments were performed in strict accordance with the national standards of the People’s Republic of China (Laboratory animal—Guideline for ethical review of animal welfare [GB/T 35892–2018]; Guideline of assessment for humane endpoints in animal experiment [GB/T 173–2018]). The animal care and experiments were approved by the Animal Care and Use Committee of the Experimental Animal Center at Beijing Tiantan Hospital, Capital Medical University (Approval No. 202,102,002).
Bacterial Culture and GV Extraction
Carolina growth medium for Halo and TMC lysis buffer (10 mM Tris-HCl, 2.5 mM MgCl2, 2 mM CaCl2, and pH 7.5) for Halo GVs were prepared mainly as previously described by Shapiro et al25 with improvement in the cultivation method and extraction process. Briefly, Erlenmeyer flasks containing Halo and medium were placed in a constant temperature shaker for 7–10 days (37°C, 220 rpm) for bacterial culturing. Then, the medium was separated into the following three layers: the viscous pink upper layer containing bubble-containing bacteria with more GVs, the pink middle layer containing bacteria with fewer GVs, and the bottom turbid yellow layer with dead bacteria. The viscous upper floating layer (approximately 15–25 mL) containing a large number of bacteria was collected into a 50-mL centrifuge tube. After full mixing with the same amount of the TMC lysis solution, the tube was centrifuged at a low speed (4°C, 300 ×g) for 4 h. Then, the GVs in the upper powdery and white floating layer were retained through discarding the middle and bottom layers with bacterial lysis fragments, transferred to a 1.5-mL spiral centrifuge tube, and centrifuged at a low speed (4°C, 250 ×g) for 4 h with a bench centrifuge. The above process was repeated until the floating bacteria in the upper layer completely cracked into milky white GVs. Then, the freshly extracted GVs in PBS were stored at 4°C. The culture of Halo bacteria and the extraction process of GVs are shown in the right half of Figure 1.
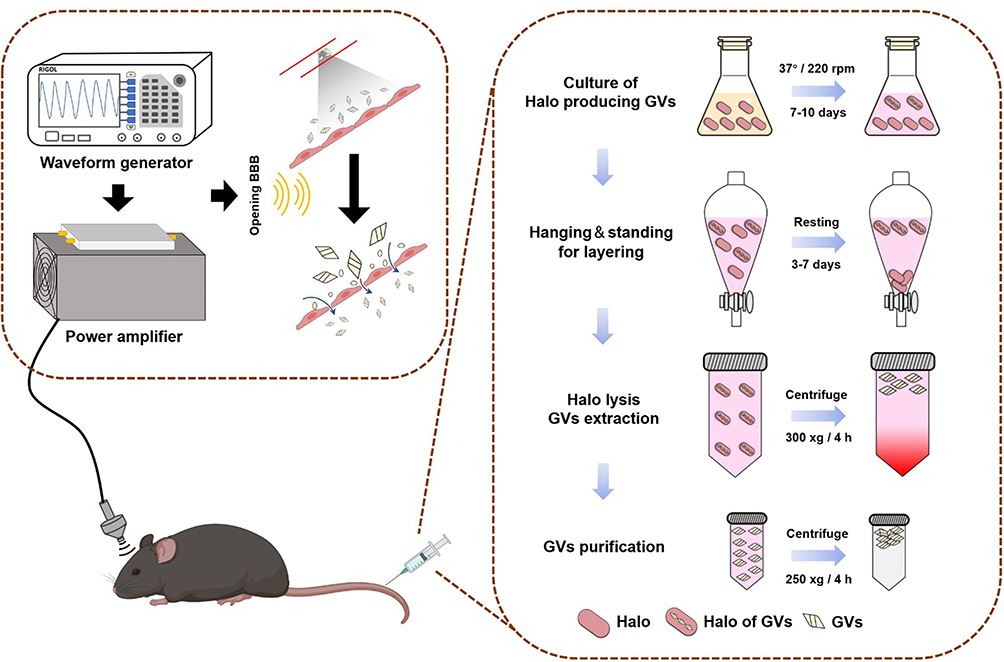 |
Figure 1 Schematic illustration of BBB opening by FUS/GVs (left) and the culture of Halo bacteria and the extraction process of GVs (right). |
Characterization of GVs
Refer to the method of Lakshmanan et al.25 GVs were coated on the carbon side of the charged TEM grids and negatively stained with phospho-tungstic acid. After drying, a thin film of GVs left on the grids were imaged using a transmission electron microscope (TEM, H-7650, Hitachi, Tokyo, Japan).
At different time points (0, 7, 14, 30, 60, and 120 days in PBS solution, 0, 1, 3, 7 and 14 days in 10% FBS solution) after preparation, the hydrated particle size distributions and Zeta-potentials of GVs were analyzed using a dynamic light scattering measurement system (Zetasizer NANO ZS, Malvern, UK) at room temperature. The measurements were repeated at least three times.
The concentration of GVs was determined by measuring the optical density at 500 nm (OD500).18,25 Briefly, 200-μL of GVs was added to a 96-well plate, and the absorbance of each well was measured using a full-wavelength microplate reader (Scientific Multiskan GO, Thermo Fisher, Waltham, MA, USA) at 500 nm.
Ultrasound Imaging Procedure of GVs
We first assessed the ultrasound imaging performance of GVs in vitro. Different concentrations of GVs (OD500 = 0.25, 0.5, 1.0, and 1.5) were prepared and loaded into wells in self-made 2% agarose phantoms. Then, B-mode and contrast mode ultrasound images were acquired by using a high-resolution micro-imaging system (Vevo2100, VisualSonics, Canada) with an 18-MHz transducer mounted on the lateral side of the phantoms. The signal intensity was analyzed by VevoCQ software package built into the instrument.
Then, the ultrasound performance of GVs in vivo was examined. Due to the attenuation of the skull, craniotomy is needed for brain tissue imaging in this study with the purpose of determining concentration of Halo bubble in mouse brain in the subsequent treatment of FUS/GVs to open the BBB. Briefly, the animals were immobilized with a stereotaxic apparatus and anesthetized with 1.5% isoflurane (RWD Life Science, China) with the hair removed. A bilateral strip craniotomy with the size of 6 mm × 4 mm between the bregma and the lambda was performed by drilling the skull slowly and carefully. Then, sterile normal saline was added to cover the cortex surface. After adjusting the position of the ultrasound probe, the imaging parameters were set (B mode: 1.2 cm width, 0.7 cm depth, 42 dB gain, 50% transmitted power; Contrast mode: 35 dB gain, 10% transmitted power). Then, a 200-μL solution of GVs was injected through the tail vein, and the imaging signal intensity was observed. Different concentrations (OD500 = 2.6, 3.0, 3.4, and 3.8) of GVs were used.
FUS/GVs-Mediated BBB Opening in vitro
Mouse brain microvascular endothelial cells (bEnd.3, Pricella Wuhan, Hubei Province, China) were inoculated inside a transwell chamber (0.4 μm, LABSELECT, Hefei, Anhui Province, China), and cultured with DMEM medium containing 10% fetal bovine serum and 1% penicillin-streptomycin in an incubator with 5% CO2 at 37°C. After culturing for 48 hours, a leak test was performed. The medium was added to the inner chamber of the transwell to make the liquid level difference between the inside and outside of the cell greater than 0.5 cm. The trans epithelial electric resistance (TEER) value of the BBB model from 1–7 days was measured by a TEER meter (Millicell® ERS-2, MERCK, Darmstadt, GER) with a cell-free transwell chamber as a blank control.26
A total of 6 groups were included, with 3 replicate wells per group. An in vitro BBB model without any treatment was the control group. The GVs group was the BBB model co-cultured with GVs (OD500 3.4). The FUS group was treated with only FUS sonication (2.0 MPa). The GVs+FUS1.0 group was the BBB model co-cultured with GVs (OD500 3.4) and then exposed to FUS with a pressure of 1.0 MPa, while the pressures of the GVs+FUS1.5 and the GVs+FUS2.0 group were 1.5 MPa and 2.0 MPa respectively. TEER measurements were performed before and 1, 2, and 4 hours after treatment.
Treatment Procedure of BBB Opening Induced by FUS/GVs
The left half of Figure 1 shows a schematic diagram of the opening of BBB by FUS/GVs.
Focused ultrasound beam was generated by a single-element spherical transducer (a center frequency of 1.0 MHz and a focal length of 38 mm), which was immersed in a cone filled with degassed water. The excitation waveform of the beam was generated (500,000-cycle pulse length, 1.0-Hz pulse repetition frequency) by a function generator (DG4162, RIGOL, Beijing, China) and driven by a 50-dB power amplifier (LZY-22+, Mini-Circuits, Brooklyn, NY, USA). The transducer was positioned targeting the mouse’s right hemisphere. To evaluate the effect of the sonication parameters on the BBB opening degree by FUS with GVs, different acoustic peak negative pressure values of 1.0 MPa, 1.5 MPa, and 2.0 MPa were used. In each parameter group, eight mice were used.
The mice were placed in a prone position with heads immobilized on a stereotaxic apparatus (RWD Life Science, China) and were anesthetized with 1.5% isoflurane. The body temperature of the animals was maintained through a heating pad. After hair removal, ultrasound gel was applied to the skin, and intravenous administration of GVs (OD500 = 3.4, 10 μL/g) and Evans blue (EB, 4%, 2.5 μL/g) was performed through a tail vein catheter. Then, the sonication was carried out for either 3 min or 5 min.
Evaluation of BBB Opening Induced by FUS/GVs
At 1 h after the completion of FUS/GV treatment, the mice were perfused, fixed, and sampled. In short, PBS solution was continuously perfused through the apical part of the left cardiac ventricle until clear liquids flowed out of the right cardiac atrium, and then 4% paraformaldehyde was perfused for tissue fixation. Then, the brains were extracted.
To evaluate the time window, EB extravasation was examined at four time points (0, 1, 2, and 4 h) after sonication. Three mice were used in each group. Fluorescence imaging was performed on coronal sections (a thickness of 2 mm) by the In Vivo Imaging System (IVIS Spectrum, PerkinElmer, Waltham, MA, USA). To quantify the concentrations of EB extravasated into the brain tissue, five mice were used in each group for quantification using the fluorescence method. After weighing and homogenate extraction, the supernatant was measured at 620 nm by a spectrophotometer. Five different concentrations of EB were prepared, and the standard curve was drawn, which was expressed as μg/g tissue.
In addition, the differences in BBB opening induced by FUS/MBs and FUS/GVs were compared in this study. Based on our previous research, two acoustic peak negative pressures of 0.3 MPa and 0.6 MPa were used (n = 6 for each group), and the irradiation time was 2 min. The MBs were self-made by our research group in accordance with the previous method. The concentration of MBs was diluted to 107/mL with saline, and the average diameter was 1.8 μm. The dose used for each mouse was 5 μL/g.
Procedure of Nanoparticle Delivery Across the BBB by FUS/GVs
ICG-loaded liposomes were prepared by the established thin-film hydration method to investigate the effect of FUS/GVs-mediated nanoparticle delivery across the BBB. Briefly, lipids (DPPC, cholesterol, and DSPE-PEG 2000 in the mass ratio of 3:1:1) were blended in chloroform, and the resultant solution was removed under nitrogen gas at room temperature. Any residual solvent of the lipid samples was subsequently removed under vacuum for a minimum of 3 h to obtain a lipid film. Then, 2 mL ICG solution with a concentration of 200 μg/mL was added to hydrate the lipid film. Freezing and thawing processes were repeated 5–6 times using liquid nitrogen in a water bath at 65°C. Then, the suspension was extruded through a 200-nm polycarbonate membrane using a mini-extruder (Avanti Polar Lipids, Alabaster, AL, USA).
Before FUS sonication, ICG-loaded liposomes (200-μL) were co-injected with GVs through the tail vein (n = 6). Then the sonication was performed as described above. After liposomes circulated for 6 h, cardiac perfusions were performed and the brains were extracted for subsequent fluorescence imaging using the IVIS spectrum imaging system (PerkinElmer, USA).
To examine the distribution of ICG-loaded liposomes extravasated into the brain, the brain tissues were fixed in 4% paraformaldehyde for 24 h and embedded with OCT. They were sectioned into slices with a thickness of 20 μm by a microtome cryostat (Leica CM1950, Germany). The nuclei were stained with DAPI. The fluorescence images were acquired by a confocal laser scanning microscopy (CLSM, Eclipse Ti, Nikon, Japan) at an excitation of 405 nm (DAPI)/640 nm (ICG).
In vivo Biocompatibility Assay
At 24 h after treatment, major organs, including the heart, lung, liver, spleen, and kidney, were harvested and fixed in 4% paraformaldehyde. After embedding in paraffin, serial 5-μm-thick sections were prepared and stained with hematoxylin and eosin (H&E) for microscopic assessment. Nine mice were randomly divided into three groups (n = 3 per group). The mice in the FUS/GV group were administered GVs (OD500 = 3.4, 10 μL/g), and the FUS group received sonication only without GV administration. The control group received only tail vein injections of PBS.
Two cohorts of C57BL6J mice were used for blood and the biochemical index examination. They were randomly divided into GVs group, in which each mouse was injected with 200-μL of GVs at OD500 3.4, and control group, in which each mouse was injected with 200-μL of PBS. The blood and the biochemical index of the mice were assessed on day 1, 7 and 14 after intravenous injection of GVs or PBS.
Histological Examination
The brain tissues were fixed with 4% paraformaldehyde for no less than 24 h. Next, paraffin was used to embed the tissues. Coronal sections with 3-µm-thickness were obtained and then stained with H&E.
Statistical Analysis
The data were analyzed using SPSS 21.0. All results are summarized as the mean ± standard deviation. ANOVA was used to evaluate the significance of differences between different groups. P < 0.05 was considered statistically significant.
Results
Characterization of GVs
GVs prepared in this study were of spindle shape, with a long diameter in a range of 150–350 nm and a wide diameter of 120–260 nm, as visualized by TEM in Figure 2A. The hydrodynamic diameter of freshly prepared GVs was relatively uniform, with an average value of 218.26 ± 4.05 nm and a polydispersion index of 0.14 ± 0.05. Zeta potential of GVs was −27.82 ± 2.05 mV. The hydrodynamic diameter and the potential of GVs were stable within four months after preparation as indicated by the examinations of GVs stored in PBS solution at 4°C for 0, 7, 14, 30, 60, and 120 days (Figure 2B). We also examined the stability of GVs in 10% FBS solution for 0–14 days. The zeta potential and particle size remained stable (Figure 2C).
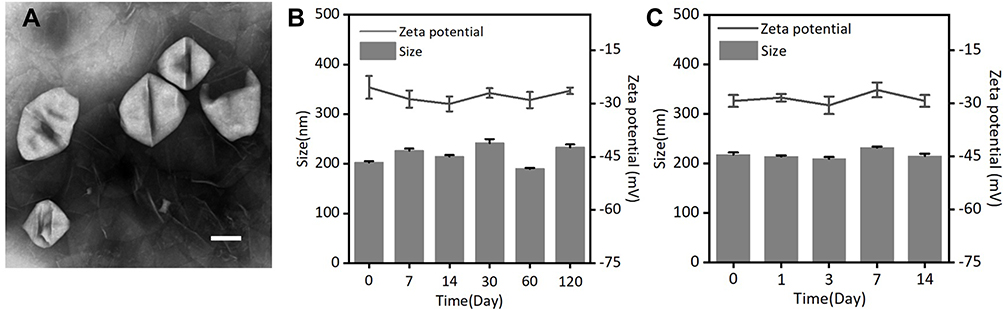 |
Figure 2 Characterization of GVs. (A) TEM images of GVs. Scale bar: 100 nm. (B) Zeta potential and size changes of GVs in PBS measured within 4 months after preparation. (C) Zeta potential and size changes of GVs in 10% FBS measured within 14 days after preparation. |
Ultrasound Imaging Performance of GVs in vitro
B-mode and contrast ultrasound images of GV solutions at different concentrations were acquired with a high-frequency (18 MHz) ultrasound imaging system. As shown in Figure 3A, GVs prepared in this study provided robust and uniform contrast along the lateral dimension (acoustic path) at OD500 values ranging from 0.25–1.0. However, when the OD500 value increased to 1.5, there was a reduced signal along the acoustic path, indicating acoustic attenuation at high concentrations of GVs. Quantitative analysis of the echo signal intensity indicated consistently increasing contrast with concentration (Figure 3B).
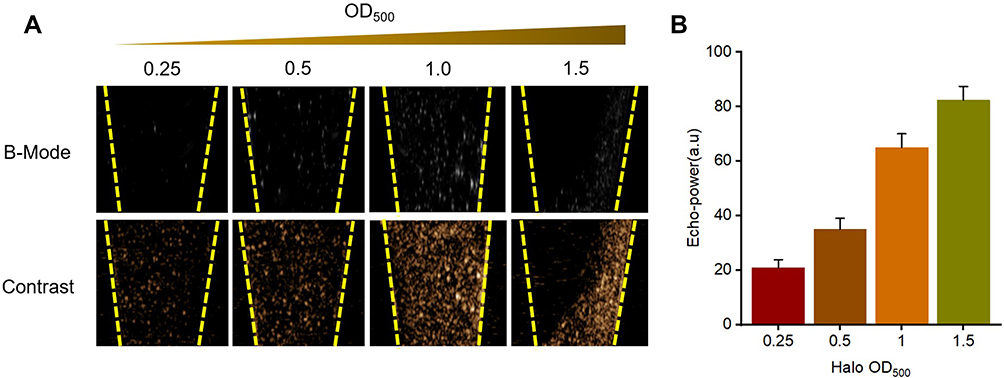 |
Figure 3 Ultrasound images and echo intensity of GVs at different concentrations in vitro. (A) Ultrasound images of GVs at different concentrations (OD500 = 0.25, 0.5, 1.0 and 1.5) in B-mode and Contrast mode in vitro. (B) Quantification of the acoustic signal intensities in contrast mode (n = 3). |
Ultrasound Imaging Performance of GVs in vivo
We next investigated the ultrasound imaging performance of GVs on the brain in vivo. B-mode and contrast mode images of GVs, which were injected into the tail vein of the mice, were acquired through the cranial window. As shown in Figure 4A, an enhanced contrast signal appeared in the brain after GV injection at all the concentrations used in this study ranging from OD500 2.6 to 3.8. The signal intensity increased with incremental concentrations and reached the highest level at OD500 of 3.8 (Figure 4B). The life times of GVs and phospholipid vesicles in mice brain have been shown in Figure 4C. The peak time and half-life of GVs were 2.4 min and 13.8 min respectively, longer than those of MBs (0.6 min and 6.0 min).
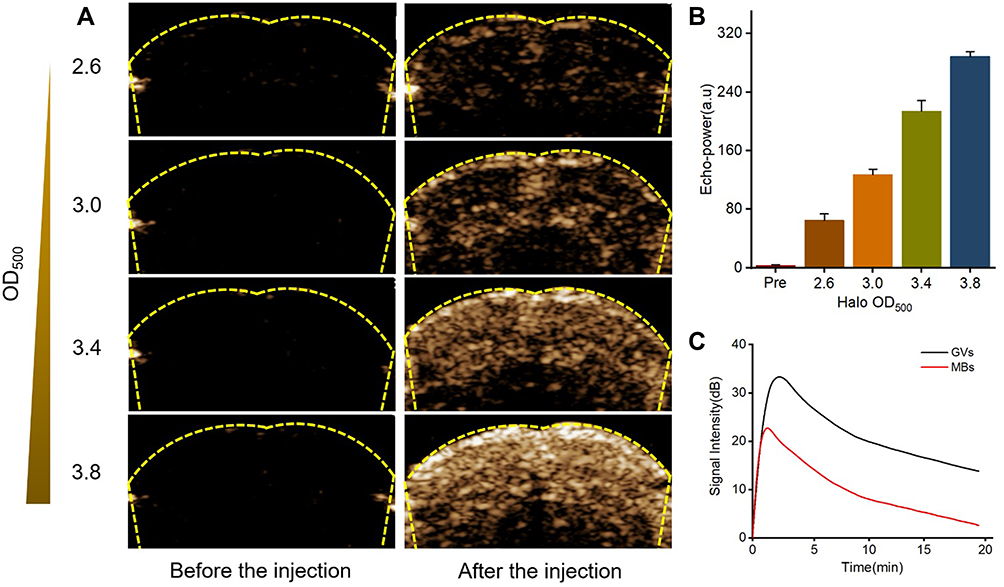 |
Figure 4 Ultrasound contrast performance of GVs on the brain in vivo. (A) Representative ultrasound contrast images of the mouse brains before and after GVs injection of different concentrations (OD500: 2.6, 3.0, 3.4 and 3.8). (B) Quantification of the acoustic signal intensities in contrast mode (n = 3). (C) Time-intensity curve of GVs and MBs perfused in brain. |
FUS/GVs-Mediated BBB Opening in vitro
As shown in Figure 5A, the TEER value increased with time, reaching a plateau with the maximum value of 218.2±9.2 Ω/cm,2 indicating a successful establishment of the in vitro BBB model. The TEER changes with time in each group after the treatments were shown in Figure 5B. Pure GVs, FUS, and GVs+FUS1.0 group did not show significant changes in cell transmembrane potential. In the presence of GVs, the FUS sonication with higher pressures of 1.5 MPa and 2.0 MPa led to decrease in the resistance of the in vitro BBB model first, reaching the minimum in 1 hour, and then gradually recovered. The GVs+FUS1.5 group returned to the normal level within 4 hours, while the GVs+FUS2.0 group could not. The result indicated that the in vitro BBB could be opened by FUS/GVs reversibly at a pressure of 1.5 MPa.
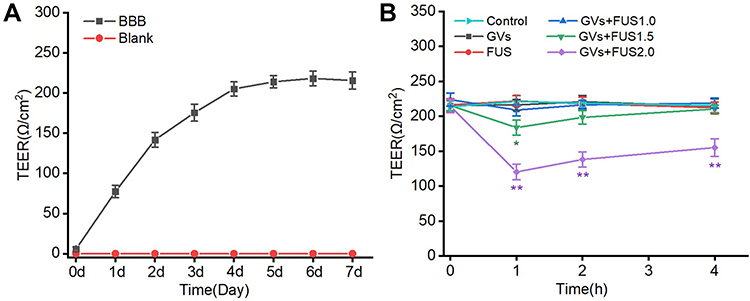 |
Figure 5 In vitro BBB opening by FUS/GVs evaluated by trans epithelial electric resistance (TEER) measurement. (A) TEER values of an in vitro BBB model. (B) The TEER changes with time after different treatments. Control: an in vitro BBB model without any treatment. GVs: co-cultured with GVs (OD500 3.4). FUS: treated with only FUS sonication (2.0 MPa). GVs+FUS1.0, GVs+FUS1.5 and GVs+FUS2.0: the BBB model co-cultured with GVs (OD500 3.4) and then exposed to FUS with a pressure of 1.0 MPa, 1.5 MPa and 2.0 MPa respectively. (*p < 0.05, **p < 0.01 as compared with the control). |
Assessment of BBB Opening Induced by FUS/GVs
The feasibility of combining GVs with FUS to open the BBB in vivo was then validated by assessing the extravasation of EB by comparing the sonicated side (right cerebral hemisphere) with the control side (left cerebral hemisphere). Three different acoustic peak negative pressure values were used (1.0 MPa, 1.5 MPa, and 2.0 MPa). As shown in Figure 6A, at pressure 1.5 MPa (Figure 6Ab) or above (Figure 6Ac), apparent EB coloration was observed on the sonicated side, whereas there was no blue area at 1.0 MPa (Figure 6Aa). The subsequent quantitative results showed that EB accumulated in the brain at 2.0 MPa was 1.7-fold higher than that at 2.0 MPa (Figure 6B). However, the H&E staining of the sonicated brain tissues indicated erythrocyte extravasation or hemorrhage at 2.0 MPa (Figure 6Af and l), while there was no gross tissue damage at 1.5 MPa (Figure 6Ae and h) or below (Figure 6Ad and g). Therefore, the BBB was successfully and safely opened by FUS/GVs at an acoustic peak negative pressure of 1.5 MPa. We also examined the time profile of EB accumulated in the brain after FUS exposure (Figure 6C). EB content reached the highest level immediately after sonication and then gradually decreased, indicating BBB integrity rebuilding, especially in the first hour.
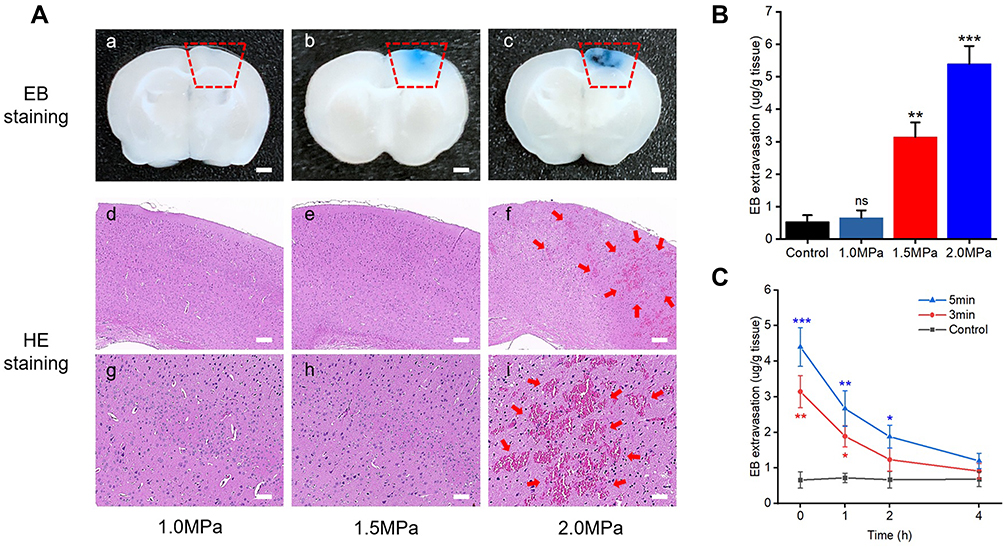 |
Figure 6 BBB opening induced by FUS/GVs evaluated by EB extravasation and H&E stain. (A) FUS/GVs-induced BBB opening at acoustic pressures of 1.0 MPa, 1.5 MPa and 2.0 MPa. Scale bar: a-c 1 mm, d-f 150 μm; g-i, 50 μm. Aa-c showed the EB extravasation. Red wireframes: FUS/GVs irradiation area. Ad-l were the results of H&E stain. Red arrows: erythrocyte extravasation or hemorrhage. (B) Quantitative analysis of EB extravasation after FUS sonication combined with GVs at different acoustic pressures with 3-min exposure time. (C) The time profile of EB extravasation after FUS/GVs treatments with 3-min and 5-min sonication time at 1.5 MPa, *p < 0.05, **p < 0.01, ***p < 0.001 as compared with the control). Abbreviation: ns, not significant. |
Next, we explored the effect of sonication duration on the BBB opening profile by FUS/GVs at the same acoustic pressure (1.5 MPa). Three different ultrasound exposure durations were used, namely 1 min, 3 min, and 5 min. Figure 7A shows fluorescence imaging of the brain tissues ex vivo at 1 h after FUS/GV treatment with different sonication durations. There was no successful BBB opening until the exposure lasted for 3 min. Notably, the amount of EB extravasation was enhanced by prolonging ultrasound exposure time from 3 min to 5 min. Therefore, increasing sonication duration can improve the level of BBB opening as well as prolong the time windows, which is also shown in Figure 7B. At the 2-h point, reconstruction of the BBB appeared to be complete in the brains treated with 3-min sonication, as there was no significant difference compared with the control group. For the 5-min group, the opening time window was extended to 4 h after FUS/GV treatment.
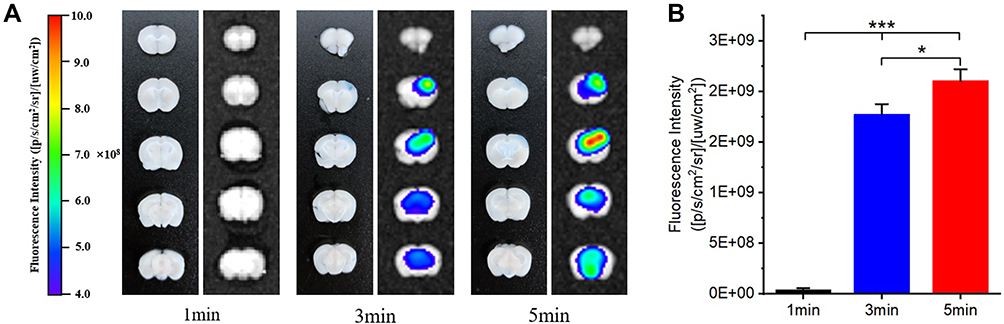 |
Figure 7 Fluorescence imaging of the brains ex vivo after FUS/GVs treatments with different sonication duration (1 min, 3 min and 5 min) at 1.5-MPa acoustic negative peak pressure. (A) Representative images and (B) quantification results of EB extravasation in the brain tissue at 1 h after FUS/GVs treatment. (*p < 0.05, ***p < 0.001 as compared with the control). |
Comparison Between FUS/GVs- and FUS/MBs-Mediated BBB Opening
Figure 8A and B illustrates the difference between EB extravasation induced by FUS/GVs and FUS/MBs. The high and low ultrasound pressures used here were 2.0 MPa/1.5 MPa (FUS/GVs) and 0.6 MPa/0.3 MPa (FUS/MBs), respectively. We found that EB extravasation was distributed along the FUS beam direction under either treatment (Figure 8A). At low acoustic pressure, the blue colorations were uniform, while there were dark stains at high ultrasound pressures both for FUS/GVs and FUS/MBs. Although the acoustic pressure by FUS/GVs required to open the BBB was higher than that of FUS/MBs, its opening range was more localized. For FUS/GVs, the EB extravasation area was mainly limited to the cerebral cortex of the focal area, even under high peak pressure (2.0 MPa). In contrast, FUS/MB treatment induced a larger area of BBB opening and a wider range of brain injury at 0.6 MPa.
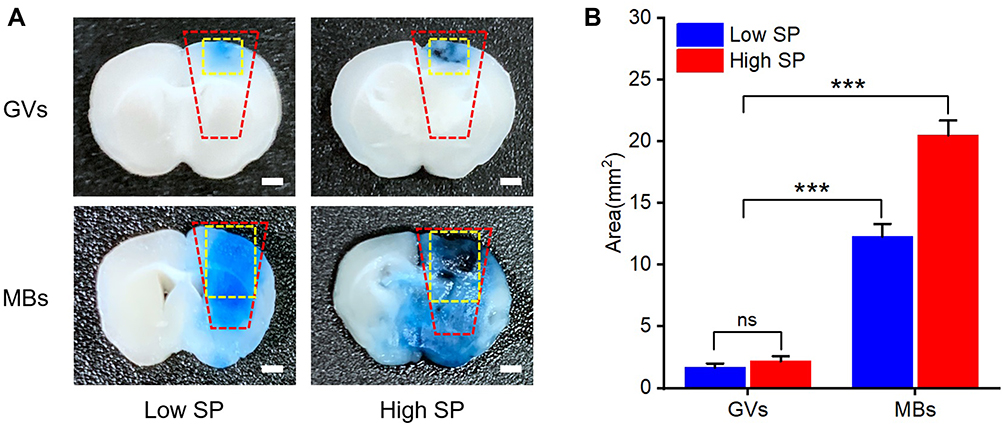 |
Figure 8 Comparison between FUS/GVs- and FUS/MBs-mediated EB extravasation across the BBB. (A) Representative images of EB exudation mediated by FUS/GVs and FUS/MBs, respectively. Scale bar: 1 mm. Red rectangle: FUS sonication area. Yellow rectangle: main EB extravasation area. (B) Quantification results of EB extravasation in the brain tissue mediated by FUS/GVs and FUS/MBs, respectively. ***p < 0.001. Abbreviation: ns, not significant. |
Nanoparticle Delivery Across the BBB by FUS/GVs
Finally, we investigated the effect of nanoparticle delivery across the BBB by FUS/GVs, in which ICG-loaded liposomes (ICG-liposomes) were used. The average diameter, zeta potential and size distribution of the liposomes were 221.8±5.2 nm (Figure S1), −8.1 ± 0.6 mv and 0.14 ± 0.03, respectively. The results of fluorescence imaging of the brain ex vivo and CLSM imaging of the brain frozen sections are shown in Figure 9A. Without FUS/GV treatment, ICG fluorescence was not detected either in the brains (Figure 9Ae) or in the sections (Figure 9Af–h), indicating that ICG-liposomes were not able to penetrate through the normal BBB. Notably, after FUS/GV treatment to open the BBB, a significantly enhanced fluorescence signal of ICG-liposomes was observed in the sonicated region in the brain ex vivo (Figure 9Aa) and CLSM imaging of sections (Figure 9Ab–d), indicating successful delivery of liposomes across the BBB, which was also demonstrated by the fluorescence intensity quantification (Figure 9B). The CLSM images of the brain sections showed that ICG-liposomes accumulated in the cerebral cortex of the sonicated region, indicating that they were delivered to the brain interstitium across the BBB after FUS/GV treatment. Quantitative results (Figure 9C) showed that there was no significant difference in DAPI between the two groups, indicating there was no cellular loss after FUS/GV treatment, while the difference in ICG signal intensity was statistically significant (P < 0.001).
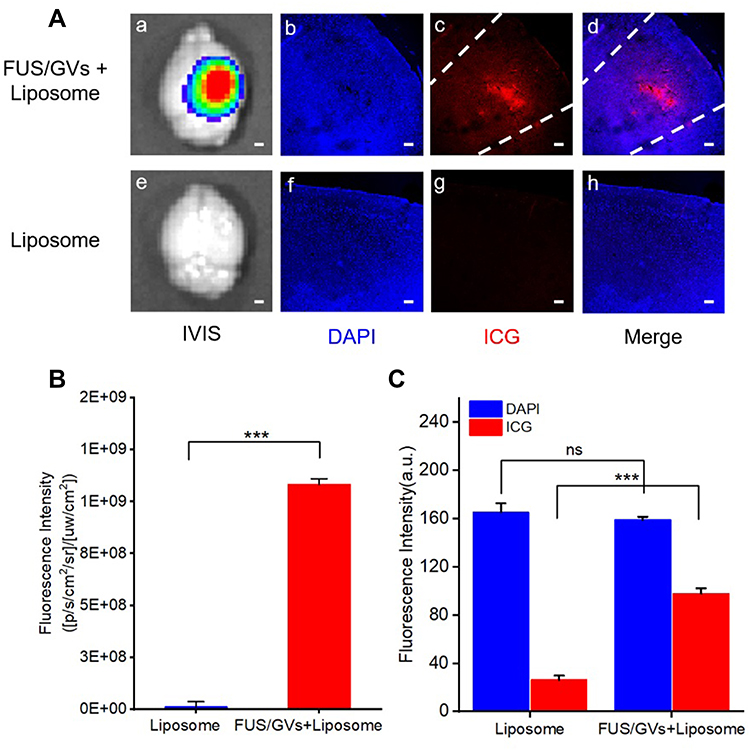 |
Figure 9 Enhanced delivery of ICG-liposomes across the BBB by FUS/GVs treatment. (A) Fluorescence imaging of the brains ex vivo (a, e) and CLSM images of brain sections (b-d, f-h). Scale bar: a and e, 1 mm; b-d and f-h, 150 μm. (B) Fluorescence quantification of the brains ex vivo. (C) Quantification of ICG fluorescence intensity in CLSM brain section images. ***p < 0.001. Abbreviation: ns, not significant. |
In vivo Biosafety Assessment
H&E staining of tissue sections of the parenchymal viscera (heart, lung, liver, spleen, and kidney) of mice in the PBS group, the only GV injection group, and the FUS/GV group was performed to assess the biosafety of GVs. As shown in Figure 10A, the structures of the major organs in the three groups were intact, without bleeding, edema, inflammatory infiltration, and other pathological changes, indicating the good biosafety of GVs at the concentration we used in vivo. The blood routine results are shown in Table S1, and the results of liver and kidney function are shown in Figure 10B. The results showed that there was no significant differences in the main parameters of hematology and blood biochemistry between the GVs group and PBS group, including alanine transaminase (ALT, Figure 10Ba), aspartate aminotransferase (AST, Figure 10Bb), albumin (ALB, Figure 10Bc), γ-glutamyltranspeptidase (γ-GT, Figure 10Bd), blood urea nitrogen (BUN, Figure 10Be) and creatinine (CREA, Figure 10Bf).
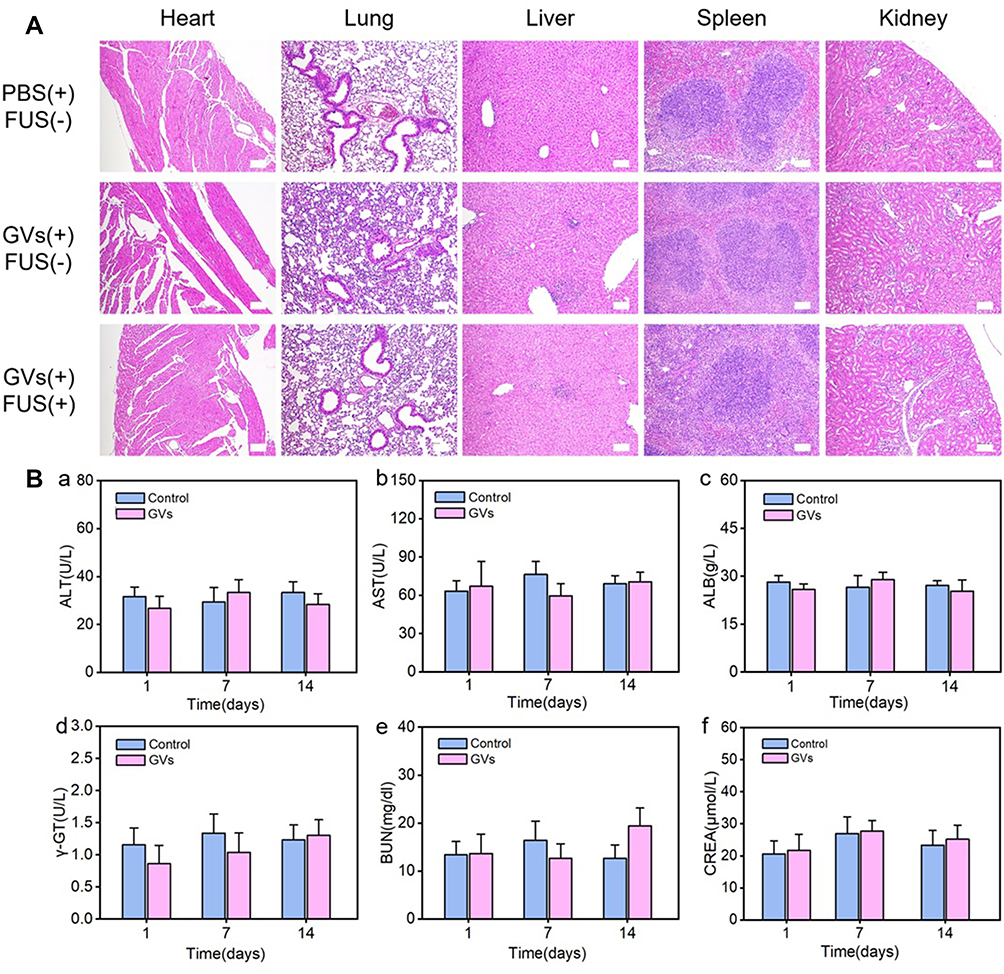 |
Figure 10 Results of the in vivo safety assessment of GVs. (A) Biocompatibility assessment by H&E staining. Scale bar: 100 μm. (B) Blood biochemistry assays on the 1, 7 and 14 days after intravenous injection. Comparison of ALT (a), AST (b), ALB (c), γ-GT (d), BUN (e) and CREA (f) between GVs group and PBS group. |
Discussion
The main objective of this study was to evaluate the ultrasound imaging performance of GVs and further explore the possibility of opening the BBB in combination with FUS. First, GVs produced by Halo were extracted and purified in this study. The shape, size, and ultrasound imaging capability in vitro of GVs are consistent with those reported in previous studies.17–19,27 In terms of in vivo imaging, natural GVs have been used to realize subcutaneous or intratumoral imaging by local injection.18,28,30 In our study, in vivo brain perfusion imaging was realized for the first time by increasing the intravenous injection concentration of GVs. The best brain perfusion imaging effect was obtained by using a high-frequency ultrasound probe (18 MHz) at the concentration of OD500 of 3.4. Similar to MBs, the ultrasonic signal intensity increased gradually with the concentration in a certain range. However, when the concentration increased above OD500 of 3.4, GVs produced broader acoustic attenuation, manifesting as a reduced signal behind the highlighted area.
In recent years, the method of FUS/MBs has been proven to be one of the most effective ways to open the BBB, but the exact mechanism is still under investigation. Currently, it is generally believed that FUS/MBs-induced BBB opening is well related to the cavitation behavior of MBs under the action of FUS, including stable cavitation under low acoustic pressure and inertial cavitation under high acoustic pressure. It is assumed that stable cavitation leads to periodical compression and expansion of blood vessels, thereby inducing changes in the cytoskeleton and intercellular connection of endothelial cells. Finally, drugs can reach the brain parenchyma or brain tumor through the damaged tight junctions.29,31,32 Compared with MBs with phospholipid shell, GVs with their protein shells are harder and less resilient. It has been proven that with an acoustic pressure of 650 kPa at 18 MHz, Halo GVs injected subcutaneously or intravenously would collapse in vivo.18 Here, the FUS sonication was performed through an intact skull, which generated approximately 18% acoustic attenuation. The BBB disruption was observed at an acoustic pressure of 1.5 MPa or above. Therefore, we speculate that at sufficiently high acoustic pressure (1.5 MPa in this study), GVs are likely to be broken and release the gas contents as nanobubbles, which undergo subsequent cavitation and unleash mechanical effects on the endothelial linings. The liberated nanobubbles also likely merge into micron bubbles as cavitation nuclei.33 In this study, by properly controlling acoustic parameters and GV dosage, the safe BBB opening was realized at a relatively higher acoustic pressure compared with that of the FUS/MB method. In particular, the opening area was centered on the FUS targeting area, and the extent of damage did not greatly increase at a higher acoustic pressure. In addition, the BBB was closed within 4 h after FUS/GV treatment, shorter than that induced by FUS/MBs, which was closed after 8 hours (Figure S2).
Through submicron sizes and genetically encodable structures,28,34 gene-encoded reporters in GVs offer great potential for extravascular biomolecular targeting in imaging and therapy. Shen et al proved that under the action of FUS/MBs, liposomes of different sizes ranging from 50 nm to 200-nm can be delivered into brain tissue while opening BBB.35 We also enhanced the delivery of 200-nm ICG-liposomes across the BBB by FUS/GVs. Moreover, the protein shells of GVs, which can be modified by chemical methods to connect antibodies and small molecule drugs, make them a potentially powerful tool to develop therapeutic strategies for CNS disorders.
One of the limitations of this study was the lack of a strong guidance system. Transcranial magnetic resonance–guided FUS is a remarkable and reliable noninvasive treatment technique for CNS diseases.36,37 In addition, previous studies16,18,25,27,28 have shown that GVs can be modified as magnetic resonance imaging contrast agents, so the combination of GVs and magnetic resonance imaging may produce unexpected effects.
Conclusions
In this study, we successfully extracted nano-scale gas-containing protein vesicles from bacteria, which are stable and hold good contrast performance for brain perfusion ultrasound imaging. At the acoustic negative pressure of 1.5 MPa, FUS/GVs may open the BBB safely and effectively and enhance 200-nm liposome delivery into the brain parenchyma. These results indicate that biosynthetic GVs hold great potential to serve as local BBB-opening agents in the development of new targeted drug delivery strategies for CNS disorders.
Acknowledgments
This work is supported by grants from the National Key Research and Development Program of China (2020YFA0908800), State Key Program of National Natural Science Foundation of China (81871376, 81730050, 12074269), Guangdong Natural Science Foundation (2021A1515011202) and Shenzhen Basic Science Research (JCYJ20200109105622824, JSGG20210802153811034).
Disclosure
The authors declare no conflicts of interest in this work.
References
1. Ding S, Khan AI, Cai X, et al. Overcoming blood–brain barrier transport: advances in nanoparticle-based drug delivery strategies. Materials Today. 2020;37:112–125. doi:10.1016/j.mattod.2020.02.001
2. Lee MR, Jayant RD. Penetration of the blood-brain barrier by peripheral neuropeptides: new approaches to enhancing transport and endogenous expression. Cell Tissue Res. 2019;375(1):287–293.
3. Sprowls SA, Arsiwala TA, Bumgarner JR, et al. Improving CNS delivery to brain metastases by blood–tumor barrier disruption. Trends Cancer. 2019;5(8):495–505.
4. Mcdannold N, Zhang Y, Supko JG, et al. Acoustic feedback enables safe and reliable carboplatin delivery across the blood-brain barrier with a clinical focused ultrasound system and improves survival in a rat glioma model. Theranostics. 2019;9(21):6284–6299.
5. Ishida J, Alli S, Bondoc A, et al. MRI-guided focused ultrasound enhances drug delivery in experimental diffuse intrinsic pontine glioma. J Control Release. 2021;330:1034–1045.
6. Arvanitis CD, Askoxylakis V, Guo Y, et al. Mechanisms of enhanced drug delivery in brain metastases with focused ultrasound-induced blood-tumor barrier disruption. Proc Natl Acad Sci USA. 2018;115(37):E8717–E8726.
7. Sabbagh A, Beccaria K, Ling X, et al. Opening of the blood-brain barrier using low-intensity pulsed ultrasound enhances responses to immunotherapy in preclinical glioma models. Clin Cancer Res. 2021;27(15):4325–4337.
8. Curley CT, Mead BP, Negron K, et al. Augmentation of brain tumor interstitial flow via focused ultrasound promotes brain-penetrating nanoparticle dispersion and transfection. Sci Adv. 2020;6(18):eaay1344.
9. Mead BP, Curley CT, Kim N, et al. Focused ultrasound preconditioning for augmented nanoparticle penetration and efficacy in the central nervous system. Small. 2019;15(49):e1903460.
10. Lee J, Chang WS, Shin J, et al. Non-invasively enhanced intracranial transplantation of mesenchymal stem cells using focused ultrasound mediated by overexpression of cell-adhesion molecules. Stem Cell Res. 2020;43:101726. doi:10.1016/j.scr.2020.101726
11. Cui H, Zhu Q, Xie Q, et al. Low intensity ultrasound targeted microbubble destruction assists MSCs delivery and improves neural function in brain ischaemic rats. J Drug Target. 2020;28(3):320–329.
12. Schoen S, Kilinc MS, Lee H, et al. Towards controlled drug delivery in brain tumors with microbubble-enhanced focused ultrasound. Adv Drug Deliv Rev. 2022;180:114043.
13. Mulvana H, Browning RJ, Luan Y, et al. Characterization of contrast agent microbubbles for ultrasound imaging and therapy research. IEEE Trans Ultrason Ferroelectr Freq Control. 2017;64(1):232–251.
14. Pfeifer F. Distribution, formation and regulation of gas vesicles. Nat Rev Microbiol. 2012;10(10):705–715.
15. Piraner DI, Farhadi A, Davis HC, et al. Going deeper: biomolecular tools for acoustic and magnetic imaging and control of cellular function. Biochemistry. 2017;56(39):5202–5209.
16. Bourdeau RW, Lee-Gosselin A, Lakshmanan A, et al. Acoustic reporter genes for noninvasive imaging of microorganisms in mammalian hosts. Nature. 2018;553(7686):86–90.
17. Pfeifer F. Haloarchaea and the formation of gas vesicles. Life. 2015;5(1):385–402.
18. Shapiro MG, Goodwill PW, Neogy A, et al. Biogenic gas nanostructures as ultrasonic molecular reporters. Nat Nanotechnol. 2014;9(4):311–316.
19. Borden M, Sirsi S. Ultrasound imaging: better contrast with vesicles. Nat Nanotechnol. 2014;9(4):248–249.
20. Tayier B, Deng Z, Wang Y, et al. Biosynthetic nanobubbles for targeted gene delivery by focused ultrasound. Nanoscale. 2019;11(31):14757–14768.
21. Song L, Hou X, Wong KF, et al. Gas-filled protein nanostructures as cavitation nuclei for molecule-specific sonodynamic therapy. Acta Biomater. 2021;136:533–545.
22. Fernando A, Gariepy J. Coupling Chlorin e6 to the surface of Nanoscale Gas Vesicles strongly enhance their intracellular delivery and photodynamic killing of cancer cells. Sci Rep. 2020;10(1):2802.
23. Maresca D, Payen T, Lee-Gosselin A, et al. Acoustic biomolecules enhance hemodynamic functional ultrasound imaging of neural activity. Neuroimage. 2020;209:116467.
24. Wang S, Meng W, Ren Z, et al. Ultrasound neuromodulation through nanobubble-actuated sonogenetics. Front Physiol. 2020;11:787.
25. Lakshmanan A, Lu GJ, Farhadi A, et al. Preparation of biogenic gas vesicle nanostructures for use as contrast agents for ultrasound and MRI. Nat Protoc. 2017;12(10):2050–2080.
26. Tigges U, Welser-Alves JV, Boroujerdi A, et al. A novel and simple method for culturing pericytes from mouse brain. Microvasc Res. 2012;84(1):74–80.
27. Shapiro MG, Ramirez RM, Sperling LJ, et al. Genetically encoded reporters for hyperpolarized xenon magnetic resonance imaging. Nat Chem. 2014;6(7):629–634.
28. Lu GJ, Farhadi A, Szablowski JO, et al. Acoustically modulated magnetic resonance imaging of gas-filled protein nanostructures. Nat Mater. 2018;17(5):456–463.
29. Piper R, Hughes M, Moran C, et al. Focused ultrasound as a non-invasive intervention for neurological disease: a review. Br J Neurosurg. 2016;30(3):286–293.
30. Wang G, Song L, Hou X, et al. Surface-modified GVs as nanosized contrast agents for molecular ultrasound imaging of tumor. Biomaterials. 2020;236:119803.
31. Timbie KF, Mead BP, Price RJ. Drug and gene delivery across the blood-brain barrier with focused ultrasound. J Control Release. 2015;219:61–75.
32. Dasgupta A, Liu M, Ojha T, et al. Ultrasound-mediated drug delivery to the brain: principles, progress and prospects. Drug Discov Today Technol. 2016;20:41–48.
33. Bar-Zion A, Nourmahnad A, Mittelstein DR, et al. Acoustically triggered mechanotherapy using genetically encoded gas vesicles. Nat Nanotechnol. 2021;16(12):1403–1412.
34. Lakshmanan A, Farhadi A, Nety SP, et al. Molecular engineering of acoustic protein nanostructures. ACS Nano. 2016;10(8):7314–7322.
35. Shen Y, Guo J, Chen G, et al. Delivery of liposomes with different sizes to mice brain after sonication by focused ultrasound in the presence of microbubbles. Ultrasound Med Biol. 2016;42(7):1499–1511.
36. Airan RD, Meyer RA, Ellens NP, et al. Noninvasive targeted transcranial neuromodulation via focused ultrasound gated drug release from nanoemulsions. Nano Lett. 2017;17(2):652–659.
37. Gallay MN, Moser D, Rossi F, et al. Incisionless transcranial MR-guided focused ultrasound in essential tremor: cerebellothalamic tractotomy. J Ther Ultrasound. 2016;4:5.
 © 2022 The Author(s). This work is published and licensed by Dove Medical Press Limited. The full terms of this license are available at https://www.dovepress.com/terms.php and incorporate the Creative Commons Attribution - Non Commercial (unported, v3.0) License.
By accessing the work you hereby accept the Terms. Non-commercial uses of the work are permitted without any further permission from Dove Medical Press Limited, provided the work is properly attributed. For permission for commercial use of this work, please see paragraphs 4.2 and 5 of our Terms.
© 2022 The Author(s). This work is published and licensed by Dove Medical Press Limited. The full terms of this license are available at https://www.dovepress.com/terms.php and incorporate the Creative Commons Attribution - Non Commercial (unported, v3.0) License.
By accessing the work you hereby accept the Terms. Non-commercial uses of the work are permitted without any further permission from Dove Medical Press Limited, provided the work is properly attributed. For permission for commercial use of this work, please see paragraphs 4.2 and 5 of our Terms.