")
Back to Journals » International Journal of Women's Health » Volume 9
Biomechanical paradigm and interpretation of female pelvic floor conditions before a treatment
Authors Lucente V, van Raalte H, Murphy M, Egorov V
Received 14 March 2017
Accepted for publication 10 June 2017
Published 3 August 2017 Volume 2017:9 Pages 521—550
DOI https://doi.org/10.2147/IJWH.S136989
Checked for plagiarism Yes
Review by Single anonymous peer review
Peer reviewer comments 2
Editor who approved publication: Professor Elie Al-Chaer
Vincent Lucente,1 Heather van Raalte,2 Miles Murphy,1 Vladimir Egorov3
1The Institute for Female Pelvic Medicine and Reconstructive Surgery, Allentown, PA, USA; 2Princeton Urogynecology, Princeton, NJ, USA; 3Artann Laboratories, Trenton, NJ, USA
Background: Further progress in restoring a woman’s health may be possible if a patient with a damaged pelvic floor could undergo medical imaging and biomechanical diagnostic tests. The results of such tests could contribute to the analysis of multiple treatment options and suggest the optimal one for that patient.
Aim: To develop a new approach for the biomechanical characterization of vaginal conditions, muscles, and connective tissues in the female pelvic floor.
Methods: Vaginal tactile imaging (VTI) allows biomechanical assessment of the soft tissue along the entire length of the anterior, posterior, and lateral vaginal walls at rest, with manually applied deflection pressures and with muscle contraction, muscle relaxation, and Valsalva maneuver. VTI allows a large body of measurements to evaluate individual variations in tissue elasticity, support defects, as well as pelvic muscle function. Presuming that 1) the female pelvic floor organs are suspended by ligaments against which muscles contract to open or close the outlets and 2) damaged ligaments weaken the support and may reduce the force of muscle contraction, we made an attempt to characterize multiple pelvic floor structures from VTI data.
Results: All of the 138 women enrolled in the study were successfully examined with the VTI. The study subjects have had normal pelvic support or pelvic organ prolapse (stages I–IV). The average age of this group of subjects was 60±15 years. We transposed a set of 31 VTI parameters into a quantitative characterization of pelvic muscles and ligamentous structures. Interpretation of the acquired VTI data for normal pelvic floor support and prolapse conditions is proposed based on biomechanical assessment of the functional anatomy.
Conclusion: Vaginal tactile imaging allows biomechanical characterization of female pelvic floor structures and tissues in vivo, which may help to optimize treatment of the diseased conditions such as prolapse, incontinence, atrophy, and some forms of pelvic pain.
Keywords: female pelvic floor, biomechanics, diagnostic, treatment, tactile imaging, tissue elasticity, pelvic muscles
Introduction
The interaction between the anatomic structures of the female pelvic floor anatomy and their inter-related functions are among the most complex in the human body. Therefore, true understanding of how to best restore function that has been lost due to anatomic changes can be extremely problematic. The female pelvic floor comprises a bladder with urethra for storage and evacuation of urine, a uterus with cervix, a vagina for reproductive and sexual function, and a rectum with anus for storage and elimination of stool, along with a complicated and interdependent muscular web with its required neuronal innervation and variable connective tissues. Together, they are protected by and are structurally dependent on the surrounding pelvic bones. The multitasking and codependence of these structures create the inherent nature whereby, more often than not, pelvic floor disease conditions are often interrelated. As a result of the various types of trauma and injury that can be sustained to the soft tissues of the human pelvic floor during a vaginal delivery, along the typical degree of mechanical stress and strain to the pelvic floor with extended life expectancy, many women have clinically relevant pelvic floor problems at some point in their lifetime.1–6
Female pelvic floor multitasking is realized at a macro level as a result of biomechanical actions (micturition, defecation, intercourse, pregnancy, childbirth). Active muscle structures play a role as the basic drivers required to release or apply pressure for specific task completion. Passive connective tissue attachments keep the pelvic organs in the proper three-dimensional (3D) spatial orientation, so that they may be optimally “acted on” by the pelvic floor musculature.7–9 The complex biomechanical actions, such as urination or voluntary control of defecation, cannot be completed in a normal manner if muscular or connective tissues have altered mechanical properties (passive and/or active). As the pelvic floor muscle resting tone decreases and connective tissue (ligament) laxity ensues, a significant anatomic distortion can develop, which could lead to a decrease in contractive capabilities and physiologic malfunction. Even more damaging can be the avulsion of pelvic floor muscle and more severe connective tissue disruption, which are not readily reversible without a surgical intervention. The intent of this manuscript is to demonstrate how one can evaluate these changes in the mechanical properties of pelvic floor structures (muscular and connective tissues) using vaginal tactile imaging to gain a better understanding of an individual patient’s pelvic floor dysfunction, and thereby ultimately improve guidance toward optimal selection from the various surgical and nonsurgical therapeutic choices available.
Perhaps the greatest frustration the surgeons specializing in female pelvic reconstructive procedures encounter during their career is that the restoration of pelvic floor anatomy does not necessarily lead to functional recovery. The reasons are not well understood, but no doubt include the following:
- suboptimal or absence of biomechanical assessment and a misdiagnosis or an underappreciation of the pelvic floor defects as a result;
- a pelvic reconstructive surgeon proposes/selects a pelvic floor treatment from a limited list she/he feels proficient with vs all the options and approaches that are available to choose from; and
- limitations in the overall success rates of applied treatments to address the full spectrum of symptoms a patient may present with.
As a result, a surgeon may routinely perform a midline plication of the fibromuscular wall of the vagina for a Stage IIB cystocele in patients who actually have an apical detachment of DeLancey Level I support, because he/she does not feel comfortable performing any of the apical suspension procedures and/or did not properly diagnose the true underlying biomechanical defect. This scenario and other contributing factors help explain why surgical failure rate of correction of anterior compartmental defects is often quite high.10–12
Further progress in restoring women’s health may be possible if a patient with a problematic pelvic floor condition could undergo very detailed imaging and biomechanical diagnostic tests; the results of such tests could be fed into a structured patient-specific diagnostic workflow to consider multiple treatment options and to suggest the optimal one to treat that unique patient. Global biomechanical assessment of the pelvic floor and then tailoring treatment of its biomechanical dysfunction is the logical route to improve clinical success (Figure 1); this is the preferred process.
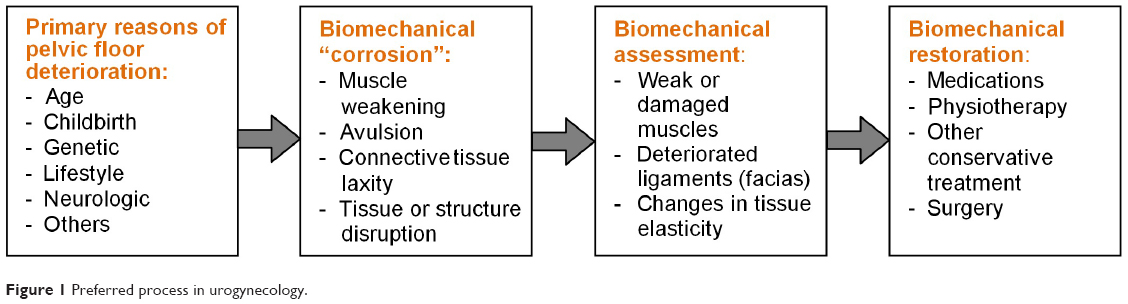 | Figure 1 Preferred process in urogynecology. |
The ultimate goal of this research is to develop an improved patient-specific approach for diagnostic biomechanical characterization of basic support and functional components in the female pelvic floor. This approach is based on our current understanding of female pelvic floor functional anatomy and our interpretation of clinical results with Vaginal Tactile Imaging (VTI).6–9 A VTI probe allows acquisition of the pressure patterns along the entire length of the vagina for the two opposite sides. This opens up new possibilities for the quantitative biomechanical assessment and monitoring of pelvic floor conditions.
Methods
Understanding of female pelvic floor functional anatomy
A consideration of any complex life system must include selection of key components playing a significant role in physiologic processes. In this consideration, we will pay attention to the structure, and related passive as well as active biomechanical aspects.6–9,13
Characterizing soft tissue elasticity
From classical mechanics, we know that to characterize an object as a mechanical system, a great number of parameters are needed. These include the shear and Young’s moduli, bulk compressional modulus, nonlinearity, Poisson’s ratio, viscosity, poroelastic parameters, hysteresis, anisotropy, and heterogeneity indices.14–16 At the first glance, this requirement does not seem realistic to meet. However, over the centuries, soft tissue palpation has been the most prevalent and successful medical diagnostic technique.17 Two critical factors explain this: 1) detection of a mechanical heterogeneity by manual palpation is based exclusively on sensing the variations of the Young’s modulus (E) of the tissue (or shear elasticity modulus, which is approximately equal to E/3 for soft tissues) and 2) the elasticity modulus varies by hundreds of percent during development of pathologic or diseased conditions in the soft tissues.18–20 The key terms related to soft tissue elasticity require additional explanation to understand the tactile imaging approach.
Pressure
Pressure is the force applied per unit area to an object or a portion of the object. Here, pressure refers to the cause of soft tissue deformation as a force (pressure) is applied to the tissue surface. The units of pressure include force (Newton) per unit area (square meter), that is, N/m2 (called Pascals or Pa). Other units of pressure, such as cmH2O and mmHg (millimeter of mercury), are also used; for example, 1 mmHg =0.0075 Pa. Pressure is a scalar described by a magnitude alone.
Stress
Stress is the force that neighboring particles of a continuous material exert on each other. Stress refers to the cause of the tissue deformation. The unit of stress here is force (Newton) per unit area (square meter), that is, N/m2 or Pa. Stress is a vector described by both a magnitude and a direction.
Strain
Strain is the measure of the deformation of the material under applied load (pressure or stress). Strain may characterize deformation of a soft tissue surface or displacement of internal particles. Strain is expressed as the ratio of total deformation to the initial dimension of the object. Strain is dimensionless (m/m).
Elasticity
In mechanics, elasticity is the ability of a material to resist applied stress and to return to its original shape when the stress is removed. The elastic moduli characterize the ability to resist the applied stress as an intrinsic property of a specific material.14–16 If the deformed tissue has returned by 98% to its initial size, is it elastic? Yes, it is elastic; it just may require additional characterization. A perfect (100%) elastic material is an illusory approximation from the real world. In the case of a one-dimensional deformation of a uniform object, the stress to strain ratio is the Young’s modulus (stress/strain = N/m2/m/m = Pa; Hooke’s law). Many materials, including human soft tissues, noticeably deviate from Hooke’s law well before their elastic limits (tissue break) are reached. However, the stress to strain ratio directly characterizes the soft tissue elasticity.
Stiffness
Stiffness is the ability of an elastic object to resist an applied force. Stiffness is not only a function of the material, but is also influenced by the object shape. It is measured as a ratio of applied force (Newton) per object linear compression or elongation (meter), that is, N/m.
Pressure vs deformation
Pressure response patterns are measured with a pressure sensor array by applying a probe to the surface of a soft tissue object, to allow acquisition of the stress data. If we know the exact displacement coordinates (the strain) of every pressure sensor during the tissue deformation, we can map the pressure response data in this coordinate continuum to obtain stress–strain or tactile images. It seems that tactile image can be acquired not only for tissue compression by a probe with pressure/tactile sensors, but also for probe sliding over lubricated soft tissue or combination of compression and sliding. Such an approach makes it possible for the composition of a 3D tactile image that looks similar to the original structure and allows its elasticity assessment. The tactile compound image integration is also possible if the object exceeds the probe size.21–23
Tactile imaging
Tactile imaging is a medical imaging modality translating the sense of touch into a digital image. The tactile image is a function of P(x, y, z), where P is the pressure on the soft tissue surface under the applied deformation, and x, y, and z are the coordinates where pressure P is measured.15 The tactile image is a pressure map on which the direction of tissue deformation must be specified. The probe has a pressure sensor array mounted on its face that acts similarly to human fingers during a clinical examination, deforming the soft tissue and detecting the resulting changes in the pressure pattern on the surface. The sensor head is moved over the surface of the tissue to be studied, and the pressure response is evaluated at multiple locations along the tissue. The results are used to generate two-dimensional or 3D images showing the pressure distribution over the area of the tissue under study.
Elasticity assessment
Generally, an inverse problem solution for the 3D tactile image P(x, y, z) would allow reconstruction of the tissue elasticity distribution as a function of the coordinates x, y, and z. Unfortunately, the inverse problem solution is hardly possible for most real objects because it is a nonlinear and ill-posed problem. However, the tactile imaging reveals tissue or organ anatomy and elasticity distribution because it keeps the stress–strain relationship for the deformed tissue.21,22 It appears that the 3D tactile image can be transformed into an elasticity image with the use of a linear transformation for a region of interest. That means, in general, the spatial gradients ∂P(x, y, z)/∂x, ∂P(x, y, z)/∂y, and ∂P(x, y, z)/∂z can be used in practice for a quantitative assessment of soft tissue elasticity, despite structural and anatomic variations.23
Functional tactile imaging
Functional tactile imaging is a variation of tactile imaging that translates the muscle activity into a dynamic pressure pattern P(x, y, t) for an area of interest, where t is time and x, y are the coordinates where pressure P is measured. Muscle activity to be studied may include a voluntary contraction (eg, a pelvic floor squeeze), an involuntary reflex contraction (eg, due to a cough), an involuntary relaxation, or a Valsalva (veering down) maneuver.23 The functional tactile imaging is similar to the high-definition manometry used for muscle contraction studies along the gastrointestinal tract. With this approach, muscle strength (MS) is calculated as the difference between the maximum pressure amplitude P2(x), as measured by the VTI probe at muscle contraction (voluntary or involuntary), and the pressure amplitude P1(x) in the same location x at muscle rest. This means MS = P2(x) − P1(x).
Vaginal tactile imager
A VTI allows acquisition of pressures applied to the vaginal walls along with the probe location to visualize vaginal and pelvic floor support structures and to record pelvic floor muscle contractions. The VTI software provides visualization, analysis, information, and reporting tools. The acquired data and information from the subsequent analysis can then be used for quantitative assessment of the vaginal and pelvic floor conditions.
The VTI comprises the vaginal probe (Figure 2) and a movable computer display cart. The VTI probe is equipped with 96 pressure (tactile) sensors positioned every 2.5 mm along both sides of the probe, an orientation sensor, and temperature sensors with microheaters.
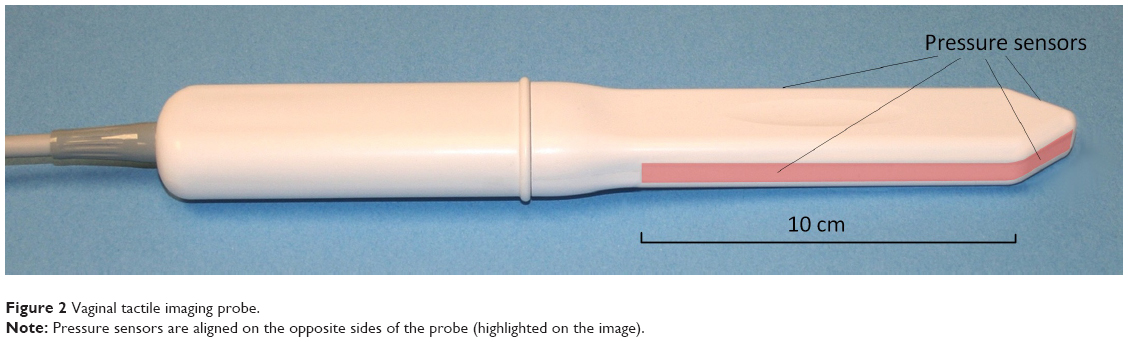 | Figure 2 Vaginal tactile imaging probe. |
During the patient examination procedure, data are sampled from the probe sensors and displayed on the VTI computer display in real time. The probe surfaces that contact the vaginal walls are preheated to human body temperature. A lubricating jelly is used for patient comfort and to provide reproducible boundary/contact conditions with deformed vaginal tissue; these conditions are classified as slip boundary conditions.
The tactile probe measures an applied pressure, but not force. Force is a vector, and by definition has amplitude and direction. The pressure sensors designed for the VTI probe are not sensitive to the tangential component of a force that may arise during probe motion and measurements; pressure = force (orthogonal to probe surface)/area. This probe is used for tissue compression in an orthogonal direction to the tissue surface during the probe insertion (Test 1), tissue deformation during the probe elevation (Test 2), pressure pattern acquisition during the probe rotation (Test 3), Valsalva maneuver (Test 4), and pelvic muscle contractions and relaxation (Tests 5–8). The probe’s maneuvers in Tests 1–3 allow accumulation of multiple pressure patterns from the tissue surface to compose an integrated tactile image corresponding to each test for the investigated area using the image composition algorithms.22
The VTI allows assessment of tissue elasticity, pelvic floor support, and function. The target population comprises adult women with pelvic organ prolapse (POP), urinary incontinence, tissue atrophy, and pelvic floor pain. The device is intended for use by physicians, surgeons, and medically trained personnel. The previous clinical results obtained with the VTI have been reported.23–35
Patient position and data acquisition
The VTI scan is performed on a patient in the dorsal lithotomy position with an empty bladder and rectum. The full VTI examination takes 3–5 minutes to complete. The VTI probe is calibrated being placed in a calibration chamber for about 20 seconds before every clinical application. Figure 3 shows the VTI probe placement into a patient’s vagina during her examination (data acquisition).
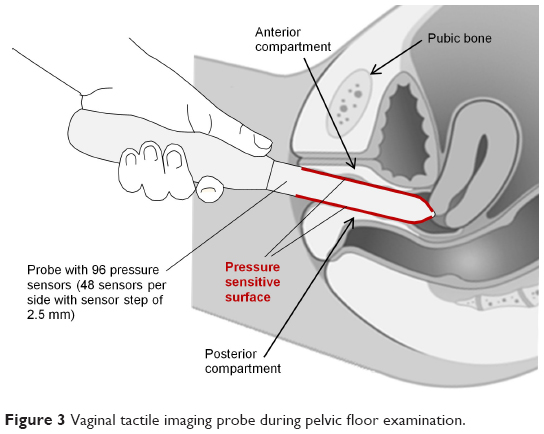 | Figure 3 Vaginal tactile imaging probe during pelvic floor examination. |
Population description
We enrolled 138 subjects into an observational case–control clinical study in 2014–2015 (clinical trials identifier NCT02294383 at https://ClinicalTrials.gov). Local institutional review board approvals were received from St Luke’s University Health Network (Bethlehem, PA) and Princeton HealthCare System (Princeton, NJ). The study subjects have had normal pelvic support or POP (stages I–IV). The average age was 60±15, with subjects’ individual ages ranging from 26 to 90 years. The clinical protocol was approved by the local institutional review board, and all the participating women gave written informed consent. The study was conducted in compliance with the Health Insurance Portability and Accountability Act. The VTI images were obtained and recorded at the time of scheduled routine gynecologic visits.
The study workflow comprised the following steps: 1) recruiting women who routinely undergo vaginal examination as a part of their diagnostic treatment of concerned areas; 2) acquisition of clinical diagnostic information related to the studied cases by standard clinical means; 3) performing a VTI examination; and 4) review of acquired VTI images and capture of illustrative VTI results. For prolapse staging, we used a Pelvic Organ Prolapse Quantification [POP-Q] system.36 Additionally, the patients were asked to assess the comfort level of a VTI examination relative to manual palpation.
VTI examination procedure
The complete VTI study consists of eight independent tests:
- Test 1: probe insertion
- Test 2: probe elevation
- Test 3: probe rotation
- Test 4: Valsalva maneuver
- Tests 5 and 6: voluntary muscle contraction
- Test 7: involuntary muscle relaxation
- Test 8: involuntary muscle contraction (cough).
Results
Test 1: probe insertion
The vaginal probe is designed to deform the vaginal walls in an orthogonal direction from the vaginal channel during the probe insertion, as shown in Figure 4A. The linear motion of the probe is translated into vaginal tissue deformation in a definitive manner, and the pressure sensors of the angled probe tip measure the tactile feedback from the vaginal walls – for a 13 mm deformation per side (Figure 4A). Figure 4B shows the tactile image recorded for a silicone model, which has a tissue elasticity transition from 10 to 5 kPa (Young’s modulus). This transition is clearly manifested in the calculated pressure gradients (mmHg/mm, orthogonally to vaginal channel) for both sides from the center of the channel.
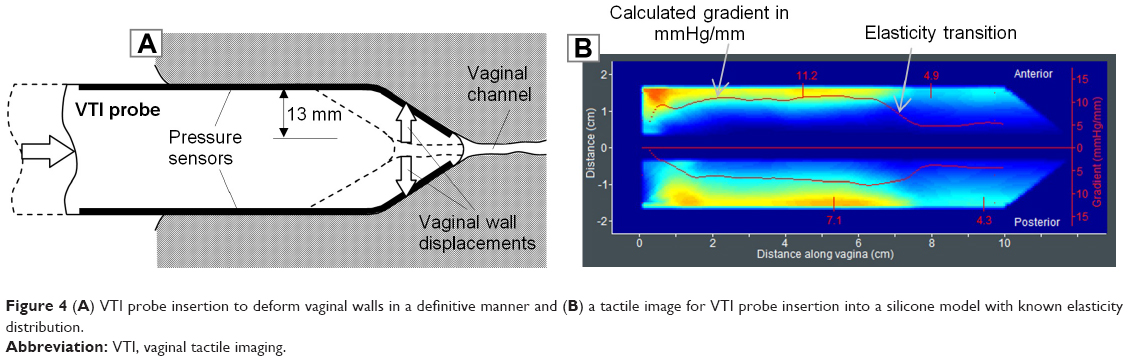 | Figure 4 (A) VTI probe insertion to deform vaginal walls in a definitive manner and (B) a tactile image for VTI probe insertion into a silicone model with known elasticity distribution. |
During the clinical examination, before the probe insertion, the anterior and posterior vaginal walls are almost in contact with each other when a patient is in a relaxed condition in the dorsal position. The internal pressure along the vaginal channel is close to zero. During the VTI probe insertion, the probe itself finds equilibrium from two opposite sides (anterior vs posterior) and an operator allows the probe to follow the insertion angle offering the least resistance along the vaginal channel. The probe insertion can be completed in <10 seconds and the operator observes an acquired tactile image in real time. If the composed image has some obvious distortions or is incomplete, the insertion test must be repeated to get a consistent pattern.
Figure 5 shows two clinical examples for strong tactile response (Figure 5A) and much softer vaginal tissue (Figure 5B). Locations of specific pelvic floor structures are marked on these images. The tactile image for this test characterizes the vaginal tissue elasticity behind the vaginal walls at a distance comparable with the value of the tissue deformation (2–10 mm). The vaginal wall itself seems significantly softer than the structures we observe deeper beneath the wall. Specifically, from left to right, in the anterior vaginal compartment, we see responses from the pubic bone, the urethra, the “zone of critical elasticity” (ZCE), and the cervix.6–9 In the posterior compartment, from left to right, the responses are observed from a perineal body (PB); the levator ani muscles and levator plate (LP) are present (Figure 5A). Most likely, the puborectal muscle (PRM) is the dominant muscle observed in the levator ani muscle zone. White dotted lines in Figure 5A and B are spatial pressure gradients calculated from the center of the vaginal channel in the anterior and posterior directions.
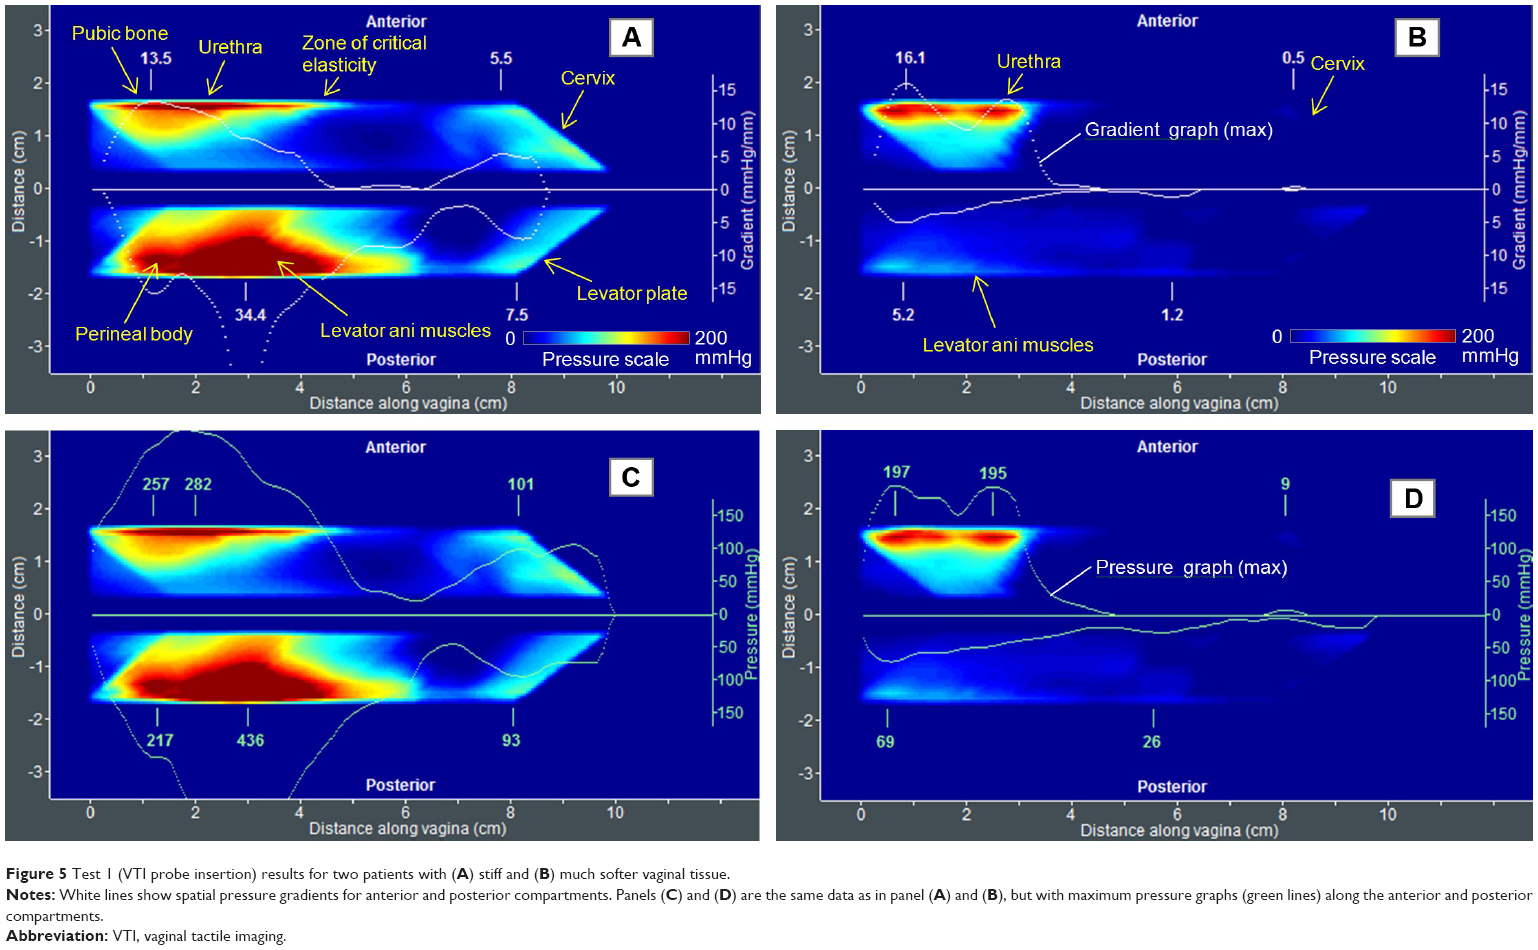 | Figure 5 Test 1 (VTI probe insertion) results for two patients with (A) stiff and (B) much softer vaginal tissue. |
The tactile image in Figure 5B demonstrates a relatively low pressure gradient (up to 5.2 mmHg/mm) for the posterior compartment vs 34.4 mmHg/mm for the left image shown in Figure 5A. These gradient values may be interpreted as vaginal tissue elasticity within 10–15 mm from the vaginal walls. Changes in the vaginal wall tissue, such as surgical scar tissue or vaginal atrophy, can be observed. An anatomic factor may also contribute to this image; for example, an enlarged vaginal hiatus size will show a low pressure gradient at the entrance (the first 2–3 cm). However, as the VTI probe moves deeper into the vagina, the probe pushes apart the anterior and posterior vaginal walls simultaneously and records the pressure response from their displacements. The pressure responses (see the pressure graphs along anterior and posterior compartments in Figure 5C and D) are proportional to the tissue resistance due to the deformation of the vaginal walls at probe insertion; they (pressure responses) also reveal the distribution of the vaginal tissue elasticity. A weak signal from the cervix, in the case in Figure 5B compared to the case in Figure 5A, may characterize weak (laxity) conditions of uterosacral ligament (USL)/cardinal ligaments (CLs).
Test 1 may allow assessment of the following:
- vaginal tissue elasticity distribution (∂P/∂y) along the anterior and posterior compartments. The elasticity values are captured from multiple layers composed of the vaginal wall and structures behind the vaginal wall at a depth of up to 2–10 mm;
- strength (P) and, possibly, elasticity (∂P/∂y) of urethra (U) in distal anterior;
- strength (P) and elasticity (∂P/∂y) of the ZCE in mid-anterior;
- strength (P) and elasticity (∂P/∂y) of the USL/CL in apical anterior and posterior;
- strength (P) and elasticity (∂P/∂y) of PB in distal posterior;
- rest tone (P) and elasticity (∂P/∂y) of levator ani muscles and, possibly, PRM in mid-posterior;
- strength (P) of LP in apical posterior; and
- hiatus strength as combined distal anterior and posterior pressure (P).
Clinical value of Test 1:
- detection of defects in the vaginal wall and underlying structures, PB, PRM, LP and USL/CL;
- comparative analysis of vaginal elasticity changes after applied treatment (surgery,25 physiotherapy, RF, or laser procedures26); and
- scar detection and characterization of ZCE for urinary incontinence diagnosis (tethered vagina syndrome).
- Characterization of postpartum pelvic floor remodeling.
Test 2: probe elevation
The vaginal probe elevation test is shown in Figure 6A. It allows acquisition of tactile feedback from the pelvic floor structure, at a 15–40 mm depth, under significant tissue deformation for the anterior and posterior vaginal compartments. The probe has an orientation sensor to measure an elevation angle, such that the pressure feedback may be mapped along the elevation angle as shown in Figure 6B. The up and down elevation of the probe is advised relative to the hymen.
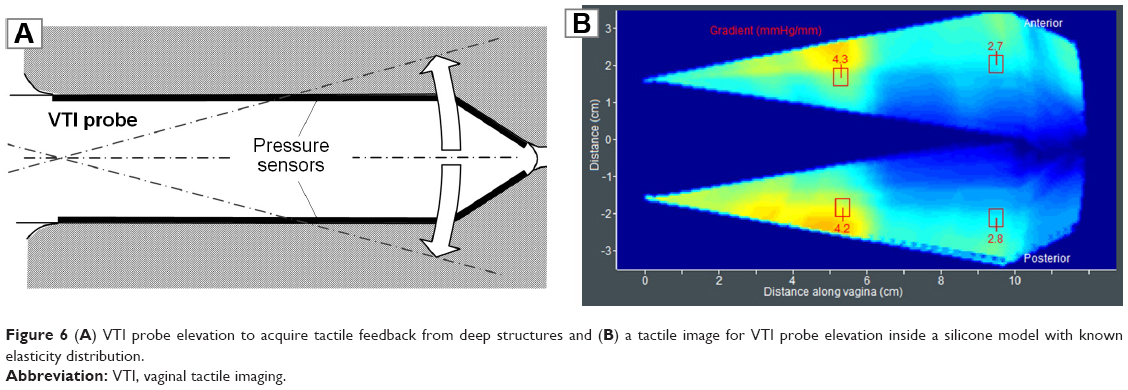 | Figure 6 (A) VTI probe elevation to acquire tactile feedback from deep structures and (B) a tactile image for VTI probe elevation inside a silicone model with known elasticity distribution. |
Figure 7 presents two clinical cases, A and B. Locations of specific pelvic floor structures are marked on these images. The upper panel presents the tactile images, and the lower panel the gradient images calculated from these tactile images. The spatial pressure gradients (mmHg/mm) were calculated from the center horizontal vaginal line to the anterior (vertical) and from the center horizontal vaginal line to the posterior compartment. In the anterior compartment, from left to right, we noted tactile responses from the pelvic bone, the urethra, and the cervix (see upper panel in Figure 7A). In the posterior compartment, from left to right, we found tactile responses from puboperineal muscle (PPM), PRM, puboanal muscle (PAM), and pubovaginal muscle (PVM), which are parts of the pubovisceral (pubococcygeal) muscle, the iliococcygeal muscle (ICM), as well as the LP.6–8
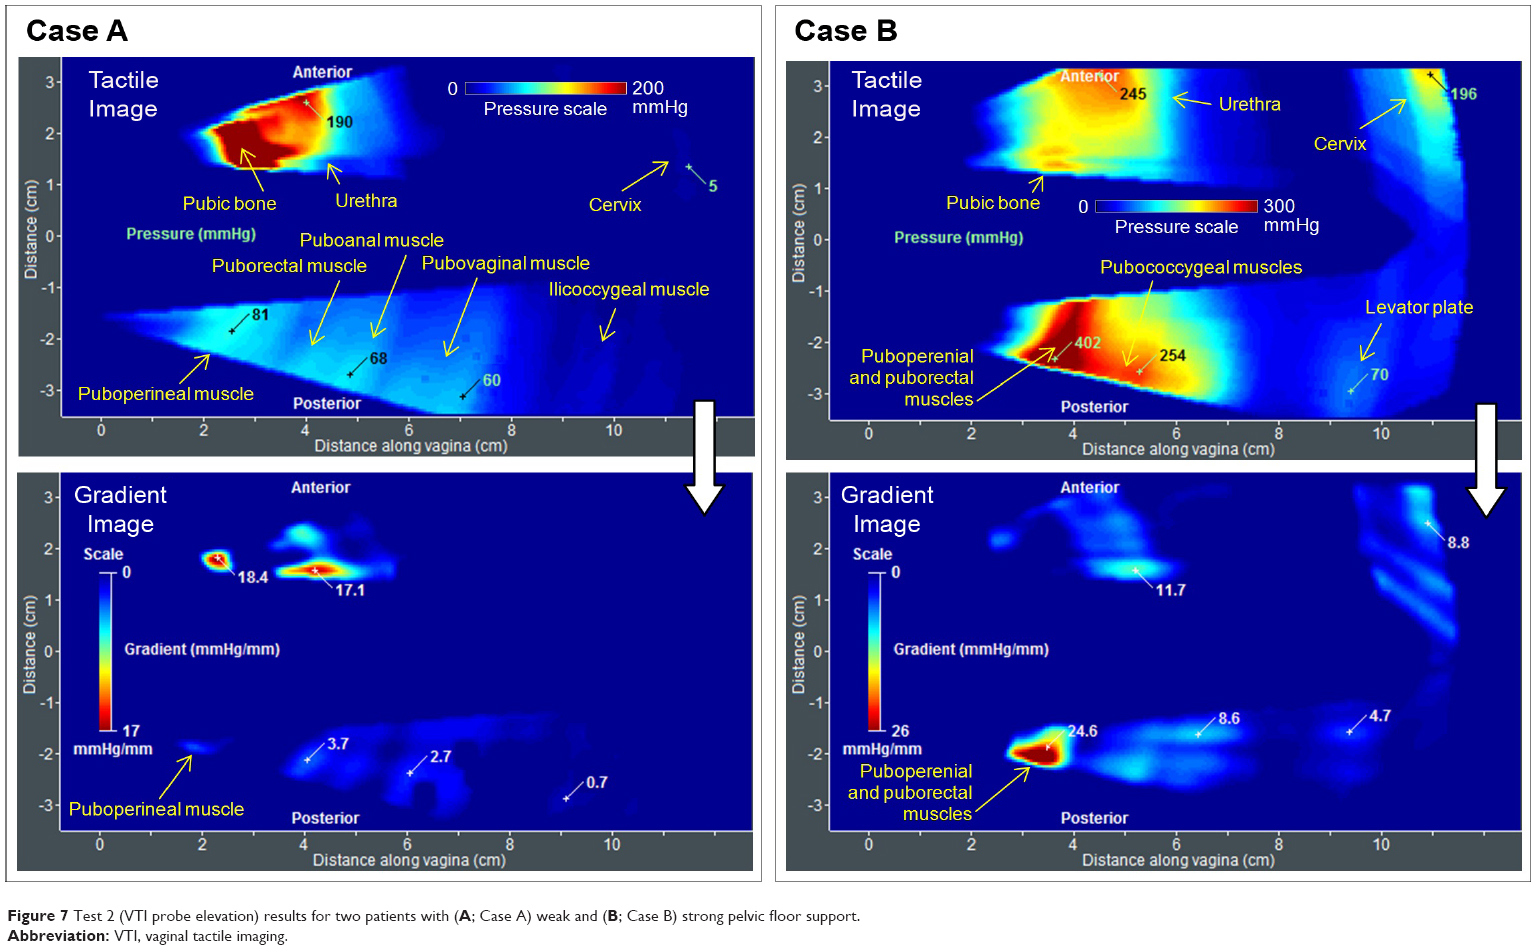 | Figure 7 Test 2 (VTI probe elevation) results for two patients with (A; Case A) weak and (B; Case B) strong pelvic floor support. |
The pressure feedback values at the selected locations in tactile images (upper panels in Figure 7) and the pressure gradients (bottom panels) are relatively smaller (P=60–81 mmHg and ∂P/∂y =0.7–3.7 mmHg/mm in the posterior compartment) than they are in case B (P=254–402 mmHg and ∂P/∂y =4.7–24.6 mmHg/mm in the posterior compartment). The gradient values for the posterior compartment may be interpreted as pelvic floor support conditions, because they characterize the capability of the pelvic floor support structures to resist applied deformation, which is higher (up to 40 mm) than that in Test 1. The softer the tissues, the deeper the structures visualized by the VTI probe, because these softer tissues may be deformed more with weaker response to reveal a support if available. Possibly, the PUL and the arcus tendineus fascia pelvic ligament also contribute to the tactile response at full posterior deformation, in addition to the muscles listed in the upper panel of Figure 7A.
These test results correlate with the pelvic floor conditions, demonstrating pressure as well as gradient decreases from normal to prolapse Stage III conditions.27,33,34 The VTI enables quantification of the vaginal tissue elasticity and the strong differentiation between normal, Stage II, and Stage III prolapse conditions. The overlap in tissue elasticity and pelvic floor support between normal and Stage I prolapse conditions means that 1) some cases under Stage I prolapse show the same values as in normal conditions or 2) the normal case, as defined by the POP-Q system, with lower pressure feedbacks and gradients, is already in the range of Stage I prolapse. In other words, the lower level of the normality range with the decreased numbers may enable the detection of preprolapse conditions that require attention to delay the development of anatomically not observable prolapse conditions.32 Pelvic floor reconstructive surgery also changes the tactile image as well as the gradient values at specific locations.25
Test 2 may allow assessment of the following:
- strength (P) of pelvic floor support structures along the posterior compartment;
- elasticity (∂P/∂y) of urethra (U) in the distal anterior;
- elasticity (∂P/∂y) of the USL/CL in apical anterior;
- elasticity (∂P/∂y) of the PRM, PAM, and PVM, and ICM; and
- elasticity (∂P/∂y) of the LP.
The clinical value of Test 2 lies in the following advantages:
- detection of defects in the pelvic floor support structures including PRM, PAM, PVM, ICM, and USL/CL;
- comparative analysis of pelvic floor support after applied treatment; and
- characterization of postpartum pelvic floor remodeling.
Test 3: probe rotation
The vaginal probe being rotated, as shown in Figure 8A, allows acquisition of circumferential tactile feedback from the vaginal walls. The probe has an orientation sensor to measure its rotational angle, such that the pressure feedback may be mapped along the rotation angle, as shown in Figure 8B, for both left and right sides. It is recommended that the VTI probe be rotated slowly for better control of the image quality on the VTI computer display. The vaginal walls are deformed up to 7 mm during the VTI probe rotation.
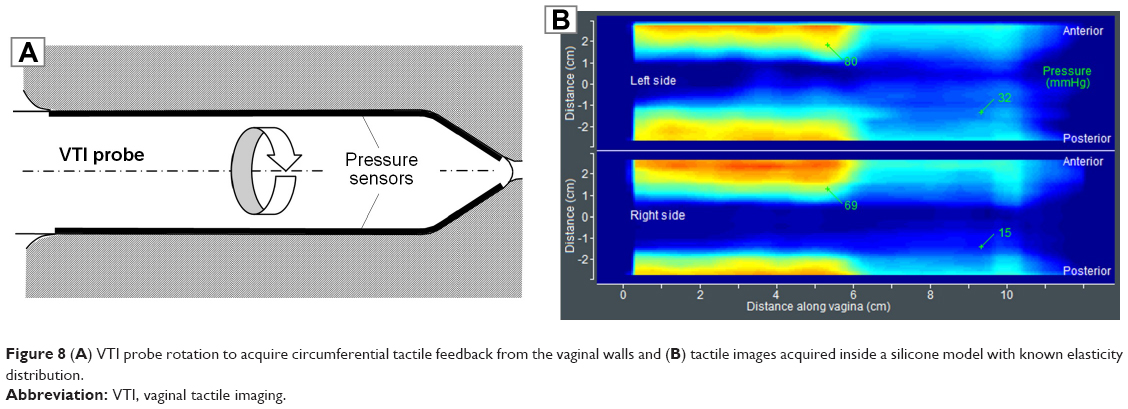 | Figure 8 (A) VTI probe rotation to acquire circumferential tactile feedback from the vaginal walls and (B) tactile images acquired inside a silicone model with known elasticity distribution. |
Figure 9 presents two clinical cases, both with normal pelvic floor support, one of them (A) with strong pressure feedback at the center of left and right sides at the distal part (P=133–168 mmHg) and the other (B) with relatively low values at the same locations (P=11–76 mmHg). Any local pressure peaks at the vaginal sides may be interpreted as stiff irregularities or lumps on the vaginal wall or behind it at a depth of 0–7 mm. The vaginal width definitely contributes to the tactile feedback at the center of both the sides when the probe is oriented horizontally, such that the right side is exactly imaged vs the left side. Asymmetry in pressure patterns on one side vs the other side conveys information about the asymmetry in pelvic floor structures behind the vaginal walls. Cumulative (integral) contact pressure inside the vagina characterizes a “vaginal strength”.
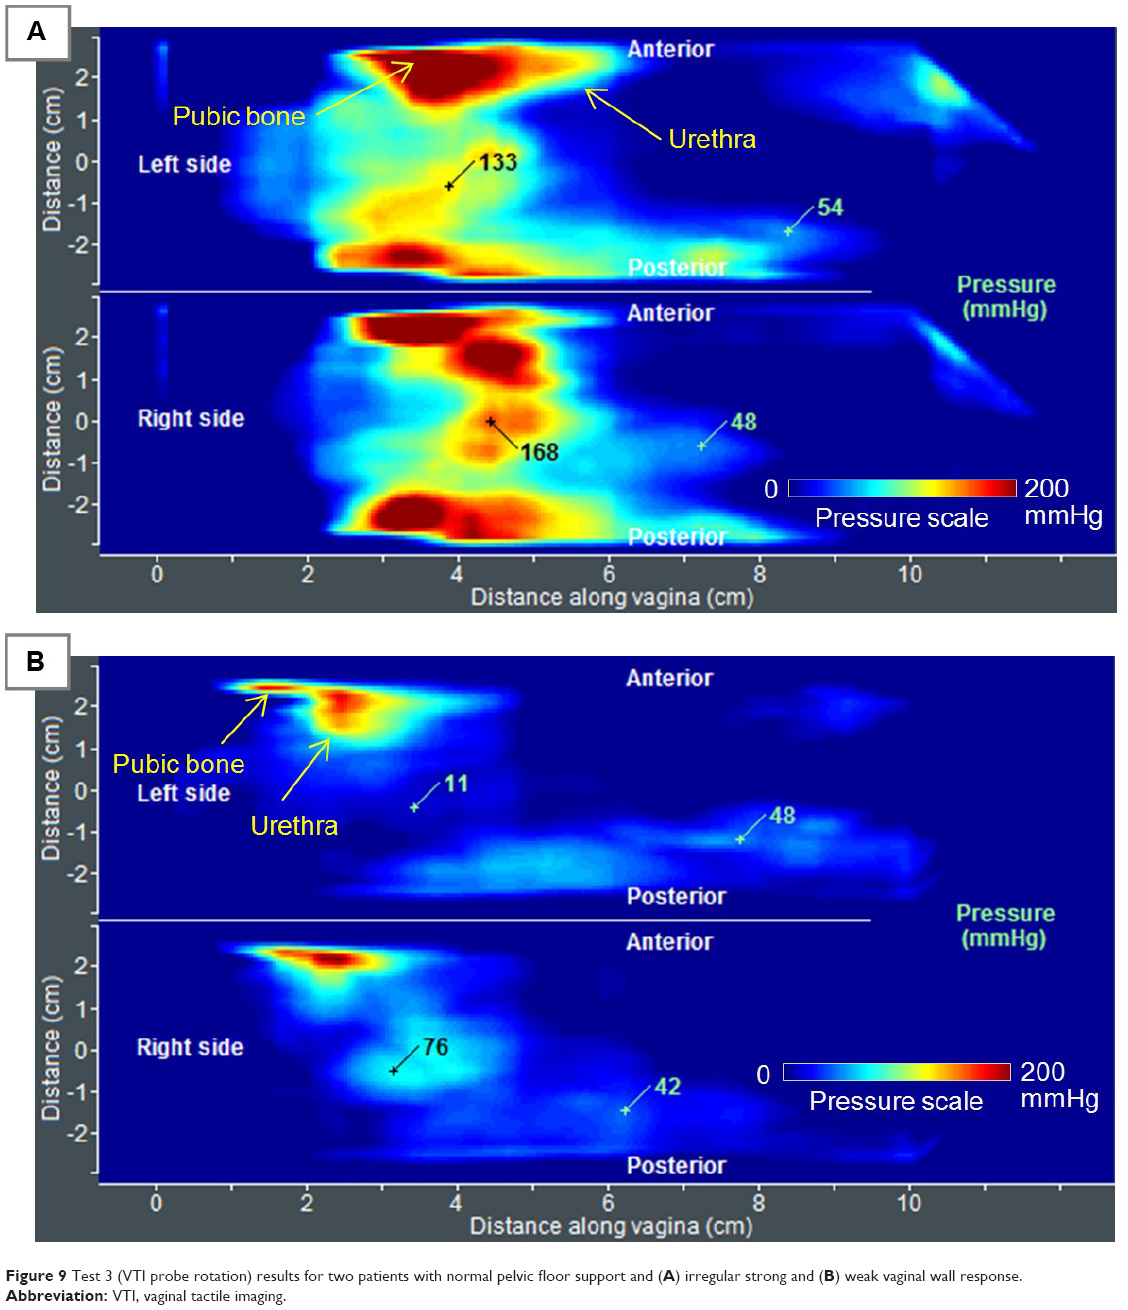 | Figure 9 Test 3 (VTI probe rotation) results for two patients with normal pelvic floor support and (A) irregular strong and (B) weak vaginal wall response. |
We found the pressure maximum at both sides (Pmax), as shown in Figure 9, correlated with the pelvic floor conditions, demonstrating Pmax decrease from normal to prolapse conditions.27 Pelvic floor reconstructive surgery may also change the tactile image of this test at the affected locations.
Test 3 will allow the assessment of the following:
- irregularities on the vaginal walls along the entire vagina as pressure peak value (P) and its size;
- asymmetry in pelvic floor structures behind the vaginal walls; and
- cumulative (integral) contact pressure inside the vagina (“vaginal strength”).
The clinical value of Test 3 lies in the following:
- irregularities detection/characterization on vaginal walls;
- monitoring of vaginal wall changes after applied treatment; and
- postpartum vaginal wall changes.
Test 4: Valsalva maneuver
Figures 10–13 present the VTI data observed during Valsalva maneuver for a patient with normal pelvic floor support (Figures 10 and 11) and with a prolapse (Figures 12 and 13).
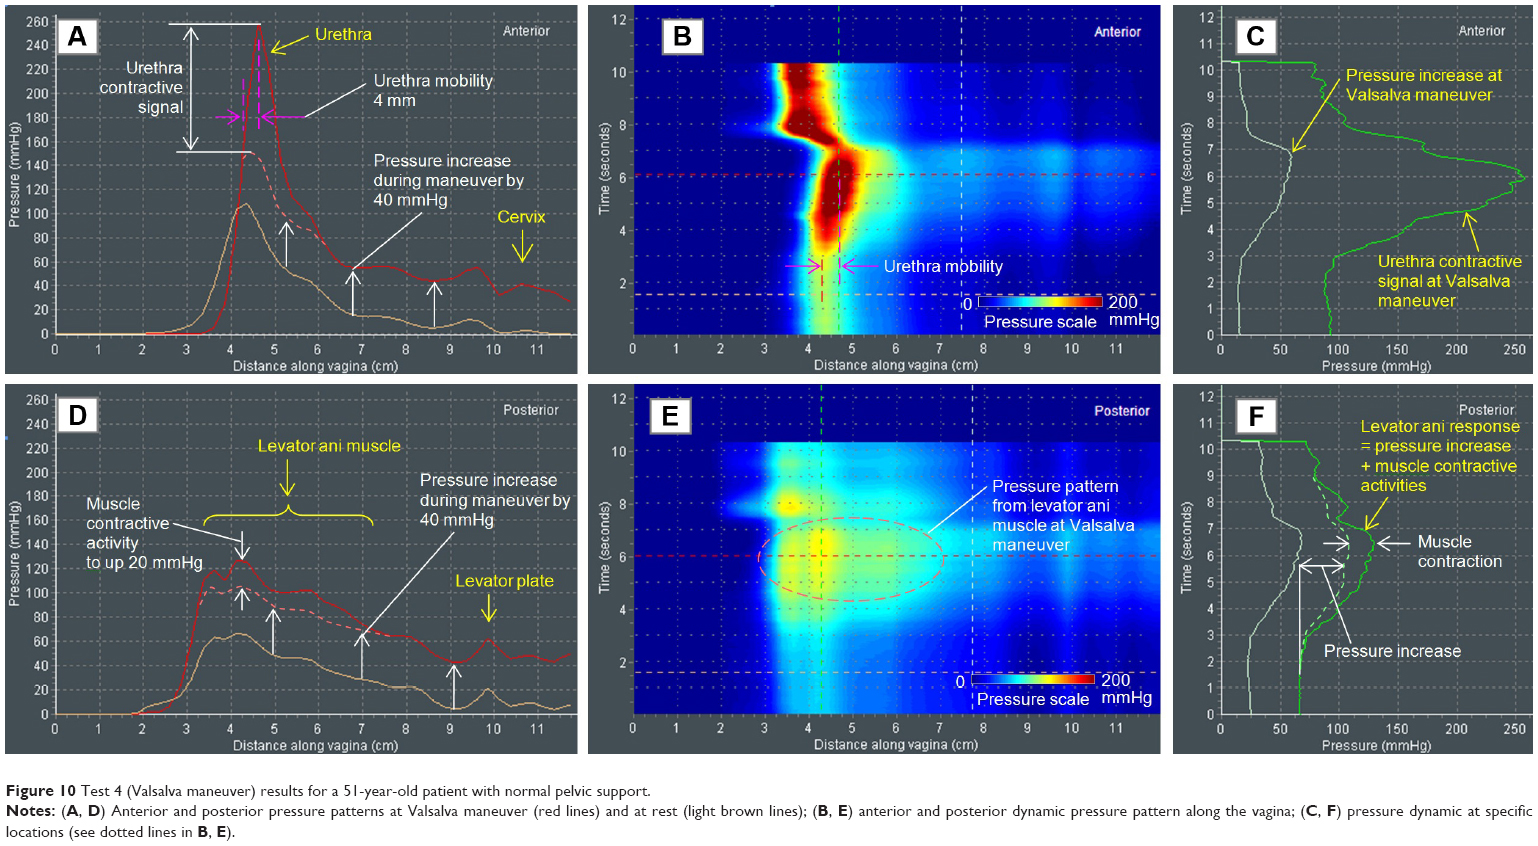 | Figure 10 Test 4 (Valsalva maneuver) results for a 51-year-old patient with normal pelvic support. |
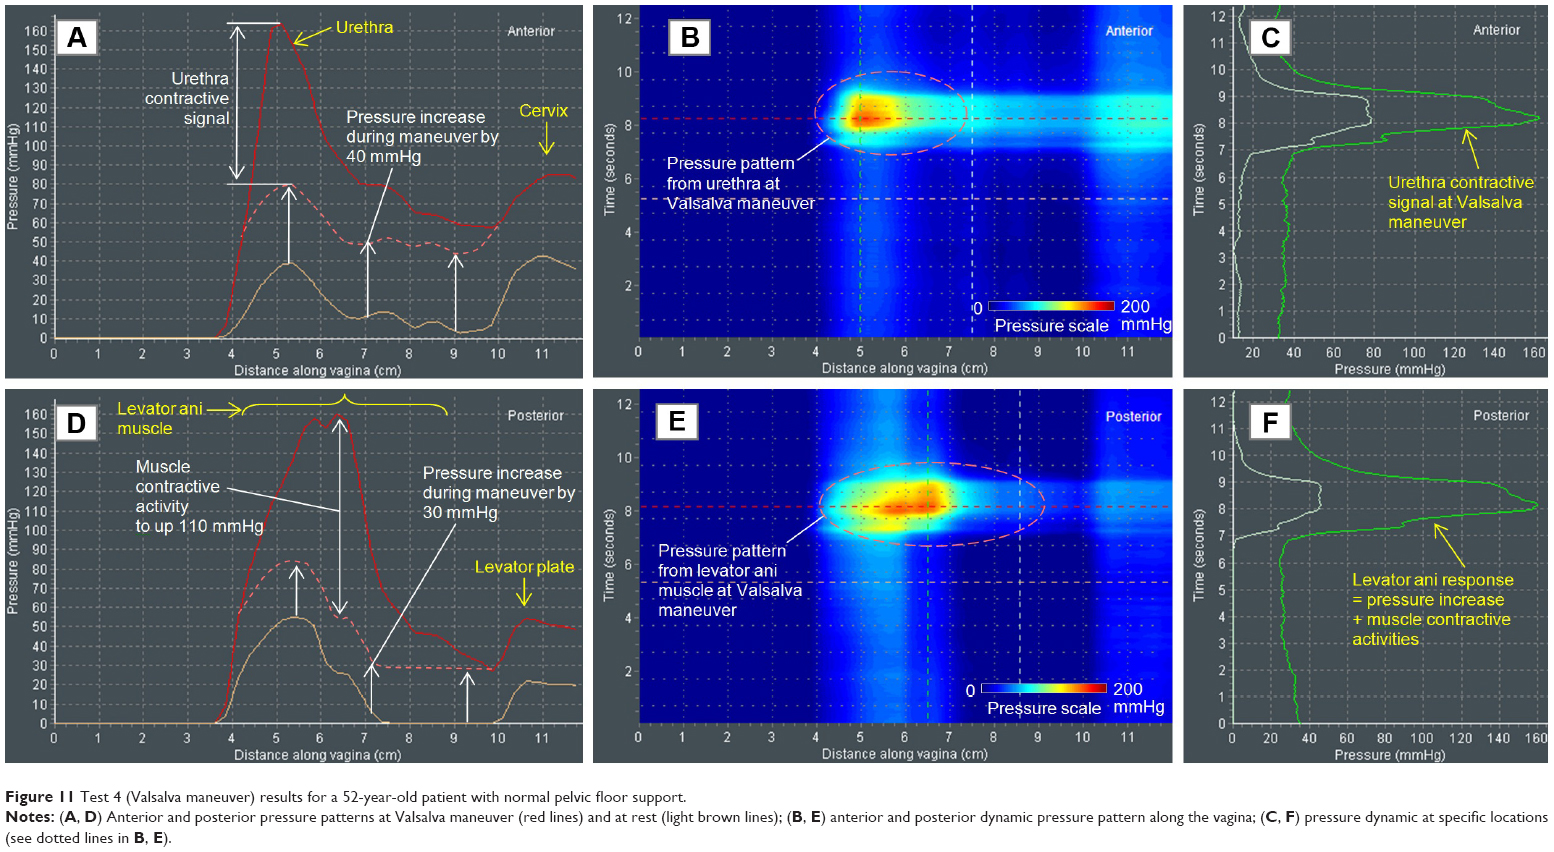 | Figure 11 Test 4 (Valsalva maneuver) results for a 52-year-old patient with normal pelvic floor support. |
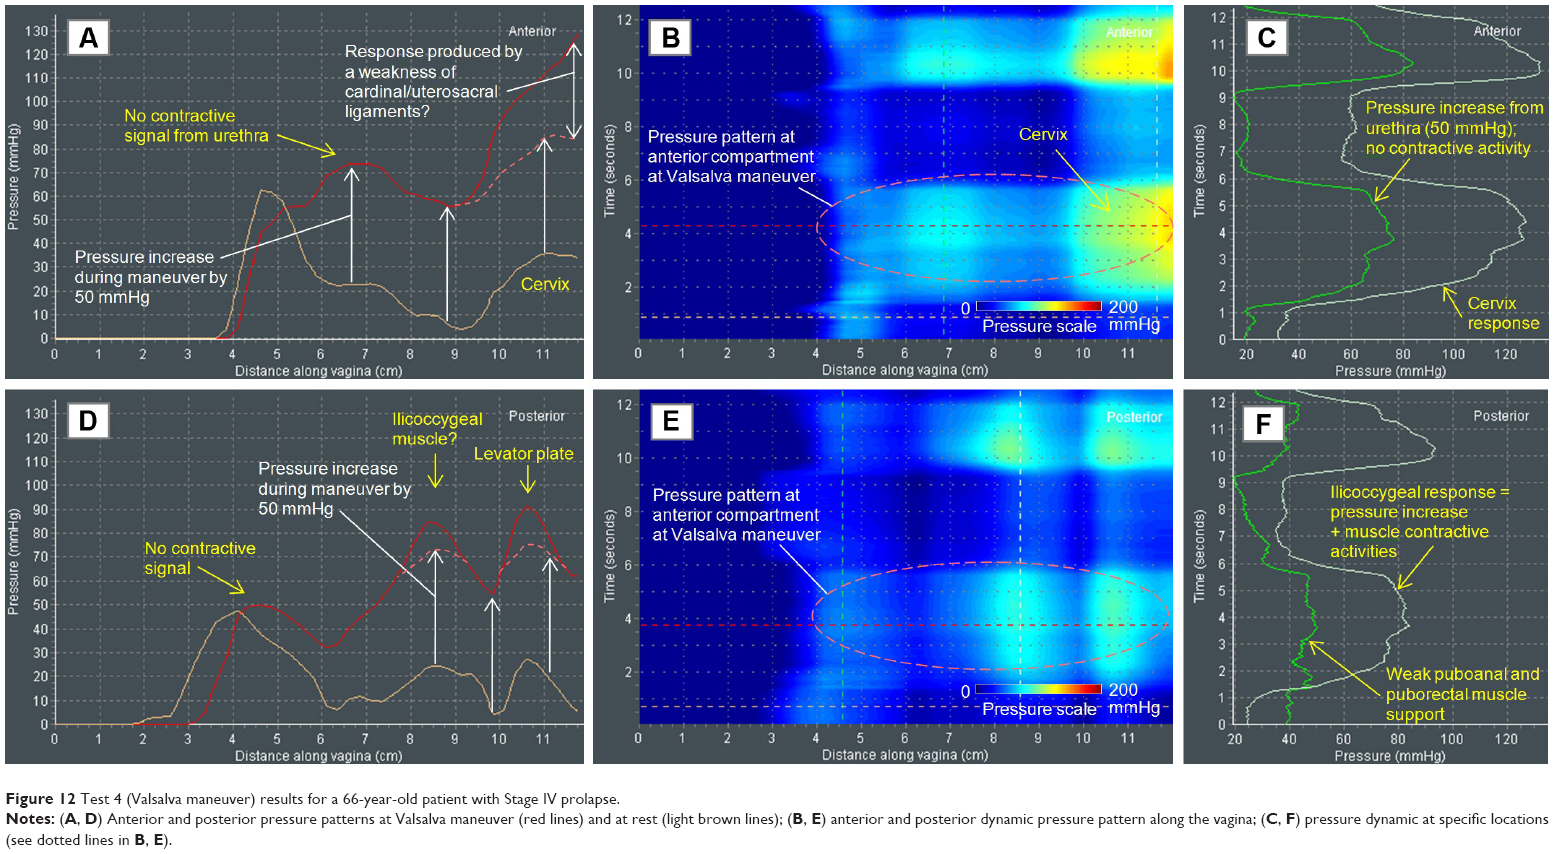 | Figure 12 Test 4 (Valsalva maneuver) results for a 66-year-old patient with Stage IV prolapse. |
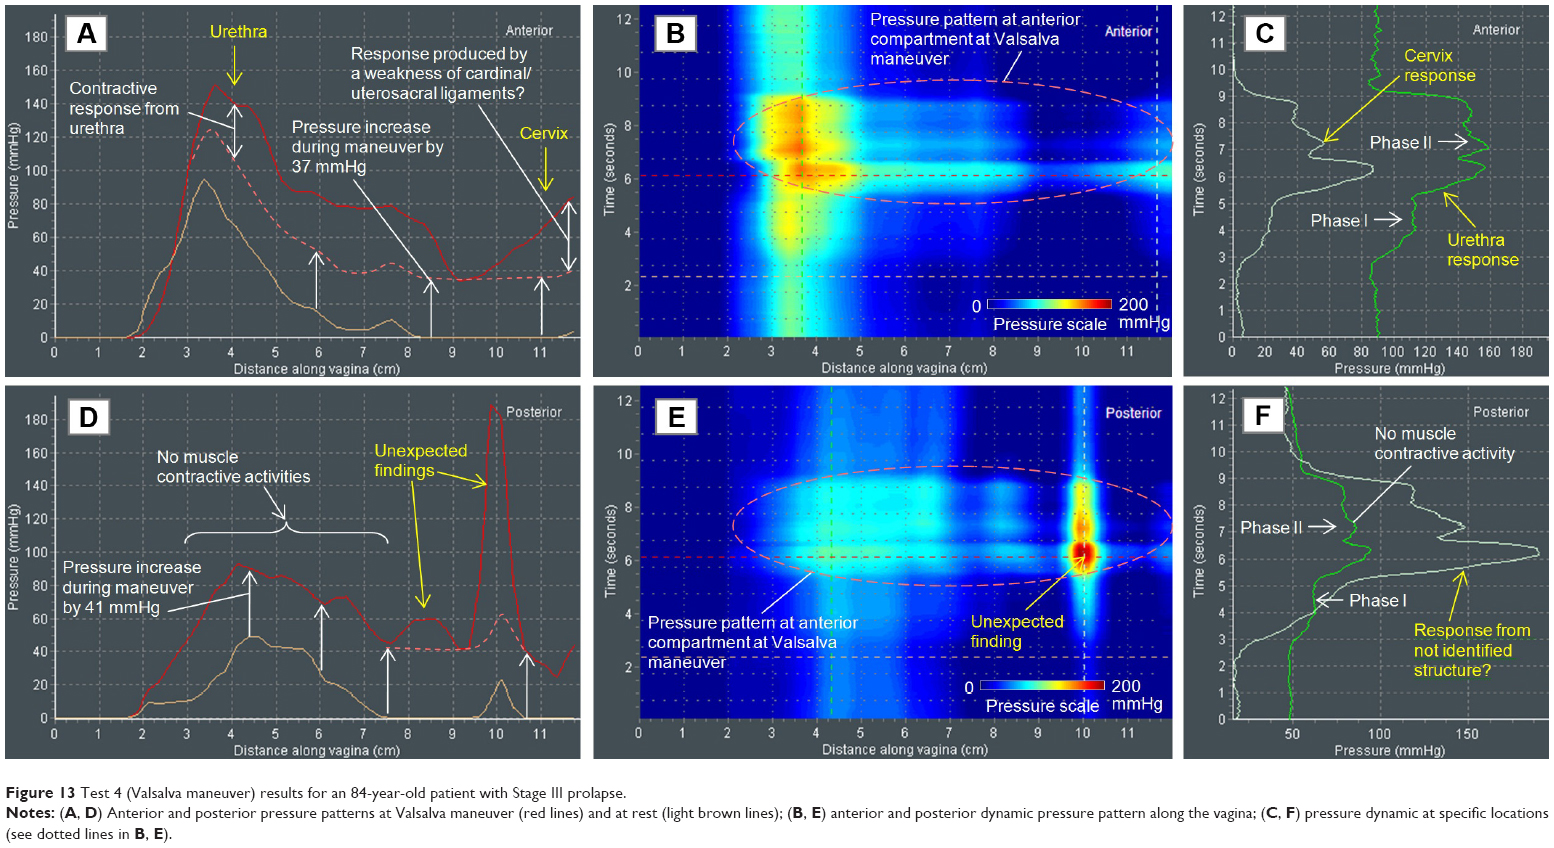 | Figure 13 Test 4 (Valsalva maneuver) results for an 84-year-old patient with Stage III prolapse. |
Two cases with normal pelvic floor support allow measurement of contractive signals from the urethra (Figures 10A and C and 11A and C) and mobility of the urethra. The first case shows a 4 mm displacement (Figure 10A) and the second shows no displacement (Figure 11A and B). Further, we observe a relatively uniform pressure increase under the Valsalva maneuver along the entire vagina in the anterior and posterior compartments (Figures 10A and D and 11A and D). The cervix fixation by USL/CL is strong because no additional pressure signals except for the uniform pressure increase have been detected. Contractive signal amplitude and width of the levator ani muscle (Figures 10D and 11D) are also measurable. The pressure response dynamics has a single-phase response during the Valsalva maneuver in the posterior compartment (Figures 10F and 11F).
Two cases with pelvic floor prolapse conditions allow detection of contractive signals from the urethra: weak contractive signals at Stage III prolapse (Figure 13A and C) and no contractive signal at Stage IV prolapse (Figure 12A and C). These cases demonstrate weak mobility at Stage III prolapse (Figure 13A and B) and no urethral mobility at all at Stage IV prolapse (Figure 12A and B). While a uniform pressure increase (transference) under Valsalva maneuver is also observed along the entire vagina in the anterior and posterior compartments (Figures 12A and D and 13A and D), in patients with prolapse, there is a very different pattern. In patients with normal support, the majority of pressure increases are carried by the distal vaginal regions, consistent with the supportive pelvic floor muscles. In patients with prolapse, there is a widened pressure distribution observed in the mid-to-upper vagina, with these areas being subject to increased pressures than that in a patient with normal support.
From the presented data, we may conclude that the cervix has a weak fixation by USL/CL because of additional pressure signals above the uniform pressure increase (Figure 12B). Absence of contractive signals is found from the levator ani muscle (Figures 12D and 13D). A two-phase response at Valsalva maneuver is observed in the posterior compartment (Figures 12F and 13F). Finally, unexpected findings (pressure pikes) are detected as shown in Figures 12D and 13F, which require additional consideration and interpretation based on patient history.
Test 4 (Valsalva maneuver) will allow assessment of the following:
- contractive capability (P) of the urethra (U);
- mobility of the urethra (U);
- uniform pressure increase (P) under along the entire vagina in anterior and posterior compartments;
- cervix fixation by USL/CL;
- contractive strength and width of levator ani muscles;
- two- or single-phase response in the posterior compartment; and
- irregular structures by unexpected pressure pikes (P).
The clinical value of Test 4 lies in the following:
- detection of defects in urethra (U);
- conditions/strength of USL/CL;
- contractive phases, strength, and width of levator ani muscles; and
- detection of structure irregularities in the posterior compartment.
Tests 5 and 6: voluntary muscle contraction
Figures 14–17 show the VTI data for a patient with normal pelvic floor support (Figures 14 and 15) and with Stage II prolapse (Figures 16 and 17) during voluntary pelvic floor muscle contractions.
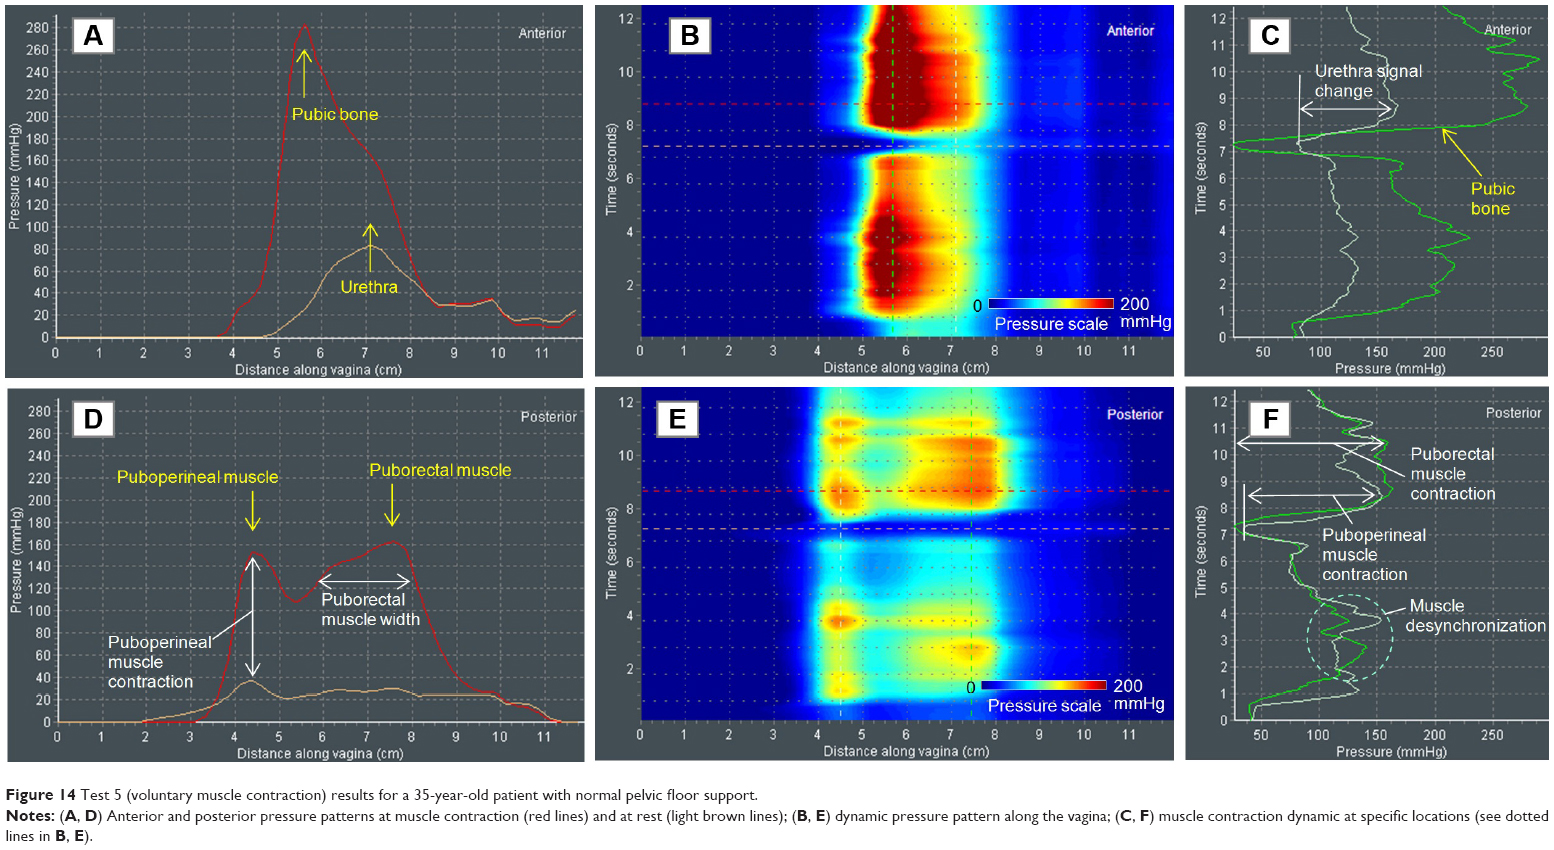 | Figure 14 Test 5 (voluntary muscle contraction) results for a 35-year-old patient with normal pelvic floor support. |
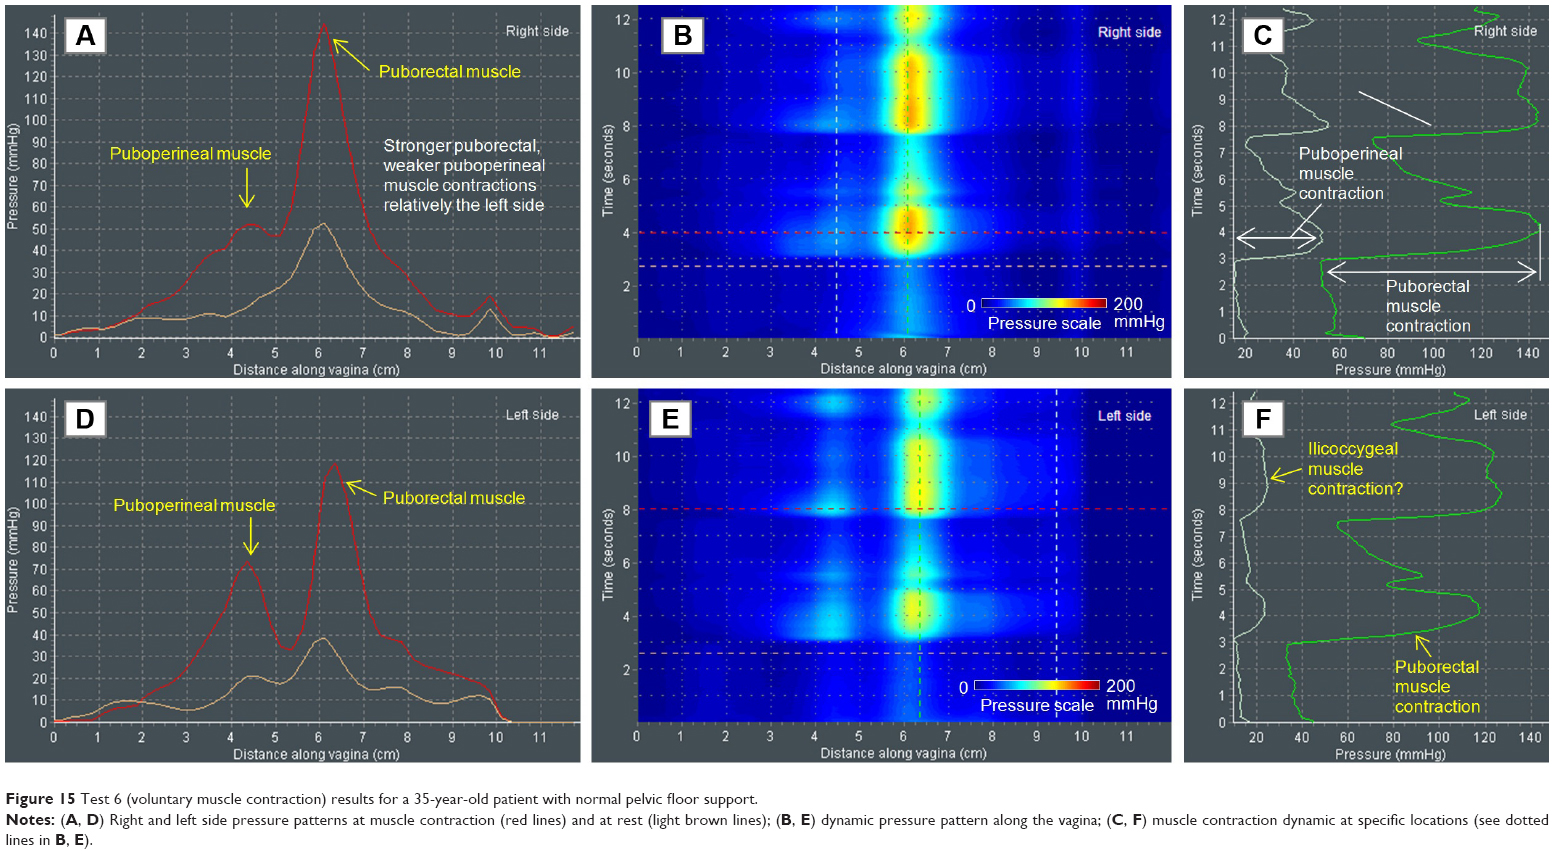 | Figure 15 Test 6 (voluntary muscle contraction) results for a 35-year-old patient with normal pelvic floor support. |
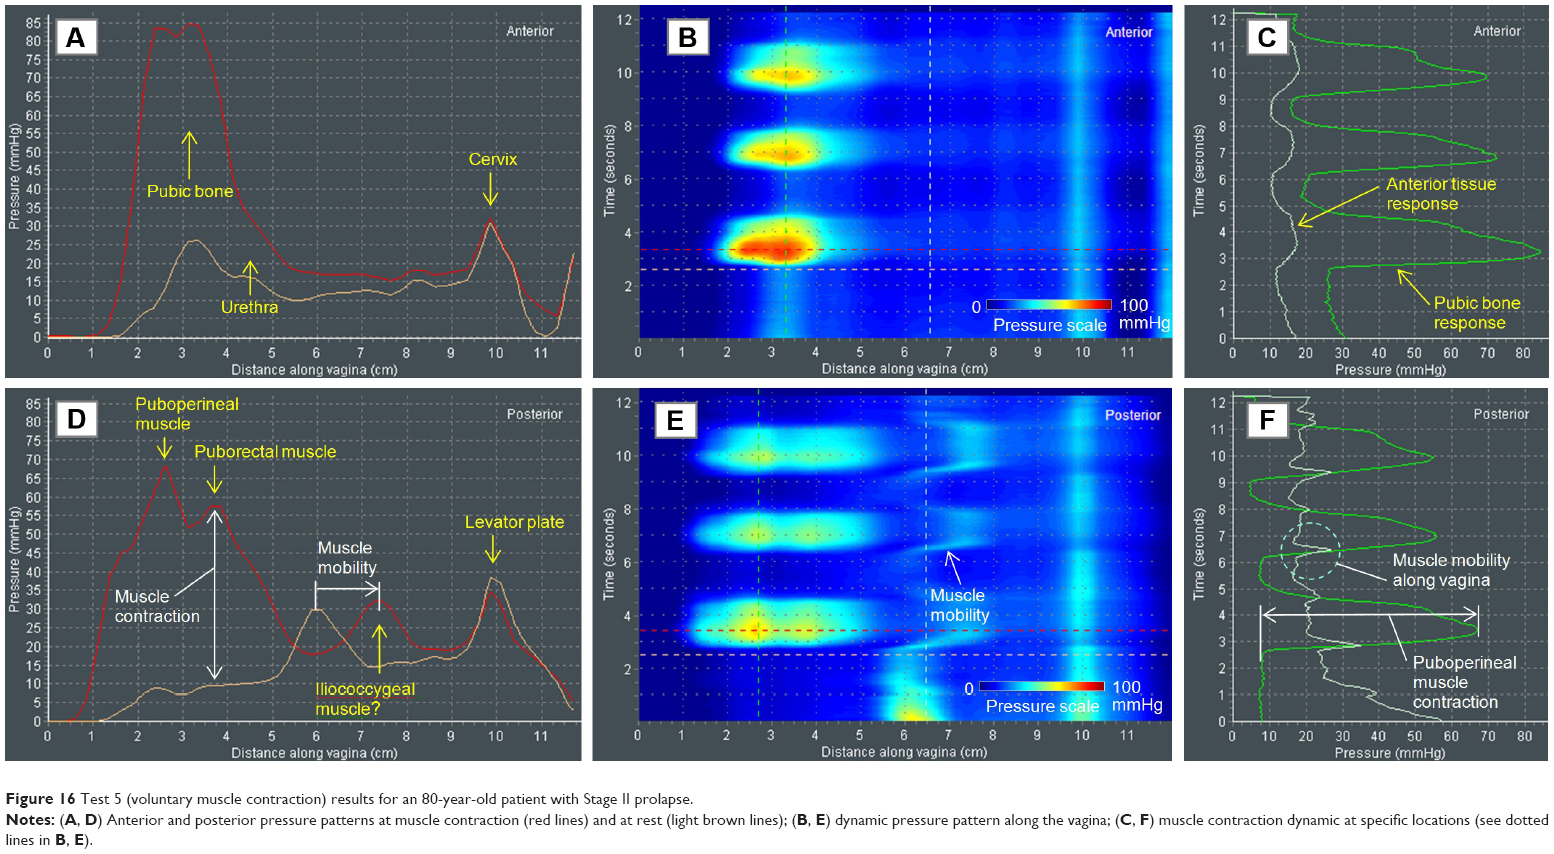 | Figure 16 Test 5 (voluntary muscle contraction) results for an 80-year-old patient with Stage II prolapse. |
 | Figure 17 Test 6 (voluntary muscle contraction) results for an 80-year-old patient with Stage II prolapse. |
Data are presented for two vaginal probe orientations, anterior vs posterior (vertical probe orientation, Figures 14 and 16) and left vs right (horizontal probe orientation, Figures 15 and 17). The case with normal pelvic floor support reveals two posterior peaks (Figure 14D and E) at pelvic muscle contractions; it seems that these peaks are produced by PPM and PRM. Their MS is estimated as the pressure during the muscle contraction (Figure 14F). In the anterior compartment, the pressure response from urethra is detectable (Figure 14A and C). Figure 14F shows an example of PPM–PRM desynchronization in part (not full synchronization at contraction). Both left and right vaginal sides present two peaks identified as PPM and PRM contractions (Figure 15). The left side has stronger PRM and weaker PPM contractions relative to the right side (compare Figure 15A and D). It seems that we can also observe ICM contraction (Figure 15F).
The muscle contraction patterns in the second case with Stage II prolapse (Figures 16 and 17) are significantly different than for normal pelvic floor conditions. The muscle contraction amplitudes at the prolapse are about 40%–60% less than at normal conditions. We observe the posterior muscle mobility along the vagina (at mid-vagina), about 15 mm in the apical direction (Figure 16D and F). This case also revealed two posterior peaks (Figure 16D and E) at pelvic muscle contractions produced by the PPM and PRM. In the anterior compartment, the pressure response from the urethra is hardly detectable (Figure 16), but we see pressure response at muscle contraction from the posterior mid-vaginal tissue (Figure 16C). Figure 16F shows that the posterior muscle displacement begins at the initial stage of pelvic muscle contraction. Both left and right vaginal sides present one basic peak identified as the pubococcygeal (pubovaginal) muscle contraction (Figure 17). The left side also demonstrates some puborectal contractive activity (Figure 17D). For both the left and right sides, we observe that a full synchronization for PVM and PRM does not occur (Figure 17F); the pubovaginal contraction consists of two phases, primary peak and secondary at about 60% of amplitude; however, the pubovaginal contractive signal does not have such a significant decrease at the second contraction phase.
Tests 5 and 6 (voluntary muscle contraction) will allow assessment of the following:
- PPM, PRM, PVM, and ICM strength;
- contractive capability (P) of the urethra (U);
- contractive desynchronization or not full synchronization among levator ani muscles;
- muscle asymmetry (left vs right) in levator ani muscles (weakness or avulsion);
- muscle mobility along the vagina in the mid-posterior compartment;
- contractive width of levator ani muscles; and
- multiphase muscle contraction.
The clinical value of Tests 5 and 6 lies in their following characteristics:
- detection of defects in pelvic floor muscle PPM, PRM, PVM, ICM;
- contractive capability of the urethra (U);
- comparative analysis of pelvic floor MS after pelvic floor treatment;
- muscle characterization of postpartum pelvic floor remodeling;
- muscle changes with lifestyle: sport, military load influence, and so on; and
- muscle changes with age.
Test 7: involuntary muscle relaxation
Figures 18 and 19 show the VTI data during involuntary pelvic muscle relaxation for a patient with normal pelvic floor support (Figure 18) and with Stage II prolapse (Figure 19).
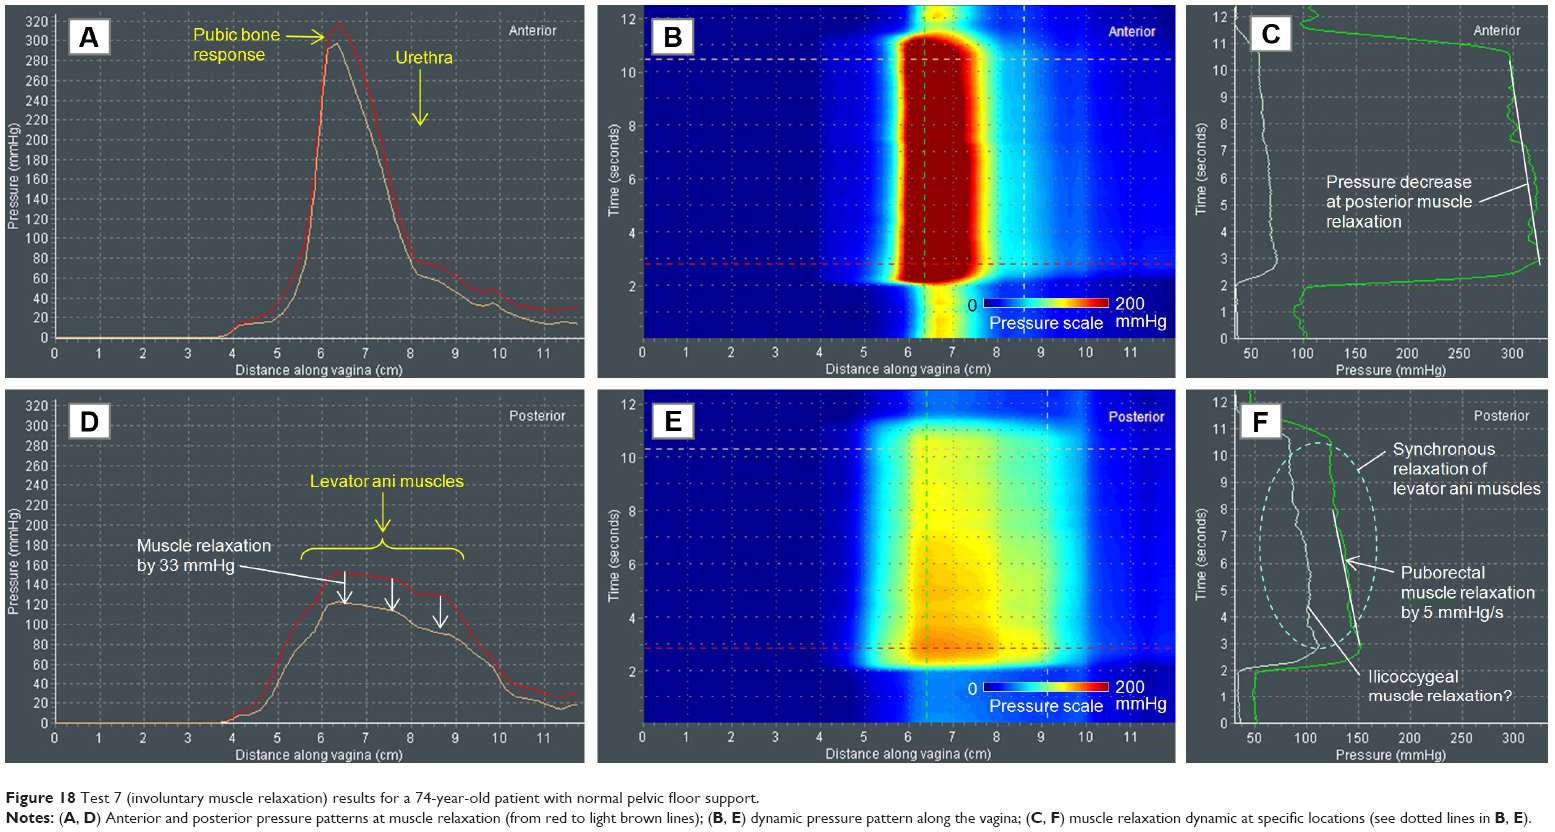 | Figure 18 Test 7 (involuntary muscle relaxation) results for a 74-year-old patient with normal pelvic floor support. |
 | Figure 19 Test 8 (involuntary muscle relaxation) results for a 71-year-old patient with Stage II prolapse. |
For this test, a patient is instructed to perform a pelvic floor muscle contraction or Kegel and urged to hold the contraction as long as possible.
The normal pelvic floor support case demonstrates 1) pelvic muscle relaxation rate (MRR) of 5 mmHg/s (Figure 18F), 2) one-stage muscle relaxation (Figure 19F), and 3) uniform relaxation for levator ani muscles by 33 mmHg (Figure 18D).
Under Stage II prolapse, we observe 1) pelvic MRR of 16 mmHg/s, 2) two-stage muscle relaxation (Figure 19F), and 3) nonuniform relaxation for levator ani muscles – PVM relaxed by 70 mmHg, but RPM relaxed by only 34 mmHg (Figure 19D). These two muscles (pubovaginal and puborectal) not only show a distinctive relaxation rate, but also have two separate peaks (Figure 19D and E).
Test 7 (involuntary muscle relaxation) may allow assessment of the following:
- PVM, PRM, and ICM to keep the load measured as the MRR (mmHg/s);
- uniformity/nonuniformity of muscle relaxation; and
- multistage muscle relaxation.
The clinical value of Test 7 lies in the following:
- detection of muscle relaxation defects in PVM, PRM, ICM;
- comparative analysis of pelvic floor MS after pelvic floor treatment;
- muscle characterization of postpartum pelvic floor remodeling;
- muscle changes with lifestyle: sport, military load influence, and so on; and
- muscle changes with age.
Test 8: involuntary muscle contraction (cough)
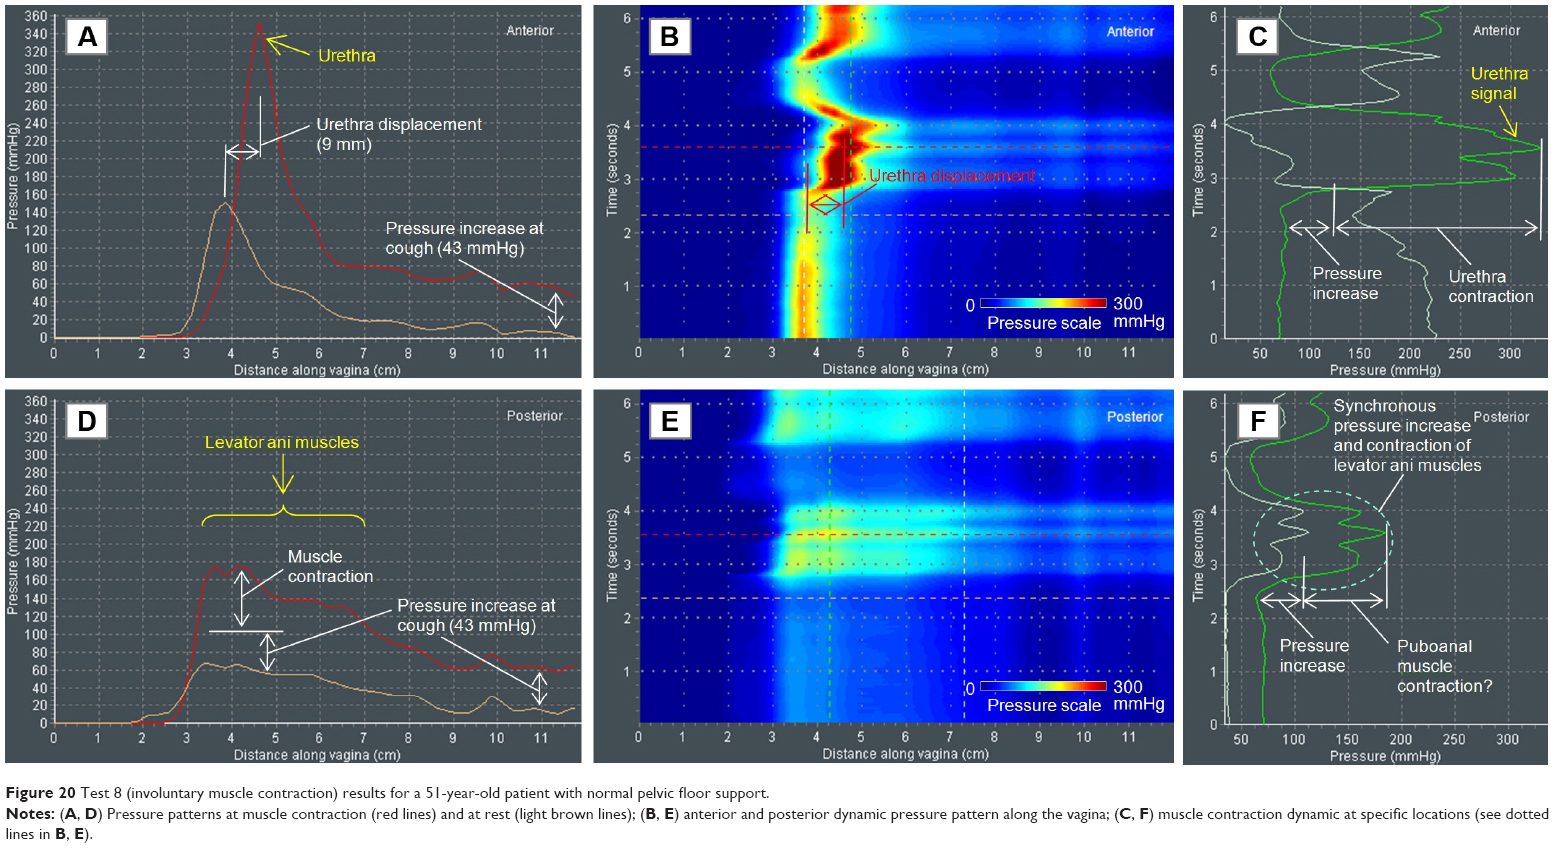
Figures 20 and 21 show the VTI data for a patient with normal pelvic floor support (Figure 20) and with Stage IV prolapse (Figure 21) during involuntary pelvic floor muscle contractions (cough).
 | Figure 20 Test 8 (involuntary muscle contraction) results for a 51-year-old patient with normal pelvic floor support. |
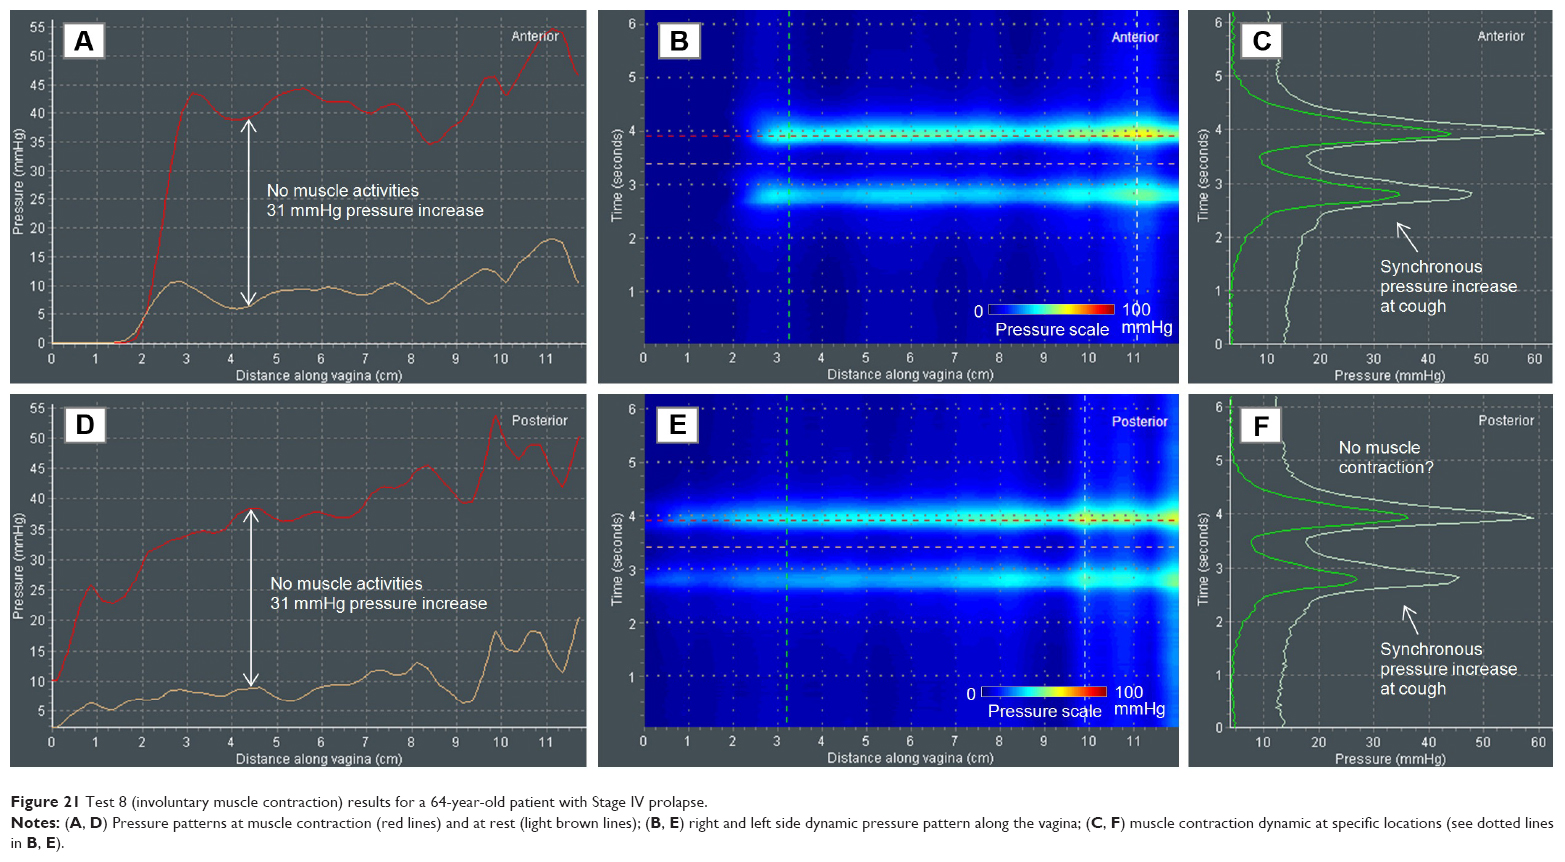 | Figure 21 Test 8 (involuntary muscle contraction) results for a 64-year-old patient with Stage IV prolapse. |
The normal pelvic floor support case reveals a strong signal from the urethra in the anterior (Figure 20A–C) and distributed response from the levator ani contraction (Figure 20D–F) in the posterior compartment at cough. It seems that in both compartments, the VTI probe pressure signals at cough have two components: 1) the first one is produced by pressure increase by 43 mmHg around the vagina and 2) the second one is related to the muscle activities (Figure 20A and D). The pressure increase from urethra (Figure 20C) occurs with a urethra displacement of 9 mm, as observed in Figure 20A and B. The levator ani muscles contract synchronously as seen in Figure 20E, F. Possibly, the strongest contractive signal comes from the PAM (Figure 20F).
The pressure patterns at cough for a patient with Stage IV prolapse are much different from the normal pelvic floor conditions. We find no confirmation of any muscle activities at cough (Figure 21). Instead of localized muscle contraction signals, we observe a uniform and synchronized pressure raise at cough in the anterior and posterior compartments along the entire vagina, with some pressure elevation at the apical part. Similar to the images obtained in Test 4 (Valsalva), there is a noted widening of the pressure transference along the mid-to-upper vagina.
From these two cases, we may conclude that VTI provides unique quantitative data for involuntary contractive capabilities of the urethra and the levator ani muscles (puboanal). Mobility of urethra can be visualized and estimated.
Test 8 (involuntary muscle contraction) will allow assessment of the following:
- contractive capability (P) of the urethra (U);
- mobility of the urethra (U);
- uniform pressure increase (P) along the entire vagina in the anterior and posterior compartments; and
- levator ani muscles’ involuntary contraction components.
The clinical value of Test 8 lies in the following:
- detection of defects in the urethra (U);
- availability of the involuntary component in the levator ani muscles; and
- urethra (U) and levator ani changes with age.
Discussion
In the previous sections, we described VTI examination findings and data interpretation supported by clinical observations. This interpretation is based on a number of widely accepted anatomic and functional assumptions. However, an understanding of the VTI and its interpretation will grow as more clinical experience is gained in pelvic floor research using VTI measurements. Of course, clinical application of VTI data interpretation also requires knowledge of pelvic functional anatomy, physiology, and clinical history for the individual patient.
Among the VTI limitations are image dependence on operator’s skill level, contact conditions, and probe size. In general, an examination with a tactile imaging probe is operator dependent, similar to colonoscopy.37 Operator training is required to improve and standardize operator skills.38 Minimization or elimination of the operator dependence is also achieved by intentional probe design, data processing algorithms, and real-time feedback to the operator. The VTI intra- and interoperator measurement reproducibility study with 12 subjects demonstrated intraclass correlation coefficients in the range from 0.80 to 0.92 and median tactile image deviations from 6.6% to 15.6%.24 The lubrication helps to keep contact conditions reproducible. Tactile imaging probes with different size and contact area of 15 μm2,39 and 20 cm2,22 demonstrate different absolute values of P(x, y, z) acquired for the same tissue. But comparison of the two image data sets reveals a lot of similarity and common features; both probes show close relative distribution within P(x, y, z) and enable similar tissue characterization.22,39
The VTI offers an opportunity to assess vaginal tissue elasticity, pelvic floor support, and function. Table 1 summarizes VTI capability in pelvic floor characterization. The pelvic floor conditions can be characterized by at least 31 VTI parameters derived from eight tests (studies). This allows a large body of measurements to evaluate individual variations in support defects as well as identify specific potential markers to measure tissue properties and muscle function in patients’ diseased conditions that are accompanied by changes in mechanical properties and often physiologic manifestation. For example, a female patient presents with complaints of increasing vaginal pressure, discomfort, backache, and bulging exacerbated by lifting and straining. The physician performs transvaginal biomechanical mapping with the VTI probe to assess her pelvic floor support status, tissue elasticity, and muscle function and uses the information to determine the best course of treatment. Multiple (up to eight) subprocedures are completed to collect comprehensive biomechanical data for characterization of the vaginal and pelvic floor conditions. The procedure images are visualized in real time on a display to provide feedback to an operator and mapped to produce an examination report, in a form of a computer file and hard-copy record, so that the physician can review and interpret the results, dictate a report, and discuss the results with the patient. Among the clinical conditions when the VTI use can optimize and monitor treatment are POP, stress urinary incontinence, tissue atrophy, and pelvic pain because their etiology includes changes of pelvic tissue biomechanical properties and functions. The proposed approach also may help further differentiate the types of pelvic floor conditions, their underlying severity, and understand how to tailor treatments for the individual patient in the most effective manner.
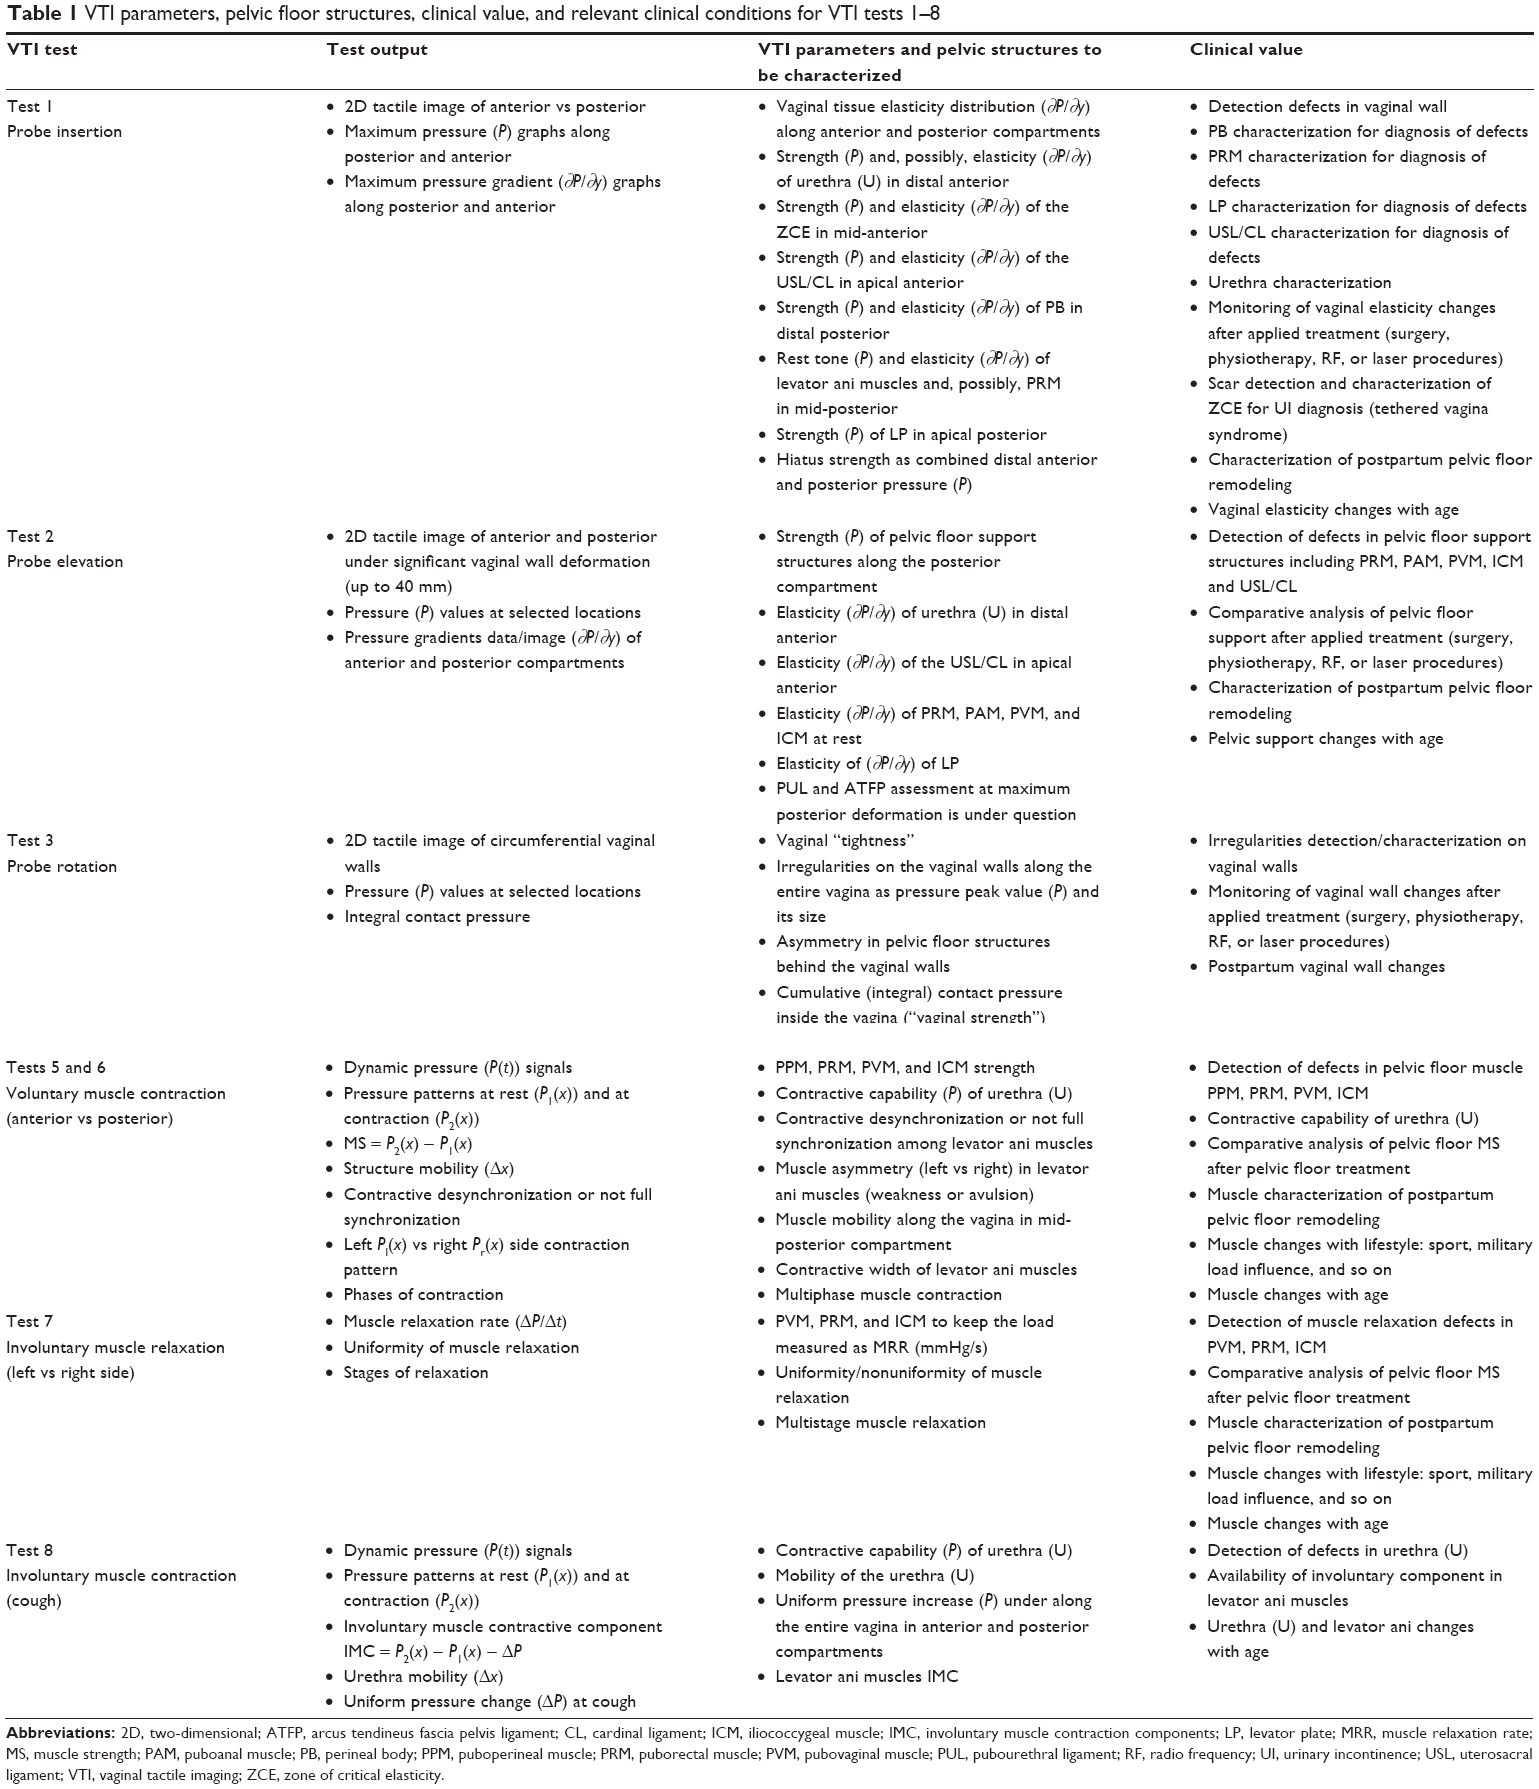 | Table 1 VTI parameters, pelvic floor structures, clinical value, and relevant clinical conditions for VTI tests 1–8 |
Abbreviations
2D, two-dimensional; C, cervix; CL, cardinal ligament; ATFP, arcus tendineus fascia pelvis ligament; E, Young’s modulus; IMC, involuntary muscle contraction components; ICM, iliococcygeal muscle; kPa, Pa ×1,000; LP, levator plate; m, meter (unit of distance); mmHg, millimeter of mercury (unit of pressure); MS, muscle strength; MRR, muscle relaxation rate; N, Newton (unit of force); P, pressure; Pa, Pascal (unit of pressure); PAM, puboanal muscle; PB, pubic bone; POP, pelvic organ prolapse; PPM, puboperineal muscle (perineal body); PRM, puborectal muscle; PUL, pubourethral ligament; PVM, pubovaginal muscle; RF, radiofrequency; SUI, stress urinary incontinence; U, urethra; UI, urinary incontinence; USL, uterosacral ligament; VTI, vaginal tactile imager; ZCE, zone of critical elasticity.
Acknowledgments
Research reported in this publication was supported by the National Institute on Aging of the National Institutes of Health under the award numbers R44AG034714 and SB1AG034714. The content is solely the responsibility of the authors and does not necessarily represent the official views of the National Institutes of Health.
Disclosure
Dr Egorov is a co-founder and CEO of Advanced Tactile Imaging, Inc. Dr van Raalte is a co-founder of Advanced Tactile Imaging, Inc. Dr Lucente and Dr Murphy report no conflicts of interest in this work.
References
Pizarro-Berdichevsky J, Clifton MM, Goldman HB. Evaluation and management of pelvic organ prolapse in elderly women. Clin Geriatr Med. 2015;31(4):507–521. | ||
Anderson KM, Davis K, Flynn BJ. Urinary incontinence and pelvic organ prolapse. Med Clin North Am. 2015;99(2):405–416. | ||
Hendrix SL, Clark A, Nygaard I, Aragaki A, Barnabei V, McTiernan A. Pelvic organ prolapse in the women’s health initiative: gravity and gravidity. Am J Obstet Gynecol. 2002;186(6):1160–1166. | ||
Wu JM, Vaughan CP, Goode PS, et al. Prevalence and trends of symptomatic pelvic floor disorders in U.S. women. Obstet Gynecol. 2014;123(1):141–148. | ||
Wood LN, Anger JT. Urinary incontinence in women. BMJ. 2014;349:g4531. | ||
DeLancey JO. Pelvic floor anatomy and pathology. In: Hoyte L, Damaser MS, editors. Biomechanics of the Female Pelvic Floor. 1st ed. London, UK: Elsevier; 2016:13–51. | ||
Dietz HP. Pelvic Floor Ultrasound. Atlas and Text Book. Creative Commons Attribution License. Springwood, Australia; 2016:1–127. | ||
Petros P. The Female Pelvic Floor: Function, Dysfunction and Management According to the Integral Theory. 3rd ed. Berlin, Germany: Springer; 2010:1–330. | ||
Walters MD, Karram MM. Urogynecology and Reconstructive Pelvic Surgery. 4th ed. Philadelphia, PA: Elsevier; 2015:1–688. | ||
Ismail S, Duckett J, Rizk D, et al. Recurrent pelvic organ prolapse: International Urogynecological Association Research and Development Committee opinion. Int Urogynecol J. 2016;27(11):1619–1632. | ||
Elliott CS, Sokol ER. Might pelvic surgeons be unaware of their surgical failures? Patient reporting and perceptions after failed incontinence or pelvic organ prolapse surgery. Female Pelvic Med Reconstr Surg. 2015;21(5):298–300. | ||
Nygaard I, Brubaker L, Zyczynski HM, et al. Long-term outcomes following abdominal sacrocolpopexy for pelvic organ prolapse. JAMA. 2013;309(19):2016–2024. | ||
Stepp KJ, Walters MD, Karram MM. Anatomy of the lower urinary tract, pelvic floor, and rectum. In: Urogynecology and Reconstructive Pelvic Surgery. 4th ed. Philadelphia, PA: Elsevier; 2015:19–31. | ||
Timoshenko S, Goodier JN. Theory of Elasticity. New York, NY: McGraw-Hill Book Company; 1951:1–508. | ||
Landau LD, Lipshitz EM. Theory of Elasticity. 3rd ed. Oxford, UK: Elsevier; 1970:1–172. | ||
Taber AT. Nonlinear Theory of Elasticity. Applications in Biomechanics. London, UK: World Scientific Pub Co Inc; 2004:1–416. | ||
Johnston WL. The role of static and motion palpation in structural diagnosis. J Am Osteopath Assoc. 1975;75(4):421–424. | ||
Duck FA. Physical properties of tissue: a comprehensive reference book. In: Mechanical Properties of Tissue. London, UK/San Diego, CA: Academic Press; 1990:137–165. (Chapter 5). | ||
Fung YC. Biomechanics: Mechanical Properties of Living Tissues. 2nd ed. Ann Arbor, USA: Prentice-Hall, Inc; 1993:1–568. | ||
Sarvazyan A. Elastic properties of soft tissues. In: Levy M, Bass HE, Stern RR, editors. Elastic Properties of Soft Tissues Handbook of Elastic Properties of Solids, Liquids, and Gases. Vol III. New York, NY: Academic Press; 2001:107–127. (Chapter 5). | ||
Egorov V, Ayrapetyan S, Sarvazyan AP. Prostate Mechanical Imaging: 3-D image composition and feature calculations. IEEE Trans Med Imaging. 2006;25(10):1329–1340. | ||
Egorov V, Sarvazyan AP. Mechanical imaging of the breast. IEEE Trans Med Imaging. 2008;27(9):1275–1287. | ||
Egorov V, van Raalte H, Lucente V, Sarvazyan A. Biomechanical characterization of the pelvic floor using tactile imaging. In: Hoyte L, Damaser MS, editors. Biomechanics of the Female Pelvic Floor, Chapter 17. London, UK: Elsevier; 2016:317–348. | ||
van Raalte H, Lucente V, Ephrain S, et al. Intra- and inter-observer reproducibility of vaginal tactile imaging. American Urogynecologic Society 37th Annual Meeting, September 27 – October 1; 2016; Denver, CO. | ||
van Raalte H, Lucente V, Ephrain S, Murphy M, Bhatia N, Egorov V. Pelvic organ prolapse surgery characterization by vaginal tactile imaging. Int Urogynecol J. 2016;(Suppl 1):S117–S118. | ||
van Raalte H, Bhatia N, Egorov V. Is it all just smoke and mirrors? Vaginal laser therapy and its assessment by tactile imaging. Int Urogynecol J. 2016;(Suppl 1):S120–S121. | ||
van Raalte H, Egorov V. Tactile imaging markers to characterize female pelvic floor conditions. Open J Obstet Gynecol. 2015;5(9):505–515. | ||
van Raalte H, Egorov V. Characterizing female pelvic floor conditions by tactile imaging. Int Urogynecol J. 2015;26(4):607–609. | ||
van Raalte H, Lucente V, Egorov V. High definition pressure mapping of the pelvic floor muscles during Valsalva manever, voluntary muscle contraction and involuntary relaxation. Female Pelvic Med Reconstr Surg. 2015;21(5):S149–S150. | ||
van Raalte H, Lucente V, Egorov V. Pressure mapping of voluntary and involuntary muscle contraction for assessment of SUI conditions. Proceedings of International Continence Society 45th Annual Meeting. Montreal, Canada, October 6–9; 2015:529. | ||
van Raalte H, Egorov V. High definition manometry for intravaginal observation of pelvic floor muscle contractions. Proceedings of International Continence Society 44th Annual Meeting. Rio De Janeiro, Brazil, October 20–24; 2014. | ||
van Raalte H, Egorov V, Lucente V, Murphy M, Saiz C. 3D tactile imaging in early prolapse detection. Neurourol Urodyn. 2013;32(6):704–705. | ||
Egorov V, van Raalte H, Lucente V. Quantifying vaginal tissue elasticity under normal and prolapse conditions by tactile imaging. Int Urogynecol J. 2012;23(4):459–466. | ||
van Raalte H, Lucente V, Egorov V. 3-D imaging and quantifying vaginal tissue elasticity under normal and prolapse conditions. Int Urogynecol J. 2011;22(S1):S183–S184. | ||
Egorov V, van Raalte H, Sarvazyan A. Vaginal Tactile Imaging. IEEE Trans Biomed Eng. 2010;57(7):1736–1744. | ||
Bump RC, Mattiasson A, Bo K, et al. The standardization of terminology of female pelvic organ prolapse and pelvic floor dysfunction. Am J Obstet Gynecol. 1996;175(1):10–17. | ||
Korman LY, Egorov V, Tsuryupa S, et al. Characterization of forces applied by endoscopists during colonoscopy by using a wireless colonoscopy force monitor. Gastrointest Endosc. 2010;71(2):327–334. | ||
Egorov V, Sarvazyan A. Operator training and performance descriptor for prostate mechanical imaging. Proceedings of the 7th International Conference on the Ultrasonic Measurement and Imaging of Tissue Elasticity, Austin, Texas, Oct 27–30; 2008:27. | ||
Oie T, Suzuki H, Fukuda T, et al. Tactile mapping system: a novel imaging technology for surface topography and elasticity of tissues or organs. Innovations (Phila). 2009;4(6):345–350. |
 © 2017 The Author(s). This work is published and licensed by Dove Medical Press Limited. The full terms of this license are available at https://www.dovepress.com/terms.php and incorporate the Creative Commons Attribution - Non Commercial (unported, v3.0) License.
By accessing the work you hereby accept the Terms. Non-commercial uses of the work are permitted without any further permission from Dove Medical Press Limited, provided the work is properly attributed. For permission for commercial use of this work, please see paragraphs 4.2 and 5 of our Terms.
© 2017 The Author(s). This work is published and licensed by Dove Medical Press Limited. The full terms of this license are available at https://www.dovepress.com/terms.php and incorporate the Creative Commons Attribution - Non Commercial (unported, v3.0) License.
By accessing the work you hereby accept the Terms. Non-commercial uses of the work are permitted without any further permission from Dove Medical Press Limited, provided the work is properly attributed. For permission for commercial use of this work, please see paragraphs 4.2 and 5 of our Terms.