")
Back to Journals » International Journal of General Medicine » Volume 14
Biomarker Screening and Prognostic Significance Analysis for Renal Cell Carcinoma
Authors Meng X, Yuan H, Li W , Xiao W, Zhang X
Received 18 June 2021
Accepted for publication 11 August 2021
Published 7 September 2021 Volume 2021:14 Pages 5255—5267
DOI https://doi.org/10.2147/IJGM.S325347
Checked for plagiarism Yes
Review by Single anonymous peer review
Peer reviewer comments 2
Editor who approved publication: Dr Scott Fraser
Xiangui Meng,1– 3,* Hongwei Yuan,1– 3,* Weiquan Li,1– 3,* Wen Xiao,1– 3 Xiaoping Zhang1– 3
1Department of Urology, Union Hospital, Tongji Medical College, Huazhong University of Science and Technology, Wuhan, 430022, People’s Republic of China; 2Shenzhen Huazhong University of Science and Technology Research Institute, Shenzhen, 518000, People’s Republic of China; 3Institute of Urology, Tongji Medical College, Huazhong University of Science and Technology, Wuhan, 430022, People’s Republic of China
*These authors contributed equally to this work
Correspondence: Xiaoping Zhang; Wen Xiao
Department of Urology, Union Hospital, Tongji Medical College, Huazhong University of Science and Technology, 1277 Jiefang Avenue, Wuhan, Hubei Province, 430022, People’s Republic of China
Tel +86-18602752025
Fax +86 2785776343
Email [email protected]; [email protected]
Background: Studies report that conventional treatment of clear cell renal cell carcinoma (ccRCC) is effective, but several advanced patients present with poor prognosis. The current study explored potential new tumor markers and therapeutic targets in advanced ccRCC.
Methods: Biomarker gene expression of ccRCC was retrieved from GEO database and the Cancer Genome Atlas Kidney Clear Cell Carcinoma (TCGA-KIRC) database. Gene ontology (GO) analysis and protein–protein interaction (PPI) networks of biomarker genes were constructed using the Database for Annotation, Visualization, and Integrated Discovery (DAVID) tool. Kaplan–Meier analysis and receiver operating characteristic curve (ROC) analysis were performed to explore the prognostic and diagnostic roles of these genes. Gene set enrichment analysis (GSEA) analysis was used to determine hallmark functions of the biomarker genes. qRT-PCR was used to verify the reliability of the analysis results in tumor tissues.
Results: A total of 21 upregulated genes were identified between advanced ccRCC and early ccRCC (grade III+IV vs grade I+II). Gene ontology analysis showed that the 21 upregulated genes were mainly implicated in biological processes including metabolic and lipid transport. The findings showed that 7 out of the 21 genes were significantly upregulated in 72-paired samples retrieved from the TCGA-KIRC. High expression of 5 genes indicated a poor prognosis of overall survival and disease-free survival in KIRC. Three genes effectively distinguished renal cancer tissue and adjacent renal tissues in a total of 533 ccRCC samples. GSEA showed that the 3 biomarkers were significantly enriched in epithelial–mesenchymal transition, G2M checkpoint, and angiogenesis. The results of qRT-PCR showed that STEAP3, IBSP, and AQP9 had a significant identification effect in ccRCC.
Conclusion: The findings showed that 3 biomarkers were significantly upregulated in advanced ccRCC and could be used for diagnosis, prediction, and potential novel therapeutic targets for progression of ccRCC.
Keywords: advanced ccRCC, biomarker, progression, differentially expressed genes
Introduction
Clear cell renal cell carcinoma (ccRCC) is the most common pathological type of renal cancer (RCC).1,2 RCC is characterized by high incidence in the United States, and approximately 14,830 new deaths and 73,750 estimated new cases were reported in 2020 in the United States.3 New RCC cases in 2018 were approximately 403,262 (2.2% of all types of tumors), and new deaths were approximately 175,098 (1.8%) globally.4 Previous studies report that ccRCC is a highly fatal tumor disease and contributes to the highest renal cancer-related deaths.5 Timely diagnosis and confirmation of the cancer pathological type and pathological grade are important for effective management and treatment of patients. Treatment is adjusted based on the results of expression of clinical diagnostic markers, which has a positive effect on the prognosis of patients. Currently, no effective tumor markers have been identified for renal cancer and diagnosis is mainly performed through non-targeted imaging. Some patients present with metastasized tumors at the time of diagnosis with ccRCC. Therefore, determining effective biomarkers is important for abrogating the progression of renal cancer and improving the prognosis of patients.6,7
The main therapy for early-stage renal cancer is mainly local or radical nephrectomy, however, this approach is associated with a high risk of local recurrence or distant metastasis.8,9 Most patients die of cancer metastasis and invasion, implying that these processes affect tumor progression and treatment of ccRCC patients.10,11 Studies report that tyrosine kinase inhibitor (TKI) can effectively treat advanced renal cancer; however, the survival prognosis of many patients is still poor.12,13 Cell cycle regulation and cell adhesion maintenance can promote the occurrence and development of tumor cells.14 Phenotypic plasticity promoted by epithelial–mesenchymal transition (EMT) has an important clinical significance for cancer progression and drug resistance.15,16 TKIs inhibit the tumor cell cycle and EMT to affect tumor growth and metastasis.17,18 However, TKI resistance has been reported to be associated with poor progression of ccRCC.19 Therefore, there is an urgent need to explore more effective prognostic biomarkers and determine new drug targets for novel ccRCC therapies.
In the current study, differentially expressed genes (DEGs) were analyzed between advanced ccRCC and early ccRCC (grade III+IV vs grade I+II) using GSE150404 dataset. GO analysis showed that the metabolic and lipid transport is the main biological process associated with the 21 upregulated genes. The interaction of 21 upregulated genes was explored using the PPI network. The findings showed that 7 genes were significantly upregulated in paired 72-paired samples in TCGA-KIRC dataset. High expression of 5 genes indicated a poor prognosis of overall survival (OS) and disease-free survival (DFS) in ccRCC. Further analysis using ROC curves showed that 3 genes effectively discriminated between renal cancer tissue and adjacent tissues in a total of 533 ccRCC samples. Gene set enrichment analysis (GSEA) was used for prediction of the hallmark functions of the three upregulated genes.
In summary, the high expression level of the STEAP3, IBSP, and AQP9 indicated the patients were more likely to progress into advanced renal cancer and implied a poor prognosis. The biomarker genes were mainly enriched in EMT, G2M checkpoint, and angiogenesis biological processes. Further study should be conducted to explore the mechanism of action of STEAP3, IBSP and AQP9 in the occurrence and progression of advanced clear cell renal cell carcinoma.
Materials and Methods
Gene Expression Data of Patients’ Samples
GSE150404 gene expression data were retrieved from GEO database. GSE150404 dataset comprised four groups (total 60 samples) of samples for four grades identified by pathologists with 15 ccRCC samples in each group. mRNA expression data from the TCGA-KIRC database was retrieved from Xena tool (https://xenabrowser.net/heatmap/#),20 which included 72-paired cancer tissues and a total of 533 cancer tissues.
Analysis of Differentially Expressed Genes
Differentially expressed genes (DEGs) with log2Foldchange (logFC) ≥ 1.5 (upregulated) or logFC ≤ −1.5 (downregulated) between advanced ccRCC (grade III+IV) and early ccRCC (grade I+II) samples were identified using GEO2R tool at a p value < 0.05. The GEO2R tool was also used to identify the fold change of 21 upregulated DEGs between ccRCC and normal tissues.
Gene Ontology and PPI Network Analysis
Gene ontology (GO) analysis of DEGs was conducted using the Database for Annotation, Visualization, and Integrated Discovery (DAVID) webserver (https://david.ncifcrf.gov/). Protein–protein interaction (PPI) networks of DEGs were constructed using the Search Tool for the Retrieval of Interacting Genes (STRING) (https://string-db.org/).
Kaplan Meier Analysis and ROC Curves Analysis
Overall survival (OS) and disease-free survival (DFS) of KIRC were determined using GEPIA tool (http://gepia.cancer-pku.cn/). The potential clinical diagnostic value of candidate genes was explored by determining expression levels of the genes with the receiver operating characteristic curve (ROC).21,22
Gene Set Enrichment Analysis
All cases of KIRC were divided into two groups (high expression vs low expression) based on the median value of biomarker genes. Gene set enrichment analysis (GSEA) analysis was then performed to determine hallmark functions of biomarker genes.23
RNA Isolation and qRT-PCR
Twenty-four pairs of ccRCC tissue samples were obtained from the Department of Urology, Union Hospital, Tongji Medical College, Wuhan, China. The study was compliant with all relevant ethical regulations regarding research involving human participants. Total RNA was extracted from samples by the TRIzol reagent (Thermo, Massachusetts, USA) and then reverse-transcribed. The resulting cDNA was then subjected to real-time PCR analysis with SYBR Green mix (Thermo, Massachusetts, USA). Results were normalized to GAPDH for each sample. Gene primers are obtained from Sangon Biotech (Shanghai) and list as follows:
GAPDH
Forward 5′‐GAGTCAACGGATTTGGTCGT‐3′
Reverse 5′‐GACAAGCTTCCCGTTCTCAG‐3
AQP9
Forward 5′‐CCACCAGAAGACGATTAAGCCACAG‐3′
Reverse 5′‐GGTCCTCACTTTCACAGCCAGATG‐3′
IBSP
Forward 5′‐GCACCAGTACCAACAGCACAGAG‐3′
Reverse 5′‐GGCTCCAGTGACACTTTCTTCTTCC‐3′
STEAP3
Forward 5′‐CGGAGGTCATCTTTGTGGCTGTG‐3′
Reverse 5′‐GCTGAAGGTGCTCTTGCTCTGTAG‐3′
Statistical Analysis
SPSS Statistical software version 22.0 (IBM SPSS, Chicago, IL) was used for statistical analysis. All clinical-pathological gene expression data were presented as mean and SEM. Data on paired cases were analyzed using a paired sample t-test, while analysis of unpaired cases was performed using t-test. P-value <0.05 was considered statistically significant.24
Results
Differentially Expressed Genes (DEGs) in Advanced ccRCC
A total of 60 samples, comprising four groups of four grades, were confirmed by hospital pathologists and included in the current study. Each group comprised 15 ccRCC samples. DEGs between advanced ccRCC (grade III+IV) and early ccRCC (grade I+II) samples were identified using GEO2R tool. P-value < 0.05, logFC ≥ 1.5 or logFC ≤ −1.5 was used as the cut-off criteria. A total of 131 DEGs were identified, with 21 upregulated DEGs and 110 downregulated DEGs (Figure 1A and B).
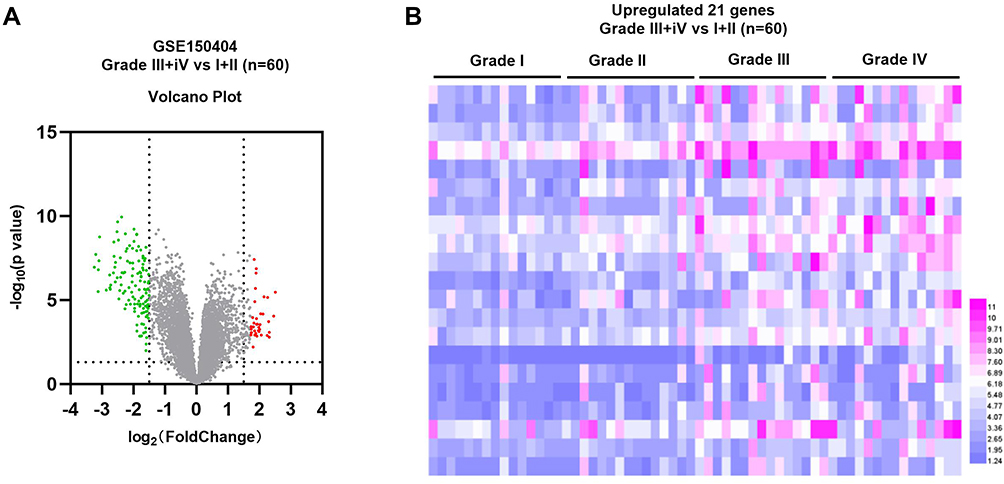 |
Figure 1 Gene expression levels between advanced and early renal cancer. (A) Volcano map of gene expression level in ccRCC based on GSE150404 dataset. (B) Heat map showing gene expression in ccRCC based on GSE150404 dataset. Black dots represent genes with no difference in expression level, blue dots represent downregulated DEGs, and purple dots represent upregulated DEGs. |
Functional Enrichment Analysis Showed Enrichment of Pathways Implicated in Cancer and a PPI Network Was Constructed Based on DEGs
GO function analysis of upregulated genes was performed with the DAVID tool. The findings showed that enriched biological processes included acute inflammatory response, lipid transport, innate immune response, cellular protein metabolic process, protein secretion, positive regulation of the multicellular organismal process, wound healing, cell adhesion, and protein metabolic process (Figure 2A). Significantly enriched cellular components included extracellular matrix, external side of the cell surface, plasma membrane, extracellular exosome, vesicle, extracellular space and extracellular region part (Figure 2B). Analysis showed that enriched molecular functions included growth factor binding, enzyme inhibitor activity, receptor binding, enzyme regulator activity and molecular function regulator (Figure 2C). PPI network of the upregulated genes was constructed using the STRING tool (Figure 2D).
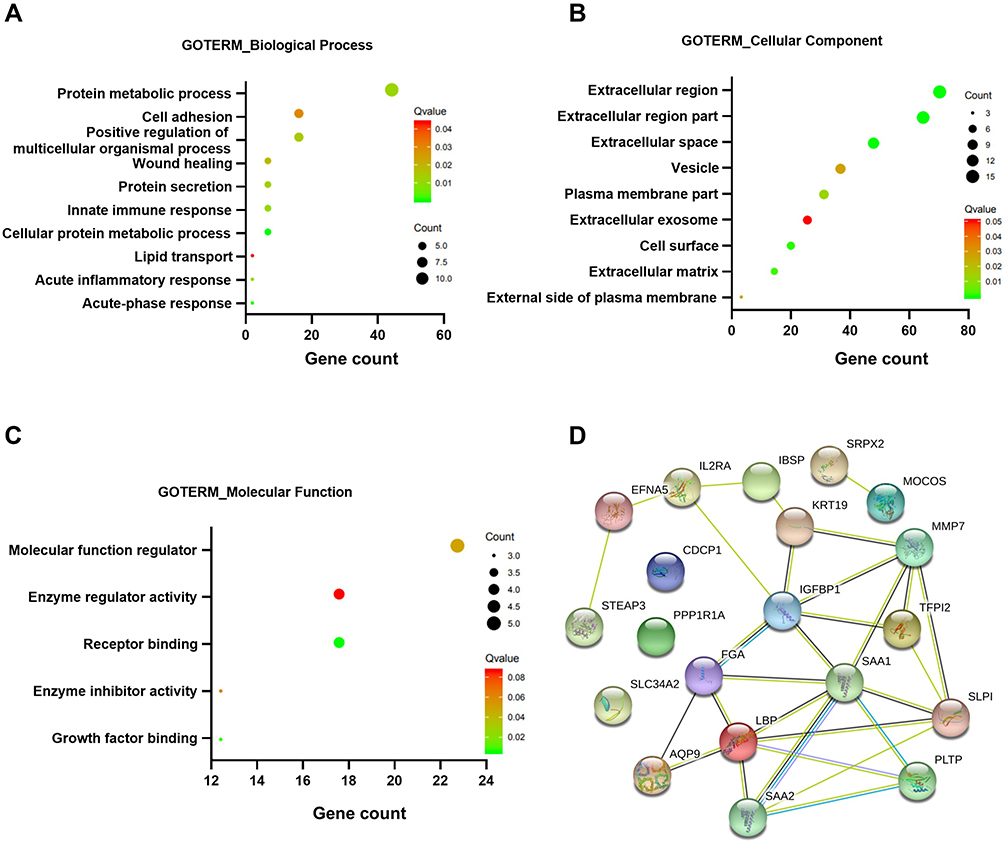 |
Figure 2 Functional enrichment analysis and PPI network of upregulated genes. (A–C) GO analysis of upregulated DEGs. (D) PPI network of upregulated DEGs. |
Differentially Up-Regulated Genes Were Identified in ccRCC
Differential expression of these 21 genes, in tumor and normal tissues, was further explored by TCGA-KIRC database. Analysis showed that most of the 21 genes were also upregulated in KIRC cancer tissues compared with the level in adjacent normal renal tissue (Figure 3A). Setting the cut‐off criterion as p <.05 and [logFC] > 1.5, we identified 7 upregulated genes as common to the two independent datasets by employing integrated bioinformatics analysis (Figure 3B). The 7 upregulated genes included: six-transmembrane epithelial antigen of prostate 3 (STEAP3), insulin-like growth factor-binding protein 1 (IGFBP1), lipopolysaccharide-binding protein (LBP), CUB domain-containing protein 1 (CDCP1), interleukin 2 receptor subunit alpha (IL2RA), integrin-binding sialoprotein (IBSP) and aquaporin 9 (AQP9) (Figure 3C and D). In addition, the correlation between the expression levels of 7 DEGs and pathological grade was also validated by TCGA database. The resulting data showed a higher mRNA expression in advanced ccRCC (grade III+IV) than early ccRCC (grade I+II) patients (Supplementary Figure 1A–G).
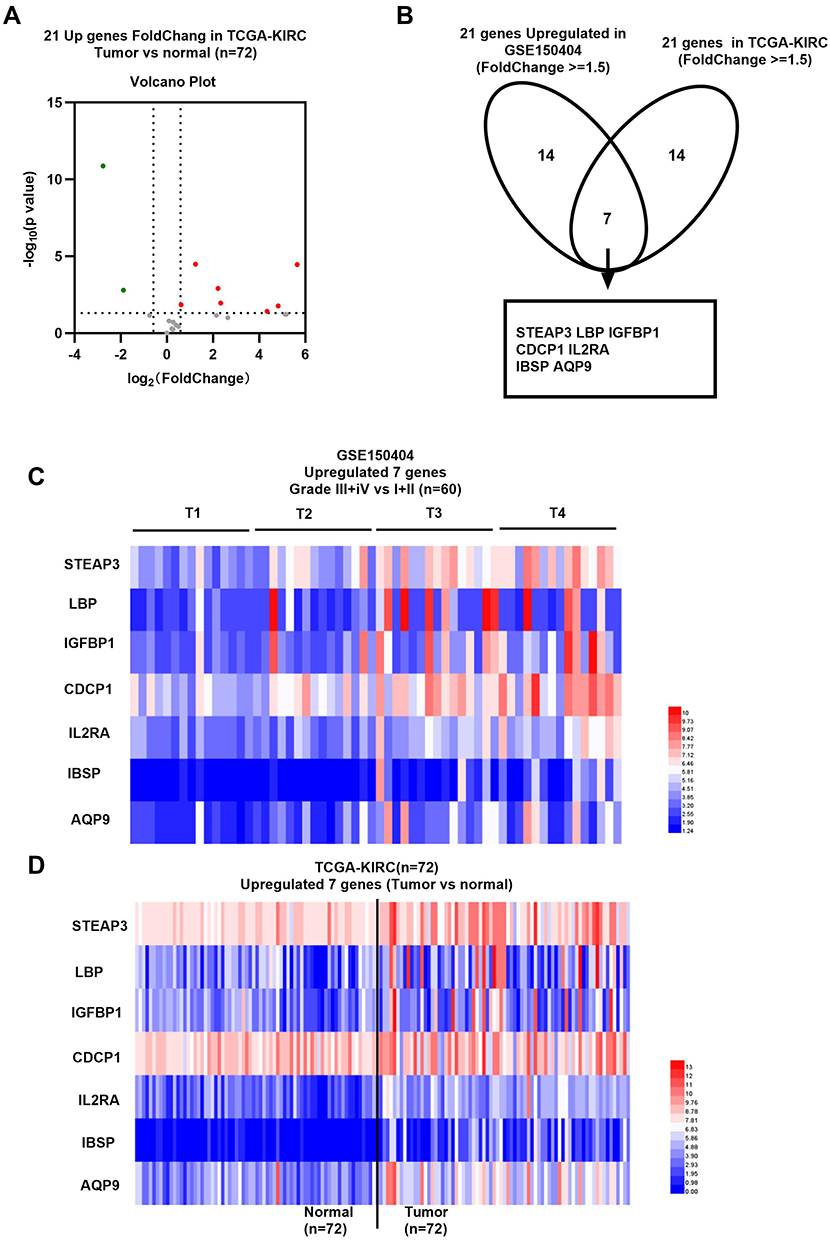 |
Figure 3 Gene expression level of selected upregulated genes in ccRCC. (A) Volcano map of gene expression level of selected 21 upregulated genes in 72 matched normal and adjacent renal cancer tissues retrieved from TCGA-KIRC. (B) A Venn diagram of two independent datasets from GSE150404 dataset and TCGA-KIRC database. (C) Heat map showing expression level of the 7 genes in ccRCC from GSE150404 dataset. (D) Heat map showing expression level of the 7 genes in 72 matched KIRC samples. |
Selected Genes are Prognostic Markers in ccRCC
The prognostic value of the 7 upregulated genes in ccRCC was explored. Patients were divided into two groups based on the median expression level of selected genes. Kaplan–Meier analysis results showed that patients with a high expression level of 5 genes (STEAP3, LBP, IGFBP1, IBSP, and AQP9) had a longer OS (Figure 4A–E and Supplementary Figure 2A, B) and DFS compared with those with low expression levels of these genes (Figure 5A–E and Supplementary Figure 2C, D).
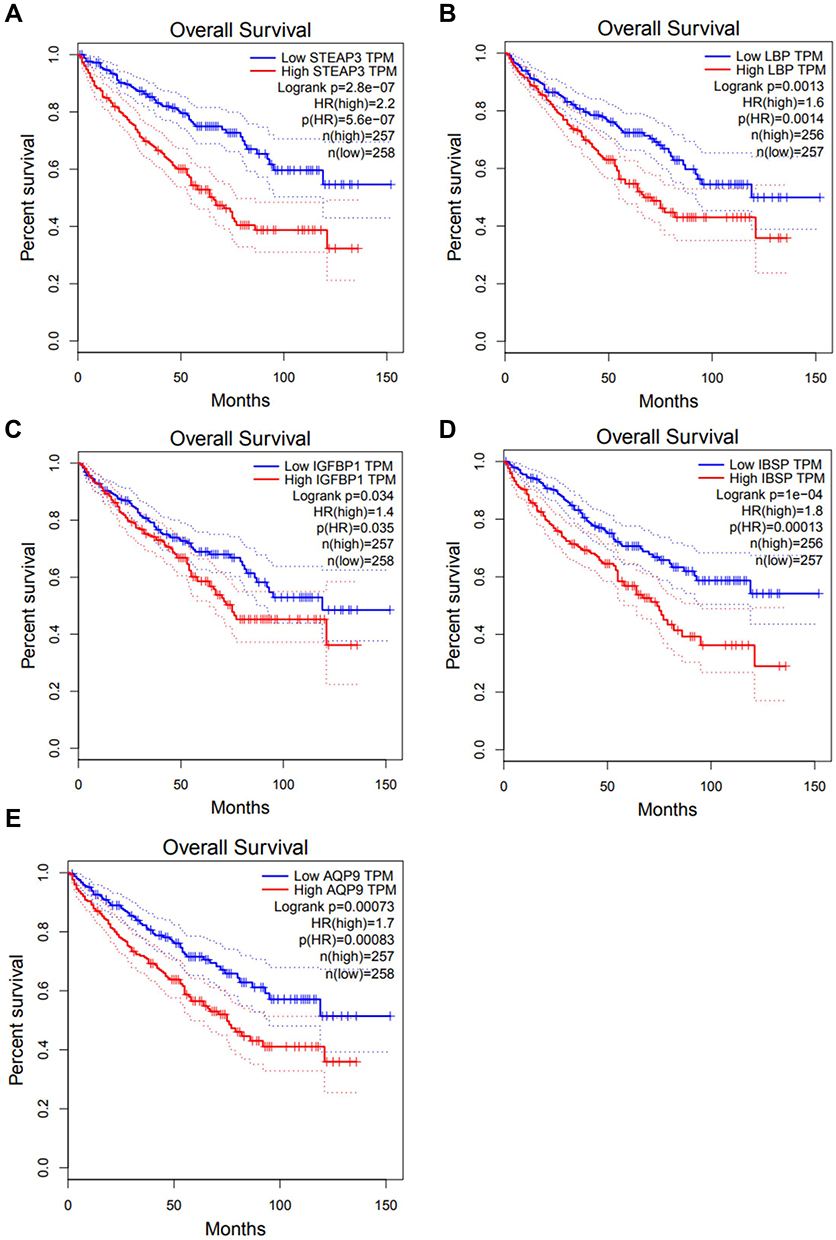 |
Figure 4 Overall survival analysis of selected upregulated genes in ccRCC. (A) STEAP3, (B) LBP, (C) IGFBP1, (D) IBSP and (E) AQP9. |
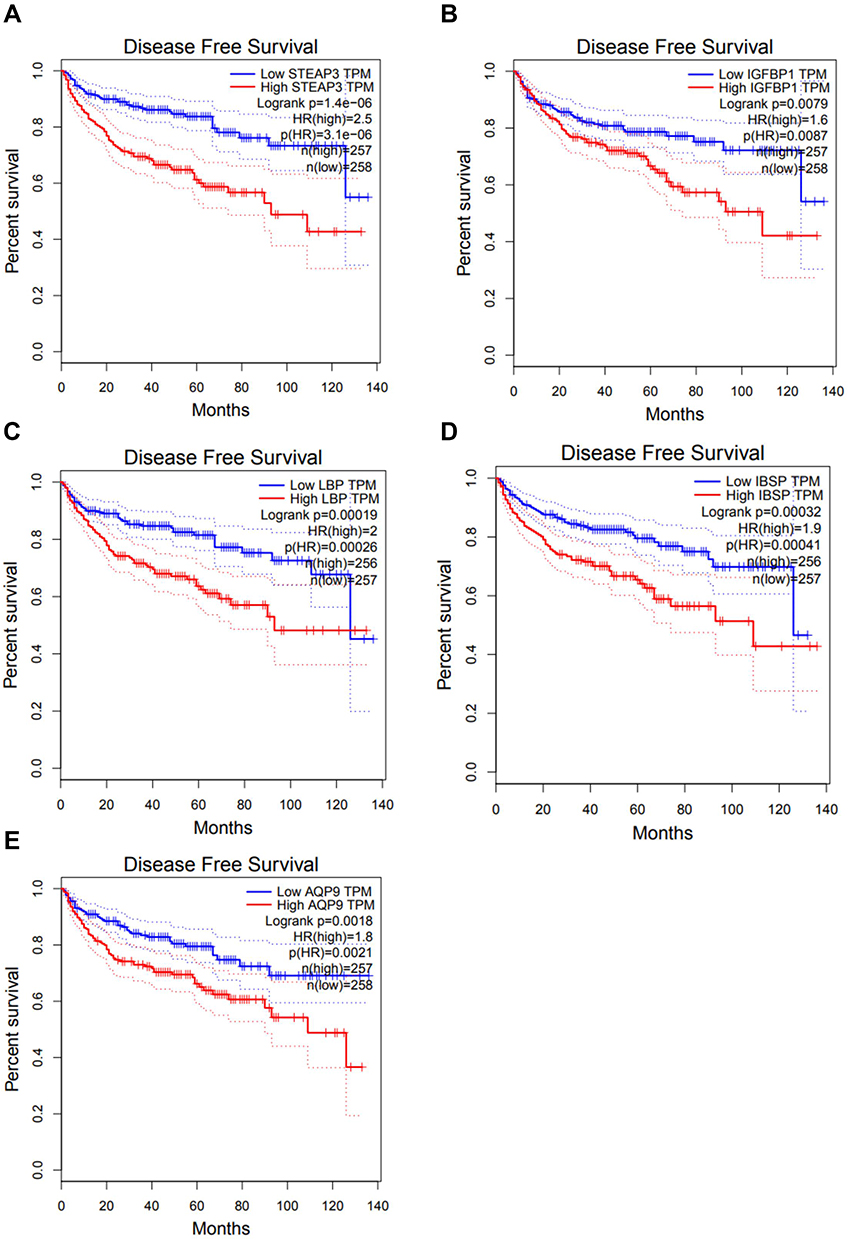 |
Figure 5 Disease-free survival analysis of selected upregulated genes in ccRCC. (A) STEAP3, (B) IGFBP1, (C) LBP, (D) IBSP and (E) AQP9. |
Selected Genes Showed Differential Expression Between TCGA-KIRC and Normal Samples
To further explore the difference in the expression level of the 5 selected genes in tumor samples, the expression levels of the genes in all samples, including 72 normal tissues and 533 tumor tissues, were determined (Figure 6A). The findings showed that expression of the 5 genes was significantly differentially upregulated in 72 paired tissues (Figure 6B), whereas expression of 4 genes was significantly upregulated in 533 tumor samples (Figure 6C).
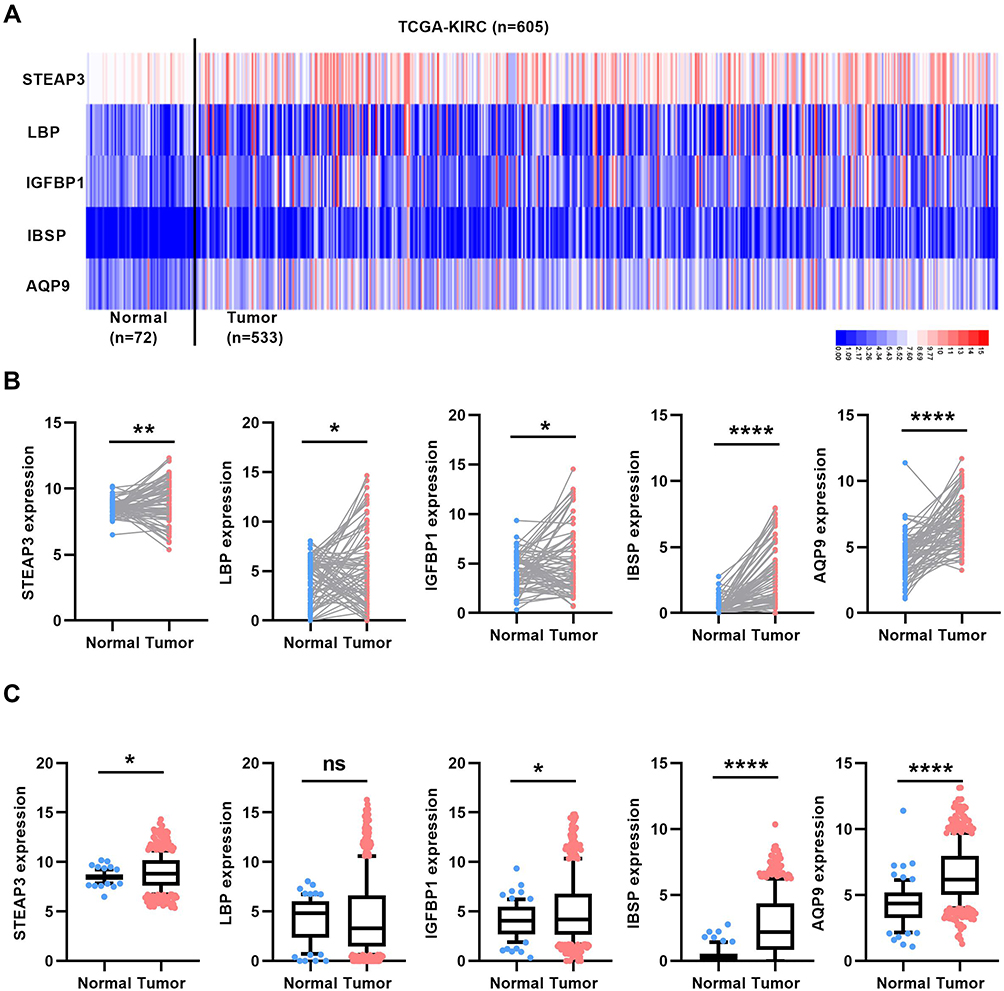 |
Figure 6 Verification of expression level of 5 selected upregulated genes in total cases of ccRCC. (A) Heat map of expression level of 5 selected upregulated genes in total cases of TCGA-KIRC. (B) Expression level of 5 selected upregulated genes in 72 matched normal and cancer tissues in TCGA-KIRC. (C) Expression level of 5 selected upregulated genes in 72 normal and 533 cancer tissues in TCGA-KIRC. *P<0.05, **P<0.01 and ****P<0.0001. |
Receiver Operating Characteristic Curve (ROC) Analysis Showed That DEGs Had Prognostic Value
The diagnostic value of the 5 DEGs was explored using ROC curves to verify the diagnostic capability of ccRCC. The findings showed that only STEAP3, IBSP, AQP9 could effectively distinguish 72 normal renal tissues from 72-paired cancer tissues or a total of 533 cancer tissues, with an area under the curve above 0.5 (Figure 7A–F, and Supplementary Figure 2E–H). Furthermore, the aberrant expressions of STEAP3, IBSP and AQP9 mRNA, in ccRCC clinical samples, were also evaluated by real-time PCR analysis. As expected, STEAP3, IBSP and AQP9 mRNA expressions were significantly upregulated in ccRCC tissues (Supplementary Figure 3A–C). And ROC results from clinical data, with a high AUC, further supported that these biomarkers can effectively distinguish ccRCC from adjacent renal tissues, consistent with the previous results (Supplementary Figure 3D–F). These findings indicate that the selected genes are potentially effective diagnostic biomarkers for ccRCC.
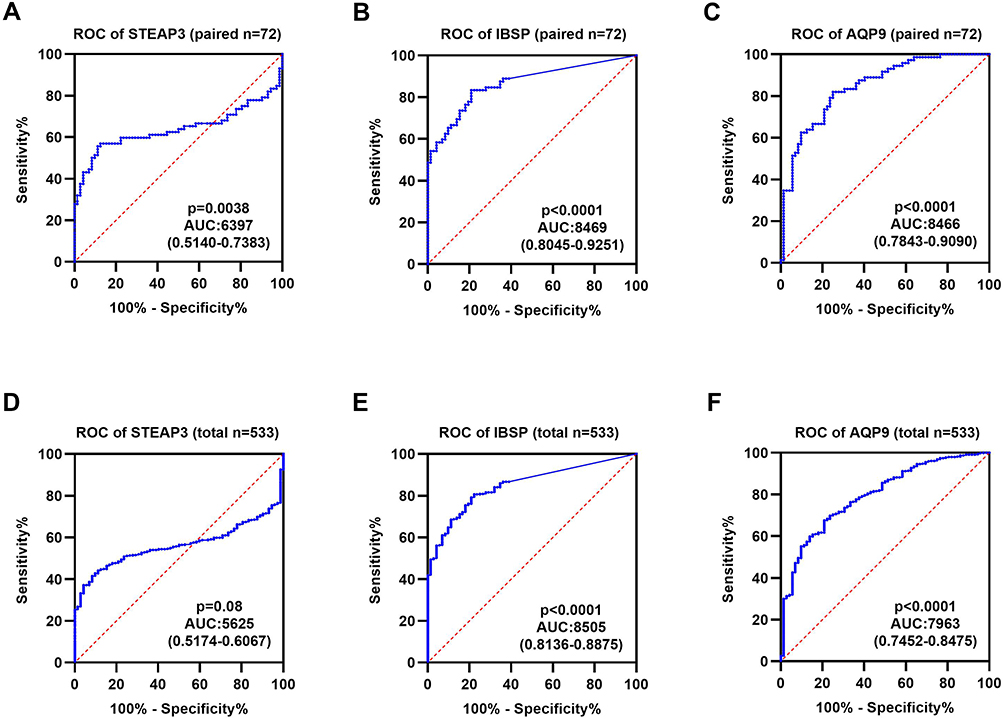 |
Figure 7 Diagnostic value of the selected upregulated genes in ccRCC. (A–C) ROC curve of STEAP3, IBSP, AQP9 between 72 matched normal and cancer tissues in TCGA-KIRC. (D–F) ROC curve of STEAP3, IBSP, AQP9 between 72 normal and 533 cancer tissues in TCGA-KIRC. |
Hallmark Functions of Biomarker Genes
GSEA analysis was performed to predict the hallmark functions of the biomarker genes. Expressions of STEAP3, IBSP, and AQP9 were significantly enriched in EMT, G2M checkpoint, and angiogenesis (Figure 8A–C). These hallmark functions are implicated in tumor metastasis, cell cycle, and angiogenesis, which leads to the progression of the tumor. These genes can thus be used as diagnostic biomarkers or treatment targets for advanced renal cancer.
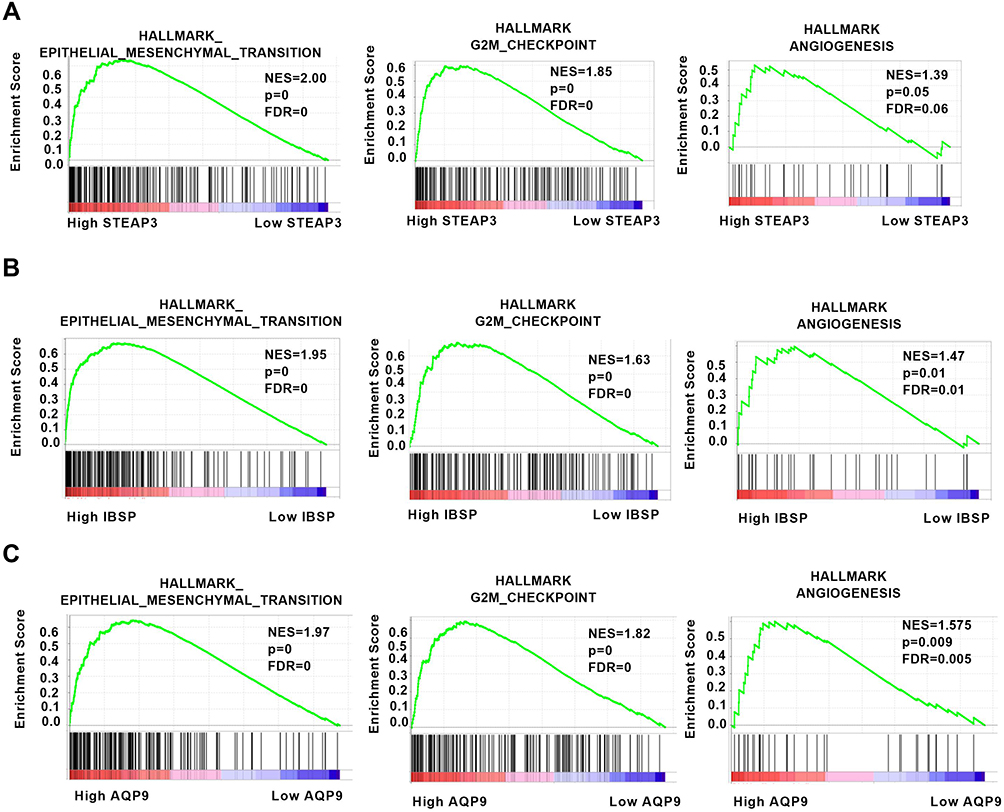 |
Figure 8 Hallmark functions of the biomarker genes as determined with GSEA. (A–C) Expression of STEAP3, IBSP, and AQP9 was significantly enriched in epithelial–mesenchymal transition, G2M checkpoint, and angiogenesis. |
Discussion
RCC is a common malignant tumor in the urinary system. CcRCC is a pathological type of renal cancer characterized by high incidence and high fatality rates. Cancer treatment has been significantly improved by targeting the expression of tumor markers,25–27 however, few effective tumor markers have been identified for renal cancer.28–30 Therefore, determining an effective biomarker is important to reduce mortality of renal cancer. Local or radical nephrectomy is the main treatment approach for early-stage renal cancer; however, it is characterized by a high risk of local recurrence or distant metastasis after the procedure. Application of tyrosine kinase inhibitor (TKI) is highly effective in the treatment of advanced renal cancer, however, patients with advanced stages present with poor survival prognosis. EMT plays a significant role in cancer progression and drug resistance of TKI. There is a need to explore more effective prognostic biomarkers and identify novel drug targets for the development of ccRCC therapies.
Specific biomarkers were identified in the current study through microarray expression profile from the GSE150404 dataset for advanced ccRCC. The dataset comprised a total of 60 samples, containing four groups of four grades confirmed by hospital pathologists with 15 ccRCC samples in each group. The four grades were divided into two groups, namely early and advanced renal cancer groups. A total of 21 up-regulated genes were identified and GO analysis was performed to explore biological pathways and gene functions of the upregulated genes using DAVID tool. The findings showed that upregulated genes were enriched in the biological process including acute-phase response, acute inflammatory response, lipid transport, innate immune response, cellular protein metabolic process, protein secretion, wound healing, cell adhesion, and protein metabolic process. Moreover, upregulated genes were used for the construction of a protein–protein interaction (PPI) network. Previous studies report that lipids that accumulate in kidney cancer cells are mainly cholesterol and triglycerides.1,31 Lipid storage can promote the integrity of endoplasmic reticulum, thus maintaining the homeostasis of tumor cells and promoting tumor development.32 Findings from previous studies showed that reducing lipid accumulation can inhibit growth and metastasis of tumor cells.33,34 Further studies should be conducted to explore the potential role of identified genes in lipid transport or metabolic process in ccRCC.
To further determine the most critical genes that affect the progression of renal cancer, the expression levels of the upregulated genes in KIRC were determined using 72 renal cancer tissues and adjacent normal renal tissues. The findings showed that 7 were significantly upregulated in renal cancer tissues compared with the levels in adjacent normal renal tissues. Kaplan–Meier curves were used to explore the prognostic role of 7 genes by evaluating their correlation with OS and DFS in KIRC. The findings showed that high expression levels of STEAP3, LBP, IGFBP1, IBSP, and AQP9 were correlated with a poor prognosis of ccRCC patients. Further analysis showed that STEAP3, IBSP, and AQP9 were significantly highly expressed in cancer samples and effectively distinguished tumors from normal tissues in a dataset of 72 normal tissues and 533 tumor tissues. These findings indicate that these genes can be used as biomarkers for renal cancer.
GSEA findings showed that high expression of STEAP3, IBSP and AQP9 were enriched in EMT, G2M checkpoint, and angiogenesis. High expression of these genes may play a role in the progression of the tumor to enter the advanced stage or may be implicated in TKI drug resistance. Previous studies report that AQP9 is upregulated in breast cancer35 and ccRCC.36 However, a previous study reported that overexpression of AQP9 inhibits growth and metastasis of hepatocellular carcinoma.37 STEAP3 plays a key role in cellular iron uptake and homeostasis functions and thus serves as an oncogene in glioma progression.38,39 In addition, STEAP3 is a key gene for bone metastasis in breast cancer.40 IBSP encodes a specific regulator of matrix metalloproteinase, and high expression of IBSP is correlated with poor prognosis of esophageal carcinoma.41 However, the role and expression levels of STEAP3 or IBSP have not been explored in renal cell carcinoma. The current study conducted bioinformatics analysis, and the findings showed that STEAP3 and IBSP are highly expressed in advanced renal cell carcinoma and are implicated in EMT, cell cycle regulation, and angiogenesis. The high expression levels of STEAP3 and IBSP can thus be used as biomarkers for advanced renal cancer.
In summary, the current study used comprehensive bioinformatics analysis to identify 3 biomarkers for advanced ccRCC. Low expression of these genes showed a good prognosis, whereas a higher expression level of 3 biomarkers is associated with a poor prognosis of advanced renal cancer. These findings provide a basis for exploring the mechanism of occurrence and progression of renal cancer. However, further in vitro and in vivo studies should be conducted to verify these findings and explore the mechanism of action of these genes in renal cancer.
Ethics
This investigation was approved by the Ethics Committee of Huazhong University of Science and Technology.
Author Contributions
All authors made substantial contributions to conception and design, acquisition of data, or analysis and interpretation of data; took part in drafting the article or revising it critically for important intellectual content; agreed to submit to the current journal; gave final approval for the version to be published; and agreed to be accountable for all aspects of the work.
Funding
This work was supported by grants from the National Natural Science Foundation of China (81902588), the National Key Scientific Instrument Development Project (81927807), and the National Key R&D Program of China (2017YFB1303100), and the project funded by the China Postdoctoral Science Foundation (2020T130229, 2020M672368), Wuhan Science and Technology Plan Application Foundation Frontier Project (2020020601012247).
Disclosure
The authors declare that they have no competing interests.
References
1. Saito K, Arai E, Maekawa K, et al. Lipidomic signatures and associated transcriptomic profiles of clear cell renal cell carcinoma. Sci Rep. 2016;6:28932. doi:10.1038/srep28932
2. Xiao W, Wang X, Wang T, Xing J. Overexpression of BMP1 reflects poor prognosis in clear cell renal cell carcinoma. Cancer Gene Ther. 2020;27(5):330–340. doi:10.1038/s41417-019-0107-9
3. Siegel RL, Miller KD, Jemal A. Cancer statistics, 2020. CA Cancer J Clin. 2020;70(3):145–164.
4. Bray F, Ferlay J, Soerjomataram I, et al. Global cancer statistics 2018: GLOBOCAN estimates of incidence and mortality worldwide for 36 cancers in 185 countries. CA Cancer J Clin. 2018;68(6):394–424.
5. Hsieh JJ, Purdue MP, Signoretti S, et al. Renal cell carcinoma. Nat Rev Dis Primers. 2017;3:17009. doi:10.1038/nrdp.2017.9
6. Yin H, Zhang H, Wang X, Xu Q. Four methylation-driven genes may be prognostic biomarkers in clear cell renal carcinoma. Clin Transl Med. 2020;10(2):e45. doi:10.1002/ctm2.45
7. Yin L, Li W, Xu A, et al. SH3BGRL2 inhibits growth and metastasis in clear cell renal cell carcinoma via activating hippo/TEAD1-Twist1 pathway. EBioMedicine. 2020;51:102596. doi:10.1016/j.ebiom.2019.12.005
8. Xiong Z, Xiong W, Xiao W, et al. NNT-induced tumor cell “slimming” reverses the pro-carcinogenesis effect of HIF2a in tumors. Clin Transl Med. 2021;11(1):e264. doi:10.1002/ctm2.264
9. Ravaud A, Motzer RJ, Pandha HS, et al. Adjuvant sunitinib in high-risk renal-cell carcinoma after nephrectomy. N Engl J Med. 2016;375(23):2246–2254. doi:10.1056/NEJMoa1611406
10. Chaffer CL, Weinberg RA. A perspective on cancer cell metastasis. Science. 2011;331(6024):1559–1564. doi:10.1126/science.1203543
11. Campbell S, Uzzo RG, Allaf ME, et al. Renal mass and localized renal cancer: AUA guideline. J Urol. 2017;198(3):520–529. doi:10.1016/j.juro.2017.04.100
12. Chen W, Hill H, Christie A, et al. Targeting renal cell carcinoma with a HIF-2 antagonist. Nature. 2016;539(7627):112–117. doi:10.1038/nature19796
13. Cancer Genome Atlas Research N. Comprehensive molecular characterization of clear cell renal cell carcinoma. Nature. 2013;499(7456):43–49. doi:10.1038/nature12222
14. Chang WH, Forde D, Lai AG. Dual prognostic role of 2-oxoglutarate-dependent oxygenases in ten cancer types: implications for cell cycle regulation and cell adhesion maintenance. Cancer Commun (Lond). 2019;39(1):23. doi:10.1186/s40880-019-0369-5
15. Navas T, Kinders RJ, Lawrence SM, et al. Clinical evolution of epithelial-mesenchymal transition in human carcinomas. Cancer Res. 2020;80(2):304–318.
16. Huang TH, Wu ATH, Cheng TS, et al. In silico identification of thiostrepton as an inhibitor of cancer stem cell growth and an enhancer for chemotherapy in non-small-cell lung cancer. J Cell Mol Med. 2019;23(12):8184–8195. doi:10.1111/jcmm.14689
17. Qiu H, Li J, Liu Q, Tang M, Wang Y. Apatinib, a novel tyrosine kinase inhibitor, suppresses tumor growth in cervical cancer and synergizes with Paclitaxel. Cell Cycle. 2018;17(10):1235–1244. doi:10.1080/15384101.2018.1471315
18. Li LF, Kao KC, Liu YY, et al. Nintedanib reduces ventilation-augmented bleomycin-induced epithelial-mesenchymal transition and lung fibrosis through suppression of the Src pathway. J Cell Mol Med. 2017;21(11):2937–2949. doi:10.1111/jcmm.13206
19. Bergers G, Hanahan D. Modes of resistance to anti-angiogenic therapy. Nat Rev Cancer. 2008;8(8):592–603. doi:10.1038/nrc2442
20. Goldman M, Craft B, Swatloski T, et al. The UCSC cancer genomics browser: update 2015. Nucleic Acids Res. 2015;43(Databaseissue):D812–817. doi:10.1093/nar/gku1073
21. Cheng G, Song Z, Liu Y, et al. Long noncoding RNA SNHG12 indicates the prognosis of prostate cancer and accelerates tumorigenesis via sponging miR-133b. J Cell Physiol. 2020;235(2):1235–1246.
22. Xiao W, Wang X, Wang T, Chen B, Xing J. HAO2 inhibits malignancy of clear cell renal cell carcinoma by promoting lipid catabolic process. J Cell Physiol. 2019;234(12):23005–23016. doi:10.1002/jcp.28861
23. Xiao W, Wang X, Wang T, Xing J. TRIM2 downregulation in clear cell renal cell carcinoma affects cell proliferation, migration, and invasion and predicts poor patients’ survival. Cancer Manag Res. 2018;10:5951–5964. doi:10.2147/CMAR.S185270
24. Xiao W, Wang C, Chen K, et al. MiR-765 functions as a tumour suppressor and eliminates lipids in clear cell renal cell carcinoma by downregulating PLP2. EBioMedicine. 2020;51:102622. doi:10.1016/j.ebiom.2019.102622
25. Cai Q, Christie A, Rajaram S, et al. Ontological analyses reveal clinically-significant clear cell renal cell carcinoma subtypes with convergent evolutionary trajectories into an aggressive type. EBioMedicine. 2020;51:102526. doi:10.1016/j.ebiom.2019.10.052
26. Xie QE, Du X, Wang M, et al. Identification of serotonin as a predictive marker for breast cancer patients. Int J Gen Med. 2021;14:1939–1948. doi:10.2147/IJGM.S310591
27. Chen J, Tang H, Li T, et al. Comprehensive analysis of the expression, prognosis, and biological significance of OVOLs in breast cancer. Int J Gen Med. 2021;14:3951–3960. doi:10.2147/IJGM.S326402
28. Gao X, Yang J, Chen Y. Identification of a four immune-related genes signature based on an immunogenomic landscape analysis of clear cell renal cell carcinoma. J Cell Physiol. 2020;235(12):9834–9850. doi:10.1002/jcp.29796
29. Wen YC, Lin YW, Chu CY, et al. Melatonin-triggered post-transcriptional and post-translational modifications of ADAMTS1 coordinately retard tumorigenesis and metastasis of renal cell carcinoma. J Pineal Res. 2020;69(2):e12668. doi:10.1111/jpi.12668
30. Zeng B, Huang Y, Jin S, et al. Development and validation of a mitochondrial metabolism-associated nomogram for prediction of prognosis in clear cell renal cell carcinoma. Clin Transl Med. 2020;10(3):e120.
31. Zhang Y, Udayakumar D, Cai L, et al. Addressing metabolic heterogeneity in clear cell renal cell carcinoma with quantitative Dixon MRI. JCI Insight. 2017;2(15):e94278. doi:10.1172/jci.insight.94278
32. Qiu B, Ackerman D, Sanchez DJ, et al. HIF2alpha-dependent lipid storage promotes endoplasmic reticulum homeostasis in clear-cell renal cell carcinoma. Cancer Discov. 2015;5(6):652–667. doi:10.1158/2159-8290.CD-14-1507
33. Xiong Z, Xiao W, Bao L, et al. Tumor cell “Slimming” regulates tumor progression through PLCL1/UCP1‐mediated lipid browning. Adv Sci. 2019;6(10):1801862. doi:10.1002/advs.201801862
34. Xiao W, Xiong Z, Xiong W, et al. Melatonin/PGC1A/UCP1 promotes tumor slimming and represses tumor progression by initiating autophagy and lipid browning. J Pineal Res. 2019;67(4):e12607. doi:10.1111/jpi.12607
35. Zhu L, Ma N, Wang B, et al. Significant prognostic values of aquaporin mRNA expression in breast cancer. Cancer Manag Res. 2019;11:1503–1515. doi:10.2147/CMAR.S193396
36. Xu WH, Shi SN, Xu Y, et al. Prognostic implications of Aquaporin 9 expression in clear cell renal cell carcinoma. J Transl Med. 2019;17(1):363. doi:10.1186/s12967-019-2113-y
37. Liao S, Chen H, Liu M, et al. Aquaporin 9 inhibits growth and metastasis of hepatocellular carcinoma cells via Wnt/beta-catenin pathway. Aging. 2020;12(2):1527–1544. doi:10.18632/aging.102698
38. Han M, Xu R, Wang S, et al. Six-transmembrane epithelial antigen of prostate 3 predicts poor prognosis and promotes glioblastoma growth and invasion. Neoplasia. 2018;20(6):543–554. doi:10.1016/j.neo.2018.04.002
39. Zhang M, Lv X, Jiang Y, Li G, Qiao Q. Identification of aberrantly methylated differentially expressed genes in glioblastoma multiforme and their association with patient survival. Exp Ther Med. 2019;18(3):2140–2152.
40. Savci-Heijink CD, Halfwerk H, Koster J, van de Vijver MJ. A novel gene expression signature for bone metastasis in breast carcinomas. Breast Cancer Res Treat. 2016;156(2):249–259. doi:10.1007/s10549-016-3741-z
41. Wang M, Liu B, Li D, et al. Upregulation of IBSP expression predicts poor prognosis in patients with esophageal squamous cell carcinoma. Front Oncol. 2019;9:1117. doi:10.3389/fonc.2019.01117
 © 2021 The Author(s). This work is published and licensed by Dove Medical Press Limited. The full terms of this license are available at https://www.dovepress.com/terms.php and incorporate the Creative Commons Attribution - Non Commercial (unported, v3.0) License.
By accessing the work you hereby accept the Terms. Non-commercial uses of the work are permitted without any further permission from Dove Medical Press Limited, provided the work is properly attributed. For permission for commercial use of this work, please see paragraphs 4.2 and 5 of our Terms.
© 2021 The Author(s). This work is published and licensed by Dove Medical Press Limited. The full terms of this license are available at https://www.dovepress.com/terms.php and incorporate the Creative Commons Attribution - Non Commercial (unported, v3.0) License.
By accessing the work you hereby accept the Terms. Non-commercial uses of the work are permitted without any further permission from Dove Medical Press Limited, provided the work is properly attributed. For permission for commercial use of this work, please see paragraphs 4.2 and 5 of our Terms.