")
Back to Journals » OncoTargets and Therapy » Volume 9
Biomarker discovery to improve prediction of breast cancer survival: using gene expression profiling, meta-analysis, and tissue validation
Authors Meng L, Xu Y, Xu C, Zhang W
Received 29 May 2016
Accepted for publication 10 August 2016
Published 11 October 2016 Volume 2016:9 Pages 6177—6185
DOI https://doi.org/10.2147/OTT.S113855
Checked for plagiarism Yes
Review by Single anonymous peer review
Peer reviewer comments 3
Editor who approved publication: Dr Jianmin Xu
Liwei Meng, Yingchun Xu, Chaoyang Xu, Wei Zhang
Department of Breast and Thyroid Surgery, Shaoxing People’s Hospital, Shaoxing Hospital of Zhejiang University, Shaoxing, Zhejiang, People’s Republic of China
Purpose: Breast cancer is the leading cause of cancer death worldwide in women. The molecular mechanism for human breast cancer is unknown. Gene microarray has been widely used in breast cancer research to identify clinically relevant molecular subtypes as well as to predict prognosis survival. So far, the valuable multigene signatures in clinical practice are unclear, and the biological importance of individual genes is difficult to detect, as the described signatures virtually do not overlap. Early prognosis of this disease, breast invasive ductal carcinoma (IDC) and breast ductal carcinoma in situ (DCIS), is vital in breast surgery.
Methods: Thus, this study reports gene expression profiling in large breast cancer cohorts from Gene Expression Omnibus, including GSE29044 (N=138) and GSE10780 (N=185) test series and four independent validation series GSE21653 (N=266), GSE20685 (N=327), GSE26971 (N=276), and GSE12776 (N=204). Significantly differentially expressed genes in human breast IDC and breast DCIS were detected by transcriptome microarray analysis.
Results: We created a set of three genes (MAMDC2, TSHZ2, and CLDN11) that were significantly correlated with disease-free survival of breast cancer patients using a univariate Cox regression model (significance level P<0.01) in a meta-analysis. Based on the risk score of the three genes, the test series patients could be separated into low-risk and high-risk groups with significantly different survival times. This signature was validated in the other three cohorts. The prognostic value of this three-gene signature was confirmed in the internal validation series and another four independent breast cancer data sets. The prognostic impact of one of the three genes, CLDN11, was confirmed by immunohistochemistry. CLDN11 was significantly overexpressed in human breast IDC as compared with normal breast tissues and breast DCIS.
Conclusion: Using novel gene expression profiling together with a meta-analysis validation approach, we have identified a three-gene signature with independent prognostic impact. Furthermore, CLDN11 may offer a biomarker to predict prognosis as well as a new target for prognostic and therapeutic intervention for human breast IDC.
Keywords: meta-analysis, biomarker, IDC
Introduction
Breast cancer is the leading cause of cancer-related death in women worldwide. Although early-stage breast cancer patients are treated by surgery, the risk of recurrence is very high. Breast cancer type and cancer grade are two of the most vital characteristics, and they are the best-established prognostic factors in breast cancer.1–5
Approximately 45%–78% of all invasive breast cancers are associated with ductal carcinoma in situ (DCIS).6 Invasive ductal carcinoma (IDC) always requires radical treatment, chemotherapy, and radiotherapy, but conservative treatment is usually sufficient for DCIS. The American Joint Committee on Cancer TNM staging system is currently the only prognostic classification used in clinical practice to select patients for adjuvant chemotherapy.7–12 However, the TNM staging system fails to predict recurrence accurately in many patients undergoing curative surgery for breast cancer. Microarray-based gene expression profiling has been successfully used in clinical cancer research to subclassify cancer, to predict prognosis, or to evaluate the response to therapy.13–16
Several studies have exploited microarray technology to investigate gene expression profiles in breast cancer, but only a small subset demonstrates clear prognostic significance. Major genes have been discovered to identify the molecular subtypes that predict the prognosis and response to additional therapy. So far, only BRCA1/2 mutation analysis has been used in clinical practice as a predictive marker for breast cancer.17–21 In this study, we evaluated the expression levels of single genes for prognostic relevance as well as to find new gene signatures. Therefore, we initially mined previously published gene expression microarray data from the Gene Expression Omnibus (GEO). We identified a prognostic, three-gene signature from the GSE29044 and GSE10780 test series patients and another four independent GEO cohorts using the sample-splitting method and Cox regression analysis. We created a set of three genes (MAMDC2, TSHZ2, and CLDN11) that were significantly correlated with disease-free survival (DFS) of breast cancer patients using a univariate Cox regression model (significance level P<0.001) in a meta-analysis. Based on the risk score of three genes, the test series patients could be separated into low-risk and high-risk groups with significantly different survival times. This signature was validated in the other three cohorts. The prognostic value of this three-gene (MAMDC2, TSHZ2, and CLDN11) signature was confirmed in the internal validation series and another three independent breast cancer sets. Gene set enrichment analysis (GSEA) suggested that risk score positively correlated with several cancer metastases-related pathways. Using a novel gene expression profiling together with a meta-analysis validation approach, we have identified a three-gene signature with independent prognostic impact.
Materials and methods
Microarray data analysis of breast cancer
Affymetrix Human Genome U133plus2 Array for breast cancer gene expression microarray and corresponding clinical data used in this study were downloaded from the publicly available GEO databases (http://www.ncbi.nlm.nih.gov/geo/): GSE29044 and GSE10780. GSE29044 consisted of 73 breast cancer and 36 adjacent disease-free tissues. GSE10780 consisted of 143 histologically normal breast tissues and 42 IDC tissues. The data of CEL files were downloaded from GEO database and normalized at transcript and gene level using the Robust Multichip Average method.22 Expression Console 1.4.1 and Transcriptome Analysis Console v3.0 were used for microarray analysis.
Identification of prognostic biomarker and cluster analysis
Cluster analysis was performed using cluster 3.0 as described. The main principle behind the method is to collect a set of items (genes or arrays) into a tree, where items are joined by very short branches if they are very similar to each other, and by increasingly longer branches as their similarity decreases. We identified a set of genes that were significantly correlated with DFS of breast cancer patients (P<0.001 from the expression data to univariable Cox proportional hazards regression analysis using the BRB-Array Tools).23
Gene ontology and coexpression network analysis
All genes falling into significant temporal profiles (P<0.001), amounting to a total of 686 genes, underwent a vital function classification using the Gene Ontology (GO) analysis (NCBI). All the GO terms assigned to these genes were examined and obtained by Fisher’s exact test and χ2 test for calculating the level of significance as described.24,25 We present gene coexpression networks to identify interactions among genes. Based on the correlation between genes, the gene–gene interaction network was constructed, as described. To make a visual representation, only the strongest correlations were drawn in these renderings. Within the gene coexpression network, nodes simulate genes, and the edges between them simulate the interaction between them. Within the network analysis, a degree is the simplest, most important measure of the centrality of a gene within a network and determines the relative importance.
Gene set enrichment analysis
GSEA was performed by the JAVA program using MSigDB C2 CP: canonical pathways gene set collection.26 The GSEA, visualized in Cytoscape and the Enrichment Map software, was used to determine if the members of a given gene set were generally associated with risk score and was therefore performed on all mRNA genes on the Affymetrix Human Genome U133 Plus 2.0 ranked by enrichment score from most negative to most positive. A total of 1,000 random sample permutations was carried out, and the significance threshold set at false discovery rate (FDR) <0.01. If a gene set had a positive enrichment score, the majority of its members had higher expression accompanied with higher risk score, and the set was termed “enriched”.
Immunohistochemistry
Tissues for immunohistochemistry containing normal breast, breast IDC, and breast DCIS were routinely deparaffinized and rehydrated, and then were subjected to heat-induced epitope retrieval in 0.01 mM citrate buffer (pH 6.0). The slides were then incubated with Rabbit anti-Claudin 11 polyclonal antibody (1:200) at 4°C overnight. Sections were then stained with 3,3′-diaminobenzidine (Origene, Beijing, People’s Republic of China) for 2 minutes. All sections were counterstained with hematoxylin, dehydrated, and mounted.
Statistical analysis
For microarray analysis, differentially expressed genes were confirmed using a P-value threshold and FDR analysis. The threshold of truly significant genes was taken to be P-value <0.001 and FDR value <0.05. Genes were considered statistically significant if their permutation P-values were ≤0.01. To construct a predictive model, the selected genes were fitted in a multivariable Cox regression model in the test series.
Results
Gene expression profile in human breast cancer
Affymetrix Human Genome U133plus2 Array for breast cancer gene expression microarray and corresponding clinical data used in this study were downloaded from the publicly available GEO databases. Breast cancer gene expression microarrays GSE29044 and GSE10780 were analyzed for potential transcriptome changes in IDC using Expression Console 1.4.1 and Transcriptome Analysis Console v3.0. Hierarchical clustering showed that a total of 1,843 genes were differentially expressed (P<0.01) in IDC compared with normal and breast DCIS as shown in Figure 1.
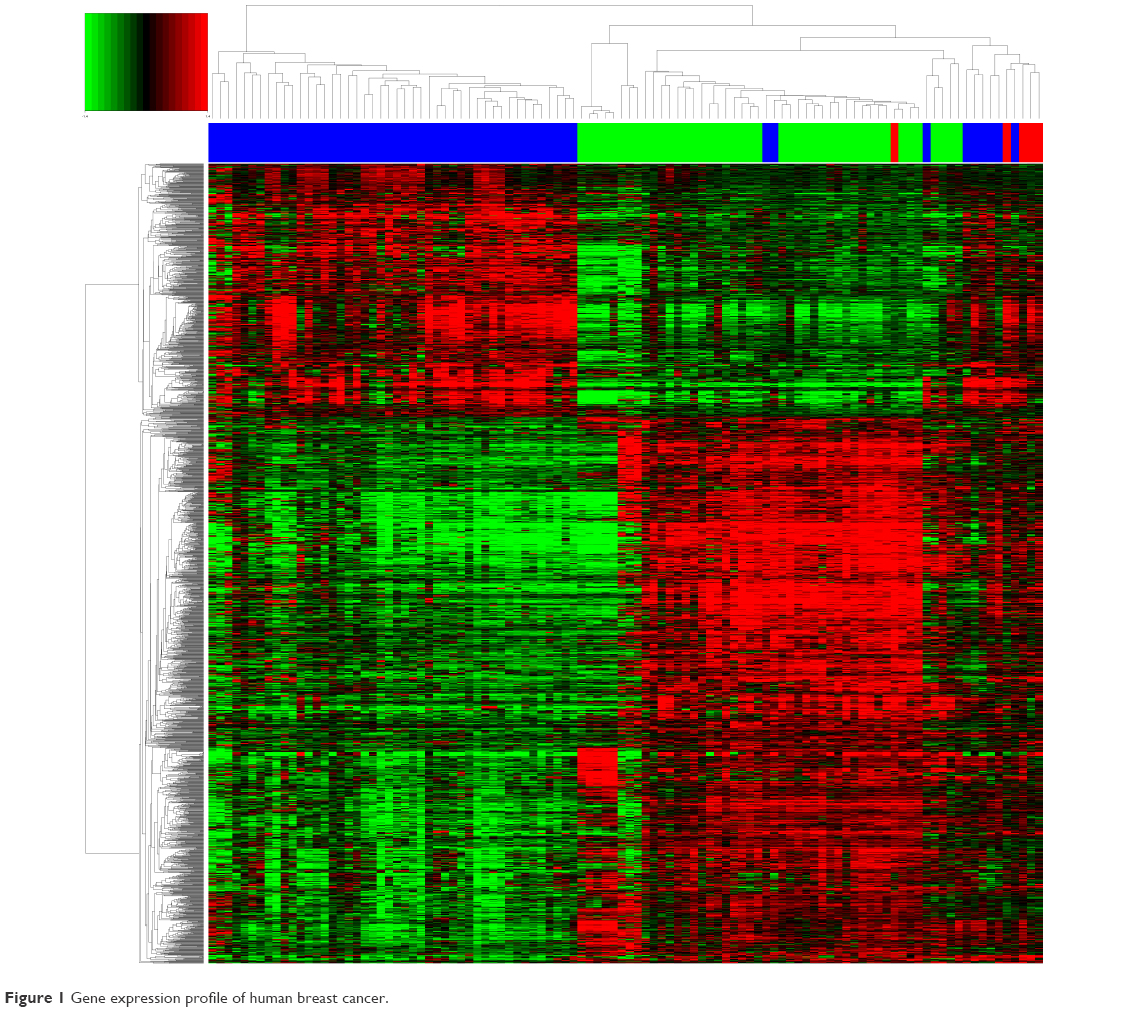 | Figure 1 Gene expression profile of human breast cancer. |
Gene ontology and pathway analysis
Significantly differentially expressed genes in IDC were then subjected to GO and pathway analysis. We found that many of these genes were related to cell cycle and carcinogenesis. Using the Kyoto Encyclopedia of Genes and Genomes and Gene Map annotator and Pathway Profiler databases, the significant signaling pathways were categorized into different groups including the PI3K-Akt signaling pathway, focal adhesion, metabolic pathways, Jak-STAT signaling pathway, and VEGF signaling pathway. Important genes and pathways involved in this process are shown in Figure 2A and B.
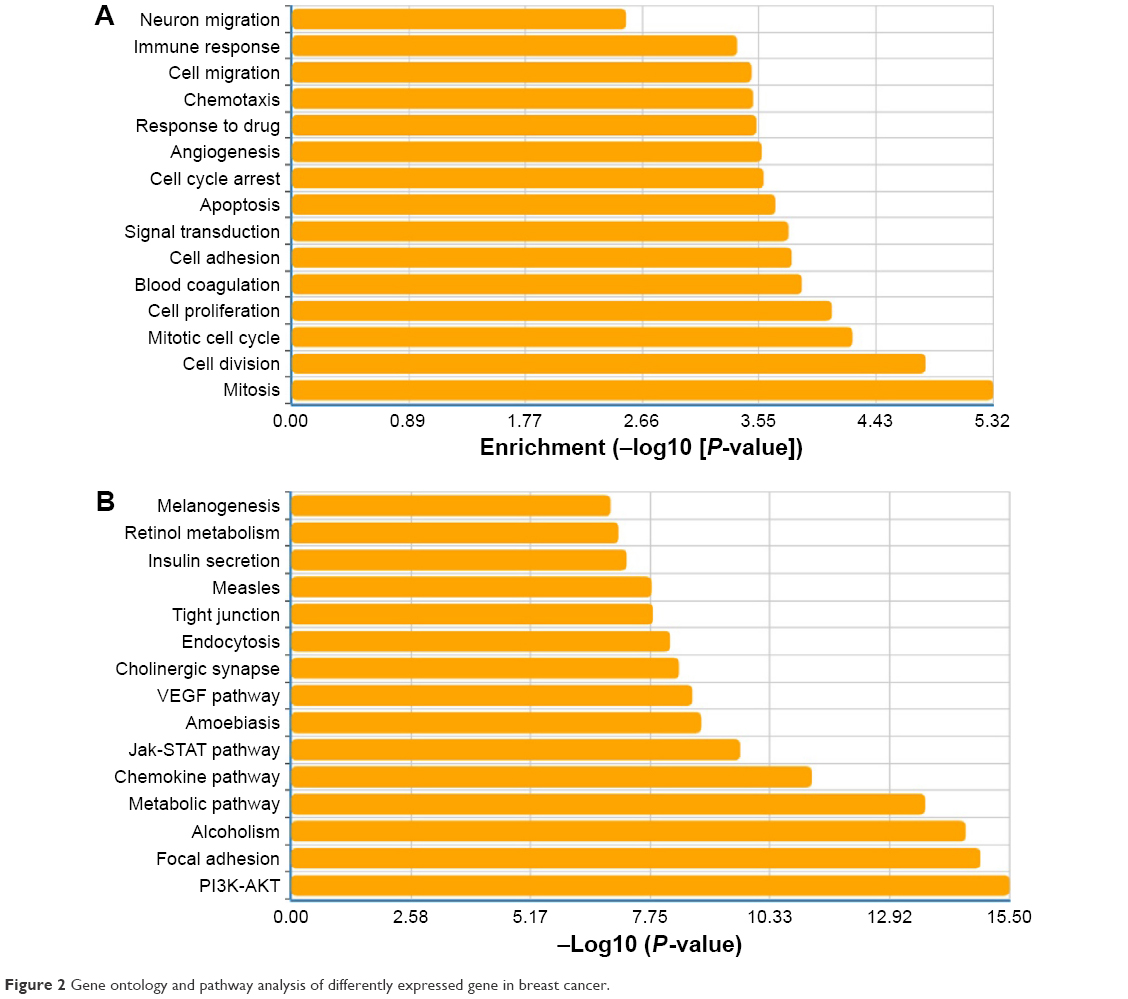 | Figure 2 Gene ontology and pathway analysis of differently expressed gene in breast cancer. |
Coexpression network and candidate biomarker
To determine which gene or genes may potentially play as a biomarker in the development of IDC, all significantly differentially expressed genes in IDC were then subjected to a gene coexpression network. In this cancer coexpression network, we found that MAMDC2, TSHZ2, CLDN11, SPRY2, ACTA2, CHRDL1, ABCA8, and so on, play a key role in the development of IDC. Gene networks were constructed as shown in Figure 3. The degree of a node describes the number of links one gene has to others within the gene network. Interestingly, central to this network was a set of three genes (MAMDC2, TSHZ2, and CLDN11), which directly controlled 20 neighboring genes it interacted with (Figure 3).
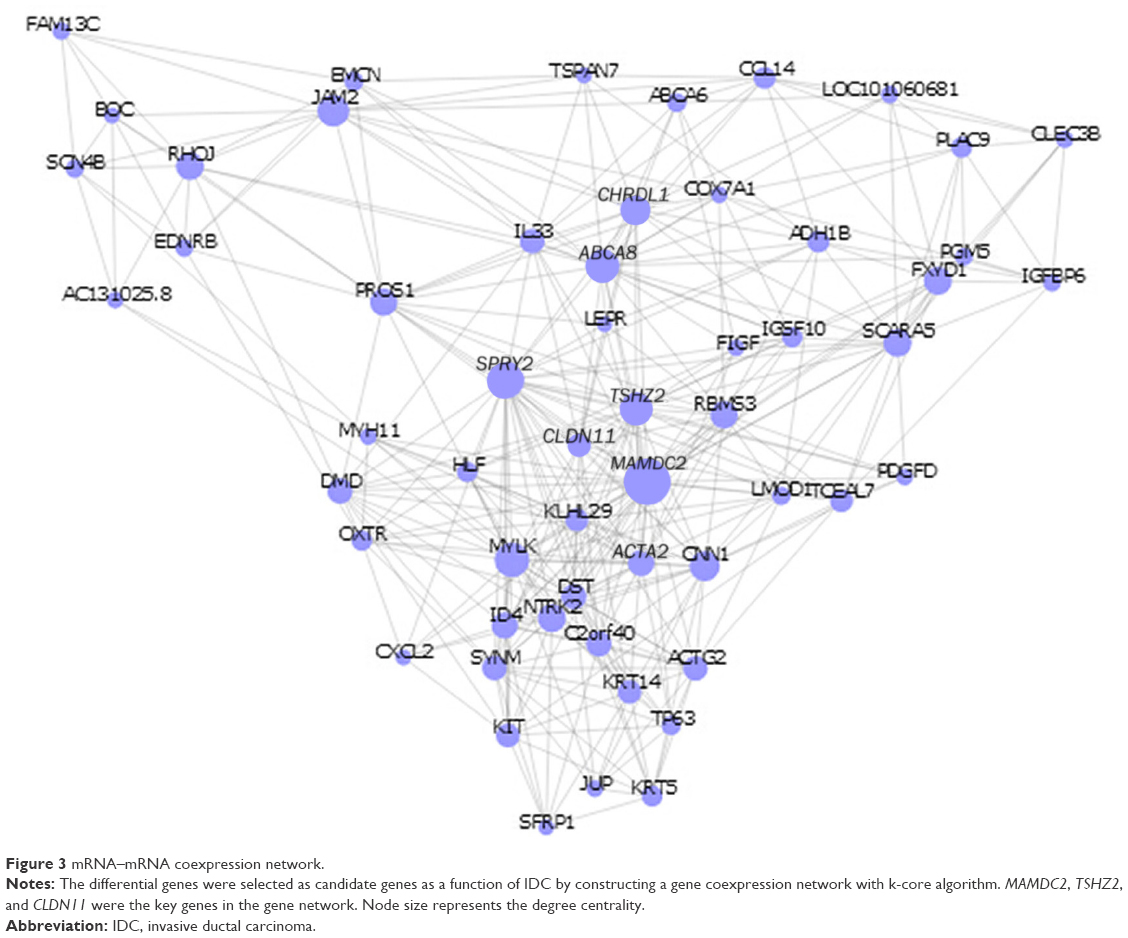 | Figure 3 mRNA–mRNA coexpression network. |
Survival analysis in the expression data
Invariable Cox proportional hazards regression model was performed to identify genes associated with prognostic relevance. We found a set of three genes (MAMDC2, TSHZ2, and CLDN11) that were significantly correlated with IDC patients’ DFS (P<0.001; Table 1). According to the expression of these three genes for prediction, we created a risk-score formula for prediction of breast cancer patient’s survival. Risk score = (1.05326× expression of MAMDC2) + (1.13029× expression of TSHZ2) + (0.73615× expression of CLDN11). Moreover, we calculated the risk score for each patient in the test series. We found that the median risk score could divide patients into a high-risk group (N=158) or a low-risk group (N=165) in the test series as the cutoff point. The high-risk group had significantly shorter median DFS compared with the low-risk group (log-rank test P<0.01), as shown in Figure 4.
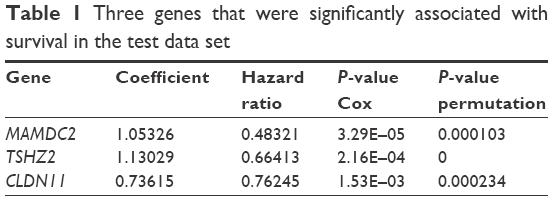 | Table 1 Three genes that were significantly associated with survival in the test data set |
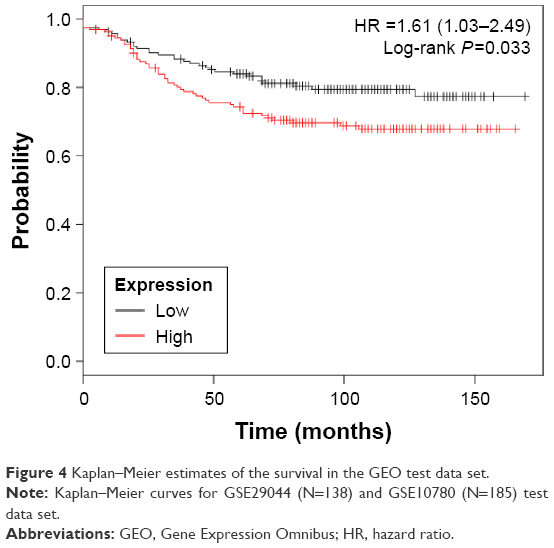 | Figure 4 Kaplan–Meier estimates of the survival in the GEO test data set. |
Validation for survival prediction in independent data sets
In order to validate risk-score formula, risk scores of four independent publicly available breast cancer gene expression data sets including four independent validation series GSE21653 (N=266), GSE20685 (N=327), GSE26971 (N=276), and GSE12776 (N=204) were calculated. By a set of three genes risk-score formula in the test series as the cutoff point, we divided patients into a high-risk and a low-risk group. Consistent to that described earlier, patients in the high-risk group had significantly shorter median DFS than those in the low-risk group, as shown in Figure 5.
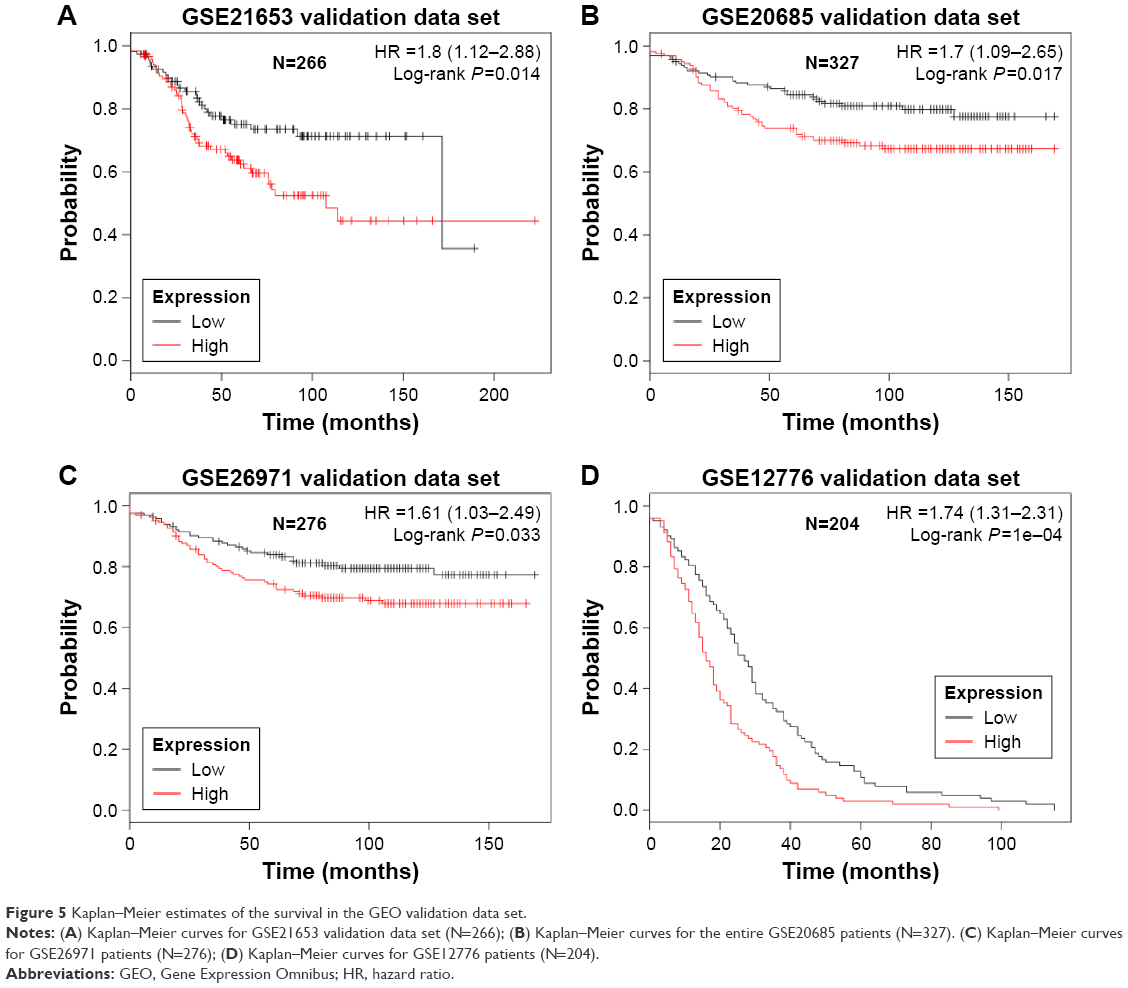 | Figure 5 Kaplan–Meier estimates of the survival in the GEO validation data set. |
Evaluation of CLDN11 expression as a prognostic marker in IDC
First, the prognostic impact of one of three genes, the claudin11 (CLDN11), was confirmed by immunohistochemistry. We demonstrated that CLDN11 is overexpressed in human IDC as compared with normal breast tissue and DCIS. Importantly, we showed CLDN11 as a marked expression increase in IDC compared with lower grade breast cancer, as shown in Figure 6A. We further measured the RNA expression level of CLDN11 by quantitative real-time polymerase chain reaction (qRT-PCR) in a set of 25 matched samples and detected significantly increased levels of CLDN11 mRNA in breast cancer tissues compared to the nontumor tissue (Figure 6B). High CLDN11 expression was also found to correlate with shorter overall survival (P=0.012) of breast cancer patients (Figure 6C). These results demonstrated that CLDN11 may offer a biomarker to predict prognosis as well as a new target for prognostic and therapeutic intervention for human breast IDC.
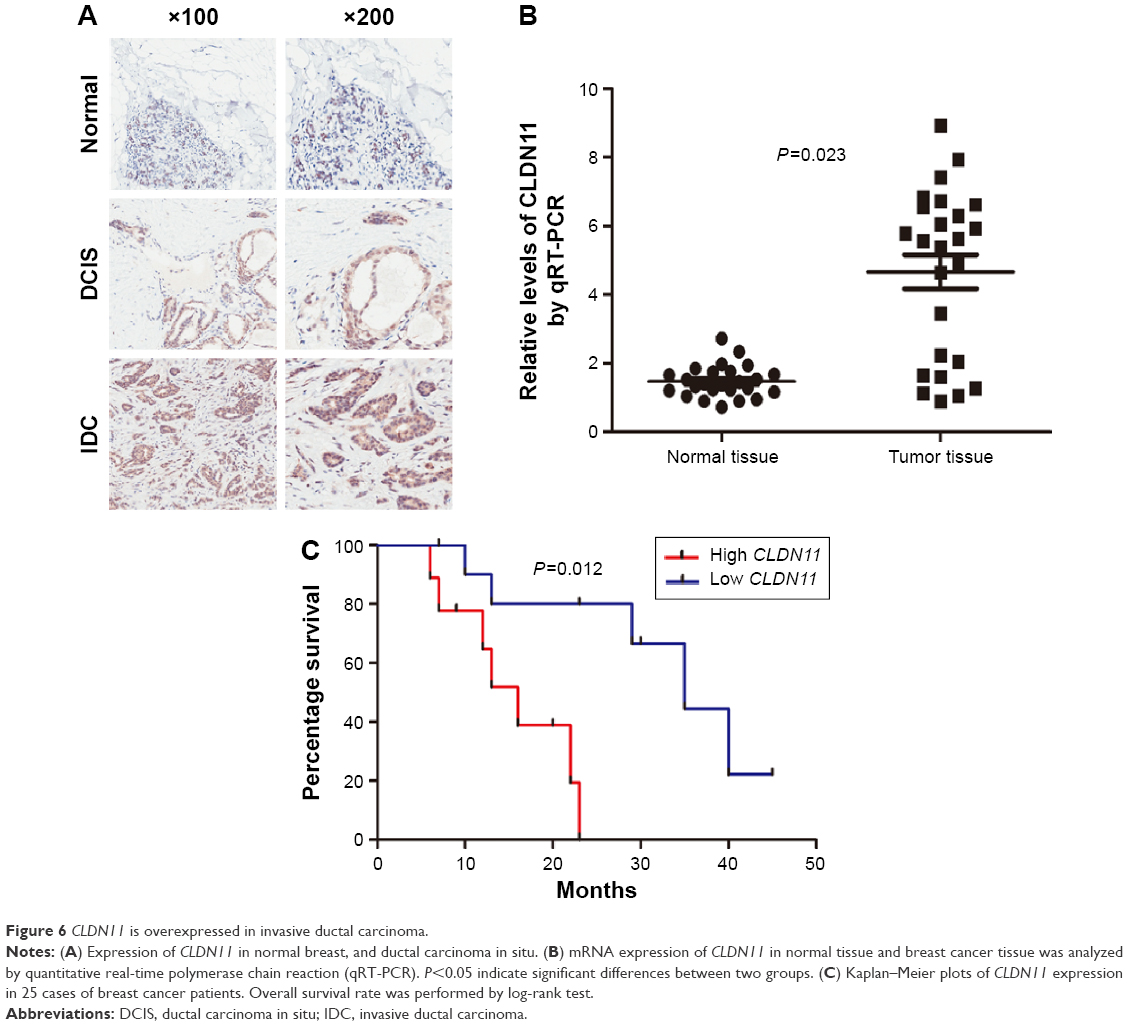 | Figure 6 CLDN11 is overexpressed in invasive ductal carcinoma. |
Discussion
Breast cancer is a multistep and complex disease that has special biological features and clinical behaviors. DCIS is a noninvasive form of breast cancer. Approximately 65% of all invasive breast cancers are associated with DCIS.27–31 What extent DCIS and IDC share low-risk susceptibility gene or whether there are differences in the strength of association for shared gene is not clear. Efforts are focused on characterizing the molecular subtype gene of these two tumors to diagnose them and define new targets to therapy. Hence, early classification of IDC and DCIS is a vital step in breast cancer surgery, especially to determine whether DCIS is associated with tumor cell microinvasion.32
Previous studies have exploited microarray technology to investigate gene expression profiles in breast cancer, but only a small subset demonstrates clear prognostic significance. Major genes have been created to identify molecular subtypes that predict prognosis and response to additional therapy. So far, only BRCA1/2 mutation analysis has been used in clinical practice as a predictive marker for breast cancer. In this study, we evaluate the expression levels of single genes for prognostic relevance as well as to find new gene signatures. Therefore, we initially mined previously published gene expression microarray data from the GEO. We identified a prognostic, three-gene signature from the GSE39582 test series patients, and another two independent GEO cohorts using the sample-splitting method and Cox regression analysis. We created a set of three genes that were significantly correlated with breast cancer patients’ DFS using a univariate Cox regression model (significance level P<0.01) in a meta-analysis. Based on the risk score of the three genes, the test series patients could be separated into low-risk and high-risk groups with significantly different survival times. This signature was validated in the other three cohorts. The prognostic value of this three-gene signature was confirmed in the internal validation series and another three independent breast cancer sets. GSEA suggested that risk score positively correlated with several cancer metastases-related pathways. Using a novel gene expression profiling together with a meta-analysis validation approach, we have identified a set of three-gene signature with independent prognostic impact.
In our study, we identified a prognostic, three-gene signature from the GSE29044 and GSE10780 test series patients and another four independent GEO cohorts using the sample-splitting method and Cox regression analysis. We created a set of three genes (MAMDC2, TSHZ2, and CLDN11) that were significantly correlated with DFS of breast cancer patients using a univariate Cox regression model (significance level P<0.001) in a meta-analysis. Based on the risk score of three genes, the test series patients could be separated into low-risk and high-risk groups with significantly different survival times. This signature was validated in the other three cohorts. The prognostic value of this three-gene (MAMDC2, TSHZ2, and CLDN11) signature was confirmed in the internal validation series and another three independent breast cancer sets. GSEA suggested that risk score positively correlated with several cancer metastases-related pathways. Using a novel gene expression profiling together with a meta-analysis validation approach, we have identified a set of three-gene signature with independent prognostic impact.
Acknowledgment
We thank the Department of Breast and Thyroid Surgery of Shaoxing People’s Hospital for providing study data.
Author contributions
All authors contributed toward data analysis, drafting and critically revising the paper and agree to be accountable for all aspects of the work.
Disclosure
The authors report no conflicts of interest in this work.
References
Rakha EA, Teoh TK, Lee AH, Nolan CC, Ellis IO, Green AR. Further evidence that E-cadherin is not a tumour suppressor gene in invasive ductal carcinoma of the breast: an immunohistochemical study. Histopathology. 2013;62(5):695–701. | ||
Ch’ng ES, Tuan Sharif SE, Jaafar H. In human invasive breast ductal carcinoma, tumor stromal macrophages and tumor nest macrophages have distinct relationships with clinicopathological parameters and tumor angiogenesis. Virchows Arch. 2013;462(2):257–267. | ||
Baretta Z, Guindalini RS, Khramtsova G, Olopade OI. Resistance to trastuzumab in HER2-positive mucinous invasive ductal breast carcinoma. Clin Breast Cancer. 2013;13:156–158. | ||
Zheng J, Alsaadi T, Blaichman J, et al. Invasive ductal carcinoma of the breast: correlation between tumor grade determined by ultrasound-guided core biopsy and surgical pathology. AJR Am J Roentgenol. 2013;200(1):W71–W74. | ||
Currie MJ, Beardsley BE, Harris GC, et al. Immunohistochemical analysis of cancer stem cell markers in invasive breast carcinoma and associated ductal carcinoma in situ: relationships with markers of tumor hypoxia and microvascularity. Hum Pathol. 2013;44(3):402–411. | ||
Mao X, He J, Li T, et al. Application of imaging mass spectrometry for the molecular diagnosis of human breast tumors. Sci Rep. 2016;6:21043. | ||
Kim JH, Baek TH, Yim HS, et al. Collagen triple helix repeat containing-1 (CTHRC1) expression in invasive ductal carcinoma of the breast: the impact on prognosis and correlation to clinicopathologic features. Pathol Oncol Res. 2013;19(4):731–737. | ||
Knudsen ES, Dervishaj O, Kleer CG, Pajak T, Schwartz GF, Witkiewicz AK. EZH2 and ALDH1 expression in ductal carcinoma in situ: complex association with recurrence and progression to invasive breast cancer. Cell Cycle. 2013;12(13):2042–2050. | ||
Hoefgen HR, Merritt DF. Invasive ductal carcinoma in a 46, XY partial androgen insensitivity syndrome patient on hormone therapy. J Pediatr Adolesc Gynecol. 2015;28(4):e95–e97. | ||
Sui K, Niguma T, Yamada M, Kojima T, Mimura T. [A case of a patient who underwent resection of the remnant pancreatic cancer following a distal pancreatectomy for invasive ductal carcinoma]. Gan To Kagaku Ryoho. 2014;41:2163–2165. Japanese. | ||
Andjelic-Dekic N, Bozovic-Spasojevic I, Milosevic S, Matijasevic M, Karadzic K. A rare case of isolated adrenal metastasis of invasive ductal breast carcinoma. Srp Arh Celok Lek. 2014;142(9–10):597–601. | ||
Ouldamer L, Lechaux E, Arbion F, Body G, Vilde A. What should be the width of radiological margin to optimize resection of non-palpable invasive or in situ ductal carcinoma? Breast. 2014;23(6):889–893. | ||
Huang KT, Tan D, Chen KH, Walker AM. Blockade of estrogen-stimulated proliferation by a constitutively-active prolactin receptor having lower expression in invasive ductal carcinoma. Cancer Lett. 2015;358(2):152–160. | ||
Ko ES, Han BK, Kim RB, et al. Apparent diffusion coefficient in estrogen receptor-positive invasive ductal breast carcinoma: correlations with tumor-stroma ratio. Radiology. 2014;271(1):30–37. | ||
Min KW, Kim DH, Do SI, et al. Expression patterns of stromal MMP-2 and tumoural MMP-2 and -9 are significant prognostic factors in invasive ductal carcinoma of the breast. APMIS. 2014;122(12):1196–1206. | ||
Otomi Y, Otsuka H, Terazawa K, et al. Comparing the performance of visual estimation and standard uptake value of F-18 fluorodeoxyglucose positron emission tomography/computed tomography for detecting malignancy in pancreatic tumors other than invasive ductal carcinoma. J Med Invest. 2014;61(1–2):171–179. | ||
Suciu C, Muresan A, Cornea R, Suciu O, Dema A, Raica M. Semi-automated evaluation of Ki-67 index in invasive ductal carcinoma of the breast. Oncol Lett. 2014;7(1):107–114. | ||
Tan D, Chen KE, Deng C, et al. An N-terminal splice variant of human Stat5a that interacts with different transcription factors is the dominant form expressed in invasive ductal carcinoma. Cancer Lett. 2014;346(1):148–157. | ||
Wahler J, So JY, Kim YC, et al. Inhibition of the transition of ductal carcinoma in situ to invasive ductal carcinoma by a Gemini vitamin D analog. Cancer Prev Res (Phila). 2014;7(6):617–626. | ||
Wan Abdul Rahman WF, Fauzi MH, Jaafar H. Expression of DNA methylation marker of paired-like homeodomain transcription factor 2 and growth receptors in invasive ductal carcinoma of the breast. Asian Pac J Cancer Prev. 2014;15(19):8441–8445. | ||
Yang J, Zhu J, He K, et al. Proteomic profiling of invasive ductal carcinoma (IDC) using magnetic beads-based serum fractionation and MALDI-TOF MS. J Clin Lab Anal. 2015;29(4):321–327. | ||
Lu TP, Tsai MH, Lee JM, et al. Identification of a novel biomarker, SEMA5A, for non-small cell lung carcinoma in nonsmoking women. Cancer Epidemiol Biomarkers Prev. 2010;19(10):2590–2597. | ||
Hu Y, Chen HY, Yu CY, et al. A long non-coding RNA signature to improve prognosis prediction of colorectal cancer. Oncotarget. 2014;5(8):2230–2242. | ||
Sun Y, Shi N, Li H, et al. Ghrelin suppresses Purkinje neuron P-type Ca(2+) channels via growth hormone secretagogue type 1a receptor, the betagamma subunits of go-protein, and protein kinase a pathway. Cell Signal. 2014;26:2530–2538. | ||
Antonioli L, Hasko G, Fornai M, Colucci R, Blandizzi C. Adenosine pathway and cancer: where do we go from here? Expert Opin Ther Targets. 2014;18:973–977. | ||
Croken MM, Qiu W, White MW, Kim K. Gene set enrichment analysis (GSEA) of Toxoplasma gondii expression datasets links cell cycle progression and the bradyzoite developmental program. BMC Genomics. 2014;15:515. | ||
Parra-Herran C, Hope T, Rashed T, Slodkowska E, Lu FI, Nofech-Mozes S. Morphometric analysis in the diagnosis of low-grade ductal and lobular carcinoma in situ of the breast. Anal Quant Cytopathol Histpathol. 2015;37(6):331–338. | ||
Mardekian SK, Bombonati A, Palazzo JP. Ductal carcinoma in situ of the breast: the importance of morphologic and molecular interactions. Hum Pathol. 2016;49:114–123. | ||
Rutter CE, Park HS, Killelea BK, Evans SB. Growing use of mastectomy for ductal carcinoma-in situ of the breast among young women in the United States. Ann Surg Oncol. 2015;22(7):2378–2386. | ||
Jin ZQ, Lin MY, Hao WQ, et al. Diagnostic evaluation of ductal carcinoma in situ of the breast: ultrasonographic, mammographic and histopathologic correlations. Ultrasound Med Biol. 2015;41(1):47–55. | ||
Butler-Henderson K, Lee AH, Lenzo NP, Price RI. Epidemiology of ductal carcinoma in situ in Western Australia: implications for surgical margins and management. Breast Cancer. 2015;22(6):641–647. | ||
Nessim C, Winocour J, Holloway DP, Saskin R, Holloway CM. Wait times for breast cancer surgery: effect of magnetic resonance imaging and preoperative investigations on the diagnostic pathway. J Oncol Pract. 2015;11(2):e131–e138. |
 © 2016 The Author(s). This work is published and licensed by Dove Medical Press Limited. The full terms of this license are available at https://www.dovepress.com/terms.php and incorporate the Creative Commons Attribution - Non Commercial (unported, v3.0) License.
By accessing the work you hereby accept the Terms. Non-commercial uses of the work are permitted without any further permission from Dove Medical Press Limited, provided the work is properly attributed. For permission for commercial use of this work, please see paragraphs 4.2 and 5 of our Terms.
© 2016 The Author(s). This work is published and licensed by Dove Medical Press Limited. The full terms of this license are available at https://www.dovepress.com/terms.php and incorporate the Creative Commons Attribution - Non Commercial (unported, v3.0) License.
By accessing the work you hereby accept the Terms. Non-commercial uses of the work are permitted without any further permission from Dove Medical Press Limited, provided the work is properly attributed. For permission for commercial use of this work, please see paragraphs 4.2 and 5 of our Terms.