")
Back to Journals » International Journal of General Medicine » Volume 14
Bioinformatics Analysis of KIF1A Expression and Gene Regulation Network in Ovarian Carcinoma
Authors Lu X , Li G, Liu S, Wang H, Zhang Z, Chen B
Received 6 June 2021
Accepted for publication 14 July 2021
Published 21 July 2021 Volume 2021:14 Pages 3707—3717
DOI https://doi.org/10.2147/IJGM.S323591
Checked for plagiarism Yes
Review by Single anonymous peer review
Peer reviewer comments 2
Editor who approved publication: Dr Scott Fraser
Xiaoyuan Lu,1,* Guilin Li,2,* Sicong Liu,3 Haihong Wang,1 Zhengzheng Zhang,1 Buze Chen1,4
1Department of Gynecology, The affiliated Hospital of Xuzhou Medical University, Xuzhou, 221000, Jiangsu, People’s Republic of China; 2Department of Gynecology, Maternal and Child Health Care Hospital affiliated to Xuzhou Medical University, Xuzhou, 221000, Jiangsu, People’s Republic of China; 3Graduate School, Xuzhou Medical University, Xuzhou, 221000, Jiangsu, People’s Republic of China; 4Xuzhou Medical University, Xuzhou, 221000, Jiangsu, People’s Republic of China
*These authors contributed equally to this work
Correspondence: Buze Chen; Zhengzheng Zhang
Department of Gynecology, The affiliated Hospital of Xuzhou Medical University, No. 99 West Huaihai Road, Quanshan District, Xuzhou, 221000, Jiangsu, People’s Republic of China
Tel +86-15262020735
; +86-51683353733
Email [email protected]; [email protected]
Background: The study aims to analyze the expression levels of kinesin family member 1A (KIF1A) in ovarian cancer (OC) and explore its clinical significance in the development of OC and its potential regulatory network.
Methods: The Cancer Genome Atlas (TCGA) OC data was used to examine the expression differences between OC and normal tissue and explore the correlation with tumor stage. The relationship between KIF1A expression and prognosis was analyzed using Oncomine and Kaplan–Meier plotter tools. The co-expression network of KIF1A in TCGA OC was analyzed based on the application of cBioPortal, GO cluster, and KEGG analyses were performed based on the co-expression network. Immune-infiltration analysis were used to analyze the significant involvement of KIF1A in function.
Results: KIF1A was highly elevated in OC tissues and KIF1A expression was significantly correlated with the FIGO stage (P=0.015) and age (P=0.020). High KIF1A expression of OC predicted the poor prognosis including overall survival (OS) (HR: 1.27; 95% CI: 1.11– 1.45; P=0.00046) and post-progression survival (PFS) (HR: 1.18; 95% CI: 1.03– 1.35; P=0.015). GO and KEGG analysis showed KIF1A had a potential role in the biological process of ATP-dependent chromatin remodeling, transcription, DNA-templated cytolysis, positive regulation of T cell proliferation, positive regulation of transcription, DNA-templated via cell adhesion molecules (CAMs), primary immunodeficiency, oxidative phosphorylation, NF-kappa B signaling pathway, pathways in cancer and Wnt signaling pathway, and immune infiltrating cells.
Conclusion: KIF1A was highly expressed and correlated with poor survival and immune infiltration in OC, and it may be a prognostic biomarker in OC.
Keywords: KIF1A, biomarker, ovarian cancer, prognostic
Introduction
Ovarian cancer is a fatal gynaecological malignancy with 295,414 new cases and 184,799 deaths worldwide in 2018, showing an upward trend.1,2 High grade serous ovarian cancer (HGSOC) is the most common subtype (70%) and is associated with higher malignancy and poorer prognosis.3 OC has a high mortality rate and poses a serious threat to women’s health due to its insidious onset, high malignancy, lack of typical symptoms in the early stages, and the tendency to develop resistance to chemotherapy.4 In addition to surgery, paclitaxel-based chemotherapy combined with platinum-based chemotherapy is the main chemotherapy regimen for OC, and the majority of patients in clinical practice have significantly longer survival after surgery and chemotherapy.5 With the development of modern biomedical technology, exploring the mechanism of disease development from the perspective of molecular biology is one of the directions of medical development. If we can trace back the root cause, discover the molecular proteins related to the pathogenesis of OC, and clarify their role in the disease process, it will be of great significance to the treatment and basic research of OC.
Kinesin, the smallest known molecular motor, catalyzes the hydrolysis of adenosine triphosphate (ATP), efficiently converting the chemical energy carried by ATP molecules into mechanical energy, resulting in a continuous step along the microtubules and the transport of the organelles and intracellular material they carry.6,7 Kinesins include a large superfamily of motor proteins (KIF superfamily). Kinesin family member 1A (KIF1A) belongs to the kinesin-3 family and is often found as a monomer in the organism, acting as a kinesin motor for positive movement along microtubules. KIF1A is a potential diagnostic marker for head and neck squamous cell carcinoma (HNSCC), oral squamous cell carcinomas (OSCC), breast cancer (BC), nasopharyngeal carcinoma (NPC).8–11 KIF1A is a potential minimal residual disease (MRD) marker for neuroblastoma.12 However, the function of KIF1A has not been noted in OC.
In the present study, we evaluated the expression of KIF1A in OC specimens and analyzed the relationship between OC and prognosis in combination with clinicopathological features, and analyzed the possible signal regulatory network of KIF1A in OC by bioinformatics methods.
Materials and Methods
Expression Analyses of KIF1A in OC Tissue
The Oncomine data platform offers a wide range of tumor gene cores (https://www.Oncomine.org), covering 715 independent databases (86,733 samples) and high-quality specialized data analysis methods. For data analysis, the analysis type is set to “cancer vs normal”, the dataset type is set to “TCGA dataset”, the cancer type is set to “ovarian cancer”, and the mRNA expression data of KIF1A is extracted.
Baseline information tables and single gene logistic regression. R package: Basic R package, R (version 3.6.3) (statistical analysis and visualization). Molecule: KIF1A[ENSG00000130294]. Subgroup: Median. Dependent variable: KIF1A. Types of independent variables: Low High dichotomous. Data: RNAseq data and clinical data in level 3 HTSeq-FPKM format from the TCGA (https://portal.gdc.cancer.gov/) OC (Ovarian Plasmacytoid Cystic Carcinoma) project. Data filtering: data with clinical information retained. Data conversion: RNAseq data in FPKM (Fragments Per Kilobase per Million) format converted to TPM (transcripts per million reads) format and grouped according to molecular expression.
Expression differences. Software: R (version 3.6.3). R package: mainly ggplot2 (for visualization). Molecule: KIF1A. Data: UCSC XENA (https://xenabrowser.net/datapages/) RNAseq data in TPM format for TCGA and GTEx processed in unison by the Toil process [1]. Extracted OC of TCGA and corresponding normal tissue data in GTEx. Data filtering: None. Data transformation: RNAseq data in TPM format and log2 transformed for sample-to-sample expression comparisons. Significance markers: ns, p≥0.05; *p< 0.05; **p<0.01; ***p<0.001
The Relationship Between KIF1A and Clinical Characteristics
Software: R (version 3.6.3). R package: mainly ggplot2. Molecule: KIF1A. Clinical variables: race and FIGO stage. Data: RNAseq data and clinical data in level 3 HTSeq-FPKM format from the TCGA OC project. Data filtering: Retain data with clinical information. Data transformation: RNAseq data in FPKM format converted to TPM format and log2 transformed for analysis. Significance markers: ns, p≥0.05; *p< 0.05; **p<0.01; ***p<0.001.
The Receiver Operating Characteristic (ROC) Curve of KIF1A
Software: R (version 3.6.3). R packages: mainly the pROC package (for analysis) || ggplot2 package (for visualization). Molecular: KIF1A. Clinical variables: Tumor vs Normal. Data: UCSC XENA (https://xenabrowser.net/datapages/) RNAseq data in TPM format for TCGA and GTEx processed in unison by the Toil process.13 Extracted OC from TCGA and corresponding normal tissue data in GTEx. Data transformation: RNAseq data in TPM format and log2 transformed for analysis.
The Relationship Between Gene Expression and OC Prognosis
Gene microarray data of OC based on mRNA level using Kaplan–Meier plot tool14 (http://kmplot.com/analysis/), screening of KIF1A, the grouping of OC patients with elevated expression of KIF1A and low expression of KIF1A according to KIF1A. In the case of OC patients, the median expression level of KIF1A was determined by using the auto selected best cutoff value, and the overall survival (OS) and post-progression survival (PPS) of patients with OC were analyzed using the auto select best cutoff value. The relationship between the two groups of patients with OC and their survival.
Analysis of KIF1A-Coexpression Genes
In the cBioPortal database,15,16 we selected ovarian serous cystadenocarcinoma (TCGA, PanCancer Atlas), analyzed its mRNA expression (based on RNA Seq V2 analysis), and filtered it into the cBioPortal database. We evaluated the expression of KIF1A in 434 OC tumor specimens and selected the first 3000 genes for GO cluster analysis to elucidate the probable signal regulatory network of KIF1A in OC.
GO and KEGG Analysis of KIF1A-Coexpression Genes
The DAVID database17,18 was utilized to perform GO and KEGG analysis for the KIF1A co-expression genes, including BP (biological process), MF (molecular function), CC (cellular component) and pathway analysis.
Immune Infiltration Analysis by ssGSEA
Software: R (version 3.6.3). R package: GSVA package. Immunocell Algorithm: ssGSEA (built-in algorithm of GSVA package). Molecular: KIF1A. Immune Cells: aDC [activated DC]; B cells; CD8 T cells; Cytotoxic cells; DC; Eosinophils; iDC [immature DC]; Macrophages; Mast cells; Neutrophils; NK CD56bright cells; NK CD56dim cells; NK cells; pDC [Plasmacytoid DC]; T cells; T helper cells; Tcm [T central memory]; Tem [T effector memory]; Tfh [T follicular helper]; Tgd [T gamma delta]; Th1 cells; Th17 cells; Th2 cells; Treg. Data: RNAseq data and clinical data in level 3 HTSeq-FPKM format from the TCGA OV project. Data filtering: removal of paraneoplastic tissue. Expression profile data conversion: FPKM format RNAseq data converted to TPM format and log2 transformed for analysis.
Statistical Analysis
All statistical analyses were performed using R (v.3.6.3). The relationship between clinical pathologic features and KIF1A was analyzed using the Wilcoxon rank sum test, Chi-square test, and Fisher exact test. P values less than 0.05 were considered statistically significant.
Results
Clinical Characteristics
As shown in Table 1, the FIGO stage included 1 Stage I (0.3%), 23 Stage II (6.1%), 295 Stage III (78.5%), and 57 Stage IV (15.2%). The primary therapy outcome included 27 PD (8.8%), 22 SD (7.1%), 43 PR (14%), and 216 CR (70.1%). The race included 328 white patients (89.9%), 12 Asian patients (3.3%), and 25 Black or African American patients (6.8%). The histologic grade included 45 G2 (12.3%), and 322 G3 (87.7%). The age included 208 patients (≤60, 54.9%), and 171 patients (>60, 45.1%). The anatomic neoplasm subdivision included 102 unilateral (28.6%), and 255 bilateral (71.4%). The venous invasion included 41 No (39%), and 64 Yes (61%). The lymphatic invasion included 48 No (32.2%), and 101 Yes (67.8%). The tumor residual included 67 NRD (20%), and 268 RD (80%). The median age is 59 years, with a range of 51 to 68 years.
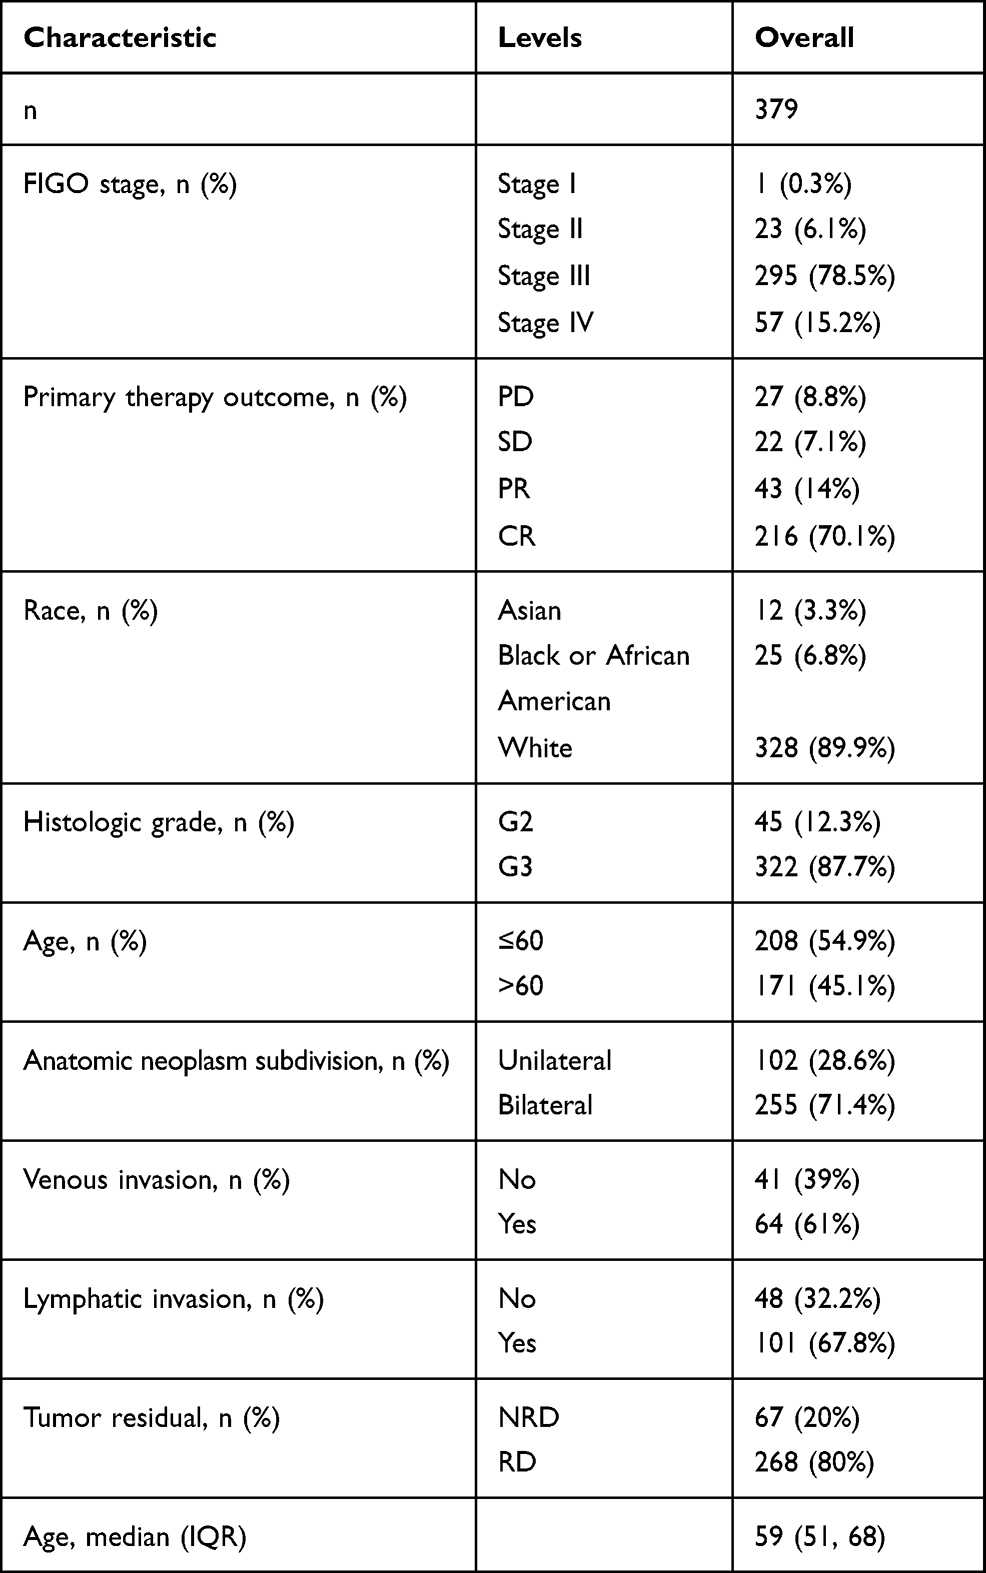 |
Table 1 Characteristics of Patients with OC Based on TCGA |
KIF1A Expression is Correlated with Poor Clinical Characteristics of OC
To determine the difference of KIF1A expression between tumors and normal tissues, the Oncomine database was used to analyze the expression level of KIF1A mRNA in different tumors and normal tissues of different types of tumors (Figure 1A). Oncomine analysis demonstrated that the expression of KIF1A in OC was significantly higher than that in normal cells (Figure 1B). The expression levels of KIF1A in OC tissues were significantly higher than in normal tissues (Figure 2A). KIF1A expression was associated with FIGO stage (P=0.025) and age (P=0.026) (Table 2). The logistic regression results in Table 3 and Figure 2B–C suggested that KIF1A was significantly related to FIGO stage (P=0.015) and age (P=0.020). The area under curve (AUC) of KIF1A was 0.830, suggesting that KIF1A could be served as an ideal biomarker to distinguish OC from nontumor tissue (Figure 3).
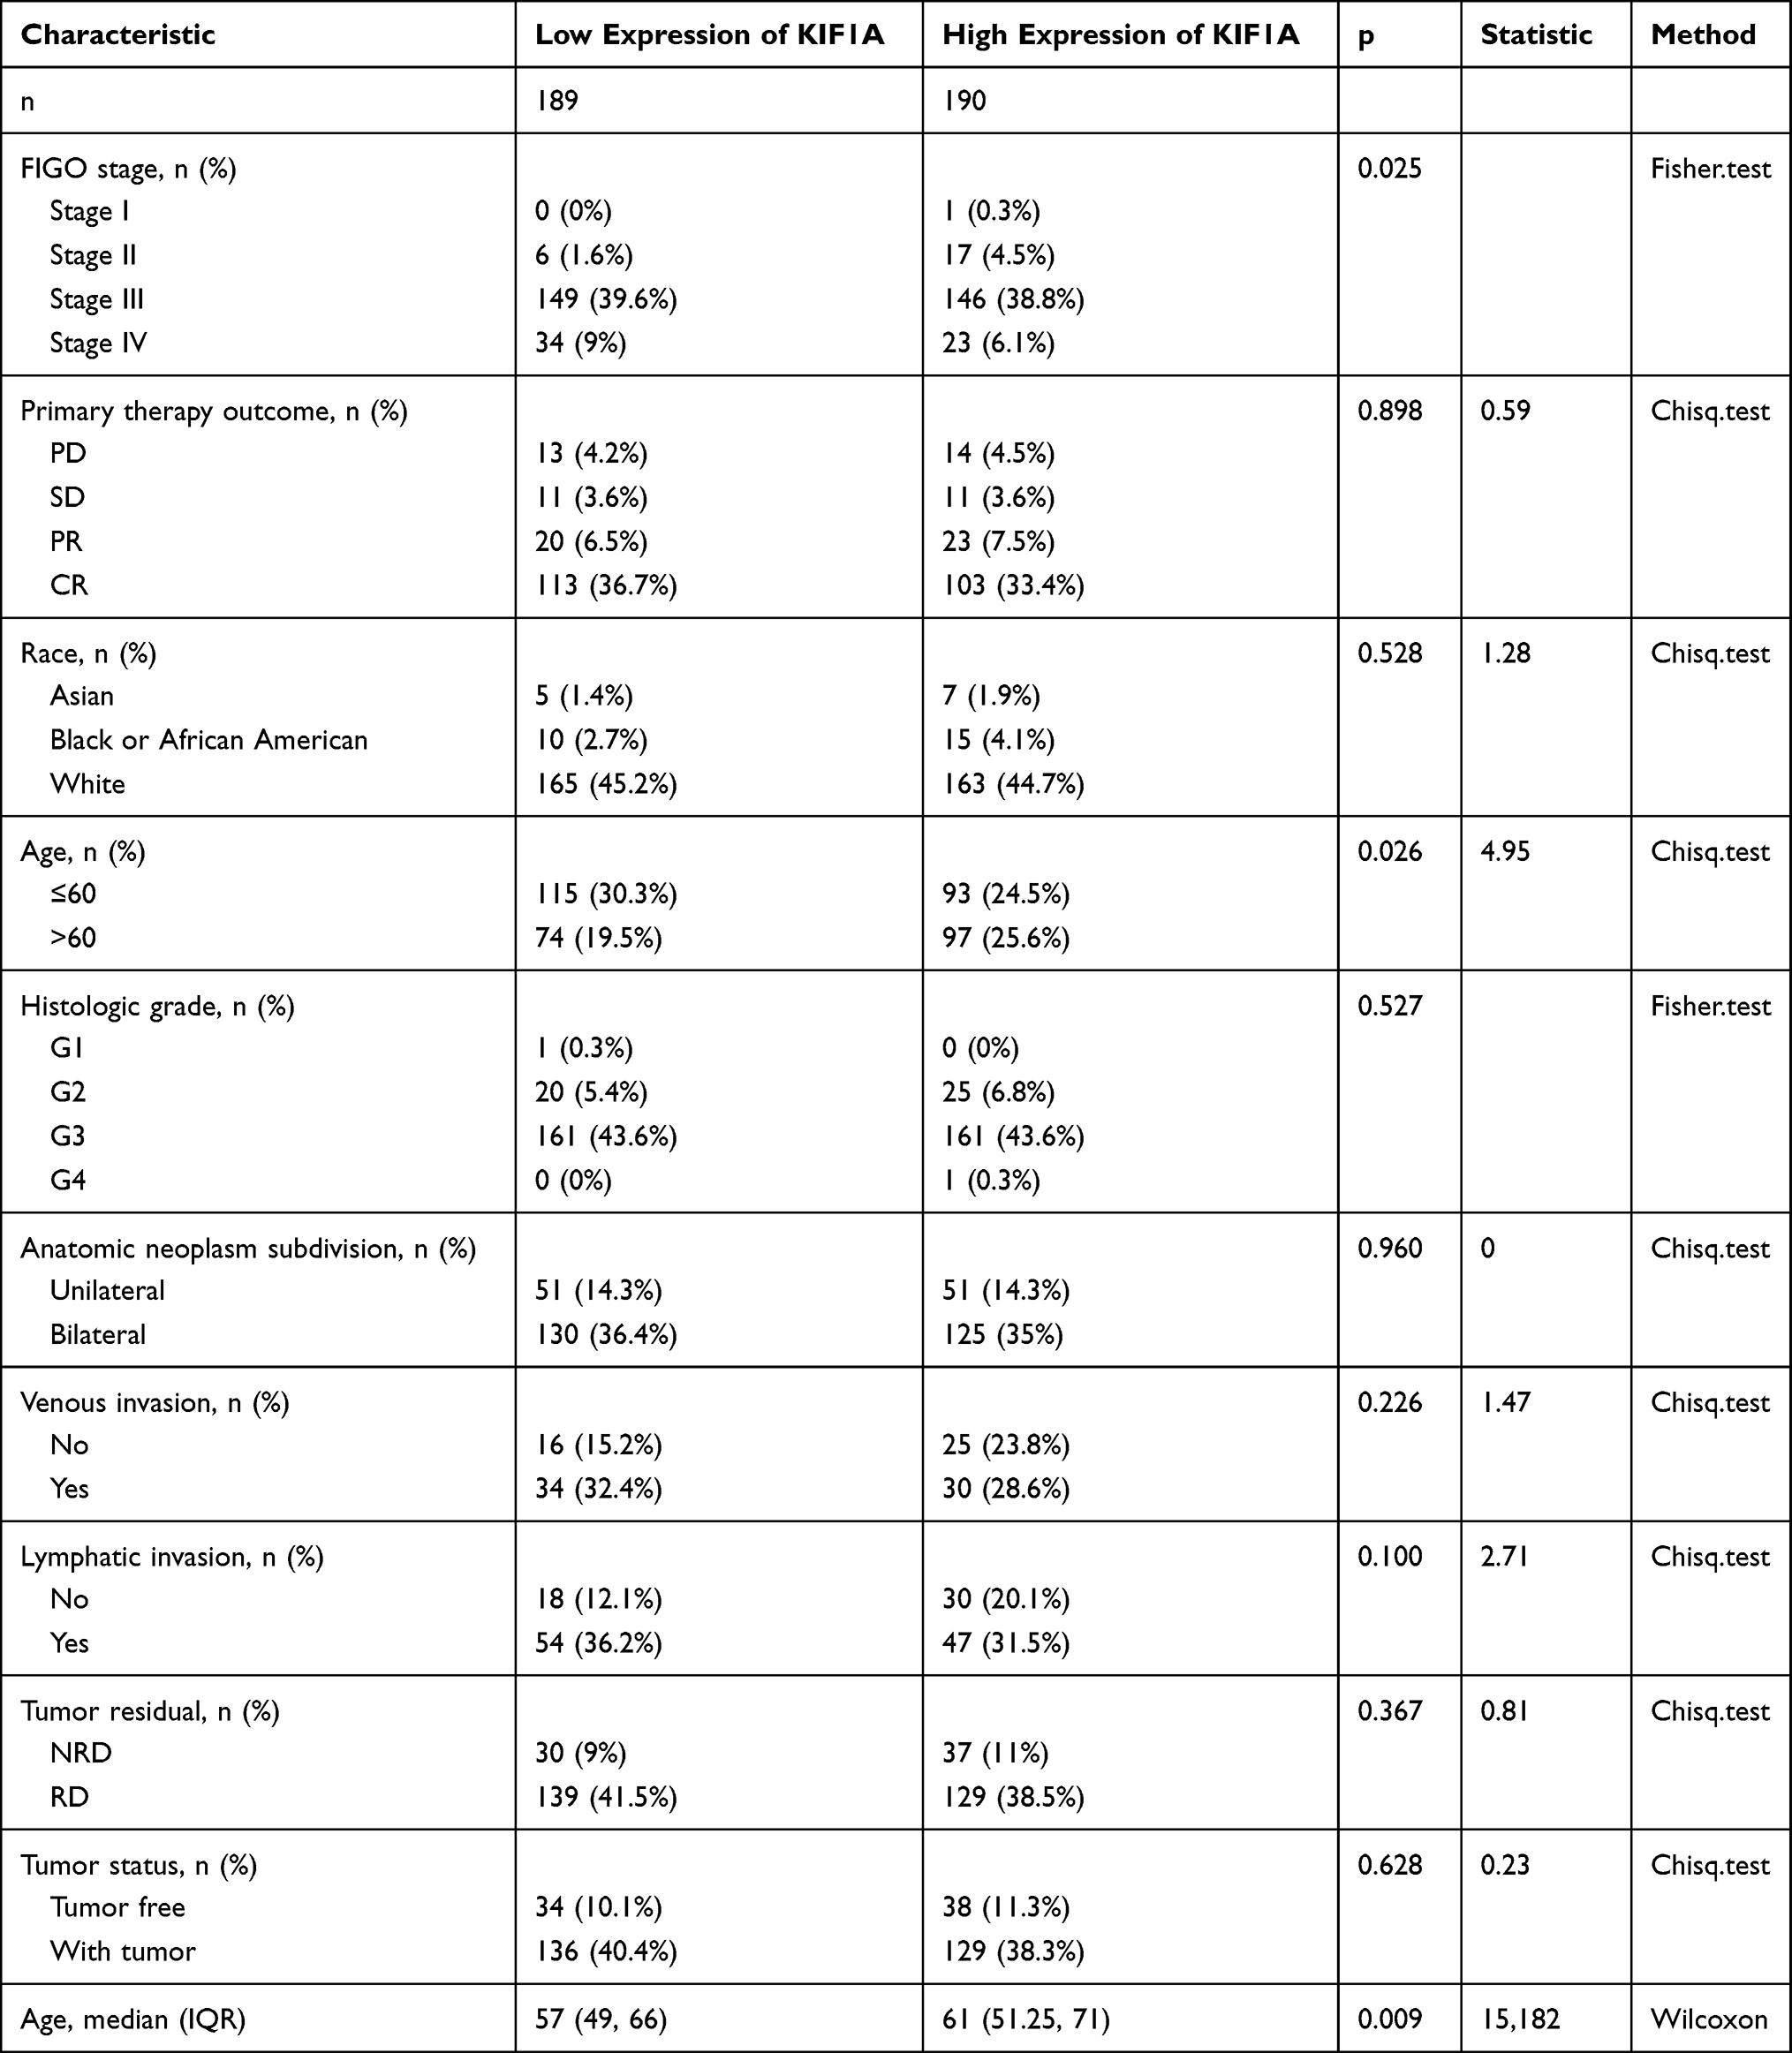 |
Table 2 Correlation Between KIF1A Expression and Clinical Characteristics in OC |
 |
Table 3 KIF1A Expression Associated with Clinicopathologic Characteristics (Logistic Regression) |
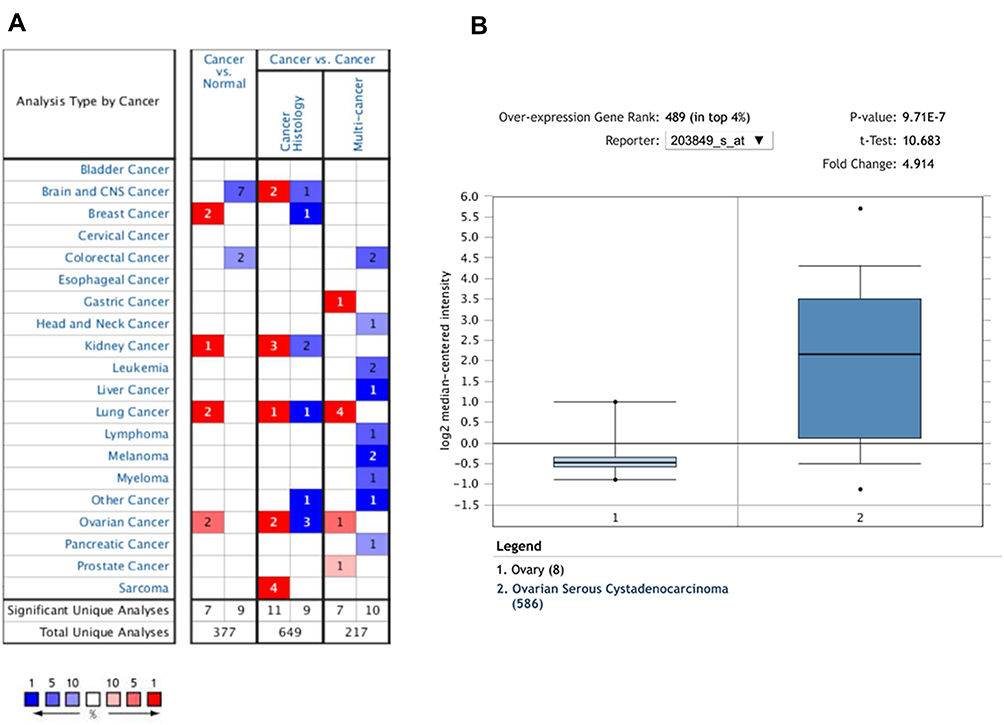 |
Figure 1 The expression pattern of KIF1A in different types of tumors. (A) The number of data sets presented in this graph belongs to the over-expression (red) or down-expression (blue) of target genes (cancer and normal tissues), which is of statistical significance. The number in each cell is equal to the number of analyses that satisfy these thresholds in the cancer type. Of all genes measured in each study, the rank of the gene was linked to the percentage of the target gene. Cell color depends on the percentile of optimal gene sequencing for intracellular analysis. (B) The box plot is derived from gene expression data in Oncomine, showing different expression of KIF1A in normal tissues and OC tissues. |
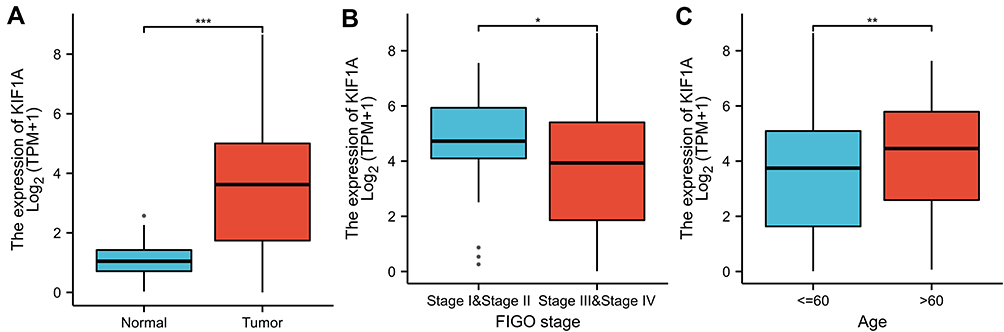 |
Figure 2 KIF1A was overexpressed in OC tissues. (A) Expression of KIF1A needs to be measured in tumor tissues and surrounding normal tissues. (B) Expression of KIF1A was checked according to the altered tumor stage of OC patients. (C) Expression of KIF1A was checked according to the race of OC patients. Significance markers: ns, p≥0.05; *, p< 0.05; **, p<0.01; ***, p<0.001. |
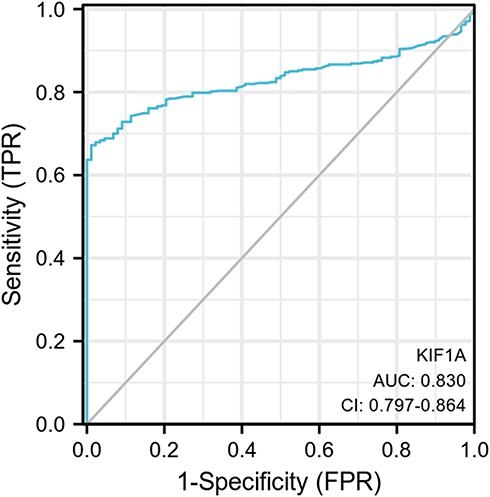 |
Figure 3 ROC curve showed the efficiency of KIF1A expression level for distinguish OC tissue from non-tumor tissues. |
KIF1A was Strongly Associated with the Prognosis of OC Patients
The relationship between KIF1A expression and the prognosis of patients with OC can be tested in terms of OS and PPS. As shown in Figure 4A and B, the overall survival of the group with high expression of KIF1A was significantly lower than that of OC patients with low expression of KIF1A, and the difference was statistically significant (Hazard ratio (HR) = 1.27 (95% confidential interval (CI): 1.11–1.45), P=0.00046); and the post progression survival curve showed that the survival of OC patients with low expression of KIF1A was significantly higher than that of patients with high expression of KIF1A (HR = 1.18 (95% CI: 1.03–1.35)), P=0.015), indicating that KIF1A could be invoked as a prognostic marker in OC.
 |
Figure 4 KIF1A expressions were closely related to the prognosis of OC patients. (A) Overall survival rate was assessed in TCGA cancer patients. (B) Post progression survival rate was analyzed in TCGA OC patients. Abnormal expression and low expression were identified with the auto best cutoff. |
GO and KEGG Analyses of KIF1A Co-Expression Genes
The KIF1A co-expression genes are listed in Table S1. Based on the construction of KIF1A co-expression network, GO clustering analysis was performed. As shown in Table S2 and Figure 5, KIF1A co-expression genes are involved in the biological process including ATP-dependent chromatin remodeling, transcription, DNA-templated cytolysis, positive regulation of T cell proliferation, positive regulation of transcription, DNA-templated, etc.; cellular component including integral component of plasma membrane, NuRD complex, cytoplasm, synapse, cell junction and integral component of lumenal side of endoplasmic reticulum membrane etc.; molecular function including protein binding, chromatin binding, RNA polymerase II distal enhancer sequence-specific DNA binding, DNA binding and IgG binding, etc. As shown in Table S2 and Figure 6, KIF1A co-expression genes are involved in Staphylococcus aureus infection, Allograft rejection, Type I diabetes mellitus, Antigen processing and presentation, Cell adhesion molecules (CAMs), Primary immunodeficiency, Oxidative phosphorylation, NF-kappa B signaling pathway, Pathways in cancer and Wnt signaling pathway, etc.
 |
Figure 5 GO analyses of KIF1A co-expression genes. |
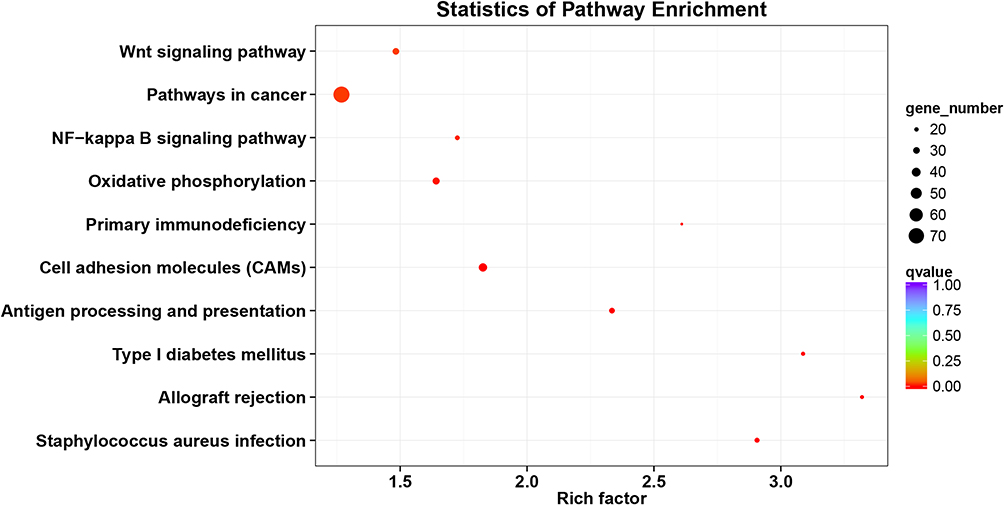 |
Figure 6 KEGG analyses of KIF1A co-expression gene network. |
The Correlation Between KIF1A Expression and Immune Infiltration
The correlation between expression of KIF1A and immune infiltration by ssGSEA with Spearman r in Figure 7 and Table 4 showed that KIF1A expression was negatively correlated with infiltration levels of aDC (P<0.001), B cells (P=0.001), CD8 T cells (P<0.001), Cytotoxic cells (P<0.001), DC (P<0.001), iDC (P<0.001), Macrophages (P=0.006), Mast cells (P=0.048), Neutrophils (P<0.001), NK CD56bright cells (P=0.021), NK CD56dim cells (P<0.001), pDC (P<0.001), T cells (P<0.001), Th1 cells (P<0.001), Th17 cells (P=0.005) and TReg (P=0.003), and positively correlated with that of NK cells (P<0.001).
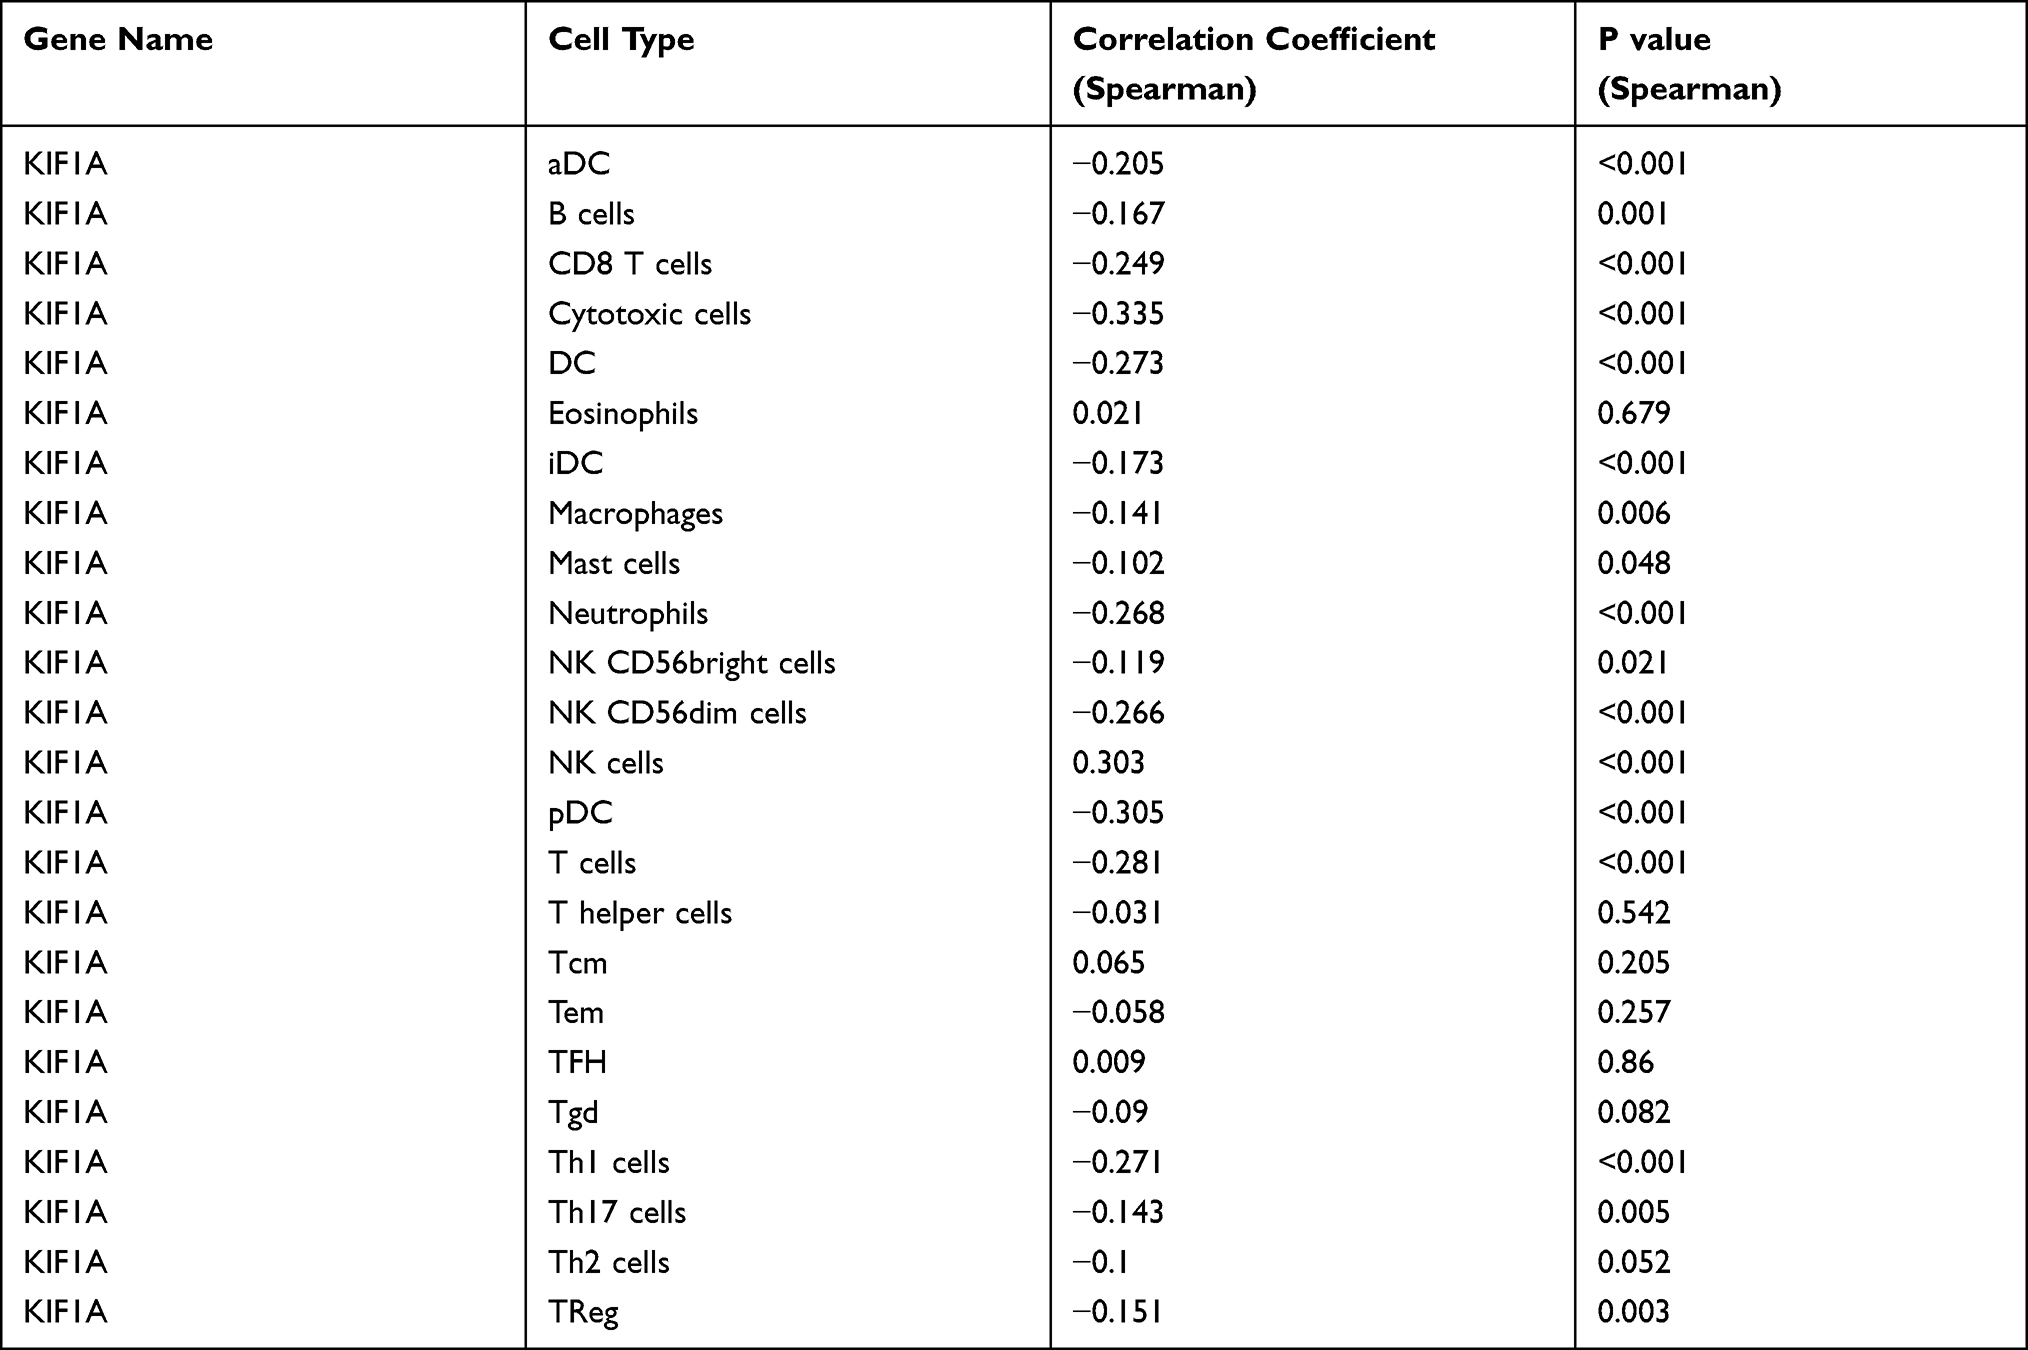 |
Table 4 The Correlation Between KIF1A Expression and Immune Cells Detected by Spearman Correlation Method |
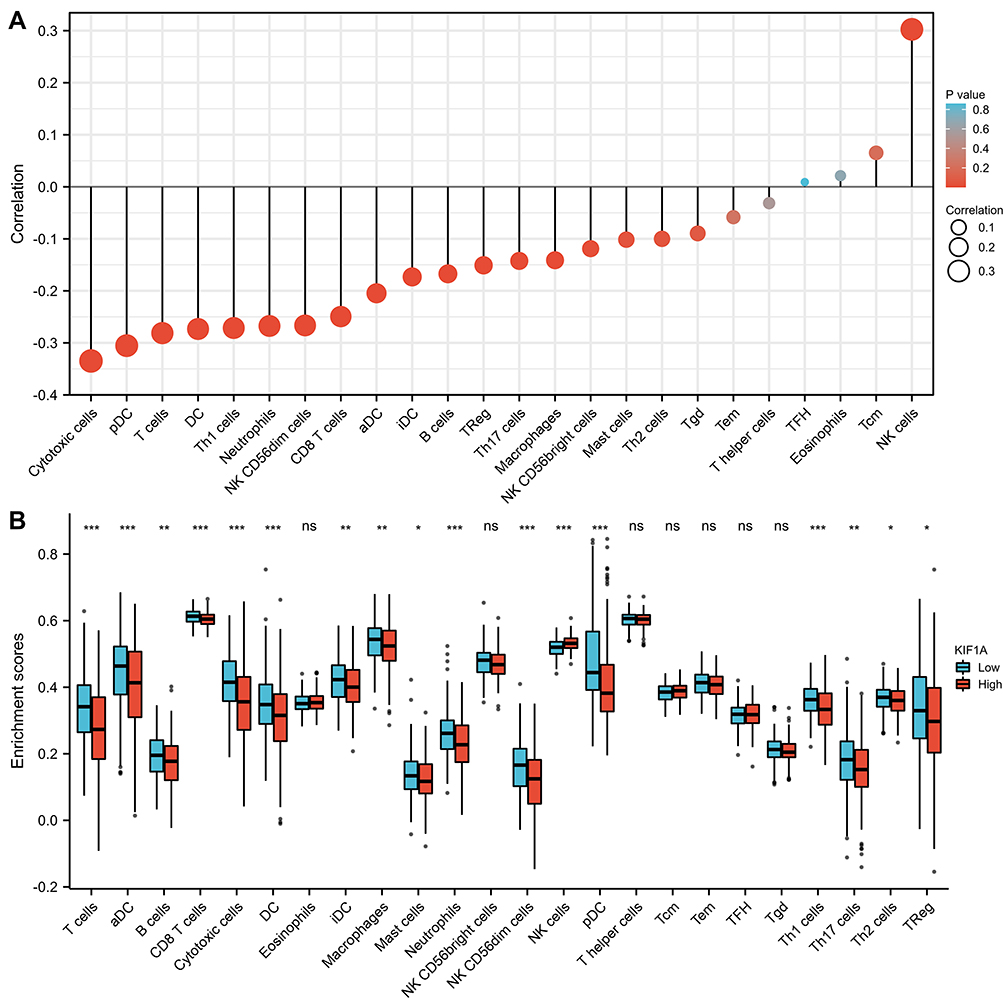 |
Figure 7 The expression level of KIF1A was related to the immune infiltration in the tumor microenvironment. (A) The forest plot shows the correlation between KIF1A expression level and 24 immune cells. The size of dots indicates the absolute value of Spearman r. (B) The Wilcoxon rank sum test was used to analyze the difference of immune cell enrichment scores between KIF1A high and low expression groups. aDC [activated DC]; B cells; CD8 T cells; Cytotoxic cells; DC; Eosinophils; iDC [immature DC]; Macrophages; Mast cells; Neutrophils; NK CD56bright cells; NK CD56dim cells; NK cells; pDC [Plasmacytoid DC]; T cells; T helper cells; Tcm [T central memory]; Tem [T effector memory]; Tfh [T follicular helper]; Tgd [T gamma delta]; Th1 cells; Th17 cells; Th2 cells; Treg. Significance markers: ns, p≥0.05; *, p< 0.05; **, p<0.01; ***, p<0.001. |
Discussion
The incidence and mortality rate of OC has been growing continuously in recent years. Targeted therapy has fewer side effects than surgery, radiotherapy, and chemotherapy because of its tumor-specific targeting. Targeted therapy for OC mainly targets EGFR and PAPR, but an increasing number of studies have now confirmed the presence of EGFR and PAPR mutations in OC patients, resulting in the failure of targeted therapy. The development of novel targets for OC therapy is therefore of great importance.
Variations in KIF1A in the body can cause a variety of neurological disorders such as cancer, impaired learning and memory, autosomal inherited spastic paraplegia, and sensory neuron lesions, and the study of these pathologies and the development of related drugs is closely related to the motor mechanism of KIF1A.19–21 Kinesins can mediate docetaxel resistance, which may lead to new therapeutic approaches for pairing kinesin inhibitors with taxanes.22
At present, studies on the specific mechanism of action in tumors have been carried out successively, and it is gradually clear that KIF1A as an oncogene is involved in the occurrence and development of multiple tumor tumors. However, there is less information about the acting of KIF1A in OC. Up to the moment, no study has reported the survival effect of KIF1A mRNA level in OC patients. In the present study, KIF1A was found to be significantly elevated in OC tumor tissues, and its expression level was strongly correlated with the stage of OC patients. Elevated expression of KIF1A in OC, and further analysis of its clinical significance, showed that the high expression of KIF1A showed a decrease in OS and PFS in OC patients. The screening of prognostic molecular markers for OC diagnosis is of great clinical value in the treatment of OC, and KIF1A as a diagnostic molecular prognostic marker has definite prospects for application.
Immune-infiltrating cells in OC are currently a hot topic. The understanding of immune infiltrating cells facilitates the development of immunotherapy. In this study, the results showed modest correlations between KIF1A expression and infiltration levels of 24 immune cells in OC. These correlations may suggest potential mechanisms by which KIF1A inhibits the function of aDC (P<0.001), B cells (P=0.001), CD8 T cells (P<0.001), Cytotoxic cells (P<0.001), DC (P<0.001), iDC (P<0.001), Macrophages (P=0.006), Mast cells (P=0.048), Neutrophils (P<0.001), NK CD56bright cells (P=0.021), NK CD56dim cells (P<0.001), pDC (P<0.001), T cells (P<0.001), Th1 cells (P<0.001), Th17 cells (P=0.005) and TReg (P=0.003), and promotes of NK cells (P<0.001).
There are certain limitations in the present study. The number of patients used for this Oncomine analysis was too small. Although this study cannot yield a definitive conclusion, KIF1A may have potential as a prognostic marker for OC. We have validated the expression and prognostic significance of OC using various methods. However, the results of bioinformatics analysis need to be demonstrated by major bench experiments. The specific functions and molecular mechanisms of KIF1A in OC need to be further explored.
Conclusion
Our findings demonstrate the unique prognostic role of KIF1A mRNA expression in OC patients and the differences in expression between cancer and normal tissues. KIF1A has a potential role in the biological process of ATP-dependent chromatin remodeling, transcription, DNA-templated cytolysis, positive regulation of T cell proliferation, positive regulation of transcription, DNA-templated via cell adhesion molecules (CAMs), primary immunodeficiency, oxidative phosphorylation, NF-kappa B signaling pathway, pathways in cancer, and Wnt signaling pathway. KIF1A expression was associated with immune infiltrating cells. The findings suggest that KIF1A may be a biomarker of poor prognosis in OC patients.
Ethical Statement
The authors are accountable for all aspects of the work in ensuring that questions related to the accuracy or integrity of any part of the work are appropriately investigated and resolved. The study was conducted in accordance with the Declaration of Helsinki (as revised in 2013).
Funding
This work was supported by Jiangsu Provincial Key Discipline of Maternal and Child Health (2017103033).
Disclosure
The authors declare that they have no conflicts of interest relevant to this study.
References
1. Bray F, Ferlay J, Soerjomataram I, et al. Global cancer statistics 2018: GLOBOCAN estimates of incidence and mortality worldwide for 36 cancers in 185 countries. CA Cancer J Clin. 2018;68(6):394–424. doi:10.3322/caac.21492
2. Siegel RL, Miller KD, Fuchs HE, et al. Cancer statistics, 2021. CA Cancer J Clin. 2021;71:7–33.
3. Bu H, Li Y, Jin C, et al. Overexpression of PRC1 indicates a poor prognosis in ovarian cancer. Int J Oncol. 2020;56:685–696.
4. Hartmann LC, Lindor NM. The role of risk-reducing surgery in hereditary breast and ovarian cancer. N Engl J Med. 2016;374(5):454–468. doi:10.1056/NEJMra1503523
5. Akakpo PK, Derkyi-Kwarteng L, Gyasi RK, et al. Ovarian cancer in ghana, a 10 year histopathological review of cases at Korle Bu Teaching Hospital. Afr J Reprod Health. 2015;19:102–106.
6. Vale RD. The molecular motor toolbox for intracellular transport. Cell. 2003;112(4):467–480. doi:10.1016/S0092-8674(03)00111-9
7. Svoboda K, Schmidt CF, Schnapp BJ, et al. Direct observation of kinesin stepping by optical trapping interferometry. Nature. 1993;365(6448):721–727. doi:10.1038/365721a0
8. Demokan S, Chang X, Chuang A, et al. KIF1A and EDNRB are differentially methylated in primary HNSCC and salivary rinses. Int J Cancer. 2010;127(10):2351–2359. doi:10.1002/ijc.25248
9. Kaur J, Demokan S, Tripathi SC, et al. Promoter hypermethylation in Indian primary oral squamous cell carcinoma. Int J Cancer. 2010;127(10):2367–2373. doi:10.1002/ijc.25377
10. Ostrow KL, Park HL, Hoque MO, et al. Pharmacologic unmasking of epigenetically silenced genes in breast cancer. Clin Cancer Res. 2009;15(4):1184–1191. doi:10.1158/1078-0432.CCR-08-1304
11. Loyo M, Brait M, Kim MS, et al. A survey of methylated candidate tumor suppressor genes in nasopharyngeal carcinoma. Int J Cancer. 2011;128(6):1393–1403. doi:10.1002/ijc.25443
12. Cheung IY, Feng Y, Gerald W, et al. Exploiting gene expression profiling to identify novel minimal residual disease markers of neuroblastoma. Clin Cancer Res. 2008;14(21):7020–7027. doi:10.1158/1078-0432.CCR-08-0541
13. Vivian J, Rao AA, Nothaft FA, et al. Toil enables reproducible, open source, big biomedical data analyses. Nat Biotechnol. 2017;35(4):314–316. doi:10.1038/nbt.3772
14. Gyorffy B, Lánczky A, Szállási Z. Implementing an online tool for genome-wide validation of survival-associated biomarkers in ovarian-cancer using microarray data from 1287 patients. Endocr Relat Cancer. 2012;19(2):197–208. doi:10.1530/ERC-11-0329
15. Cerami E, Gao J, Dogrusoz U, et al. The cBio cancer genomics portal: an open platform for exploring multidimensional cancer genomics data. Cancer Discov. 2012;2(5):401–404. doi:10.1158/2159-8290.CD-12-0095
16. Gao J, Aksoy BA, Dogrusoz U, et al. Integrative analysis of complex cancer genomics and clinical profiles using the cBioPortal. Sci Signal. 2013;6(269):pl1. doi:10.1126/scisignal.2004088
17. Huang da W, Sherman BT, Lempicki RA. Systematic and integrative analysis of large gene lists using DAVID bioinformatics resources. Nat Protoc. 2009;4(1):44–57. doi:10.1038/nprot.2008.211
18. Huang da W, Sherman BT, Lempicki RA. Bioinformatics enrichment tools: paths toward the comprehensive functional analysis of large gene lists. Nucleic Acids Res. 2009;37(1):1–13. doi:10.1093/nar/gkn923
19. Hirokawa N, Niwa S, Tanaka Y. Molecular motors in neurons: transport mechanisms and roles in brain function, development, and disease. Neuron. 2010;68:610–638.
20. Okamoto N, Miya F, Tsunoda T, et al. KIF1A mutation in a patient with progressive neurodegeneration. J Hum Genet. 2014;59(11):639–641. doi:10.1038/jhg.2014.80
21. Goulet A, Major J, Jun Y, et al. Comprehensive structural model of the mechanochemical cycle of a mitotic motor highlights molecular adaptations in the kinesin family. Proc Natl Acad Sci USA. 2014;111(5):1837–1842. doi:10.1073/pnas.1319848111
22. De S, Cipriano R, Jackson MW, et al. Overexpression of kinesins mediates docetaxel resistance in breast cancer cells. Cancer Res. 2009;69(20):8035–8042. doi:10.1158/0008-5472.CAN-09-1224
 © 2021 The Author(s). This work is published and licensed by Dove Medical Press Limited. The full terms of this license are available at https://www.dovepress.com/terms.php and incorporate the Creative Commons Attribution - Non Commercial (unported, v3.0) License.
By accessing the work you hereby accept the Terms. Non-commercial uses of the work are permitted without any further permission from Dove Medical Press Limited, provided the work is properly attributed. For permission for commercial use of this work, please see paragraphs 4.2 and 5 of our Terms.
© 2021 The Author(s). This work is published and licensed by Dove Medical Press Limited. The full terms of this license are available at https://www.dovepress.com/terms.php and incorporate the Creative Commons Attribution - Non Commercial (unported, v3.0) License.
By accessing the work you hereby accept the Terms. Non-commercial uses of the work are permitted without any further permission from Dove Medical Press Limited, provided the work is properly attributed. For permission for commercial use of this work, please see paragraphs 4.2 and 5 of our Terms.