")
Back to Journals » OncoTargets and Therapy » Volume 13
Bioinformatics Analysis of Key Genes and Pathways of Cervical Cancer
Authors Chen H , Wang X, Jia H, Tao Y, Zhou H, Wang M, Wang X, Fang X
Received 11 September 2020
Accepted for publication 30 November 2020
Published 29 December 2020 Volume 2020:13 Pages 13275—13283
DOI https://doi.org/10.2147/OTT.S281533
Checked for plagiarism Yes
Review by Single anonymous peer review
Peer reviewer comments 3
Editor who approved publication: Prof. Dr. Takuya Aoki
Huan Chen,1 Xi Wang,1 Huanhuan Jia,2 Yin Tao,3 Hong Zhou,3 Mingyuan Wang,4 Xin Wang,1 Xiaoling Fang1
1Department of Obstetrics and Gynecology, The Second Xiangya Hospital of Central South University, Changsha, Hunan 410011, People’s Republic of China; 2Guangdong Laboratory Animals Monitoring Institute, Guangdong Key Laboratory of Laboratory Animals, Guangzhou, Guangdong 510663, People’s Republic of China; 3Department of Obstetrics and Gynecology, Zhu Zhou Hospital Affiliated to Xiangya School of Medicine, CSU, Zhuzhou, Hunan 412007, People’s Republic of China; 4Department of Pathophysiology, School of Basic Medical Science, Central South University, Changsha, Hunan, 410013, People’s Republic of China
Correspondence: Xiaoling Fang Tel +86 13973128345
Email [email protected]
Background and Objective: Globally, cervical cancer (CC) is the fourth most common cancer affecting women. Although effective screening reduces its incidence, it remains one of the most serious cancers threatening the health of women. Therefore, the purpose of this study is to find new genes that can be used as potential biomarkers for the prognosis of CC.
Methods and Results: After downloading three datasets such as GSE6791, GSE63678, and GSE63514 from the Gene Expression Omnibus (GEO), we combined the expression matrixes and analyzed them to obtain the differential expressed genes (DEGs). Next, using the STRING website, we performed the protein interaction network analysis. Subsequently, hub genes were screened using the R and Cytoscape software. Then, the expression difference and survival analyses of the hub genes were confirmed using GIPIA. Here, we established that the KNTC1 gene was correlated to the overall survival prognosis of CC. Besides, the expression of the KNTC1 gene in the GSE63514 dataset was significantly different from that of the normal cervix, cervical pre-cancerous lesions, and CC. Consequently, immunohistochemistry analysis showed that the results have a definite diagnostic value.
Conclusion: The KNTC1 gene could be linked with the pathophysiology of CC and maybe one of the early diagnostic markers for the diagnosis of cervical pre-cancerous lesions.
Keywords: cervical cancer, bioinformatics analysis, differentially expressed gene, pathways, KNTC1
Introduction
Worldwide,1 cervical cancer (CC) is the fourth most common cancer affecting women. It has a morbidity of 371,000 cases and a mortality rate of 190,000 cases annually.2 Though its incidence has dropped year after year in developed countries, it is escalating in developing countries. Studies have shown that approximately 90% of CC-related deaths have occurred in developing countries. On the other hand,3 cervical intraepithelial neoplasia (CIN) is a pre-cancerous potential transformation of squamous cells on the surface of the cervix. Following an abnormal hyperplasia degree, it is categorized into three different types such as CIN I, II, and. The CIN I type is also called a low-grade squamous intraepithelial lesion (LSIL), and CIN II and CIN III are the high-grade squamous intraepithelial lesion (HISL).4 Typically, it takes 8 years on average for CIN to develop into CC. According to literature,5,6 squamous cell carcinoma accounts for about 80 to 90% of the total CC cases. First, pre-cancerous lesions develop from LSIL to HISL, and subsequently to squamous cell carcinoma. However,7,8 the CC pathogenesis is unclear and could be caused by recurrent genetic alterations, microenvironment, lifestyle, smoking, etc.9–12 Different studies have revealed that persistent HPV infection is the main trigger of CC. However, only a small proportion of HPV infection patients will eventually develop CC.13 Etiological studies have shown that the CC occurrence is a complicated process that involves multiple factors, and its molecular mechanism has not yet been fully elucidated. Therefore, there is a need to find an indicator that predicts the pre-cancerous lesion which leads to cancer.
Currently,14 the profile data of gene expression is available, and its data analysis using bioinformatics has become a promising area of new research. Studies have shown that15 bioscience research increasingly depends on bioinformatics to efficiently organize and analyze biological data and experimental results, which16 provides a theoretical basis for a profound understanding of molecular events occurring in human biology and disease. Besides,17,18 it has been extensively used to study molecular changes in tumor progression to better comprehend the development of human carcinogenesis development and to discover novel predictive cancer markers.
GEO (https://www.ncbi.nlm.nih.gov/geo) is a publicly available database that supports a large number of microarray expression data sets. Here, we downloaded and analyzed three already established microarray datasets such as19 GSE6791,20 GSE63678,21 GSE63514 from the GEO database. Subsequently, we performed an analysis of DEGs that are present in normal cervical and CC tissues using the R statistical software. Concurrently, we verified differential gene expression using different databases like22 the online analysis tool GIPIA, based on GTEx, and TCGA databases, which contained 306 CC samples and 13 normal cervical tissues. Next, the DEGs protein interactions were analyzed on the STRING online website. Consequently, our study established that the KNTC1 expression levels were substantially related to the OS of CC patients and it was quite different in normal cervix, cervical pre-cancerous lesions, and CC. Lastly, we used immunohistochemistry to verify this finding and we concluded that the KNTC1 gene is a prospective key gene for CC pre-cancerous lesions and prognosis.
Materials and Methods
Microarray Data
We downloaded19–21 three CC GEO datasets, including GSE6791, GSE63678, and GSE63514, from the Gene Expression Omnibus (http://www.ncbi.nlm.nih.gov/gds). Table 1 illustrates the details of GEO cervical cancer data.
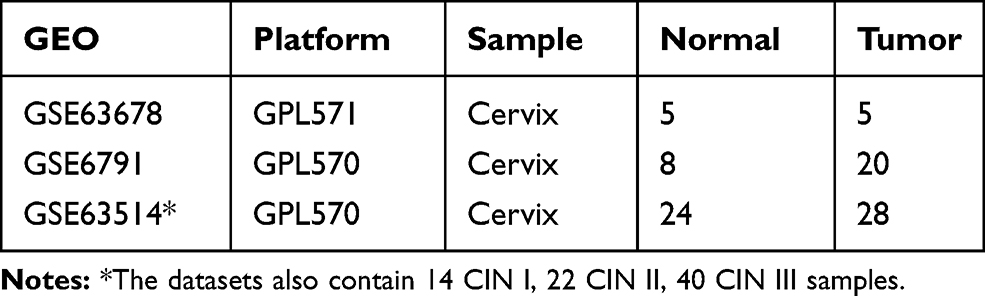 |
Table 1 Dataset Information |
Data Normalization and Exploration
We first downloaded a series of matrix files, and the platform was converted using the Perl programming and scripting language software. Next, the ID corresponding to the probe name was converted into an international standard name for genes (symbols) and then merged into a CSV file.23 Subsequently, we eliminated the batch effect using the Surrogate Variable Analysis (SVA) package of Bioconductor (http://www.bioconductor.org/).24 Consequently, we selected the DEGs using the limma package. Lastly, we selected DEGs, using a cutoff criteria of adj.P.Val <0.05 and |log2 (fold change) | >2.
Protein–Protein Interaction (PPI) Network
We analyzed the PPI pairs of the screened DEGs using25 the online database STRING version 11 (https://string-db. org/). Next, the pairs with a combining score >0.4 were used for the PPI network construction. Then, we removed the partial and isolated connected nodes, constructed a complex network of DEGs, downloaded the excel of string-interactions, and saved them in a CSV file format. Lastly, the DEGs expression and String-interactions files were imported into Cytoscape software for further processing, whereby we constructed a network and analyzed the interactive relationship of the candidate DEGs encoding proteins in CC.
DEGs Basic Expression in Normal and Cancer Tissues
Here,22 the online website GEPIA was selected as a validation set for Screening the DEGs. GEPIA is a newly developed interactive web server that has a standard processing pipeline and was used to analyze the sequenced RNA expression data of 9736 tumors and 8587 normal samples from the TCGA and GTEx projects, that were initially based on the UCSC Xena Project (http://xena.ucsc.edu).
Biomarker Discovery for Early Diagnosis
The potential application for early diagnosis was evaluated using GSE63514 datasets to perform microarrays prediction analysis by comparing normal to LISL, LISL to HISL, and HISL to CC samples.
Tissue Collection
From August 2020 to September 2020, normal cervical, CIN I–III, and cervical squamous cell carcinoma tissue samples were acquired from Zhuzhou Hospital which is allied to Xiangya Medical College. All specimens were subjected to immunohistochemical evaluation and confirmed by two independent pathologists. This study was approved by the research and clinical trial ethics committee of Zhuzhou Hospital, and all eligible participants provided written informed consent. All clinical procedures were performed per the ethical standards of the Declaration of Helsinki guidelines and relevant policies in China.
Immunohistochemistry
To validate Kinetochore Associated protein 1 (KTNC1), immunohistochemical staining was performed on the specimen sections of normal, LSIL, HSIL, and CC samples. The following steps were followed: section dewaxing, antigen repair, KTNC1 antibody (Abcam, Cambridge, UK) incubation, and secondary antibody incubation.26
Results
Identification of DEGs in CC
Our study involved 39 healthy individuals and 51 patients with CC and their three mRNA expression profiles were merged into one dataset. Using a cutoff criteria of adj.P.Val <0.05 and |log FC| >2, we extracted a total of 161 differentially expressed probesets (63 downregulated and 98 upregulated) from the expression profile datasets. The volcano map illustrates the differential genes (Figure 1A) whereas the heatmap shows differentially expressed probe sets between normal versus cancer tissues (Figure 1B).
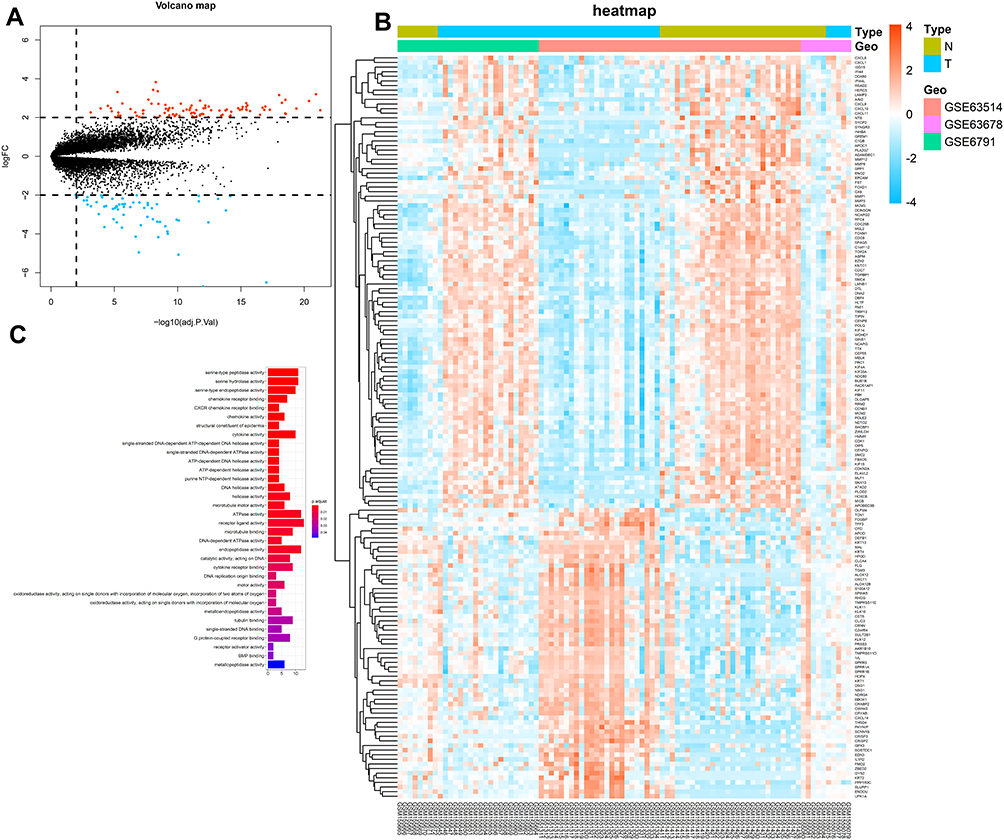 |
Figure 1 (A) Volcano plot of three datasets (GSE63914, GSE63678, GSE6791), orange nodes represent DEGs with logFC >2 and p-value of <0.05. Blue nodes represent DEGs with logFC <–2 and p-value of <0.05. (B) A heat map of all DEGs of three datasets, Each column represents a sample and each row represents one gene. The gradual color ranging from blue to orange represents the gene expression changing from downregulation to upregulation. The letter N represents normal tissue, and the letter T represents cancer tissue. (C) GO enrichment analysis of DEGs. |
Pathway Analysis
Here, enrichment analyses were performed for Gene Ontology gene sets (GO) using the ClusterProfiler27 and the org.Hs.eg.db packages.28 As illustrated in Figure 1C, it was observed that the 161 CC intrinsic genes were mostly involved in the cell cycle through processes such as DNA replication and recombination, RNA metabolism, purine, and pyrimidine metabolism. Besides, by utilizing the ClusterProfiler package,27 a similar analysis was performed in the Kyoto Encyclopedia of Genes and Genomes (KEGG) database. However, only one pathway was found to be involved in DNA replication.
PPI Network Construction
At a combined score >0.4, Figure 2A shows a total of 136 DEGs (92 upregulated and 44 downregulated genes) from the 161 commonly altered DEGs that were filtered into the DEGs PPI network and they contained 136 nodes and 1363 edges. Subsequently, the node degree29 was estimated using the cytohubba app in Cytoscape software. Next, as illustrated in Figure 2B, the most significant 20 node degree genes were selected as the hub nodes since they could play a vital role in the progression of CC.
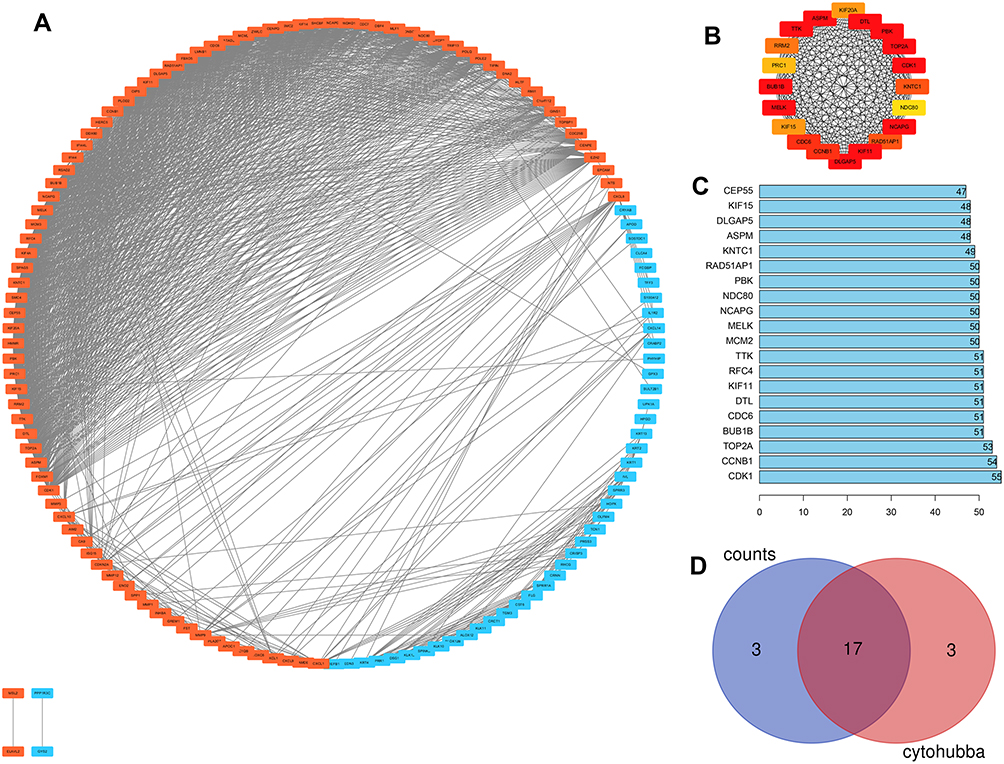 |
Figure 2 (A) PPI of DEGs, orange nodes for upregulation genes, blue nodes for downregulation genes. (B) The most significant 20 node degree genes calculated by cytohubba APP of cytoscape. (C) The top 20 genes selected by using the String-interactions file to calculated the counts between DEGs. (D) The Venn diagram of the top 20 degree genes and the top 20 counts genes. |
Key Gene Signatures Identification in CC
To calculate the counts between DEGs, we used the String-interactions file, and as illustrated in Figure 2C, we selected the top 20 genes. Subsequently, we overlapped the 20 genes with hub nodes, and as demonstrated in Figure 2D, we selected the following key genes; MELK, CDK1, BUB1B, NCAPG, KIF11, PBK, TOP2A, TTK, DLGAP5, ASPM, DTL, CCNB1, CDC6, RAD51AP1, KNTC1, KIF15, and NDC80. Also, as shown in Figure 3A and B, univariate analysis (P<0.05) showed that the expression levels of KNTC1 and TOP2A were significantly related to the OS of the CC patients. The high expression of KNTC1 and TOP2A could lead to a high rate of survival. Notably, in CC tissues, the expression of these two genes was significantly higher than that of normal tissues (P<0.01; Figure 3C and D). However, its expression was not correlated to the CC grade. Taken together, the high level of these two genes could represent the significant prognostic factor that predicts the survival of CC patients.
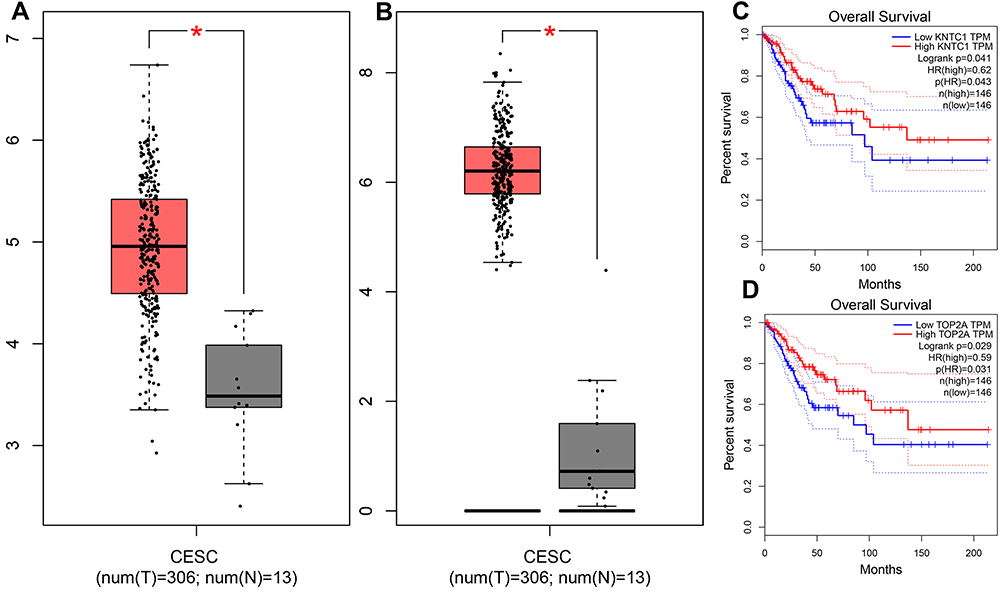 |
Figure 3 (A and B) Expression boxplots of KNTC1/TOP2A genes using GEPIA website (P<0.05). (C and D) Survival analysis. Expression level of KNTC1/TOP2A was significantly related to the overall survival of patients with cervical squamous cancer (p < 0.05). |
Validation of Hub Genes
To identify biomarkers for early discovery, we adopted a four-stage approach. Here, we first extracted the KNTC1 expression profiles from GSE6791 datasets. These datasets contained 24 normal cervix,14 CIN I, 22 CIN II, 40 CIN III, and 28 CC tissues. Next, we compared the expression profiles of normal, LSIL (CIN I), HSIL (CIN II, III), and CC samples using the Wilcox test. As illustrated in Figure 4A, we established that the KNTC1 expression is significantly different in normal cervix, cervical pre-cancerous lesions, and in CC tissues.
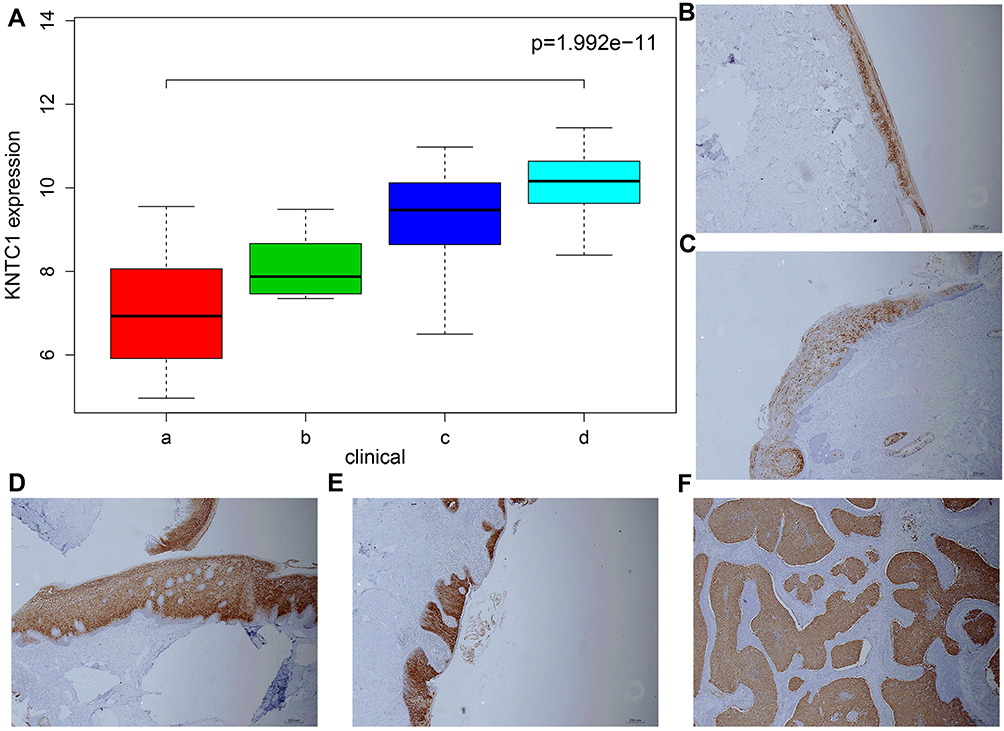 |
Figure 4 (A) The expression of KNTC1 of normal cervix, cervical precancerous lesions and CC in Dataset GSE6791.a represents normal cervix, b represents LSIL (CIN I), c represents HSIL (CIN II), d represents cervical squamous cell carcinoma. (B–F) Immunohistochemical staining of KNTC1 gene in normal cervical, LSIL (CIN I), HSIL (CIN II, III) and cervical squamous cell carcinoma specimens. |
Besides, we performed immunochemical staining for KNTC1 in the normal cervix, LSIL, HSIL, and CC tissue, which could show the following; weak staining of the normal cervical tissue, HISL was significantly enhanced than LSIL, and the cervical squamous cell carcinoma was also significantly enhanced than normal cervical tissues (Figure 4B–F).
Discussion
Studies have shown that hub genes play critical roles during the different cancer progression stages. Although several studies on the development of CC are available, there is a need to establish more research to identify driver genes and candidate drugs for the treatment of CC. In a nutshell, our study integrated three different gene profile datasets, utilized bioinformatics techniques to analyze these datasets, and identified a total of 161 frequently changed DEGs (98 upregulated and 63 downregulated). The pathway enrichment analysis showed that cell cycle and DNA replication pathways were over-represented among the upregulated genes. Besides, the PPI network was constructed and it included 136 nodes and 1363 edges. Consequently, 16 key genes were determined and chosen for subsequent survival analysis. Here, we observed that the KNTC1 gene was related to the prognosis of CC patients. Also, small molecules that could provide new insights into the therapeutic studies of CC were identified.
Studies have shown that the Kinetochore-related protein 1 (KNTC1) gene is disseminated in the cytoplasm, nucleus, chromosomal centromere, centromere, cytoskeleton, and in the spindle fiber. Its distribution is different with the cell cycle, and it is evenly distributed throughout the cytoplasm and nucleus during its interphase stage. Besides, a small part of the entire cell is concentrated on the centromere from the early stage of cell division to the late stage of the middle and early stages.30 Previous studies have also shown that by the middle of cell division, it was identified at the centromere, along the spindle fiber, majorly at the pole. However, from the late stage of splitting to the final stage, the centromere or spindle fiber could no longer be detected, but it still existed at the pole of the spindle.31 The KNTC1 gene acts on the G2-M phase of the cell cycle and several studies have established that it is involved in the cell cycle process, hence participating in the occurrence of disease. Moreover, it has a significant association with the progression of liver fibrosis.32 Notably, the level of this gene was lower in mycoplasma pneumonia, than in the healthy control group.
Also, KNTC1 has been investigated in various human malignancies and has been associated with tumor histopathological grade.33 A study explored the expression levels of KNTC1 mRNA in three esophageal squamous cell carcinoma (ESCC) cell lines and established that all the tested cell lines showed that it is positively expressed. However, knocking out this gene can effectively inhibit cell viability and increase apoptosis. From the online ESCC dataset, a gene set enrichment analysis showed that overexpression of the KNTC1 gene is related to increased mitotic spindles and hypoxic pathways, and with decreased DNA repair and mismatch repair pathways. KNTC1 could play an important role in regulating the viability and apoptosis of ESCC cells and may perhaps become a novel therapeutic strategy for ESCC.34 Previous studies have shown that in patients with oral squamous cell carcinoma, the transcriptional activity of exact cell cycle genes, like the KNTC1, changes with the size of the tumor, which could reflect the evolution and adaptation of tumor molecules to the microenvironment. Also, compared with the healthy control group, the KNTC1 expression in neuroblastoma samples increased statistically.35 Although the increase in gene expression level is minimal, it can also play a significant role in promoting neuroblastoma.36 Furthermore, the KNTC1 frameshift mutation could cause signal damage/repair regulation and promote gastric cancer (GC) and colorectal cancer (CRC) with microsatellite instability (MSI) development.37–39 Several bioinformatics studies have also established that the KNTC1 gene could be one of the vital genes associated with cancer development, including Hepatocellular carcinoma (HCC), Pancreatic cancer (PC), and nasopharyngeal carcinoma (NPC).40 In mitotic checkpoints, the KNTC1 gene is a key component that ensures proper chromosome separation during cell division. These processes are both critical, highly ordered biological processes that depend on numerous evolutionarily conserved protein complexes.41 A study showed that many proteins that regulate the mitotic process are overexpressed in human malignancies than in their normal counterparts, and some are conveyed to be oncogenes.42 To date, the different KNTC1 gene functions include: recruiting cytoplasmic dynein to centromeres; participating in the chromosomes mitochondrial movement during mitosis; maintaining functional metaphase checkpoints;40 regulating exit from mitosis;43 protein-containing complex assembly; involved in cell division; separation of sister chromatids; resolution of sister chromatid cohesion; EML4 and NUDC in mitotic spindle formation;44 Amplification of signal from unattached kinetochores through a MAD2inhibitory signal; and mitotic Prometaphase.
Clinically, this study has great significance for a better understanding of the development and prognosis of CC. However, it is imperative to perform further clinical research to ascertain whether these genes can be used as biomarkers for the diagnosis and prognosis of CC.
Conclusion
Taken together, our study has established that the KNTC1 gene is closely related to the poor prognosis of CC. Its expression is also different in normal cervical, pre-cancerous lesions, and cancer tissues. Therefore, it could be an important biomarker for early diagnosis and prediction of cervical pre-cancerous lesions.
Disclosure
The authors report no conflicts of interest for this work.
References
1. Kassa U, Dile LS, Zenebe WM. Precancerous lesions of cervix among women infected with HIV in referral hospitals of Amhara region, northwest Ethiopia: a cross sectional study. Afr Health Sci. 2019;19(1):1695–1704. doi:10.4314/ahs.v19i1.46
2. Banno K, Iida M, Yanokura M, et al. MicroRNA in cervical cancer: oncomiRs and tumor suppressor miRs in diagnosis and treatment. TheScientificWorldJournal. 2014;2014:178075. doi:10.1155/2014/178075
3. Cheng X, Feng Y, Wang X, Wan X, Xie X, Lu W. The effectiveness of conization treatment for post-menopausal women with high-grade cervical intraepithelial neoplasia. Exp Ther Med. 2013;5(1):
4. Li L, Ding L, Gao T, et al. Association between vaginal micro-environment disorder and cervical intraepithelial neoplasia in a community based population in China. J Cancer. 2020;11(2):284–291. doi:10.7150/jca.35022
5. Ramírez A, Vera E, Gamboa-Domínguez A, Lambert P, Gariglio P, Camacho J. Calcium-activated potassium channels as potential early markers of human cervical cancer. Oncol Lett. 2018;15(5):
6. Zur Hausen H. Papillomaviruses and cancer: from basic studies to clinical application. Nat Rev Cancer. 2002;2(5):
7. de Freitas AC, Gurgel AP, Chagas BS, Coimbra EC, Do Amaral CM. Susceptibility to cervical cancer: an overview. Gynecol Oncol. 2012;126(2):
8. Wani K, Nair CK. Genetic alterations in cervical cancer. Indian J Exp Biol. 2003;41(8):789–796.
9. Walboomers JM, Jacobs MV, Manos MM, et al. Human papillomavirus is a necessary cause of invasive cervical cancer worldwide. J Pathol. 1999;189(1):12–19. doi:10.1002/(SICI)1096-9896(199909)189:1<12::AID-PATH431>3.0.CO;2-F
10. Drain PK, Holmes KK, Hughes JP, Koutsky LA. Determinants of cervical cancer rates in developing countries. Int J Cancer. 2002;100(2):199–205. doi:10.1002/ijc.10453
11. McMurray HR, Nguyen D, Westbrook TF, McAnce DJ. Biology of human papillomaviruses. Int J Exp Pathol. 2001;82(1):15–33. doi:10.1046/j.1365-2613.2001.00177.x
12. Scheurer ME, Danysh HE, Follen M, Lupo PJ. Association of traffic-related hazardous air pollutants and cervical dysplasia in an urban multiethnic population: a cross-sectional study. Environ Health. 2014;13(1):52. doi:10.1186/1476-069X-13-52
13. Che LF, Shao SF, Wang LX. Downregulation of CCR5 inhibits the proliferation and invasion of cervical cancer cells and is regulated by microRNA-107. Exp Ther Med. 2016;11(2):503–509. doi:10.3892/etm.2015.291110.1126/science.aaa0355
14. Olar A, Aldape KD. Using the molecular classification of glioblastoma to inform personalized treatment. J Pathol. 2014;232(2):165–177. doi:10.1002/path.4282
15. Tastan Bishop Ö, Adebiyi EF, Alzohairy AM, et al. Bioinformatics education–perspectives and challenges out of Africa. Brief Bioinform. 2015;16(2):
16. Melé M, Ferreira PG, Reverter F, et al. Human genomics. The human transcriptome across tissues and individuals. Science. 2015;348(6235):
17. Nannini M, Pantaleo MA, Maleddu A, Astolfifi A, Formica S, Biasco G. Gene expression profiling in colorectal cancer using microarray technologies: results and perspectives. Cancer Treat Rev. 2009;35(3):201–209. doi:10.1016/j.ctrv.2008.10.006
18. Wang M, Wang J, Liu J, et al. Systematic prediction of key genes for ovarian cancer by co-expression network analysis. J Cell Mol Med. 2020:
19. Pyeon D, Newton MA, Lambert PF, et al. Fundamental differences in cell cycle deregulation in human papillomavirus-positive and human papillomavirus-negative head/neck and cervical cancers. Cancer Res. 2007;67(10):
20. Pappa KI, Polyzos A, Jacob-Hirsch J, et al. Profiling of discrete gynecological cancers reveals novel transcriptional modules and common features shared by other cancer types and embryonic stem cells. PLoS One. 2015;10(11):e0142229. doi:10.1371/journal.pone.0142229
21. den Boon JA, Pyeon D, Wang SS, et al. Molecular transitions from papillomavirus infection to cervical precancer and cancer: role of stromal estrogen receptor signaling. Proc Natl Acad Sci U S A. 2015;112(25):
22. Tang Z, Chenwei L, Kang B. GEPIA: a web server for cancer and normal gene expression profiling and interactive analyses. Nucleic Acids Res. 2017;
23. Leek JT, Evan Johnson W, Parker HS, et al. sva: surrogate variable analysis. R package version 3.34.0. 2019.
24. Ritchie ME, Phipson B, Wu D, et al. limma powers differential expression analyses for RNA-sequencing and microarray studies. Nucleic Acids Res. 2015;43(7):e47. doi:10.1093/nar/gkv007
25. Szklarczyk D, Gable AL, Lyon D, et al. STRING v11: protein-protein association networks with increased coverage, supporting functional discovery in genome-wide experimental datasets. Nucleic Acids Res. 2019;47(D1):
26. Zhang M, Zheng Y, Sun Y, et al. Knockdown of NEAT1 induces tolerogenic phenotype in dendritic cells by inhibiting activation of NLRP3 inflammasome. Theranostics. 2019;9(12):3425–3442. doi:10.7150/thno.33178
27. Carlson M. org.Hs.eg.db: genome wide annotation for human. R package version 3.10.0. 2019.
28. Guangchuang Y, Wang L-G, Han Y, Qing-Yu H. clusterProfiler: an R package for comparing biological themes among gene clusters. OMICS. 2012;16(5):284–287. doi:10.1089/omi.2011.0118
29. Shannon P, Markiel A, Ozier O, et al. Cytoscape: a software environment for integrated models of biomolecular interaction networks. Genome Res. 2003;13(11):
30. UniProt Consortium. UniProt: a worldwide hub of protein knowledge. Nucleic Acids Res. 2019;47(D1):
31. Sarfraz S, Hamid S, Ali S, Jafri W, Siddiqui AA. Modulations of cell cycle checkpoints during HCV associated disease. BMC Infect Dis. 2009;9(125). doi:10.1186/1471-2334-9-125
32. Li J, Sun L, Xu F, et al. Screening and identification of APOC1 as a novel potential biomarker for differentiate of Mycoplasma pneumoniae in children. Front Microbiol. 2016;7:1961. doi:10.3389/fmicb.2016.01961
33. Liu CT, Min L, Wang YJ, Li P, Wu YD, Zhang ST. shRNA-mediated knockdown of KNTC1 suppresses cell viability and induces apoptosis in esophageal squamous cell carcinoma. Int J Oncol. 2019;54(3):
34. Diniz MG, Silva J, de Souza FT, Pereira NB, Gomes CC, Gomez RS. Association between cell cycle gene transcription and tumor size in oral squamous cell carcinoma. Tumour Biol. 2015;36(12):
35. Wolf M, Korja M, Karhu R, et al. Array-based gene expression, CGH and tissue data defines a 12q24 gain in neuroblastic tumors with prognostic implication. BMC Cancer. 2010;10(1):181. doi:10.1186/1471-2407-10-181
36. Kim YR, Chung NG, Kang MR, Yoo NJ, Lee SH. Novel somatic frameshift mutations of genes related to cell cycle and DNA damage response in gastric and colorectal cancers with microsatellite instability. Tumori. 2010;96(6):1004–1009.
37. Shen S, Kong J, Qiu Y, Yang X, Wang W, Yan L. Identification of core genes and outcomes in hepatocellular carcinoma by bioinformatics analysis. J Cell Biochem. 2019;120(6):
38. Yan X, Wan H, Hao X, et al. Importance of gene expression signatures in pancreatic cancer prognosis and the establishment of a prediction model. Cancer Manag Res. 2018;(11):
39. Liu K, Kang M, Zhou Z, Qin W, Wang R. Bioinformatics analysis identifies hub genes and pathways in nasopharyngeal carcinoma. Oncol Lett. 2019;18(4):
40. Chan GK, Jablonski SA, Starr DA, Goldberg ML, Yen TJ. Human Zw10 and ROD are mitotic checkpoint proteins that bind to kinetochores. Nat Cell Biol. 2000;2(12):
41. Keen N, Taylor S. Aurora-kinase inhibitors as anticancer agents. Nat Rev Cancer. 2004;4(12):927–936. doi:10.1038/nrc1502
42. Scaërou F, Starr DA, Piano F, Papoulas O, Karess RE, Goldberg ML. The ZW10 and rough deal checkpoint proteins function together in a large, evolutionarily conserved complex targeted to the kinetochore. J Cell Sci. 2001;114(Pt 17):
43. McMurry JA, Köhler S, Washington NL, et al. Navigating the phenotype frontier: the monarch initiative. Genetics. 2016;203(4):
44. Mungall CJ, McMurry JA, Köhler S, et al. The monarch initiative: an integrative data and analytic platform connecting phenotypes to genotypes across species. Nucleic Acids Res. 2017;45(D1):
 © 2020 The Author(s). This work is published and licensed by Dove Medical Press Limited. The full terms of this license are available at https://www.dovepress.com/terms.php and incorporate the Creative Commons Attribution - Non Commercial (unported, v3.0) License.
By accessing the work you hereby accept the Terms. Non-commercial uses of the work are permitted without any further permission from Dove Medical Press Limited, provided the work is properly attributed. For permission for commercial use of this work, please see paragraphs 4.2 and 5 of our Terms.
© 2020 The Author(s). This work is published and licensed by Dove Medical Press Limited. The full terms of this license are available at https://www.dovepress.com/terms.php and incorporate the Creative Commons Attribution - Non Commercial (unported, v3.0) License.
By accessing the work you hereby accept the Terms. Non-commercial uses of the work are permitted without any further permission from Dove Medical Press Limited, provided the work is properly attributed. For permission for commercial use of this work, please see paragraphs 4.2 and 5 of our Terms.