")
Back to Journals » OncoTargets and Therapy » Volume 9
Bioinformatics analysis of differentially expressed proteins in prostate cancer based on proteomics data
Authors Chen C, Zhang L, Liu J, Han H, Chen N, Yao A, Kang S, Gao W, Shen H, Zhang L, Li Y, Cao F, Li Z
Received 21 October 2015
Accepted for publication 12 January 2016
Published 16 March 2016 Volume 2016:9 Pages 1545—1557
DOI https://doi.org/10.2147/OTT.S98807
Checked for plagiarism Yes
Review by Single anonymous peer review
Peer reviewer comments 3
Editor who approved publication: Dr Jianmin Xu
Chen Chen,1 Li-Guo Zhang,1 Jian Liu,1 Hui Han,1 Ning Chen,1 An-Liang Yao,1 Shao-San Kang,1 Wei-Xing Gao,1 Hong Shen,2 Long-Jun Zhang,1 Ya-Peng Li,1 Feng-Hong Cao,1 Zhi-Guo Li3
1Department of Urology, North China University of Science and Technology Affiliated Hospital, 2Department of Modern Technology and Education Center, 3Department of Medical Research Center, International Science and Technology Cooperation Base of Geriatric Medicine, North China University of Science and Technology, Tangshan, People’s Republic of China
Abstract: We mined the literature for proteomics data to examine the occurrence and metastasis of prostate cancer (PCa) through a bioinformatics analysis. We divided the differentially expressed proteins (DEPs) into two groups: the group consisting of PCa and benign tissues (P&b) and the group presenting both high and low PCa metastatic tendencies (H&L). In the P&b group, we found 320 DEPs, 20 of which were reported more than three times, and DES was the most commonly reported. Among these DEPs, the expression levels of FGG, GSN, SERPINC1, TPM1, and TUBB4B have not yet been correlated with PCa. In the H&L group, we identified 353 DEPs, 13 of which were reported more than three times. Among these DEPs, MDH2 and MYH9 have not yet been correlated with PCa metastasis. We further confirmed that DES was differentially expressed between 30 cancer and 30 benign tissues. In addition, DEPs associated with protein transport, regulation of actin cytoskeleton, and the extracellular matrix (ECM)–receptor interaction pathway were prevalent in the H&L group and have not yet been studied in detail in this context. Proteins related to homeostasis, the wound-healing response, focal adhesions, and the complement and coagulation pathways were overrepresented in both groups. Our findings suggest that the repeatedly reported DEPs in the two groups may function as potential biomarkers for detecting PCa and predicting its aggressiveness. Furthermore, the implicated biological processes and signaling pathways may help elucidate the molecular mechanisms of PCa carcinogenesis and metastasis and provide new targets for clinical treatment.
Keywords: bioinformatics analysis, differentially expressed proteins, occurrence, literature mining, metastasis, prostate cancer, proteomics
Introduction
Prostate cancer (PCa) is one of the most common cancers in men, and it is the second leading cause of morbidity and mortality in men.1 The American Cancer Society predicts that 2,20,800 new cases of PCa will be diagnosed and 27,540 PCa-related deaths will occur in 2015.2 However, the pathogenesis and risk factors of PCa are complex and not yet fully understood. It has been well known that age, race, and heredity are risk factors of PCa. In addition, some exogenous factors, such as high-fat diet and less intake of vitamin E, selenium, lignans, or isoflavones would potentially promote the progression of PCa from latent to clinical type.3,4
With the development of proteomics technology, an increasing number of studies have examined PCa using proteomics, which is a powerful tool to investigate the pathogenesis and metastasis of PCa. Specifically, several tumor-related proteins have been identified in the tissue and biological fluids of various types and grades of cancer.5 For example, a previous global proteomics analysis, using the iTRAQ technology, found that periostin was significantly upregulated in the PCa tissues compared with that in the benign prostatic hyperplasia (BPH).6 Periostin interacts with multiple cell-surface receptors, most notably integrins to promote cancer cell survival, epithelial–mesenchymal transition (EMT), invasion, and metastasis through signaling mainly via the PI3K/Akt and other pathways.7 Applying proteomics technology, Skvortsov et al8 discovered that lamin A was statistically highly discriminatory between low and high Gleason score for PCa and might serve as a new biomarker of tumor differentiation. These tumor-related proteins may offer clues of not only a promising biomarker for the prognosis of PCa but also a potential target for therapeutic interventions. The proteome more accurately reflects the dynamic state of a cell, tissue, or organism,9 and proteomics is anticipated to elucidate the mechanisms related to PCa. However, proteomics technologies require complex instrumentation and expensive consumables. Therefore, most studies have investigated small samples with great sampling error, which results in low reliability compared with the low-throughput methods (Western blot and enzyme-linked immunosorbent assay [ELISA]).10 In addition, current proteomics methods cannot resolve all proteins in one sample due to limitations in resolution. Different complementary methods can resolve proteins from the same sample; thus, a combination of different methods may resolve more proteins.11 For example, two-dimensional gel electrophoresis is associated with a low detection rate for low-abundance, hydrophobic, acidic, basic, small and large proteins, and the combination of liquid chromatographic techniques with a subsequent mass spectrometric analysis (LC-MS) is limited by the incomplete chromatographic separation of peptides. However, combining these two approaches will increase the detection rate.12 Moreover, proteomics studies have generated a large amount of data, but these data have not been thoroughly investigated. Consequently, data have accumulated, but their biological significance has not yet been determined.10,13 Proteomics experiments yield a list of identified proteins, and this list usually is not deeply investigated. Specifically, only the expression levels of three to five proteins are confirmed by Western blotting or immunofluorescence.10 Therefore, the biological significance of only a few proteins in the dataset is explored, and the remaining information, if deposited in a proteomic database, is lost or almost never investigated.10
The application and development of computer technology and mathematics in the field of biology (bioinformatics) has become one of the most important tools in proteomics. Bioinformatics tools are essential for converting raw proteomics data into relevant knowledge and subsequently into useful applications.9 Furthermore, bioinformatics provides a method to convert datasets into biologically interpretable results and functional outcomes.14 Many studies have successfully combined data mining with bioinformatics technology. Hu et al15 analyzed breast cancer proteomics and genomics data using the literature-mining tool MedGene. They identified a set of relatively understudied yet highly expressed genes in estrogen receptor-negative tumors that warrant further examination. Li et al16 analyzed specific genes in androgen-independent PCa using literature mining and bioinformatics. They found that matrix metalloproteinase (MMP)-9 and epidermal growth factor receptor (EGFR) play important roles in the transformation of androgen-dependent PCa into androgen-independent PCa. These bioinformatics analyses have shed light on carcinogenesis at the molecular level. However, these studies usually rely on automatic data-mining tools, which only search the abstracts instead of the entire article. Therefore, differentially expressed genes or proteins that were reported in the articles may be overlooked. In addition, bioinformatics analyses of the whole proteome have not been employed to examine PCa occurrence and metastasis. Thus, in this study, we manually searched the proteomics literature of differentially expressed proteins (DEPs) related to PCa occurrence and metastasis in PubMed. Specifically, we searched for articles indexed before June 1, 2015 that were published in English. We hypothesized that proteins that had been repeatedly identified by multiple proteomics studies may serve as potential PCa biomarkers. Consequently, the frequency with which DEPs had been reported was counted, and frequently reported proteins were subjected to experimental verification. We also used bioinformatics tools to carry out a GO (Gene Ontology) and KEGG (Kyoto Encyclopedia of Genes and Genomes) pathways analysis of DEPs to observe and analyze the changes in proteins and signaling pathways during PCa occurrence and metastasis from a global perspective.
Materials and methods
The literature search strategy
We used PubMed as the main source for the literature search. To prevent overlooking relevant articles, we first searched all proteomics studies related to PCa. We then excluded literature not directly related to human PCa occurrence and metastasis. We used the advanced search option in PubMed by inputting “(prostate cancer[Title]) AND Proteomics” and restricted the search to studies published in English before June 1, 2015. Studies that met the following criteria were excluded: 1) studies examining nonhuman tissue or cell lines, 2) studies examining the effects of certain interventions on the protein expression profiles, 3) studies that did not supply names or accession numbers of DEPs, and 4) literature reviews. The Ethics Committee of North China University of Science and Technology approved this study.
Official gene symbol transform
The DEPs were transformed into corresponding official gene symbols using the Protein Information Resource (PIR, Georgetown University Medical Center, Washington, DC, USA). The PIR is an integrated public bioinformatics resource to support genomic, proteomic, and systems biology research and scientific studies.17
Grouping of PCa proteomics studies
We divided the selected proteomics literature into two groups: the PCa and benign tissue or cell (P&b) group and the high and low metastatic tendency of PCa (H&L) group. In the P&b group, we compared the protein expression profiles of PCa tissue and BPH, PCa tissue and adjacent benign tissues, and PCa cells and normal prostate cells. The resultant DEPs reveal the changes in related proteins during tumorigenesis. In the H&L PCa group, we compared metastatic PCa (lymph node metastasis, bone metastasis) and localized PCa (cancer limited inside the prostate without metastasis), organ-confined and extracapsular PCa, high Gleason score and low Gleason score, metastatic PCa cell line and cell lines from PCa localized to the prostate, and high and low/poor metastatic PCa cell lines. The resultant DEPs identify changes related to metastasis risk.
The reported frequency of the DEPs in the literature
We manually counted the frequency with which each DEP is reported in the literature. If several DEPs were associated with the same official gene symbol in one study, this DEP was considered to have been reported once.
Functional classification of DEPs
To examine the biological significance of the DEPs, we carried out a GO enrichment analysis and KEGG pathway analysis of the DEPs from the P&b and H&L groups using the online tool DAVID Bioinformatics Resources 6.7 (The Database for Annotation, Visualization and Integrated Discovery, from the National Institute of Allergy and Infectious Diseases, National Institutes of Health, Bethesda, MD, USA).18 To explore the overrepresented biological terms and signaling pathways, we set threshold of false discovery rate to P<0.05.
Tissue specimens and immunohistochemistry validation
We selected the DES protein, which was the most commonly reported protein in the P&b group, for further experimental validation. A total of 60 pathological sections were postoperatively collected from each patient at the department of Pathology of the North China University of Science and Technology Affiliated Hospital. These patients were divided into the PCa group, which included 30 patients who had undergone a transurethral resection of the prostate between 2007 and 2014. The mean age, mean serum prostate-specific antigen, and mean prostate volume of this group were 73.1±8.47 years (range: 51–88 years), 50.99±37.02 ng/mL (range: 0.89–102.1 ng/mL), and 58.22±29.13 cm3 (range: 26.19–142.3 cm3), respectively. Postoperative pathologic reports confirmed a diagnosis of prostate adenocarcinoma. None of the patients received radiotherapy or adjuvant therapy before surgery. The patient characteristics are shown in Table 1. The remaining 30 patients were allocated to the BPH group, whose mean age, mean serum prostate-specific antigen, and mean prostate volume were 72.1±8.98 years (range: 55–90 years), 5.38±7.17 ng/mL (range: 0.362–29.86 ng/mL), and 67.68±29.28 cm3 (range: 23.15–154.77 cm3), respectively. All patients underwent transurethral resection of the prostate, and postoperative pathology reports confirmed a diagnosis of BPH. We also excluded individuals with underactive detrusor, unstable bladder, PCa, or a surgery history of BPH. This study was approved by the local ethics committee of the North China University of Science and Technology Affiliated Hospital.
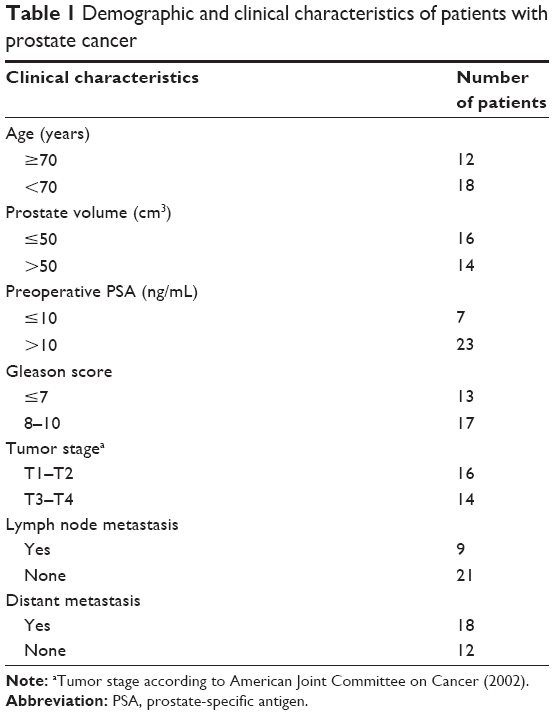 | Table 1 Demographic and clinical characteristics of patients with prostate cancer |
DES antibody was purchased from Abcam (Cambridge, UK), and conjugated antibody PV6000 was purchased from American GBI company (Los Angeles, California, USA). All procedures followed the manufacturer’s instructions. Briefly, 5 μm paraffin sections were deparaffinized in xylene, gradually rehydrated in ethanol, and endogenous enzyme activity was blocked by incubation in 3% hydrogen peroxide for 10 minutes at room temperature. Antigen retrieval was performed using 0.01 mol/L sodium citrate buffer (pH 6.0) at 115°C for 1.5 minutes. The tissue sections were incubated with the primary polyclonal antibody to DES overnight at 4°C. After washing, the sections were incubated with secondary antibody for 25 minutes at 37°C, and the signal was visualized with the Diaminobenzidine map kit. Following counterstaining with hematoxylin, positive immunostaining was scored by two experienced pathologists in a blinded manner. Any discrepant scores were reexamined by both pathologists to reach a consensus score. The immunohistochemistry (IHC) results were scored by examining ten random representative fields at high magnification to observe the positive cells. Each visual field was scored in a semiquantitative manner with the following scale: 1) According to the staining intensity: no coloring =0, light-yellow =1, brown-yellow =2, and chocolate brown =3. 2) According to the staining area: no coloring =0, <25% =1, 25%–50% =2, >50% =3. The staining intensity and staining area were multiplied to produce a weighted score for each case. Cases with scores of 0–3 were designated as “negative”, whereas cases with scores of 4–9 were designated as “positive”.
Statistical analysis
The SPSS 17.0 software package (SPSS Inc., Chicago, IL, USA) was used to conduct the statistical analyses. Quantitative data are expressed as mean ± variance. The χ2 test was used to compare the positive rate in the tumor stroma and BPH tissues, and values of P<0.05 were considered statistically significant.
Results
General survey of proteomics data
The data mining and analysis identified a total of 555 DEPs. Of the 555 DEPs, 320 were in the P&b group, 353 were in the H&L PCa group, and 119 appeared in both groups. In the P&b group, 77 DEPs were reported more than twice, and 20 were reported more than three times (Table 2). DES was reported most often (seven times). In the H&L PCa group, 52 proteins were reported more than twice and 13 were reported more than three times (Table 3). Of these proteins, ACPP, HSPA5, and VCL were reported most often (four times). Proteins in the P&b and H&L groups are described in detail in Tables S1 and S2.
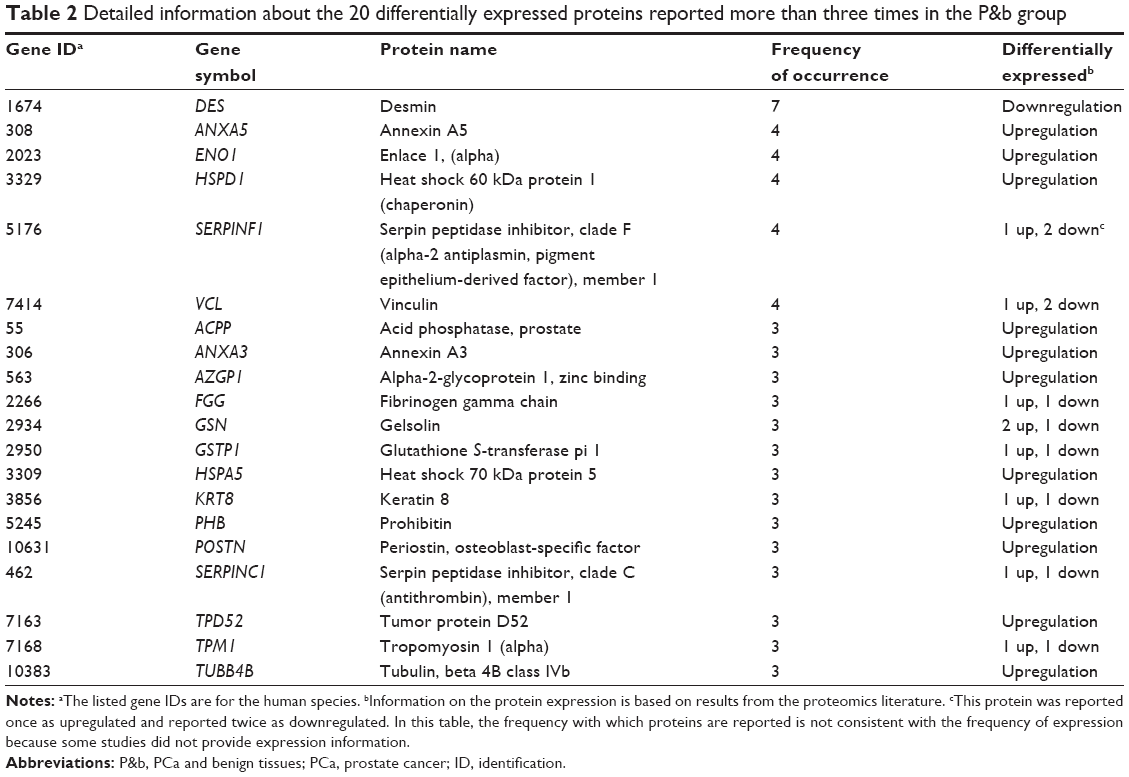 | Table 2 Detailed information about the 20 differentially expressed proteins reported more than three times in the P&b group |
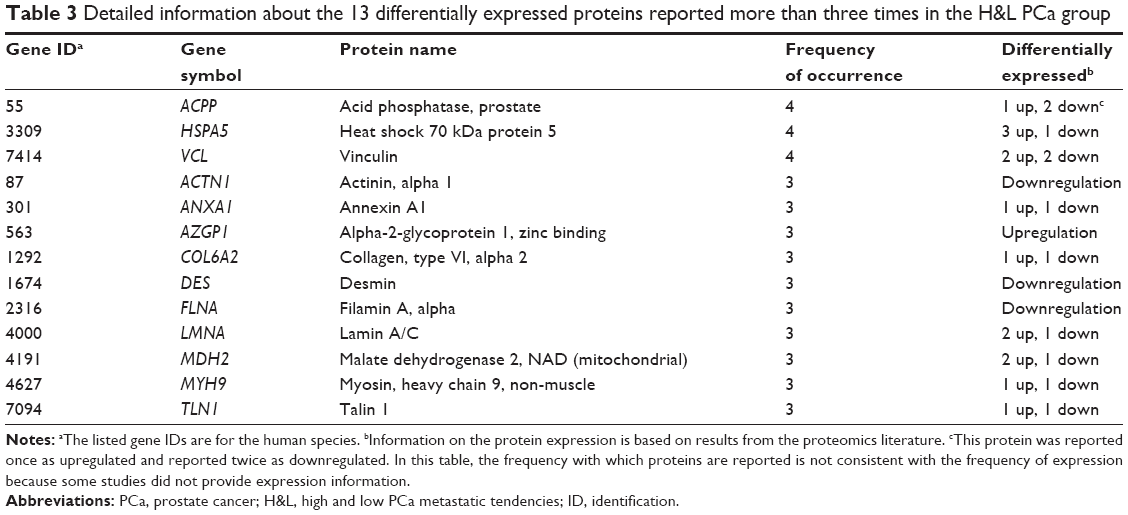 | Table 3 Detailed information about the 13 differentially expressed proteins reported more than three times in the H&L PCa group |
GO term enrichment analysis
To gain insight into the biological roles of these DEPs, we performed a GO categories enrichment analysis, which provides a common descriptive framework to functionally annotate and classify gene sets.19 GO categories are organized into three groups: biological process, cellular component, and molecular function. Using a false discovery rate <0.05 threshold, we identified GO terms for biological processes significantly enriched in response to wounding, regulation of apoptosis, response to organic substance, homeostatic process, cell motion, and cell adhesion in the P&b group in our study. Overrepresented cellular components mainly included extracellular region, intracellular non-membrane-bound organelle, membrane-enclosed lumen, cytoskeleton, vesicle, and mitochondrion. For molecular functions, the enriched GO terms were calcium ion binding, structural molecule activity, cytoskeletal protein binding, identical protein binding, and enzyme inhibitor activity (Figure 1). In the H&L PCa group, we identified GO terms for biological processes significantly enriched in protein localization, protein transport, the regulation of apoptosis, cell adhesion, and homeostasis. Overrepresented cellular components mainly included extracellular region, intracellular non-membrane-bound organelle, cytoskeleton, membrane-enclosed lumen, cell fraction, vesicle, cell projection, and extracellular matrix (ECM). For molecular functions, the enriched GO terms were nucleotide binding, calcium ion binding, cytoskeletal protein binding, structural molecule activity, and identical protein binding (Figure 2).
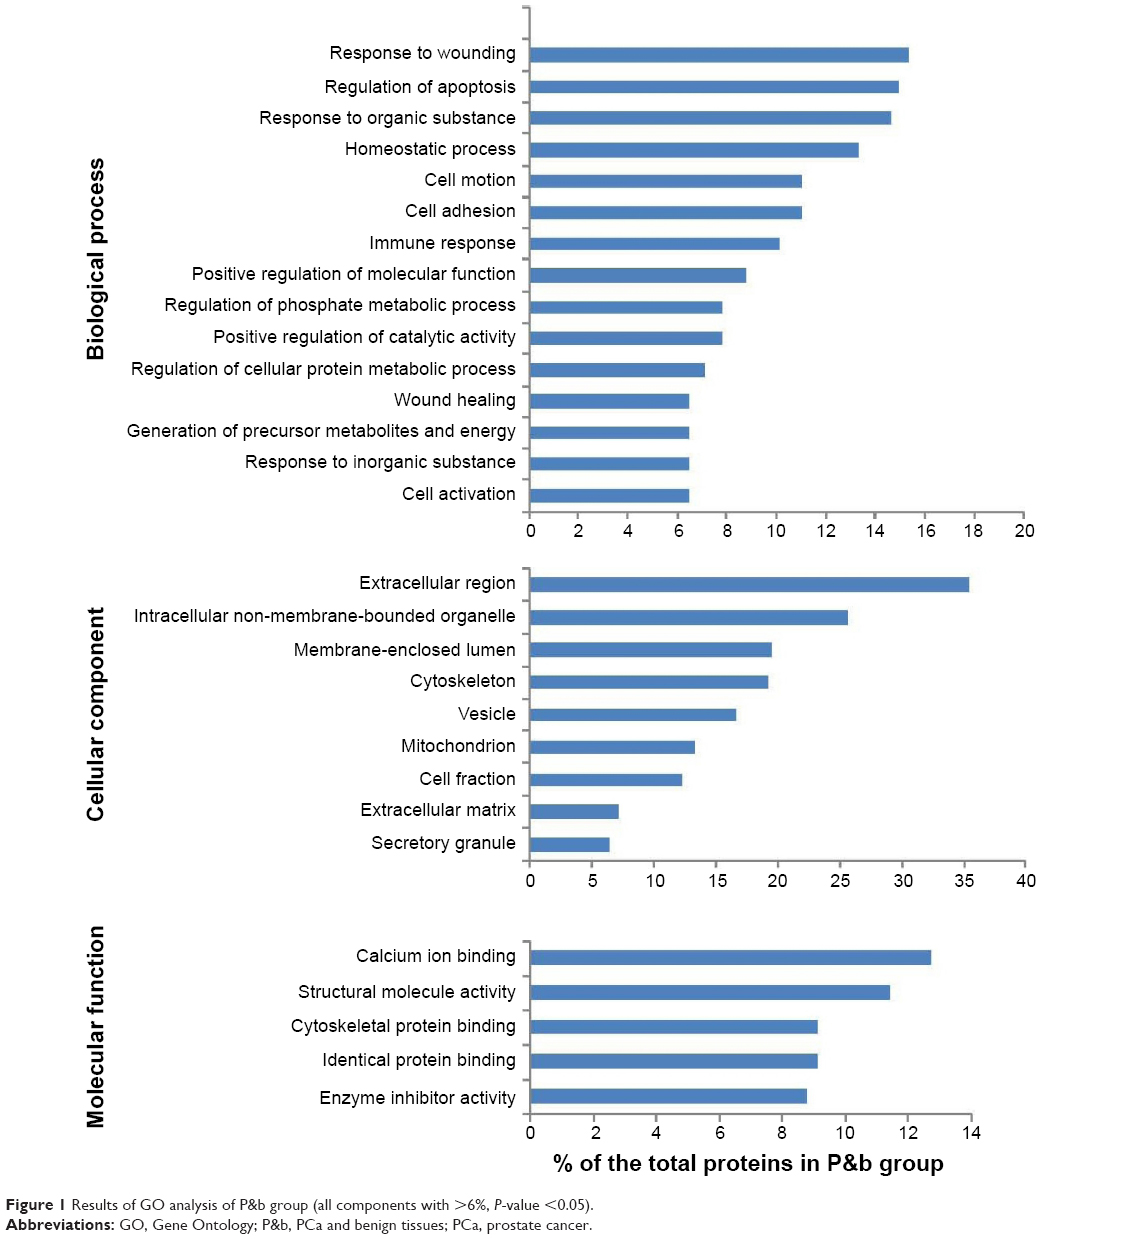 | Figure 1 Results of GO analysis of P&b group (all components with >6%, P-value <0.05). |
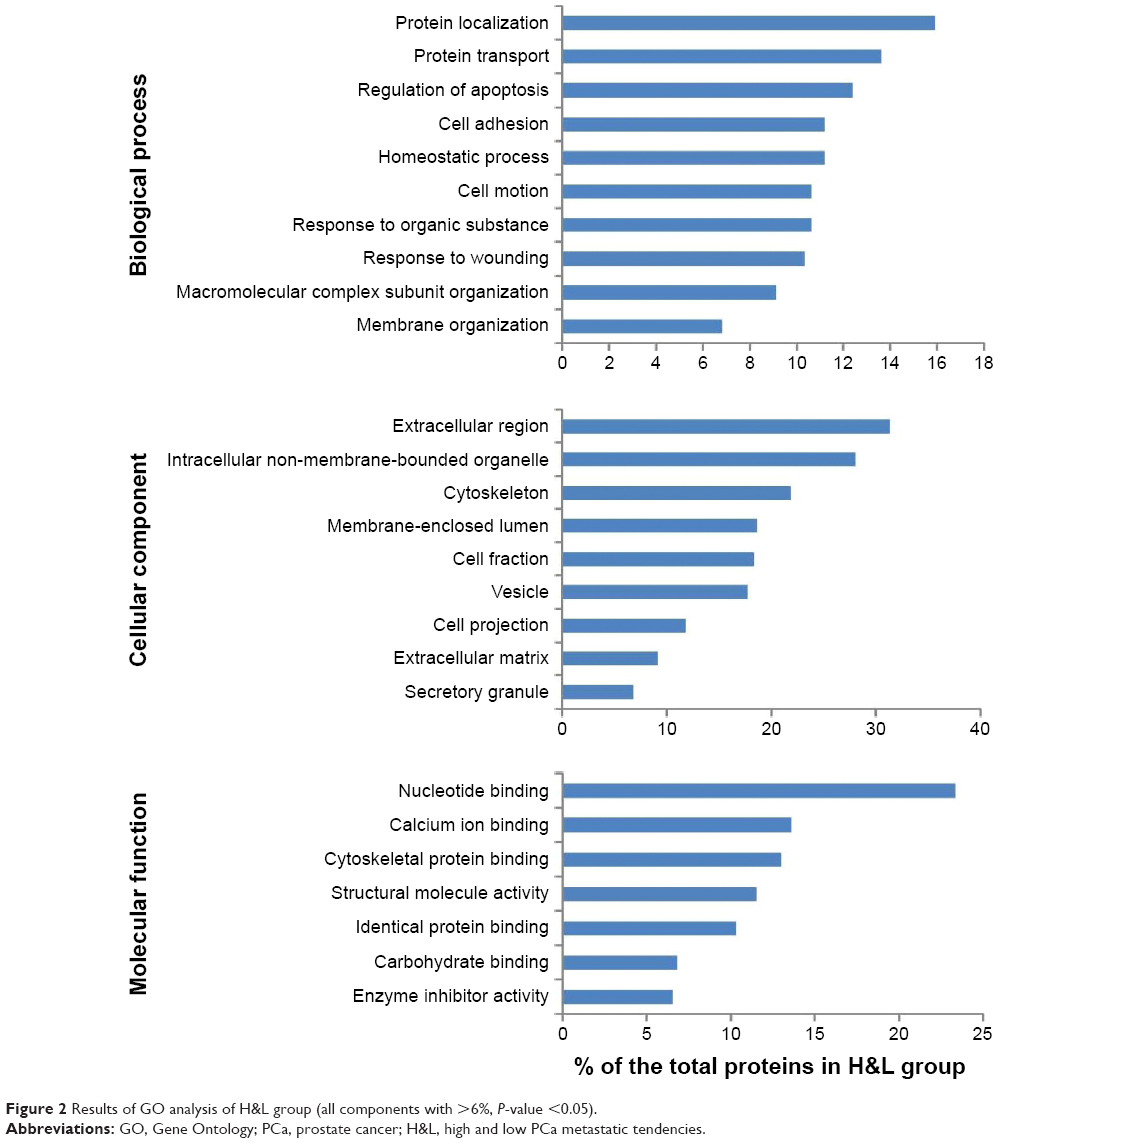 | Figure 2 Results of GO analysis of H&L group (all components with >6%, P-value <0.05). |
KEGG pathway analysis of DEPs
We conducted a KEGG pathway analysis for DEPs in P&b and H&L groups. The results show that the overrepresented DEPs in the P&b group are mainly related to focal adhesion formation, the complement and coagulation cascades, and the glycolysis/gluconeogenesis signaling pathway (percentage >3%, P-value <0.05) (Table 4). In the H&L PCa group, the overrepresented DEPs are mainly associated with the regulation of the actin cytoskeleton, focal adhesion formation, ECM–receptor interaction, and the complement and coagulation cascade signaling pathways (percentage >3%, P-value <0.05) (Table 5).
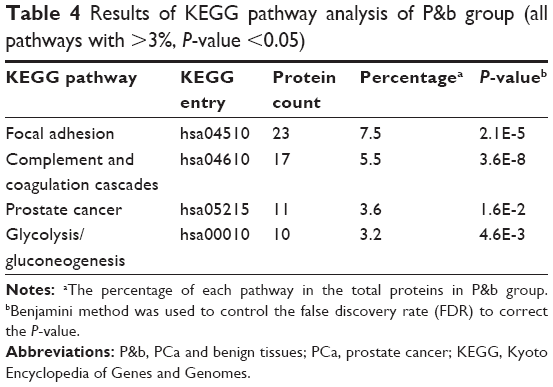 | Table 4 Results of KEGG pathway analysis of P&b group (all pathways with >3%, P-value <0.05) |
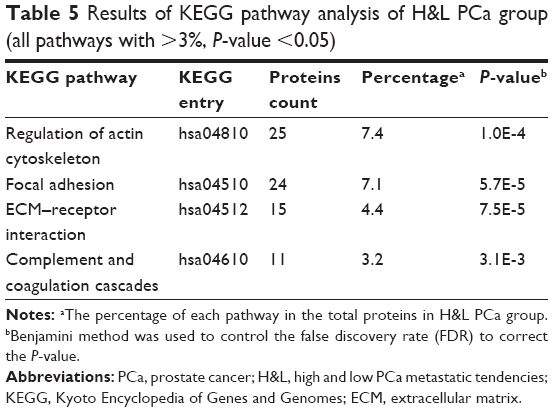 | Table 5 Results of KEGG pathway analysis of H&L PCa group (all pathways with >3%, P-value <0.05) |
DES protein is downregulated in human PCa tissues
We measured the DES protein levels using IHC in 30 PCa and 30 BPH tissue specimens. Immunohistochemical staining for DES revealed benign tissue cells with concentrated staining in the stroma, and BPH showed strong DES staining; weak staining and no staining were observed in PCa tissue (Figure 3). Specifically, ~73.3% and 10% of BPH and PCa tissues were positive for DES, respectively, and this difference was significant (P<0.001) (Table 6).
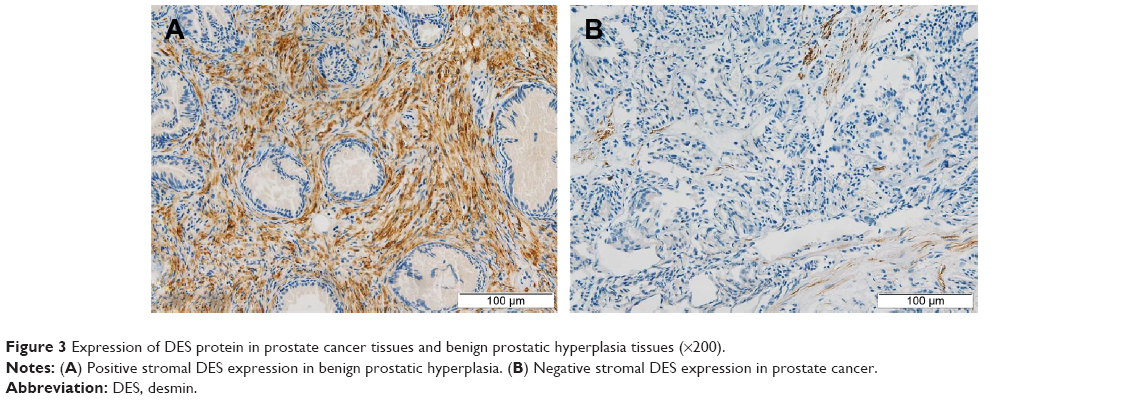 | Figure 3 Expression of DES protein in prostate cancer tissues and benign prostatic hyperplasia tissues (×200). |
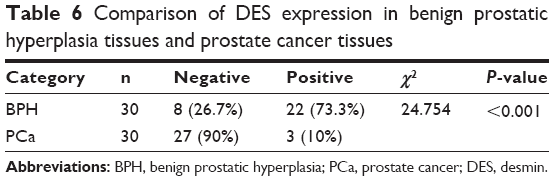 | Table 6 Comparison of DES expression in benign prostatic hyperplasia tissues and prostate cancer tissues |
Discussion
Proteomics technology plays important roles in the study of PCa occurrence and metastasis by simultaneously monitoring changes in thousands of proteins. However, due to limits in resolution, current proteomics technology can only monitor changes in certain proteins. In addition, it cannot examine many samples due to complex techniques and expensive consumables, which results in unreliable findings. Thus, we conducted general bioinformatics analysis of human PCa occurrence and metastasis using the proteomics literature in PubMed indexed before June 1, 2015. We combined the findings of several proteomics studies.5,6,8,20–45 Specifically, proteomics technologies supplement each other to compensate for shortcomings associated with various methods, which increases the coverage to detect more proteins. In addition, if more than one or similar methods confirm same protein changes, the results are more reliable.
As shown in Tables 2 and 3, we found that some changes in proteins are not consistent. This discrepancy may be due to separation changes or sampling errors caused by differences in modifications, differences in transcripts, or genetic mutations. In the P&b group, DES, ANXA5, ENO1, and other proteins were reported more than three times, and of these DEPs, DES was reported most often (seven times). This finding suggests that changes in these proteins are closely related to PCa occurrence. These proteins are potential differential diagnosis biomarkers between PCa and benign disease. Among these proteins, SERPINF1 has been shown to be the most potent inhibitor of angiogenesis. In PCa, its expression is downregulated compared with normal prostatic epithelial cells.46 SERPINF1 can block angiogenesis, induce apoptosis, and prompt the neuroendocrine differentiation of PCa cells.47 Abnormal methylation of GSTP1 will downregulate the expression of target genes, and promote the progression of PCa.48 The dynamic interactions between HSPA5 and clusterin (CLU) under endoplasmic reticulum stress conditions may govern CLU trafficking and redistribution to the mitochondria, elucidating how HSPA5 and CLU cooperatively promote survival during treatment stress in PCa.49 POSTN can induce EMT via the activation of the PI3K/Akt pathway in PCa cells.50 TPD52 promotes cell migration via αvβ3 integrin in PCa cells through activation of the protein kinase B/Akt signaling pathway.51 Moreover, DES,52 HSPD1,53 ANXA3,54 ANXA5,55 ENO1,56 VCL,57 AZGP1,58 KRT8,59 and PHB60 were reported to be differentially expressed between PCa and normal tissues, whereas the molecular mechanisms of this differential expression need to be further investigated. Currently, the association between FGG, GSN, SERPINC1, TPM1, and TUBB4B and PCa occurrence has not been studied in detail.
In the H&L PCa group, 13 proteins (ACPP, HSPA5, VCL, etc) were reported more than three times. Of these proteins, ACPP, HSPA5, and VCL were the most reported (four times), which suggests that these proteins are potential biomarkers that can be used to differentiate aggressive from non-aggressive PCa. ACPP has already been reported to be expressed in human PCa bone metastases and promote osteoblast differentiation.61 The upregulated expression of HSPA5 is associated with the development of castration-resistant PCa.62 VCL overexpression might contribute to PCa progression by enhancing tumor cell proliferation.63 ANXA1 was shown to regulate EMT in PCa cells.64 The expression of AZGP1 might be regulated by androgen, and the relationship between AZGP1 and GATA-2 may have functional roles in the transition of PCa cells to a more aggressive phenotype.58 COL6A2 is likely to be one of the important hyper-methylation genes involved in the pathway from PCa to androgen-independent PCa.65 FLNA may interact with androgen receptor and may suppress androgen receptor transcriptional activity.66 LMNA is positively involved in malignant behavior of PCa cells through the PI3K/Akt/PTEN pathway.67 As a adaptor protein, TLN1 promotes the activation of integrins, which further promote turmor cell motility by forming focal adhesions.68 To the best of our knowledge, the association between MDH2 or MYH9 and PCa has not yet been investigated, which warrants further investigation. In addition, ACPP, HSPA5, VCL, AZGP1, and DES were also reported more than three times in the P&b group, suggesting that these proteins may be involved in PCa occurrence and metastasis.
A protein cancer biomarker is a protein measured in body fluids or in tissues that could reflect the presence of cancer and indicate its aggressiveness, staging, and response to therapy. Protein cancer biomarkers can be divided into several categories: diagnostic screening biomarkers, prognostic biomarkers, and stratification biomarkers.69 Proteomics, together with the innovative high-throughput technologies, might be a highly promising way to identify new biomarkers for both detection and tailoring therapy.24 This study is to extract some DEPs that had been repeatedly reported from previous PCa-related proteomics literature. To further validate the hypothesis that frequently reported proteins can be used as potential differential diagnosis biomarkers, we examined the expression of DES protein, which was the most commonly reported protein in the P&b group, using IHC. The results showed that compared with BPH tissue, DES was significantly downregulated in cancer tissues. This expression is consistent with the expression levels of this protein reported in the proteomics literature in Table 2, indicating that DES can be used as a potential biomarker to detect PCa and differentiate benign disease. Furthermore, this result is consistent with the experimental results obtained by Wu et al70 from clinical samples. Moreover, Ayala et al52 also proposed that DES can be used as a late-stage PCa smooth muscle marker. Specifically, its expression is also downregulated during PCa progression; patients exhibiting lower DES expression levels had a shorter disease-free period. This finding agrees with the high frequency with which DES was reported in the H&L PCa group, suggesting that DES can also be used as a potential biomarker to differentiate aggressive PCa from non-aggressive PCa. DES is a muscle-specific type III intermediate filament essential for proper muscular structure and function.71 Now several studies have shown that DES is a highly sensitive marker for endothelial cell differentiation and tumor invasiveness in several types of cancers, including colon cancer, gastrointestinal stromal tumors, endometrial carcinoma, and embryonal sarcomas.72–75 Moreover, some researches asserted that DES keeps continuous high expression in the formation process of early tumor capillaries.76 Therefore, DES was further characterized in this study to confirm the potential diagnostic and prognostic value for PCa. The aforementioned DEPs all repeatedly appeared in the proteomics literature, which suggests that these proteins are potential biomarkers of PCa. Therefore, these DEPs warrant further study to determine the true meaning of the differential expression.
A GO analysis of the DEPs in both the P&b and H&L groups revealed that proteins related to the regulation of apoptosis, cell adhesion, cell motion, homeostasis, and the response to wounding appeared in both groups. This finding suggests that these biological processes may be closely associated with PCa. The abnormal regulation of apoptosis, loss of cell–cell adhesion, cell motility via the EMT of epithelial cells, and collective cell motility can promote PCa occurrence and metastasis.77,78 However, few studies79–81 have examined the roles of homeostasis and response to wounding in the molecular biology of PCa. The homeostatic balance between tumor suppressor proteins and oncoproteins in normal prostate epithelia is apparently altered in cancer cells.79 Changes in Ca2+ homeostasis can also trigger the development of PCa.80 In addition, some data support that the stromal cells behave nearly identical in response to a wound or a tumor. Accordingly, the role of stromal cells in tissue homeostasis, particularly in wound healing, is functionally linked to the role of stromal cells in the PCa-generated stromal response.81 Therefore, further studies are required to take advantage of the stromal response in formulating new therapeutic approaches. In the H&L PCa group, enrichment in processes related to protein localization and protein transport suggested that these processes may play important roles in PCa development and metastasis. We searched the literature for DEPs that had been reported more than three times in the P&b and H&L groups to study the molecular mechanisms by which these proteins are involved in PCa. We found that many of the biological processes involved overlap with the results of the GO analysis. To illustrate their possible combined influence on PCa as a whole, these proteins were mapped in the background of all the involved biological processes in Figure 4. However, this approach provides far from a comprehensive snapshot of all the PCa-related proteins because of the limited number of proteins identified in this study.
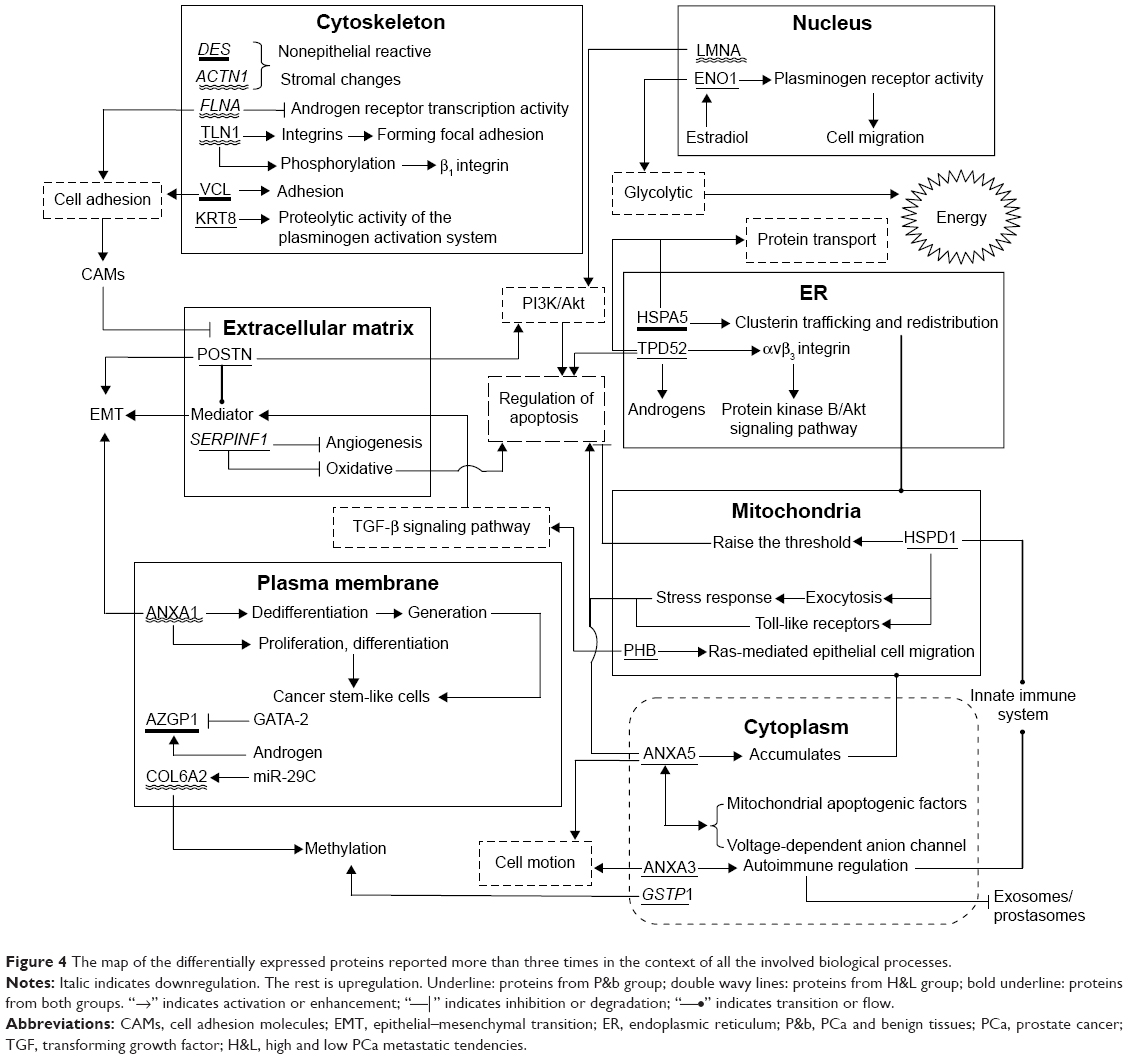 | Figure 4 The map of the differentially expressed proteins reported more than three times in the context of all the involved biological processes. |
By studying the DEPs in the P&b and H&L groups via the KEGG pathway analysis, we found that focal adhesion formation and the complement and coagulation cascades pathways simultaneously appear in both groups (Tables 4 and 5). Focal adhesions are special regions at which cells attach to the ECM,16 and previous studies have indicated that FAK is frequently overexpressed and overactive in PCa. Through the activation of major oncogenic pathways, FAK promotes the growth, survival, migration, metastasis, and androgen-independence of prostate tumors.82 In recent years, some studies have reported that the complement and coagulation cascades are associated with PCa. Hong et al83 reported that complement C1q may induce PCa apoptosis by activating WOX1 and destabilizing cell adhesion. The downregulation of C1q enhances tumorigenesis due to WOX1 inactivation. Therefore, complement C1q is an important factor in the occurrence of PCa that warrants further study. In addition, the glycolysis/gluconeogenesis pathway was enriched in the P&b group. PPARG, CAV1, and LRP6 have been reported to be able to affect glycolysis in PCa cells to slow cell growth and cause apoptosis by interrupting energy metabolism.84,85 Table 5 shows that the regulation of the actin cytoskeleton and ECM–receptor interaction pathway are enriched in the H&L PCa group. The enhanced motility of cancer cells due to the remodeling of the actin cytoskeleton is crucial in the process of cancer cell invasion and metastasis.86 Multiple studies have also demonstrated changes in expression of ECM molecules in advanced PCa tumor samples, such as increased expression of bone sialoprotein and CDH-11 or decreased collagen type VII expression.87 However, few studies have examined PCa and ECM–receptor interaction, and this interaction warrants further examination.88,89
Conclusion
In conclusion, we conducted a bioinformatics analysis of the proteomics literature on PCa and identified several PCa-associated proteins. The repeatedly reported DEPs between the P&b and H&L groups may serve as potential biomarkers to discriminate PCa from benign tissue or identify metastasis risk. The experimental detection of one of these proteins in clinically relevant sets of samples verified our hypothesis. However, some repeatedly reported proteins lacked detailed studies. The overrepresentation of biological processes and signaling pathways increased our understanding of the molecular mechanisms of PCa carcinogenesis and metastasis and may even provide additional targets for clinical diagnosis and treatment.
Acknowledgments
This study was supported by the National Natural Science Foundation of China (Grant No 81100518), Youth Foundation of Higher Education Scientific Research of Hebei Province (Grant No QN2014013), the Social Science Fund Project of Hebei Province (Grant No HB12SH030), and the Tangshan Research and Development Program (Grant No 111302112b).
Disclosure
The authors report no conflicts of interest in this work.
References
Li Y, Vongsangnak W, Chen L, Shen B. Integrative analysis reveals disease-associated genes and biomarkers for prostate cancer progression. BMC Medical Genomics. 2014;7(Suppl 1):S3. | ||
Smith RA, Manassaram-Baptiste D, Brooks D, et al. Cancer screening in the United States, 2015: a review of current American Cancer Society guidelines and current issues in cancer screening. CA Cancer J Clin. 2015;65(1):30–54. | ||
Antonelli JA, Jones LW, Bañez LL, et al. Exercise and prostate cancer risk in a cohort of veterans undergoing prostate needle biopsy. J Urol. 2009;182(5):2226–2231. | ||
Ma RW, Chapman K. A systematic review of the effect of diet in prostate cancer prevention and treatment. J Hum Nutr Diet. 2009;22(3):187–199. | ||
Davalieva K, Kiprijanovska S, Komina S, Petrusevska G, Zografska NC, Polenakovic M. Proteomics analysis of urine reveals acute phase response proteins as candidate diagnostic biomarkers for prostate cancer. Proteome Sci. 2015;13(1):1–17. | ||
Sun C, Song C, Ma Z, et al. Periostin identified as a potential biomarker of prostate cancer by iTRAQ-proteomics analysis of prostate biopsy. Proteome Sci. 2011;9(1):22. | ||
Ruan K, Bao S, Ouyang G. The multifaceted role of periostin in tumorigenesis. Cell Mol Life Sci. 2009;66(14):2219–2230. | ||
Skvortsov S, Scha G, Stasyk T, et al. Proteomics profiling of microdissected low- and high-grade prostate tumors identifies Lamin A as a discriminatory biomarker. J Proteome Res. 2011;10(1):259–268. | ||
Cho WC. Proteomics technologies and challenges. Genomics Proteomics Bioinformatics. 2007;5(2):77–85. | ||
Wetie AGN, Shipp DA, Darie CC. Bottlenecks in proteomics. 2014;806:581–593. | ||
Yang S, Liu T, Li S, et al. Comparative proteomic analysis of brains of naturally aging mice. Neuroscience. 2008;154(3):1107–1120. | ||
Garbis S, Lubec G, Fountoulakis M. Limitations of current proteomics technologies. J Chromatogr A. 2005;1077(1):1–18. | ||
Dihazi GH, Dihazi H. Protein-protein interaction networks improve the proteomics data interpretation in induced apoptosis. Expert Rev Proteomics. 2010;7(2):177–180. | ||
Guingab-Cagmat JD, Cagmat EB, Hayes RL, Anagli J. Integration of proteomics, bioinformatics, and systems biology in traumatic brain injury biomarker discovery. Front Neurol. 2013;4:1–12. | ||
Hu Y, Hines LM, Weng H, et al. Analysis of genomic and proteomic data using advanced literature mining. J Proteome Res. 2003;2:405–412. | ||
Li TQ, Feng CQ, Zou YG, Shi R, Liang S, Mao XM. [Literature-mining and bioinformatic analysis of androgen-independent prostate cancer-specific genes]. Natl J Androl. 2009;15(12):1102–1107. Chinese. | ||
Wu CH, Yeh LS, Huang H, et al. The Protein Information Resource. Nucleic Acids Res. 2003;31(1):345–347. | ||
Dennis G Jr, Sherman BT, Hosack DA, et al. DAVID: Database for Annotation, Visualization, and Integrated Discovery. Genome Biol. 2003;4(5):R60.61–10. | ||
Ning LF, Yu YQ, GuoJi ET, et al. Meta-analysis of differentially expressed genes in autism based on gene expression data. Genet Mol Res: GMR. 2015;14(1):2146–2155. | ||
Pang J, Liu W-P, Liu X-P, et al. Profiling protein markers associated with lymph node metastasis in prostate cancer by DIGE-based proteomics analysis. J Proteome Res. 2010;9(1):216–226. | ||
Ummanni R, Junker H, Zimmermann U, et al. Prohibitin identified by proteomic analysis of prostate biopsies distinguishes hyperplasia and cancer. Cancer Lett. 2008;266(2):171–185. | ||
Alaiya AA. Proteomics-based signature for human benign prostate hyperplasia and prostate adenocarcinoma. Int J Oncol. 2011;38(4):1047–1057. | ||
Geisler C, Gaisa NT, Pfister D, et al. Identification and validation of potential new biomarkers for prostate cancer diagnosis and prognosis using 2D-DIGE and MS. Biomed Res Int. 2015;2015:1–23. | ||
Pin E, Fredolini C, Petricoin EF. The role of proteomics in prostate cancer research: biomarker discovery and validation. Clin Biochem. 2013;46(6):524–538. | ||
Ummanni R, Duscharla D, Barett C, et al. Prostate cancer-associated autoantibodies in serum against tumor-associated antigens as potential new biomarkers. J Proteomics. 2015;119:218–229. | ||
Lee EK, Cho H, Kim CW. Proteomic analysis of cancer stem cells in human prostate cancer cells. Biochem Biophys Res Commun. 2011;412(2):279–285. | ||
Wood SL, Knowles MA, Thompson D, Selby PJ, Banks RE. Proteomic studies of urinary biomarkers for prostate, bladder and kidney cancers. Nat Rev Urol. 2013;10(4):206–218. | ||
Zhang XB, Tang ZY, Zu XB, Qi L, Ruan JD. [Modified serum-guided immunoblotting for differential proteomic study of prostate cancer]. Zhonghua Nan Ke Xue. 2010;16(5):438–444. Chinese. | ||
Bergamini S, Bellei E, Bonetti LR, et al. Inflammation: an important parameter in the search of prostate cancer biomarkers. Proteome Science. 2014;12(32):1–12. | ||
Amaro A, Esposito AI, Gallina A, et al. Validation of proposed prostate cancer biomarkers with gene expression data: a long road to travel. Cancer Metastasis Rev. 2014;33(2–3):657–671. | ||
Han ZD, Zhang YQ, He HC, et al. Identification of novel serological tumor markers for human prostate cancer using integrative transcriptome and proteome analysis. Med Oncol. 2012;29(4):2877–2888. | ||
Burgess EF, Ham AJ, Tabb DL, et al. Prostate cancer serum biomarker discovery through proteomic analysis of alpha-2 macroglobulin protein complexes. Proteomics Clin Appl. 2008;2(9):1223–1233. | ||
Kiprijanovska S, Stavridis S, Stankov O, et al. Mapping and identification of the urine proteome of prostate cancer patients by 2D PAGE/MS. International Journal of Proteomics. 2014;2014:1–12. | ||
Jedinak A, Curatolo A, Zurakowski D, et al. Novel non-invasive biomarkers that distinguish between benign prostate hyperplasia and prostate cancer. BMC Cancer. 2015;15(1). | ||
Li C, Zang T, Wrobel K, Huang JTJ, Nabi G. Quantitative urinary proteomics using stable isotope labelling by peptide dimethylation in patients with prostate cancer. Anal Bioanal Chem. 2015;407(12):3393–3404. | ||
Sandvig K, Llorente A. Proteomic analysis of microvesicles released by the human prostate cancer cell line PC-3. Mol Cell Proteomics. 2012;11(7):M111.012914–M012111.012914. | ||
Kim Y, Ignatchenko V, Yao CQ, et al. Identification of differentially expressed proteins in direct expressed prostatic secretions of men with organ-confined versus extracapsular prostate cancer. Mol Cell Proteomics. 2012;11(12):1870–1884. | ||
Sardana G, Jung K, Stephan C, Diamandis EP. Proteomic analysis of conditioned media from the PC3, LNCaP, and 22Rv1 prostate cancer cell lines: discovery and validation of candidate prostate cancer biomarkers. J Proteome Res. 2008;7(8):3329–3338. | ||
Glen A, Gan CS, Hamdy FC, et al. iTRAQ-facilitated proteomic analysis of human prostate cancer cells identifies proteins associated with progression. J Proteome Res. 2008;7:897–907. | ||
Shipitsin M, Small C, Choudhury S, et al. Identification of proteomic biomarkers predicting prostate cancer aggressiveness and lethality despite biopsy-sampling error. Br J Cancer. 2014;111(6):1201–1212. | ||
Everley PA, Krijgsveld J, Zetter BR, Gygi SP. Quantitative cancer proteomics: stable isotope labeling with amino acids in cell culture (SILAC) as a tool for prostate cancer research. Mol Cell Proteomics. 2004;3(7):729–735. | ||
Zhang XM, Shen Y, Xianyu ZQ. [Serum proteomic study of prostate cancer with bone metastasis]. Zhonghua Nan Ke Xue. 2010;16(8):721–725. Chinese. | ||
Sardana G, Marshall J, Diamandis EP. Discovery of candidate tumor markers for prostate cancer via proteomic analysis of cell culture-conditioned medium. Clin Chem. 2007;53(3):429–437. | ||
Saraon P, Musrap N, Cretu D, et al. Proteomic profiling of androgen-independent prostate cancer cell lines reveals a role for protein S during the development of high grade and castration-resistant prostate cancer. J Biol Chem. 2012;287(41):34019–34031. | ||
Song DX, Chen AM, Guo FJ, et al. [Differential proteomic analysis and function study of human prostate carcinoma cells with different osseous metastatic tendency]. Zhonghua Yi Xue Za Zhi. 2008;88(17):1197–1201. Chinese. | ||
Ide H, Yamagishi S, Lu Y, et al. Circulating pigment epithelium-derived factor (PEDF) is associated with pathological grade of prostate cancer. Anticancer Res. 2015;35:1703–1708. | ||
Filleur S, Volz K, Nelius T, et al. Two functional epitopes of pigment epithelial-derived factor block angiogenesis and induce differentiation in prostate cancer. Cancer Res. 2005;65(12):5144–5152. | ||
Jing-jing HE, Yi-jie MAO, Gang XU, et al. Hypermethylation of GSTP1 and DAPK gene in prostate cancer. J Pract Med. 2009;25(9):1362–1364. | ||
Li N, Zoubeidi A, Beraldi E, Gleave ME. GRP78 regulates clusterin stability, retrotranslocation and mitochondrial localization under ER stress in prostate cancer. Oncogene. 2012;32(15):1933–1942. | ||
Hu Q, Tong S, Zhao X, et al. Periostin mediates TGF-β-induced epithelial mesenchymal transition in prostate cancer cells. Cell Physiol Biochem. 2015;36(2):799–809. | ||
Ummanni R, Teller S, Junker H, et al. Altered expression of tumor protein D52 regulates apoptosis and migration of prostate cancer cells. FEBS J. 2008;275(22):5703–5713. | ||
Ayala G, Tuxhorn JA, Wheeler TM, et al. Reactive stroma as a predictor of biochemical-free recurrence in prostate cancer. Clin Cancer Res. 2003;9:4792–4801. | ||
Hai-bin W, Wei-ming M, Pan X, Tian-jia M, Huai-qiang Z. [Differential expressions of HSP60 in docetaxel treatment on advanced hormone-resistant prostate cancer]. J Shandong Univ( Health Sci). 2012;50(8):46–50. Chinese. | ||
Schostak M, Schwall GP, Poznanović S, et al. Annexin A3 in urine: a highly specific noninvasive marker for prostate cancer early detection. J Urol. 2009;181(1):343–353. | ||
Park N, Chun YJ. Auranofin promotes mitochondrial apoptosis by inducing annexin A5 expression and translocation in human prostate cancer cells. J Toxicol Environ Health A. 2014;77(22–24):1467–1476. | ||
Yu L, Shi J, Cheng S, et al. Estrogen promotes prostate cancer cell migration via paracrine release of ENO1 from stromal cells. Mol Endocrinol. 2012;26(9):1521–1530. | ||
Li-yong Z, Kuang-biao Z, Shen-xiu L, Le-ye H. [Vinculin and the androgen receptor in prostate cancer: expressions and correlations]. Natl J Androl. 2010;16(9):794–798. Chinese. | ||
Yip PY, Kench JG, Rasiah KK, et al. Low AZGP1 expression predicts for recurrence in margin-positive, localized prostate cancer. Prostate. 2011;71(15):1638–1645. | ||
Kuchma MH, Kim JH, Muller MT, Arlen PA. Prostate cancer cell surface-associated keratin 8 and its implications for enhanced plasmin activity. Protein J. 2012;31(3):195–205. | ||
Zhu B. Prohibitin and cofilin are intracellular effectors of transforming growth factor beta signaling in human prostate cancer cells. Cancer Res. 2006;66(17):8640–8647. | ||
Kirschenbaum A, Liu XH, Yao S, Leiter A, Levine AC. Prostatic acid phosphatase is expressed in human prostate cancer bone metastases and promotes osteoblast differentiation. Ann N Y Acad Sci. 2011;1237:64–70. | ||
Pootrakul L, Datar RH, Shi SR, et al. Expression of stress response protein Grp78 is associated with the development of castration-resistant prostate cancer. Clin Cancer Res. 2006;12(20):5987–5993. | ||
Ruiz C, Holz DR, Oeggerli M, et al. Amplification and overexpression of vinculin are associated with increased tumour cell proliferation and progression in advanced prostate cancer. J Pathol. 2011;223(4):543–552. | ||
Geary LA, Nash KA, Adisetiyo H, et al. CAF-secreted annexin A1 induces prostate cancer cells to gain stem cell-like features. Mol Cancer Res. 2014;12(4):607–621. | ||
Tingting Q, Gang X, Lili J, Zhihua T. [Preliminary screening of differentially methylated genes in androgen-independent prostate cancer cell line]. Chinese J Cell Biol. 2013;35(1):24–29. Chinese. | ||
Milone MR, Pucci B, Bifulco K, et al. Proteomic analysis of zoledronic-acid resistant prostate cancer cells unveils novel pathways characterizing an invasive phenotype. Oncotarget. 2014;6(7):5324–5341. | ||
Kong L, Schafer G, Bu H, Zhang Y, Klocker H. Lamin A/C protein is overexpressed in tissue-invading prostate cancer and promotes prostate cancer cell growth, migration and invasion through the PI3K/AKT/PTEN pathway. Carcinogenesis. 2012;33(4):751–759. | ||
Zhang W, Mao YQ, Wang H, Yin WJ, Zhu SX, Wang WC. MiR-124 suppresses cell motility and adhesion by targeting talin 1 in prostate cancer cells. Cancer Cell Int. 2015;15(49):1–9. | ||
Kulasingam V, Diamandis E. Strategies for discovering novel cancer biomarkers through utilization of emerging technologies. Nat Clin Pract Oncol. 2008;5(10):588–599. | ||
Wu JP, Huang WB, Zhou H, et al. Intensity of stromal changes is associated with tumor relapse in clinically advanced prostate cancer after castration therapy. Asian J Androl. 2014;16(5):710–714. | ||
Hnia K, Ramspacher C, Vermot J, Laporte J. Desmin in muscle and associated diseases: beyond the structural function. Cell Tissue Res. 2014;360(3):591–608. | ||
Jiang W, Li X, Rao S, et al. Constructing disease-specific gene networks using pair-wise relevance metric: application to colon cancer identifies interleukin 8, desmin and enolase 1 as the central elements. BMC Syst Biol. 2008;2(72):1–15. | ||
Liegl B, Hornick JL, Antonescu CR, Corless CL, Fletcher CD. Rhabdomyosarcomatous differentiation in gastrointestinal stromal tumors after tyrosine kinase inhibitor therapy: a novel form of tumor progression. Am J Surg Pathol. 2009;33(2):218–226. | ||
Li Z, Zhao X, Bai S, et al. Proteomics identification of cyclophilin a as a potential prognostic factor and therapeutic target in endometrial carcinoma. Mol Cell Proteomics. 2008;7(10):1810–1823. | ||
Ma Y, Peng J, Liu W, et al. Proteomics identification of desmin as a potential oncofetal diagnostic and prognostic biomarker in colorectal cancer. Mol Cell Proteomics. 2009;8(8):1878–1890. | ||
Arentz G, Chataway T, Price TJ, et al. Desmin expression in colorectal cancer stroma correlates with advanced stage disease and marks angiogenic microvessels. Clin Proteomics. 2011;8(1):16. | ||
Arnoldussen YJ, Wang L, Saatcioglu F. Regulation of apoptosis by androgens in prostate cancer cells. Methods Mol Biol. 2011;776:349–360. | ||
Mol AJ, Geldof AA, Meijer GA, van der Poel HG, van Moorselaar RJ. New experimental markers for early detection of high-risk prostate cancer: role of cell-cell adhesion and cell migration. J Cancer Res Clin Oncol. 2007;133(10):687–695. | ||
Tsai YS, Lai CL, Lai CH, et al. The role of homeostatic regulation between tumor suppressor DAB2IP and oncogenic Skp2 in prostate cancer growth. Oncotarget. 2014;5(15):6425–6436. | ||
Flourakis M, Prevarskaya N. Insights into Ca2+ homeostasis of advanced prostate cancer cells. Biochim Biophys Acta. 2009;1793(6):1105–1109. | ||
Rowley DR. What might a stromal response mean to prostate cancer progression? Cancer Metastasis Rev. 1999;17:411–419. | ||
Figel S, Gelman IH. Focal adhesion kinase controls prostate cancer progression via intrinsic kinase and scaffolding functions. Anticancer Agents Med Chem. 2011;11:607–616. | ||
Hong Q, Sze CI, Lin SR, et al. Complement C1q activates tumor suppressor WWOX to induce apoptosis in prostate cancer cells. PLoS ONE. 2009;4(6):e5755. | ||
Zeng XJ, Bi XC, Dai QS, Han ZD, Zhong WD. [Effects of PPAR-gamma on the proliferation and glycolysis metabolism of prostate cancer cells]. Natl J Androl. 2012;18(8):692–696. Chinese. | ||
Tahir SA, Yang G, Goltsov A, et al. Caveolin-1-LRP6 signaling module stimulates aerobic glycolysis in prostate cancer. Cancer Res. 2013;73(6):1900–1911. | ||
Ganck D, Corte D, Bruyneel E, Bracke M, Vandekerckhove J, Gettemans J. Down-regulation of myopodin expression reduces invasion and motility of PC-3 prostate cancer cells. Int J Oncol. 2009;34(5):1403–1409. | ||
Stewart DA, Cooper CR, Sikes RA. Changes in extracellular matrix (ECM) and ECM-associated proteins in the metastatic progression of prostate cancer. Reprod Biol Endocrinol. 2004;2(2):1–13. | ||
Li TQ, Teng YL, Zou YG, Yang Y, Li Q, Mao XM. [The highly expressed secreted phosphoprotein 1 gene in prostate cancer metastasis: a microarray-based bioinformatic analysis]. Zhonghua Nan Ke Xue. 2014;20(11):984–990. Chinese. | ||
Spans L, Helsen C, Clinckemalie L, et al. Comparative genomic and transcriptomic analyses of LNCaP and C4–2B prostate cancer cell lines. PLoS ONE. 2014;9(2):e90002. |
 © 2016 The Author(s). This work is published and licensed by Dove Medical Press Limited. The full terms of this license are available at https://www.dovepress.com/terms.php and incorporate the Creative Commons Attribution - Non Commercial (unported, v3.0) License.
By accessing the work you hereby accept the Terms. Non-commercial uses of the work are permitted without any further permission from Dove Medical Press Limited, provided the work is properly attributed. For permission for commercial use of this work, please see paragraphs 4.2 and 5 of our Terms.
© 2016 The Author(s). This work is published and licensed by Dove Medical Press Limited. The full terms of this license are available at https://www.dovepress.com/terms.php and incorporate the Creative Commons Attribution - Non Commercial (unported, v3.0) License.
By accessing the work you hereby accept the Terms. Non-commercial uses of the work are permitted without any further permission from Dove Medical Press Limited, provided the work is properly attributed. For permission for commercial use of this work, please see paragraphs 4.2 and 5 of our Terms.