")
Back to Journals » Cancer Management and Research » Volume 12
Bioinformatics Analysis Identifies a Novel Role of GINS1 Gene in Colorectal Cancer
Authors Bu F, Zhu X , Zhu J , Liu Z, Wu T, Luo C, Lin K, Huang J
Received 27 August 2020
Accepted for publication 15 October 2020
Published 17 November 2020 Volume 2020:12 Pages 11677—11687
DOI https://doi.org/10.2147/CMAR.S279165
Checked for plagiarism Yes
Review by Single anonymous peer review
Peer reviewer comments 2
Editor who approved publication: Dr Eileen O'Reilly
Fanqin Bu,1,2,* Xiaojian Zhu,3,* Jinfeng Zhu,1,2,* Zitao Liu,1,2 Ting Wu,4 Chen Luo,1,2 Kang Lin,1,2 Jun Huang1
1Department of Gastrointestinal Surgery, Second Affiliated Hospital of Nanchang University, Nanchang 330006, Jiangxi Province, People’s Republic of China; 2Jiangxi Medical College of Nanchang University, Nanchang, People’s Republic of China; 3Research Center of The Seventh Affiliated Hospital of Sun Yat-sen University, Shenzhen, People’s Republic of China; 4Department of Infectious Diseases of Guixi Traditional Chinese Medicine Hospital, Yingtan, People’s Republic of China
*These authors contributed equally to this work
Correspondence: Jun Huang Email [email protected]
Background: Colorectal cancer (CRC) is one of the most lethal malignancies and the incidence of CRC has been on the rise. Herein, we aimed to identify effective biomarkers for early diagnosis and treatment of colorectal cancer via bioinformatic tools.
Methods: To identify differentially expressed genes (DEGs) in CRC, we downloaded CRC gene expression data from GSE24514 and GSE110223 datasets in Gene Expression Omnibus (GEO) and employed R to analyze the data. We further performed functional enrichment analysis of the DEGs on the DAVID gene ontology analysis tool. STRING database and Cytoscape visualization tool were employed to construct a PPI (protein–protein interaction) network and establish intensive intervals in the network. Immunohistochemistry, qRT-PCR and Western blotting were performed to identify the expression level of GINS1 in CRC. In vitro and in vivo experiments were performed to assess the impact of GINS1 in the pathogenesis of CRC in terms of proliferation, migration and metastasis.
Results: Among the two datasets, 389 DEGs were identified and used to construct a PPI network. These genes were mainly involved in cell proliferation and cell cycle. Among them, 15 genes including GINS1 were found to be strongly associated with the PPI network. We further performed immunohistochemistry, qRT-PCR and Western blotting to identify that GINS1 expression was higher in CRC than in paired normal tissues. Moreover, in vitro and in vivo experiments demonstrated GINS1 could promote the proliferation, invasion and migration of colorectal cancer cells.
Conclusions: GINS1 could be considered as a potential biomarker for CRC patients.
Keywords: GINS1, colorectal cancer, bioinformatics screening
Introduction
Colorectal cancer (CRC) is one of the most lethal malignancies with high morbidity worldwide.1 Currently, a host of risk factors including obesity, smoking habits and lack of physical exercise have increased the risk of colorectal cancer.2 With the development of surgical techniques, surgical treatment effectively controls early colorectal cancer. However, treatment of patients with advanced colorectal cancer is challenging despite the development of therapies such as laparoscopic surgery, radiation therapy, palliative chemotherapy and immunotherapy.3 Although several biomarkers have been identified for early diagnosis of colorectal cancer, the clinical outcomes and prognosis of colorectal cancer patients are poor.4
Data mining with bioinformatic analysis has become an important research method in cancer. It can reveal the etiology and pathogenesis of CRC and novel biomarkers to monitor the disease progression. Bioinformatic tools have revealed that TIMP1, SERPINE1, CCND1, COL1A2 and SST are biomarkers of CRC which influence the prognosis of CRC patients.5 CircDDX17, a circular RNA, was also been deemed as a tumor suppressor in CRC by bioinformatic analysis.6 The purpose of this study was to identify potential biomarkers for early diagnosis and targeted therapy of colorectal cancer using bioinformatic methods. Results showed that GINS1 (GINS Complex Subunit 1), also named PSF1, is a useful biomarker for CRC and GINS1 expression was correlated with the progression of colorectal cancer.
Materials and Methods
Ethics Approval and Consent to Participate
This study was approved by the Ethics Committee of the Second Affiliated Hospital of Nanchang University (Nanchang, China). All CRC tissues and adjacent normal tissues performed in this study were collected from surgical specimens of CRC patients residing in the Department of gastrointestinal surgery of the second affiliated hospital of Nanchang University. Informed consent was obtained from each patient.
Data Acquisition
GSE24514 and GSE110223 datasets obtained from the Gene Expression Omnibus (GEO) database (http://www.ncbi.nlm.nih.gov/geo/)7 were used to find DEGs between normal samples and CRC. These RNA profiles were both derived from the GPL96 platform. A total of 47 CRC samples and 28 normal samples were analyzed.
Differentially Expressed Genes (DEGs) Identification
The R (limma package) was employed to determine DEGs in non-cancerous and CRC samples. The log2Fold Change and adjusted p-value (adj. p-value) were utilized to assess the presence of significant genes and false-positives. Adj. p-value <0.01 and |log2Fold Change|>1 were set as the threshold for statistical significance. For genes with multiple probe sets, average values were used and the probe sets lacking gene symbols were removed. The ggplot2 package was used to create volcano plots.8 DEGs at the intersection of GSE24514 and GSE110223 datasets were used for further analysis.
Functional and Pathway Characterization of the DEGs
Database for Annotation, Visualization and Integrated Discovery (DAVID) is a tool widely used for gene functional classification, annotation and ID conversion.9 It was employed to perform functional enrichment analysis in terms of biological process (BP), cell component (CC), molecular function (MF) and Kyoto encyclopedia of genes and genomes (KEGG) for the DEGs.
Establishment of a PPI Network and Module Analysis
To determine the central genes, a PPI network of the DEGs was constructed using the STRING database.10 The association between genes was visualized with the Cytoscape software.11 The Cytoscape tool contains a plug-in Molecular Complex Detection (MCODE) (version 1.4.2) which enables users to cluster some networks on the basis of the topology to reveal the densely connected regions. After establishment of the PPI network, MCODE is used to reveal the most important modules of the network.
Expression Profile and Prognostic Value of GINS1
To uncover the expression profile and prognostic value of GINS1 in cancers, the Gene Expression Profiling Interactive Analysis (GEPIA) was used to determine the expression profile of GINS1 in 33 common cancer types including colon adenocarcinoma (COAD) and rectum adenocarcinoma (READ). GEPIA is a multifunctional genomics analysis platform based on TCGA and GTEx data which contains 275 COAD samples, 349 normal colon samples, 92 READ samples and 318 normal rectal samples altogether.12 The purpose of this process was to identify the mRNA expression of GINS1 in CRC from another platform once filtered from GSE24514 and GSE110223 as a DEG. The results of p-value were generated by Student’s t-test. We further analyzed the correlation between GINS1 expression with prognosis in different cancers. Based on the median expression values of GINS1, the patients were separately divided into high/low expression groups to compare the overall survival (OS) and disease-free survival (RFS) difference. The results of p-value, hazard ratio (HR) and 95% confidence interval were listed in each picture.
Genetic Alteration Analysis
We employed STRING database to obtain 10 most closely co-expressed genes of GINS1. Subsequently, we analyze the genetic alteration status of the 11 genes including alteration rates and alteration categories in colorectal cancer on cBioportal platform.13
Tissue Harvesting
In 2019, 76 samples were obtained from CRC patients diagnosed and histologically confirmed in the gastrointestinal surgery of the Second Affiliated Hospital of Nanchang University. Peripheral cancer-free tissues (cut more than 5 cm from the edge of the tumor) were also harvested. None of the patients received preoperative adjuvant therapy. After operation, tissue samples were resected and immediately thawed in liquid nitrogen at −80 °C freezer for RNA isolation. All human specimens were obtained with consent from patients and hospital committee.
Cell
SW480, HCT116, HT29, LoVo cells and the normal colorectal organelle NCM460 cell line (from Chinese Academy of Sciences (Shanghai, China)) were cultured in RPMI 1640 medium containing 10% FBS (Gibco, Carlsbad, CA, USA) at 37 °C, 5% CO2.
Western Blotting
Total protein was extracted from cells and tissues with RIPA lysate. The concentration of the protein was determined by BCA assay. The protein samples were mixed with protein buffer and boiled for 10 minutes in hot water. Equal amount of proteins from SW480, HCT116, HT29, LoVo and NCM460 cell lines separated by 10% gel electrophoresis, and then transferred to a vinylidene fluoride film membrane. The membrane was blocked with 5% skim milk powder for 2 hours and incubated with primary antibody against GINS1 (1:10,000; Abcam) at 4 °C overnight. This was followed by incubation with goat anti-rabbit immunoglobulin G antibody for 90 minutes at room temperature (RT). GAPDH served as the house-keeping gene. The blots were detected using ECL (Millipore) and developed by X-ray film. Because the experimental results of HCT116 and SW480 cell lines were the most significant, the above assay was repeated for HCT116, SW480 and NCM460 cell lines.
Immunohistochemistry
Colorectal cancer and surrounding tissues (76 cases each) were collected from the second affiliated Hospital of Nanchang University. They were fixed in neutral buffered formalin and then embedded in paraffin. The sections were dewaxed, rehydrated, and heated to retrieve antigens and sealed with normal goat serum for 15 minutes. The slides were incubated with rabbit polyclonal antibody (Invitrogen, PA5-62,341) against GINS1 at 4 °C overnight, rinsed with phosphate buffer (PBS) 5 times, and then incubated with horseradish peroxidase-labeled second antibody at room temperature for 30 minutes. After washing with PBS, it was dyed with chromogenic agent.
Quantitative Real-Time PCR
We used TRIzol reagent (Invitrogen) to extract total RNA from CRC tissues and paired normal tissues then test the concentration and purity of the extracted RNA. After passing the test, we use Prime Script RT Reagent kit (TaKaRa, Japan) to perform reverse transcription, we further set up the program according to the amplification steps in the SYBR Premix Ex Taq II kit (TaKaRa, Japan) manual, and perform real-time fluorescent quantitative PCR on the 7500 Model Real-Time PCR instrument (Applied Biosystems, CA, USA). The primer sequences for GAPDH (used as the reference gene) were: 5ʹ-CAAGGTCATCCATGACAACTTTG-3ʹ (forward) and 5ʹ-GTCCA CCACCCTGTTGCTGTAG-3ʹ (reverse). The sequences for GINS1 were: 5ʹ-TTCCCTGAGATTCAGATTGACTG-3ʹ (forward) and 5ʹ-GGTCATAGACCAAAGTATAAAGC-3ʹ (reverse). Each test was performed at least thrice and the final result was the average of all repeats.
Cell Transfection
About 1 × 10⁵ HCT116 or SW480 cells were seeded in 6-well plates and transfected after 24 hours. Two sequences were used for GINS1 knockdown: sh-GINS1-1, 5ʹ-GACACTGTTCTCTGTTAAGAA-3ʹ and sh-GINS1-2,5ʹCAGACAAGTTCTGGAGGAGAT-3ʹ; and one sequence for GINS1 overexpression: 5ʹ-CGGGGTACCATGTTCTGCGAAAAAGCCATGGAAC-3ʹ. Lipofectamine 3000 was used to enhance transfection (Invitrogen, Carlsbad, CA, USA). After 48 hours of transfection, RNA or protein were isolated from the cells. Transfection efficiency was determined by Western blotting and qRT-PCR assays.
Cell Proliferation Assay
Cell proliferation was determined using the Cell Counting Kit-8 (CCK-8) assay. SW480 and HCT116 cells were treated with trypsin-EDTA reagent and counted with an automated cell counter. Next, they were seeded in 96-well plates, at 5000 cells/well. After 24 hours, cells were transfected with GINS1 mimics or control mimics and cultivated for 6, 12, 24, 48 or 72 hours. Thereafter, the 10 μL CCK-8 solution was added to the cells followed by incubation for at 37 °C for 2 hours. A microplate luminometer was utilized to measure optical density at 450 nm. Colony formation assay was carried out to examine the ability of transfected HCT116 and SW480 cells to form colonies and proliferate. After a 48-hour transfection, cells were cultured in 6-well plates (300 cells/well). The capacity of cells to form colonies was determined by culturing them with a medium supplemented with 10% FBS for 12 days. Finally, the colonies were fixed in methanol and treated with 0.05% Crystal Violet (Beyotime) and counted.
Transwell Invasion and Migration Assay
A transwell chamber (polycarbonate membrane, 6.5 mm diameter, 8 μm diameter) (Corning Costar, USA) was utilized to determine the migration ability of cells. After 48 hours of transfection, cells were bated in an FBS-free medium and then added to the upper chamber. The lower chamber was filled with RPMI 1640 medium comprising 10% FBS as a chemoattractant. The cells were incubated for 48 hours after which unmigrated cells on the upper chamber were harvested, and those that migrated and invaded the lower chamber were collected from the lower chamber. The cells were fixed in methanol followed by 0.1% crystal violet staining and counted under an inverted microscope. The invasion assay was assessed using a similar procedure except that the insert was pre-coated with a matrix gel and the amounts of cells added in the upper chamber was five times that of the former one.
Measurement of Tumor Growth and Metastasis in vivo
Animal experiments were approved by Ethics Commitment of the Second Affiliated Hospital of Nanchang University (Nanchang, China) and strictly followed the animal care and use guidelines of the National Institutes of Health for standardized operation. Xenotransplantation experiments were preformed using 6- to 8-week-old nude mice, in which 1 × 10⁶ sw480 cells treated with different agents were injected into the subrenal capsule of nude mice. After 6 weeks of treatment, the mice were sacrificed, and tumors were collected for subsequent experiments.
Statistical Analysis
All experiments were repeated thrice and data were analyzed with Statistical Package for the Social Sciences (SPSS 24.0). We used a threshold p-value <0.05 as statistically significant.
Results
Identification of DEGs
A total of 788 DEGs were identified in GSE24514 (Figure 1A) and 604 DEGs in GSE110223 (Figure 1B) in colorectal cancer. Subsequently, we depicted a Venn diagram to show the overlapped DEGs between the two datasets (Figure 1C).
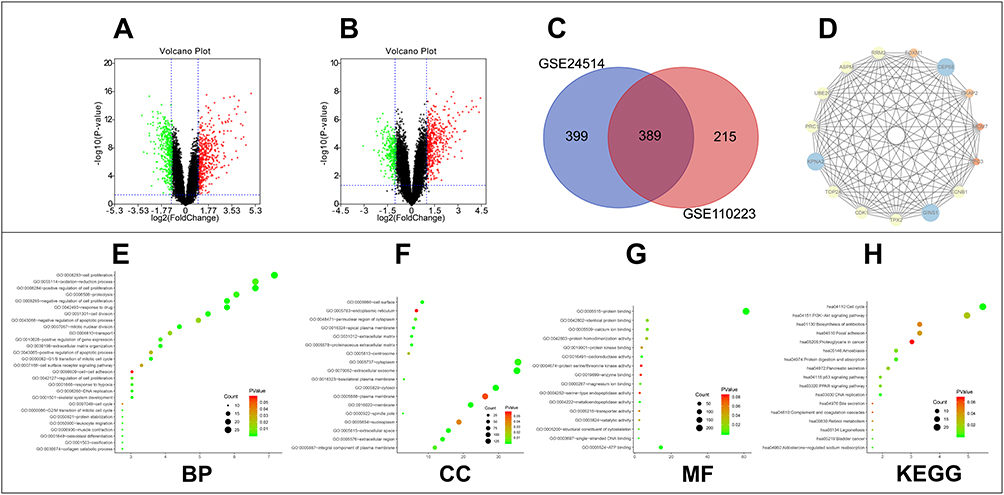 |
Figure 1 Screen and classify the DEGs in colorectal cancer. (A) DEGs were selected with the threshold of FDR-P<0.01 and |log2Fold Change|>1 among the GSE24514 dataset. (B) DEGs were selected with the threshold of FDR-P<0.01 and |log2Fold Change|>1 among the GSE110223 dataset. (C) GSE24514 and GSE110223 datasets showed an overlap of 389 genes. (D) The densest area in the PPI network. (E–H) Functional enrichment analysis including BP, CC, MF and KEGG of the 389 DEGs. |
GO and KEGG Pathway Analyses for DEGs
DAVID database was used to determine the functions and pathways associated with the genes. The GO analyses showed that the biological processes (BP) of the DEGs were mainly involved in cell proliferation, oxidation-reduction process, proteolysis and cell division (Figure 1E). For the cell component (CC) category, the DEGs played a role in extracellular exosome, cytoplasm and cytosol (Figure 1F). In the molecular function (MF) category, the DEGs were involved in protein binding, ATP binding and identical protein binding (Figure 1G). KEGG pathway analysis showed that the DEGs were enriched in cell cycle, PI3K-Akt pathway and biosynthesis of antibiotics (Figure 1H).
Analysis of the PPI Network and Construction of Hub Module
A PPI network was constructed for the entire DEGs using the STRING database and the network was visualized by Cytoscape software. The densest area of the module was identified by the MCODE score for further study (Figure 1D). This module contains 15 genes which are GINS1, TPX2, CDK1, TOP2A, KPNA2, PRC1, UBE2C, ASPM, RRM2, FOXM1, CEP55, CKAP2, MCM7, RFC3 and CCNB1.
Analysis of GINS1
Among the 15 genes in our module, GINS1 has not been sufficiently studied in CRC. We therefore aimed to determine whether GINS1 expression affected the development of CRC. Results from GEPIA revealed that GINS1 was overexpressed in 20 cancer types (Figure 2A) including COAD (colon adenocarcinoma) and READ (rectal adenocarcinoma) than paired normal tissues (Figure 3A). Overexpression of GINS1 was significantly correlated with poor OS and RFS of ACC (adrenocortical carcinoma), KIRP (kidney renal papillary cell carcinoma), LIHC (liver hepatocellular carcinoma) and SARC (sarcoma) patients (Figure 2B–I). The 10 most closely related co-expressed genes of GINS1 were GINS2, GINS3, GINS4, MCM2, MCM3, MCM4, MCM5, MCM6, MCM7 and CDC45 (Figure 3B). Previous reports found that these genes formed the CMG (CDC45–MCM–GINS) complex, which is the core of eukaryotic chromosome replication, the absence of any one of these components will affect eukaryotic chromosome replication.14 Analysis of genetic alterations of the 11 genes revealed that almost a half (260 of 524) of the samples had genetic alterations of at least one gene in CRC, the most common alteration category was mRNA high, and GINS1 had the highest alteration rate (20%) among the selected genes (Figure 3C and D).
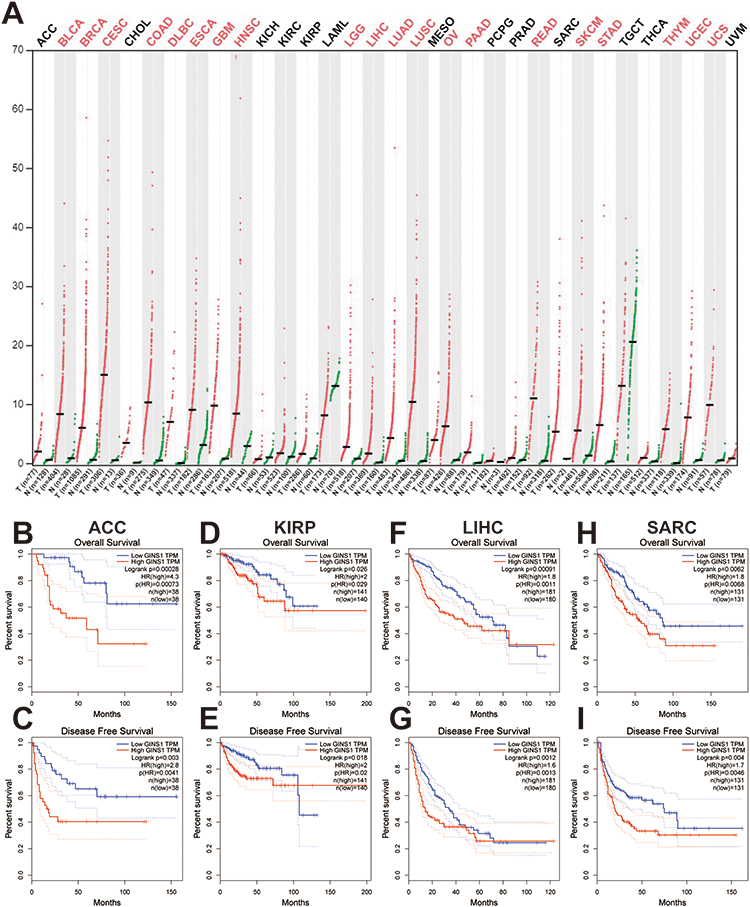 |
Figure 2 Expression profile and prognostic value of GINS1 in diverse cancers. (A) GINS1 expression in cancers. Expression profile of GINS1 in 33 cancer types compared with adjacent normal tissues by GEPIA. Results revealed that GINS1 was overexpressed in 20 cancer types. T: tumor; N: normal; n: number of patients. (B–I) Upregulation of GINS1 was correlated with poor overall survival and disease-free survival of patients with ACC, KIRP, LIHC, SARC. |
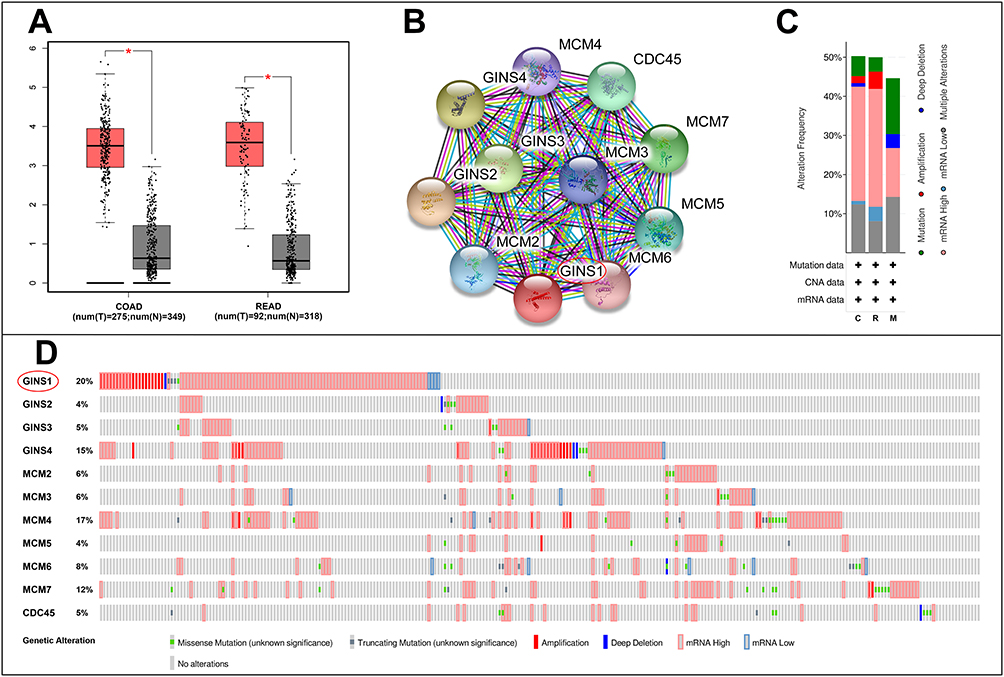 |
Figure 3 Analysis of GINS1 in colorectal cancer. (A) GINS1 was overexpressed in colon adenocarcinoma and rectum adenocarcinoma than in paired normal tissues. *p-value <0.05. (B) Obtain 10 strongly associated co-expressed genes of GINS1 by STRING. (C–D) Genetic alterations of GINS1 and its co-expressed genes in CRC, GINS1 was circled in the picture. |
GINS1 is Highly Expressed in CRC
Western blotting assay showed that GINS1 expression was highest in HCT116 and SW480 cells lines (Figure 4D), and thus these cell lines were used in subsequent experiments. The protein level of GINS1 in CRC tissues was higher than adjacent normal tissues (Figure 4C). mRNA levels of GINS1 were also higher in CRC than in adjacent normal tissues (Figure 4B). Immunohistochemistry also showed the protein level of GINS1 was upregulated in CRC tissues (Figure 4A). Results of Western blot and qRT-PCR analyses for the transfected SW480 and HCT116 cells are shown in (Figure 5).
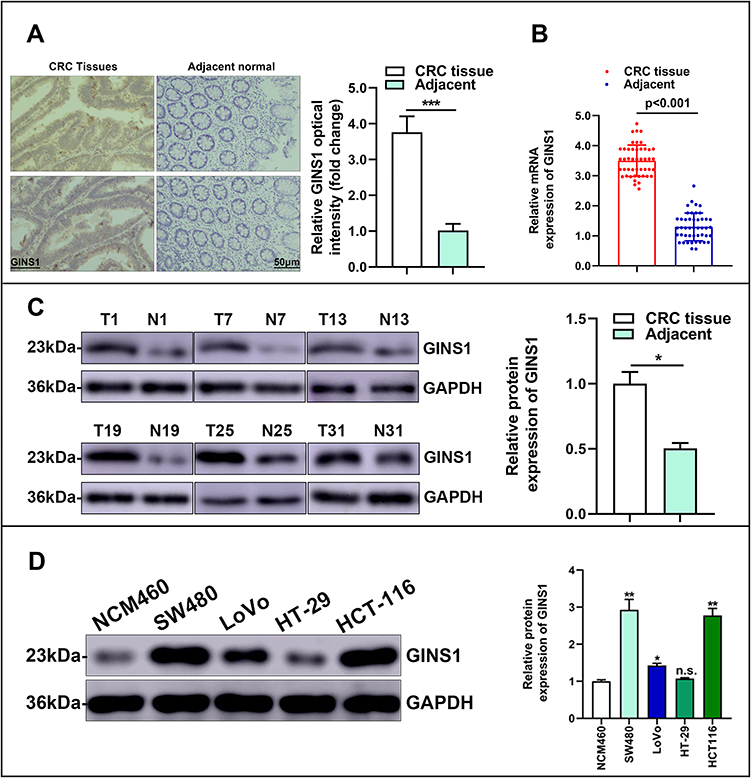 |
Figure 4 GINS1 was overexpressed in colorectal cancer. (A) Staining of GINS1 in colorectal cancer tissues and paired normal tissues by immunohistochemistry. ***p-value <0.001. (B) Relative expression level of GINS1 in 76 paired human colorectal cancer tissues (T) and the corresponding non-tumor tissues samples (N) are quantified by qRT-PCR. (C) The representative images of protein expression level of GINS1 in colorectal cancer tissues (T) and paired normal tissues (N) by Western blotting. * p-value <0.05. (D) The representative images of protein expression level of GINS1 in different colorectal cancer cell lines and normal colorectal organelle NCM460 cell line by Western blotting. *p-value <0.05, **p-value <0.01. |
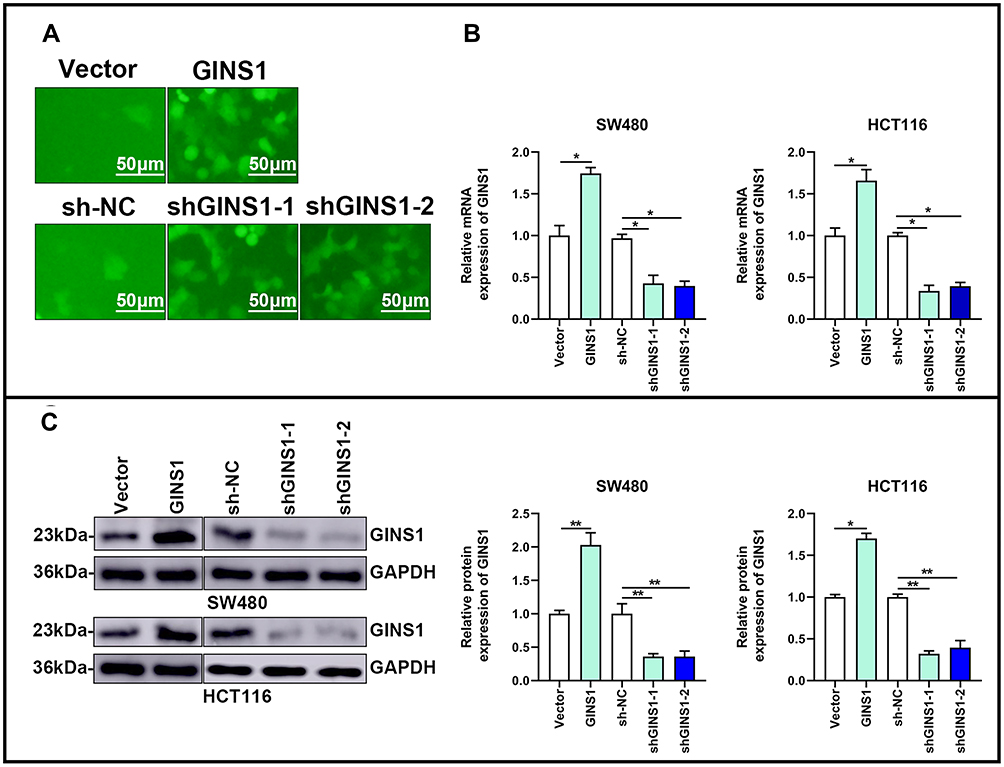 |
Figure 5 Overexpression and knockdown of GINS1 in CRC cells. (A) Representative transfected images of SW480 and HCT116 cells. (B and C) Transfection efficiency was validated by qRT-PCR and Western blotting. *p-value <0.05, **p-value <0.01. |
Effect of GINS1 on Cell Proliferation
To explore the impact of GINS1 on CRC proliferation, stably transfected CRC cells were used. GINS1 knockdown decreased the proliferation of cells relative to the control groups. Opposite results were obtained when GINS1 was overexpressed (Figure 6B). The colony formation assay demonstrated that the rate of colony formation decreased after GINS1 knockdown in HCT116 or SW480 cells, whereas GINS1 overexpression promoted cell proliferation (Figure 6A). In summary, our results show that GINS1 promoted the proliferation potential of CRC cells. In vivo experiments revealed that overexpression of GINS1 enhanced the tumor weight (Figure 6C).
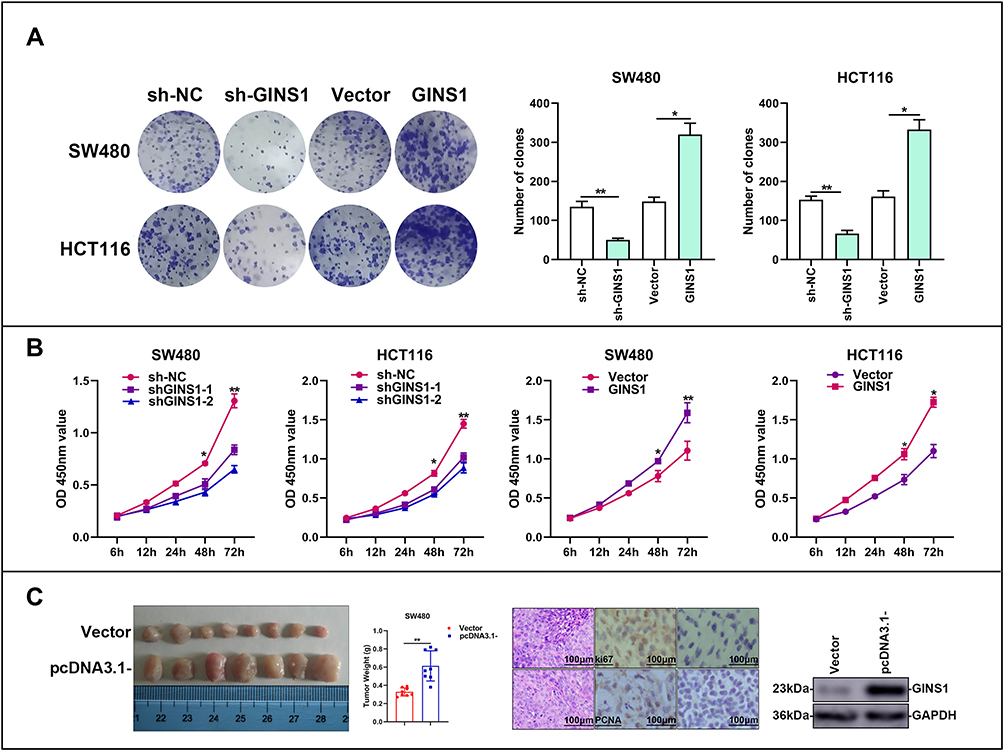 |
Figure 6 In vitro and in vivo experiments demonstrated GINS1 could promote proliferation of CRC cells. (A) Effects of overexpression and knockdown of GINS1 on the formation of colonies in SW480 and HCT116 cell lines. *p-value <0.05, **p-value <0.01. (B) CCK8 results showed that down-regulation of GINS1 reduced the growth of CRC cells, up-regulation of GINS1 promoted the growth of CRC cells. *p-value <0.05, **p-value <0.01. (C) Up-regulation of GINS1 enhanced tumor weight in vivo. **p-value <0.01. |
Effect of GINS1 on Cell Invasion and Migration
Results of Transwell assays revealed that knockdown of GINS1 in SW480 and HCT116 cells decreased the migratory and invasive ability of CRC cells whereas overexpression of GINS1 produced opposite results (Figure 7A and B). These results indicated that GINS1 promoted invasion and migration of CRC cells thereby enhancing CRC progression. In vivo experiments also revealed that the upregulation of GINS1 promoted metastasis in the liver of CRC cells (Figure 7C–F).
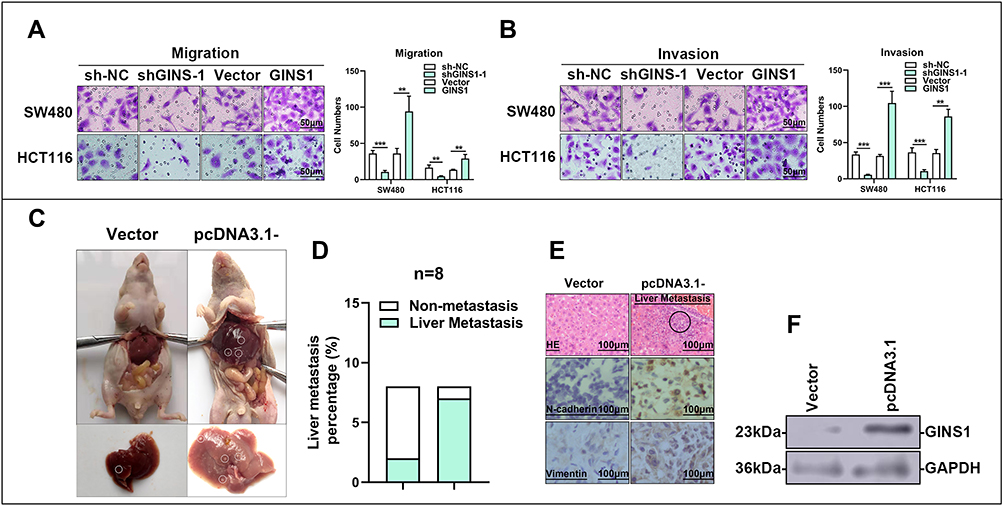 |
Figure 7 In vitro and in vivo experiments demonstrated GINS1 could promote invasion and migration of CRC cells. (A and B) Transwell test demonstrated knockdown of GINS1 decreased CRC cell invasion and migration abilities, whereas over-expression of GINS1 produced opposite effect. **p-value <0.01, ***p-value <0.001. (C–F) In vivo experiments demonstrated GINS1 promoted metastasis of CRC cells to liver, the metastasis parts are circled in subfigure (C and E). |
Discussion
Advanced colorectal cancer is hard to treat with available treatment modalities. Therefore, it is important to identify new biomarkers for early diagnosis and targeted therapy of colorectal cancer. The purpose of this research was to identify original hub genes that drive the pathogenesis of colorectal cancer using bioinformatics tools. Initially, 389 DEGs were identified in normal and CRC tissues based on data from GSE24514 and GSE110223 datasets. Subsequently, a PPI network was established to reveal interactions among the DEGs and reveal the densest collections. Results showed that one core gene, GINS1, has not been studied in CRC. GINS1 is a member of the GINS complex. The main domain of GINS1 contains an alpha-helical bundle-like structure which is essential for DNA replication.15 We uncovered that GINS1 was overexpressed in 20 cancer categories including colorectal cancer and the upregulation of GINS1 was correlated with poor prognosis of patients in adrenocortical carcinoma, kidney renal papillary cell carcinoma, liver hepatocellular carcinoma and sarcoma. These findings demonstrated the important role of GINS1 in cancer development. Previous researchers reported that GINS1 was overexpressed in lung cancer and GINS1 depletion affected proliferation and cell cycle arrest in lung cancer cells.16 Nakahara has demonstrated that GINS1 is highly expressed in breast cancer tissues, which is a function of increased activity of the GINS1 promoter. Meantime, the down-regulation of GINS1 inhibits anchor-independent growth of breast cancer cells.17 Elsewhere, it was found that GINS1 was strongly associated with clinical factors of prostate cancer such as tumor grade and stage. Its expression correlated with poor overall survival and progression-free survival in prostate cancer patients.18 However, the impact of GINS1 in the pathogenesis of CRC is not well defined. Herein, we performed cell experiments in vivo and in vitro to determine GINS1 expression with the progression of CRC. Not only the data from online databases showed GINS1 was overexpressed in colorectal cancer. Moreover, qRT-PCR assay, Western blot and immunocytochemistry tests confirmed the mRNA expression and protein level in colorectal cancer tissues and colorectal cancer cell lines were higher. Furthermore, overexpression of GINS1 in HCT116 and SW480 cells increased the proliferation, invasion and migration of CRC cells. In vivo, the upregulation of GINS1 resulted in larger tumor weight and liver metastasis.
Analysis of co-expression revealed that the 10 most closely related co-expressed genes of GINS1 were GINS2, GINS3, GINS4, MCM2, MCM3, MCM4, MCM5, MCM6, MCM7 and CDC45. Previous studies have reported that these genes formed the CMG (CDC45–MCM–GINS) complex which is the core of eukaryotic chromosome replication.15 The interaction between MCM and several key replication factors is mediated by the GINS complex. The GINS complex binds to the MCM2-7 complex and CDC45 to activate helicases that maintain eukaryotic microchromosome.15,19 CDC45 and GINS families participated in the activation of helicase. For instance, the GINS complex allows MCM helicases to interact with key regulatory proteins in complexes (RPCs) in large replicas.20,21 We suspect that the role of GINS1 in the pathogenesis of colorectal cancer is related to the members of the CMG complex. Genes involved in the CMG complex were reported to influence the progression of colorectal cancer. The expression of MCM2 affects several clinical factors in CRC such as the histological grade of tumor, nodular metastasis, malignant degree of adenoma, and vascular invasion.22 The expression pattern of GINS4 correlated with clinical factors in CRC such as TNM stage, advanced T stage and poor differentiation. Moreover, GINS4 overexpression associated with poor prognosis of CRC patients, whereas downregulation of GINS4 inhibited growth and cell cycle in vitro, accelerated apoptosis, and suppressed tumorigenesis in vivo.23 Xiaoli reported that GINS3 expression was higher in CRC than in adjacent normal tissues based on qRT-PCR experiments of 137 consecutive samples. The study also revealed that GINS3 expression was correlated with poor overall survival and disease-free survival of CRC patients. A cox regression model constructed proved that GINS3 was an independent prognostic factor of CRC.24 A study by Yumi Nagahama further proved that GINS3 expression was correlated with tumor grade and the knockdown of GINS3 in CRC cell lines inhibited cell growth, especially in S-phase progression.25
In our study, using bioinformatic methods and molecular experiments, we observed that GINS1 was overexpressed in CRC and we further demonstrated that GINS1 expression was associated with proliferation, invasion and migration of CRC cells. In conclusion, our results indicate that GINS1 is a new biomarker of colorectal cancer. Nevertheless, further experiments are required to prove whether the role of GINS1 in the pathogenesis of CRC involves other members of the CMG complex.
Abbreviations
ACC, adrenocortical carcinoma; BP, biological process; CC, cell component; COAD, colon adenocarcinoma; CRC, colorectal cancer; DEG, differentially expressed gene; HR, hazard ratio; KEGG, Kyoto Encyclopedia of Genes and Genomes; KIRP, kidney renal papillary cell carcinoma; LIHC, liver hepatocellular carcinoma; MF, molecular function; OS, overall survival; PBS, phosphate buffer; PPI, protein–protein interaction; READ, rectum adenocarcinoma; RFS, disease-free survival; SARC, sarcoma.
Data Sharing Statement
The data downloaded from the GEO database are available in this study.
Ethics Approval and Consent to Participate
This study was approved by the Ethics Committee of the Second Affiliated Hospital of Nanchang University (Nanchang, China). This study complied with the Declaration of Helsinki. Informed consent was obtained from each patient.
Funding
This work was supported by Jiangxi Key Research and Development Plan Project of Jun Huang (No. 20181BBG70019) and National Natural Science Foundation of Jun Huang (No. 82060445).
Disclosure
The authors declare that they have no conflicts of interest.
References
1. Ladabaum U, Dominitz JA, Kahi C, Schoen RE. Strategies for colorectal cancer screening. Gastroenterology. 2020;158(2):
2. Dekker E, Tanis PJ, Vleugels JLA, Kasi PM, Wallace MB. Colorectal cancer. Lancet. 2019;394(10207):
3. Brenner H, Kloor M, Pox CP. Colorectal cancer. Lancet. 2014;383(9927):1490–1502. doi:10.1016/S0140-6736(13)61649-9
4. Guo Y, Bao Y, Ma M, Yang W. Identification of key candidate genes and pathways in colorectal cancer by integrated bioinformatical analysis. Int J Mol Sci. 2017;18(4):722. doi:10.3390/ijms18040722.
5. Han B, Feng D, Yu X, Zhang Y, Liu Y, Zhou L. Identification and interaction analysis of molecular markers in colorectal cancer by integrated bioinformatics analysis. Med Sci Monit. 2018;24:
6. Li XN, Wang ZJ, Ye CX, Zhao BC, Li ZL, Yang Y. RNA sequencing reveals the expression profiles of circRNA and indicates that circDDX17 acts as a tumor suppressor in colorectal cancer. J Exp Clin Cancer Res. 2018;37(1):325. doi:10.1186/s13046-018-1006-x.
7. Edgar R, Domrachev M, Lash AE. Gene expression omnibus: NCBI gene expression and hybridization array data repository. Nucleic Acids Res. 2002;30(1):207–210. doi:10.1093/nar/30.1.207
8. Villanueva RAM, Chen ZJ. ggplot2: elegant graphics for data analysis (2nd ed.). Measurement. 2019;17:160–167.
9. Huang DW, Sherman BT, Tan Q, et al. DAVID bioinformatics resources: expanded annotation database and novel algorithms to better extract biology from large gene lists. Nucleic Acids Res. 2007;35(suppl_2):W169–75.
10. Szklarczyk D, Morris JH, Cook H, et al. The STRING database in 2017: quality-controlled protein-protein association networks, made broadly accessible. Nucleic Acids Res. 2017;45(D1):D362–D368. doi:10.1093/nar/gkw937
11. Smoot ME, Ono K, Ruscheinski J, Wang PL, Ideker T. Cytoscape 2.8: new features for data integration and network visualization. Bioinformatics. 2011;27(3):431–432. doi:10.1093/bioinformatics/btq675
12. Tang Z, Li C, Kang B, Gao G, Li C, Zhang Z. GEPIA: a web server for cancer and normal gene expression profiling and interactive analyses. Nucleic Acids Res. 2017;45(W1):W98–W102. doi:10.1093/nar/gkx247.
13. Gao J, Aksoy BA, Dogrusoz U, et al. Integrative analysis of complex cancer genomics and clinical profiles using the cBioPortal. Sci Signal. 2013;6(269):pl1. doi:10.1126/scisignal.2004088.
14. Onesti S, MacNeill SA. Structure and evolutionary origins of the CMG complex. Chromosoma. 2013;122(1–2):47–53. doi:10.1007/s00412-013-0397-x.
15. Chang YP, Wang G, Bermudez V, Hurwitz J, Chen XS. Crystal structure of the GINS complex and functional insights into its role in DNA replication. Proc Natl Acad Sci U S A. 2007;104(31):12685–12690. doi:10.1073/pnas.0705558104.
16. Zhang J, Wu Q, Wang Z, et al. Knockdown of PSF1 expression inhibits cell proliferation in lung cancer cells in vitro. Tumour Biol. 2015;36(3):
17. Nakahara I, Miyamoto M, Shibata T, et al. Up-regulation of PSF1 promotes the growth of breast cancer cells. Genes Cells. 2010;15(10):
18. Tahara H, Naito H, Kise K, et al. Evaluation of PSF1 as a prognostic biomarker for prostate cancer. Prostate Cancer Prostatic Dis. 2015;18(1):
19. Bruck I, Kaplan DL. GINS and Sld3 compete with one another for Mcm2-7 and Cdc45 binding. J Biol Chem. 2011;286(16):14157–14167. doi:10.1074/jbc.M111.218305
20. Takahashi TS, Wigley DB, Walter JC. Pumps, paradoxes and ploughshares: mechanism of the MCM2–7 DNA helicase. Trends Biochem Sci. 2005;30(8):437–444. doi:10.1016/j.tibs.2005.06.007
21. Gambus A, Jones RC, Sanchez-Diaz A, et al. GINS maintains association of Cdc45 with MCM in replisome progression complexes at eukaryotic DNA replication forks. Nat Cell Biol. 2006;8(4):358–366. doi:10.1038/ncb1382
22. Giaginis C, Georgiadou M, Dimakopoulou K, et al. Clinical significance of MCM-2 and MCM-5 expression in colon cancer: association with clinicopathological parameters and tumor proliferative capacity. Dig Dis Sci. 2009;54(2):
23. Rong Z, Luo Z, Zhang J, et al. GINS complex subunit 4, a prognostic biomarker and reversely mediated by Krüppel-like factor 4, promotes the growth of colorectal cancer. Cancer Sci. 2020;111(4):
24. Sun X, Sui W, Huang M, Wang Y, Xuan Y, Wang Z. Partner of Sld five 3: a potential prognostic biomarker for colorectal cancer. Diagn Pathol. 2014;9(1):217. doi:10.1186/s13000-014-0217-5.
25. Nagahama Y, Ueno M, Haraguchi N, Mori M, Takakura N. PSF3 marks malignant colon cancer and has a role in cancer cell proliferation. Biochem Biophys Res Commun. 2010;392(2):
 © 2020 The Author(s). This work is published and licensed by Dove Medical Press Limited. The full terms of this license are available at https://www.dovepress.com/terms.php and incorporate the Creative Commons Attribution - Non Commercial (unported, v3.0) License.
By accessing the work you hereby accept the Terms. Non-commercial uses of the work are permitted without any further permission from Dove Medical Press Limited, provided the work is properly attributed. For permission for commercial use of this work, please see paragraphs 4.2 and 5 of our Terms.
© 2020 The Author(s). This work is published and licensed by Dove Medical Press Limited. The full terms of this license are available at https://www.dovepress.com/terms.php and incorporate the Creative Commons Attribution - Non Commercial (unported, v3.0) License.
By accessing the work you hereby accept the Terms. Non-commercial uses of the work are permitted without any further permission from Dove Medical Press Limited, provided the work is properly attributed. For permission for commercial use of this work, please see paragraphs 4.2 and 5 of our Terms.