")
Back to Journals » OncoTargets and Therapy » Volume 14
Bioinformatics Analyses Indicate That Cathepsin G (CTSG) is a Potential Immune-Related Biomarker in Oral Squamous Cell Carcinoma (OSCC)
Authors Huang G, Wu Q , Zheng Z, Shao T, Li F, Lu X, Ye H, Chen G, Song Y, Zeng W, Ai Y, Lv X
Received 20 November 2020
Accepted for publication 18 January 2021
Published 25 February 2021 Volume 2021:14 Pages 1275—1289
DOI https://doi.org/10.2147/OTT.S293148
Checked for plagiarism Yes
Review by Single anonymous peer review
Peer reviewer comments 2
Editor who approved publication: Dr Sanjeev K. Srivastava
Guang-zhao Huang,1,* Qing-qing Wu,1,* Ze-nan Zheng,1,* Ting-ru Shao,1 Fei Li,1 Xin-yan Lu,1 Heng-yu Ye,1 Gao-xiang Chen,1 Yu-xing Song,1 Wei-sen Zeng,2 Yi-long Ai,3 Xiao-zhi Lv1
1Department of Oral & Maxillofacial Surgery, NanFang Hospital, Southern Medical University, Guangzhou, Guangdong Province, People’s Republic of China; 2Department of Cell Biology, School of Basic Medical Science, Southern Medical University, Guangzhou, Guangdong Province, People’s Republic of China; 3Foshan Stomatological Hospital, School of Stomatology and Medicine, Foshan University, Foshan, Guangdong Province, People’s Republic of China
*These authors contributed equally to this work
Correspondence: Xiao-zhi Lv
Department of Oral & Maxillofacial Surgery, NanFang Hospital, Southern Medical University, Baiyun District, Guangzhou, Guangdong Province, 510080, People’s Republic of China
Tel +86 13724811658
Email [email protected]
Yi-long Ai
Foshan Stomatological Hospital, School of Stomatology and Medicine, Foshan University, Chancheng District, Foshan, Guangdong Province, 528000, People’s Republic of China
Tel +86 13827755774
Email [email protected]
Purpose: Plenty of studies showed that the immune system was associated with cancer initiation and progression. This study aimed to explore the prognostic biomarkers from immune-related genes (IRGs) in oral squamous cell carcinoma (OSCC).
Materials and Methods: RNA-seq data were downloaded from The Cancer Genome Atlas (TCGA) and IRGs and transcription factors (TFs) were extracted. Then, the co-expression network between IRGs and TFs was constructed using the “WGCNA” package in R software. Furthermore, a gene expression signature according to IRGs was constructed to predict OSCC prognosis and its accuracy was validated by survival analysis. Subsequently, correlation analyses between risk-score and immune cells level and clinical parameters were performed. Finally, immune-related biomarkers were selected and further investigated using gain-of-function assays in vitro.
Results: A total of 32 normal cases and 317 OSCC cases were selected in our study. Differentially-expressed analysis indicated that there were 381 differentially-expressed IRGs and 62 TFs in OSCC. Among them, 25 TFs and 21 IRGs were enrolled in the co-expression network. Furthermore, we found that gene expression signature on the basis of 10 IRGs could predict the prognosis accurately and a high-risk score based on gene expression signature meant a high T classification, terminal clinical stage, and low immune cells level in OSCC. Finally, cathepsin G (CTSG) was identified as a potential immune-related biomarker and therapeutic target in OSCC.
Conclusion: In conclusion, IRGs were directly involved in the development and progression of OSCC. Furthermore, CTSG was identified as a potential independent biomarker and might be an immunotherapeutic target in OSCC treatment.
Keywords: oral squamous cell carcinoma, immune, biomarker, bioinformatics, CTSG
Introduction
About 2.7*105 new oral squamous cell carcinoma (OSCC) cases were reported every year,1 OSCC is one of the most common cancers all over the world. A majority of OSCC lesions develop from potentially malignant disorders, and are characterized by invasion, distant metastases, high recurrence rate, and undesirable prognosis.2 The most common risk factors include smoking, alcohol, and betel nut consumption.3 For the past few years, therapeutic methods of OSCC, including operative treatment, radiotherapy and chemotherapy, have made great progress. However, the postoperative 5-year overall survival rate is only 50%4 owing to lymph node metastases, distant metastases, and terminal-staged diagnosis.5 Therefore, in order to raise the overall survival rate of OSCC, it is a prerequisite and imperious to search for efficient biomarkers for OSCC.
Recently, many studies have shown that the immune system played a significant role in tumorigenesis.6 The immune system could inhibit cancer progression through formatting inflammatory microenvironment and then removing tumor cells and blocking cell proliferation and invasion.7,8 Furthermore, HPV infection was identified as a risk factor in OSCC,9 indicating that a tumor-related inflammatory microenvironment existed in all stages of tumorigenesis. Generally, it was believed that abnormal adaptive and innate immune responses were relevant to the occurrence of tumors by selecting for invasive cloning, inducing immunosuppression and promoting the progression and metastasis of cancer cells.10 Accumulating evidence indicated that immune evading was related to the initiation and progression of head and neck squamous cell carcinoma (HNSCC).11,12 In Hepatocellular Carcinoma (HCC),13 immunotherapies based on PD-1/PDL-1 showed promising clinical responses. In OSCC, Caldeira et al14 demonstrated that neutrophil infiltration was different between the carcinoma size T1/T2 group and the T3/T4 group, with higher indexes in the advanced lesions. Shimizu et al15 identified that CD8+ T-cells in the parenchyma of the invading edge and peripheral stroma were related to tumor recurrence and prognosis. In total, the immune system dysregulation was significantly relevant to the occurrence and progression of OSCC. The immune-related genes, as a significant section of the immune system, might be effective therapeutic targets in OSCC. At present, there were various studies proposing gene expression signatures for predicting overall survival in OSCC patients.16,17 However, fewer studies paid attention to the effect of whole subsets immune-related genes (IRGs) in OSCC. Given the significant effect of the immune system in the pathogenesis of OSCC, our study intended to reveal the prognostic value of IRGs and screen the effective immune-related biomarkers for OSCC by integrated bioinformatics analysis.
In this study, we downloaded RNA-seq data and relevant clinical information from The Cancer Genome Atlas (TCGA) and extracted IRGs and transcription factors (TFs) expression profiles from the datasets. The present study aimed to analyze the differentially-expressed IRGs and TFs, build a co-expression network between IRGs and TFs, select differentially-expressed IRGs to construct a gene expression profile signature, and identify crucial prognostic immune-related biomarkers in OSCC samples.
Materials and Methods
Data Acquisition and Differentially-Expressed Analysis
IRGs were obtained from the ImmPort database (https://www.immport.org/) and TFs downloaded from the Cistrome Data Browser (http://cistrome.org/). OSCC RNA-seq data were downloaded from TCGA (https://portal.gdc.cancer.gov/) following extracting IRGs and TFs expression profiles. The OSCC samples with incomplete clinical data were excluded. Subsequently, EdgeR in R software was used to screen differentially-expressed IRGs with the standard |log2 (fold change [FC])|>1.0 and FDR (adjusted P-value)<0.05.
Samples Collection
Forty-eight OSCC cases and their normal controls (matched normal tissues, MNTs) were collected from NanFang Hospital, Southern Medical University. All participants (including healthy controls) have written and provided informed consent to participate. All cases were pathologically confirmed to be squamous cell carcinoma and normal tissues, respectively.
Construction of Co-Expression Network
Differentially-expressed IRGs and TFs were enrolled in the co-expression network. The regulatory network was constructed by the “WGCNA” package in R software with the criteria correlation ≥0.4. And the network was visualized in Cytoscape software.
Establishment of Gene Expression Signature
All differentially expressed IRGs were selected to screen prognostic factors through univariate Cox regression analysis with the cut-off standard P-value<0.05. In order to construct a precise gene expression signature, these prognostic IRGs were selected into multivariate Cox regression and step-wise regression analysis. Finally, the risk level of each OSCC patient was calculated and visualized in R software according to the risk Cox formula and gene expression level.
Correlation Analysis
Cox regression was used to analyze the clinical characteristics, including risk score, clinical stage (stage Ⅰ, Ⅱ, III, Ⅳ), age, tumor grade (grade Ⅰ, Ⅱ, III, Ⅳ), T, N classification in TNM system, and gender. Distant metastasis (M classification) was excluded owing to numerous missing data. Subsequently, correlation analyses between risk level and these clinical characteristics were explored. In addition, the immune cells level was obtained from Tumor IMmune Estimation Resource (TIMER) (https://cistrome.shinyapps.io/timer/), and correlation analysis of immune cells level and risk score was also performed in R software.
Survival Analysis
On the basis of gene expression signature, OSCC samples were classified into low- and high-risk level groups. Kaplan–Meier survival curves, combined with stratification analysis, along with a log-rank P-test were performed to verify its accuracy in the R software “survival” package.
Cell Culture and Transfection
OSCC cell lines including SCC9, SCC15, SCC25, and normal Human Oral Keratinocytes (HOK) were purchased from the Institute of Antibody Engineering, Southern Medical University (Guangzhou, China). And the use of all cell lines was approved by the Nanfang Hospital ethics committee. HOK, SCC15, and SCC25 were cultivated in DMEM (Gibco, Cat#11995500TB) and SCC9 in DMEM/F12 (Gibco, Cat#C11330500BT) with 10% fetal bovine serum (FBS) (ExCell Bio, Inc., Shanghai, China) and incubated at cell incubator. The expression vectors for CTSG were designed and synthesized in Tsingke (Guangzhou, China). Expression vectors were transfected into OSCC cells following the protocol of lipofectamine 2000 (Thermo, Cat# 11668019). Total RNA and protein were extracted after 48–72 hours.
RNA Extraction and Quantitative Real-Time PCR (qRT-PCR)
Total RNAs were extracted in a TRIZOL (Takara, Cat# 9109) manner. Then, equal total RNA was reversed to cDNA on the basis of the manufacturer’s protocol (Vazyme Biotech Co., Ltd, Cat# R212-02). The relative expression levels of target genes in OSCC cases were quantified by RT-qPCR with ChamQ Universal SYBR qPCR Master Mix (Vazyme Biotech Co., Ltd). And GAPDH was used to normalize expression. CTSG Forward primer (5ʹ-3ʹ):GAGTCAGACGGAATCGAAACG; CTSG Reverse primer (5ʹ-3ʹ):CGGAGTGTATCTGTTCCCCTC. GAPDH Forward primer (5ʹ-3ʹ):CGCTGAGTACGTCGTGGAGTC; Reverse primer: (5ʹ-3ʹ):GCTGATGATCTTGAGGCTGTTGTC.
Cell Viability Assay
Approximately 2*10^3 OSCC control cells and CTSG overexpression cells were seeded in 96-well plates, Cell Counting Kit (Vazyme, Cat#A311-02-AA) was used to detect the cell viability at 1, 2, 3, and 4 days, respectively, with Biotek synergy HTX. Ninety microliters serum-free medium and 10 µl CCK8 reagent were mixed and added to each well. Then, these cells were incubated for 2 hours in the cell incubator. Finally, cell viability was reflected by the absorbance at 450 nm.
Clonogenic Assay
A sample of 0.25% trypsase (Solarbio, Cat# T1300) was used to digest the transfected cells and then suspended with complete medium. Then, control and CTSG overexpression cells were both cultured in 6-well plates with the starting density of 2,000 cells per well in a cell incubator for 1–2 weeks. Subsequently, cells were washed with PBS twice and fixed by 4% paraformaldehyde for 10 minutes, following staining for 15 minutes by 0.1% crystal violet staining solution. Finally, an inverted phase-contrast microscope was used to take colony images.
Transwell Assay
The 100l matrigel 1:8 dilution was coated at the bottom of the chamber and then placed in a cell incubator for 1–2 hours. Fifty thousand transfected cells were resuspended with 200l DMEM and seeded in the upper chambers. Then 600 μL 10% complete medium was placed in the bottom wells. The migration assay was without matrigel in the chamber. Subsequently, the transwell device was put in the cell incubator for 2–3 days. Then, these cells in the upper side were removed by cotton swab, and these cells below the chamber were fixed by 4% formaldehyde and then stained with 0.1% crystal violet. Finally, migration and invasion cells were viewed in an inverted microscope.
Western Blotting
Cells and tissue protein were extracted by RIPA lysis. SDS PAGE gels were used to separate protein samples, and then proteins were transferred on PVDF membranes (Pall, Cat# BSP0161). Subsequently, PVDF membranes were sealed with 5% skim milk for 1 hour and then primary antibodies were incubated at 4°C overnight. Goat anti-rabbit secondary antibodies for 1 hour at room temperature, and finally proteins were detected by ECL (YEASEN, Cat# 36208ES76) Prime Western Blotting Detection reagent. CTSG (ZEN BIO, Cat# 513172,1:1,000); E-cadherin (Proteintech, Cat# 20648-1-AP,1:3,000); N-cadherin (Proteintech, Cat# 13769-1-AP,1:3,000); MMP9 (Proteintech, Cat#10375-2-AP,1:3,000); GAPDH (Proteintech, Cat# 66031-1-1g1:3,000).
Statistical Analysis
SPSS23.0 software (IBM) was performed for statistical analyses. P-values<0.05 were identified as significant. Significant differences were supposed at P<0.05; P<0.01; P<0.001; and P<0.0001.
Results
Identification of Differentially-Expressed IRGs and TFs
We downloaded 351 samples, including 319 OSCC cases and 32 normal cases, and two OSCC samples were excluded owing to insufficient clinical data. In total, 317 OSCC cases and 32 normal controls were enrolled in this study. A total of 24,98 IRGs (Figure 1A and B) were obtained from the ImmPort database and 317 TFs (Figure 1C and D) from Cistrome. Differentially-expressed analysis indicated that there were 381 differentially-expressed IRGs (Supplementary Table S1) and 62 TFs (Supplementary Table S2) in OSCC. According to gene expression level with the cut-off criteria correlation coefficient of more than 0.4, the co-expression network was established in R in order to understand the regulatory relationship between TFs and IRGs. Finally, a total of 25 TFs, 21 IRGs, and 63 edges were enrolled in the co-expression network (Supplementary Table S3), which then was visualized in Cytoscape software (Supplementary Figure S1).
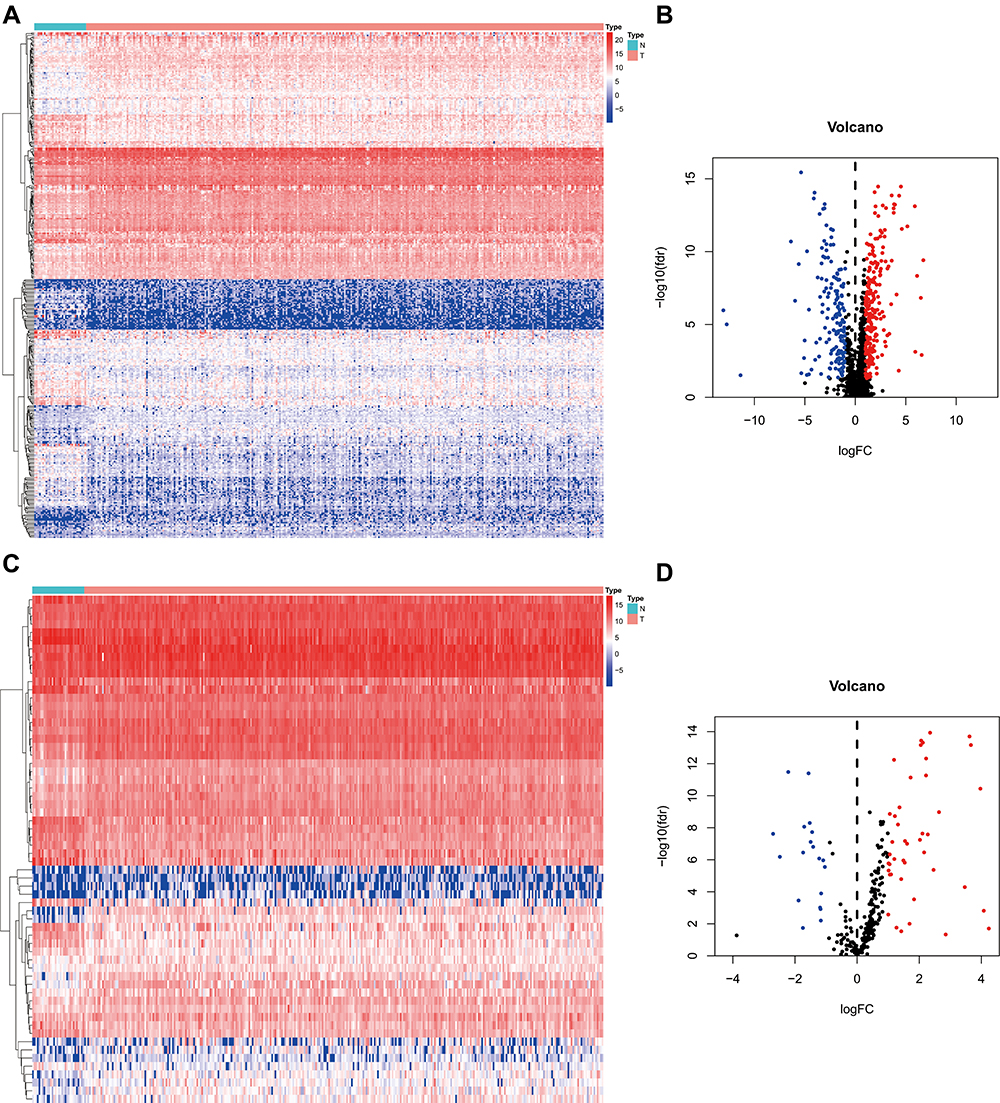 |
Figure 1 Differentially-expressed analysis of IRGs and TFs. (A, C) The heatmap of IRGs and TFs expression level in TCGA OSCC samples. N represents normal control cases, while T represents tumor cases. The ascending normalized expression level in the heatmaps is colored from blue to red. (B, D) The volcano plot of differentially-expressed IRGs and TFs in OSCC. Red stands for up-regulation and blue stands for down-regulation. Abbreviations: IRGs, immune-related genes; TFs, transcription factors; TCGA, The Cancer Genome Atlas; OSCC, oral squamous cell carcinoma. |
Establishment of Gene Expression Signature
Three hundred and eighty-one differentially-expressed IRGs were enrolled in univariate Cox regression analysis, and 42 IRGs were identified as prognostic factors (Figure 2A). Subsequently, 42 prognostic molecules were selected into multivariate Cox regression and step-wise Cox regression analysis. Finally, a gene expression signature including HTN3, CTSG, ADIPOQ, IL1A, CCL26, BTC, IL17F, JAG2, ESRRG, and TNFRSF4 was constructed (Table 1). Risk score=(0.100537503* HTN3)+(−0.155940982* CTSG)+(0.109018512* ADIPOQ)+(0.096145672* IL1A)+(0.099317877* CCL26)+(0.11718248* BTC)+(−0.159415533* IL17F)+(0.167445928* JAG2)+(0.078728308* ESRRG)+(−0.191134673* TNFRSF4). According to the Cox formula median value, each OSCC patient’s risk score was determined and visualized in R software along with corresponding survival time and gene expression profiles (Supplementary Figure S2 A, B). And the low-risk group experienced an excellent overall survival rate compared to the high-risk group (Figure 2B). In addition, CTSG, IL1A, CCL26, and JAG2 were relevant to overall survival (Figure 2C–F), indicating that these four IRGs might be regarded as potential prognostic biomarkers in OSCC.
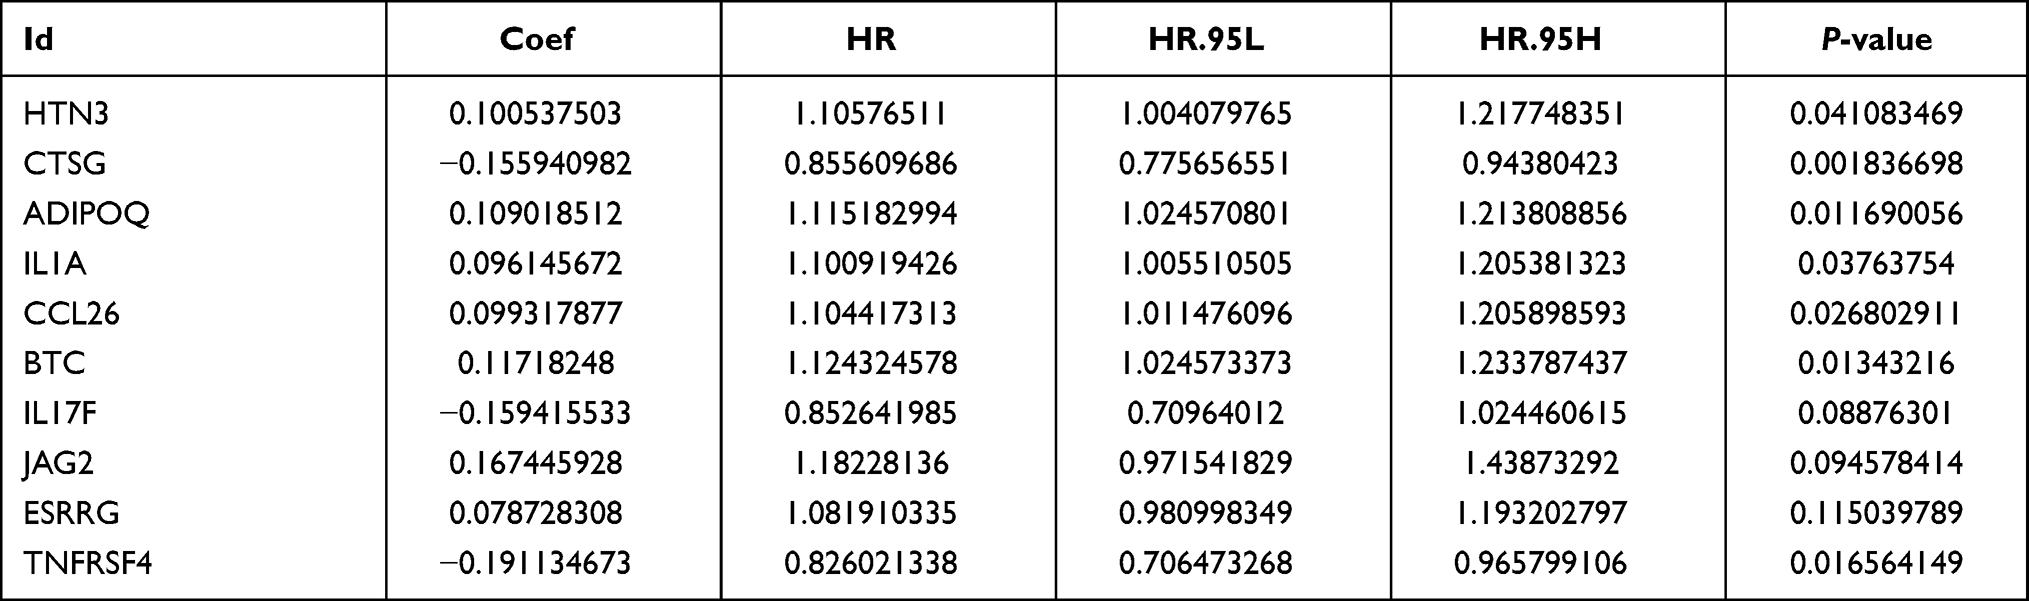 |
Table 1 Gene Signature on the Basis of Prognostic IRGs in OSCC |
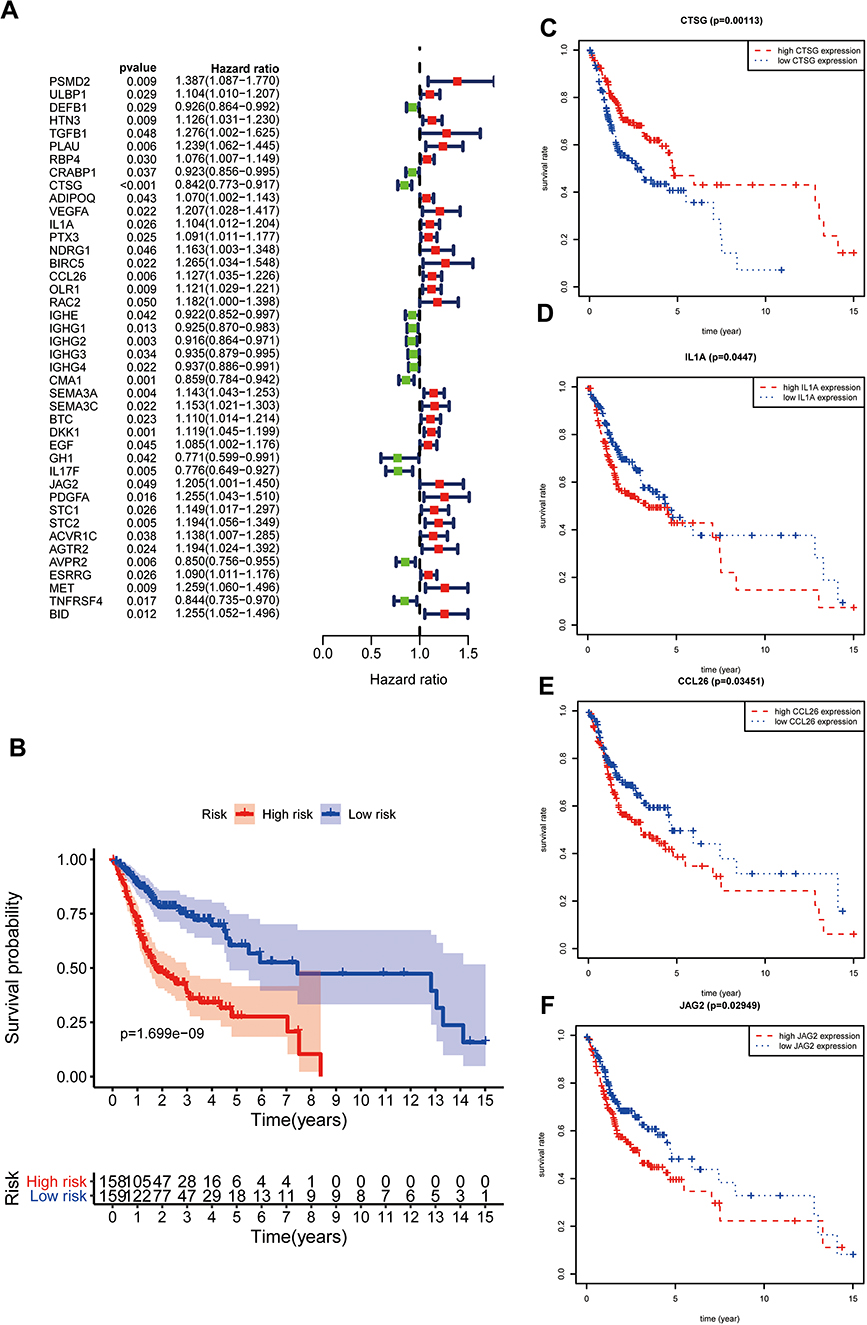 |
Figure 2 Gene expression signature according to IRGs. (A); Screening prognostic factors through univariate Cox regression analysis. (B); Survival analysis on the basis of immune-related gene expression signature. (C–F) Survival analysis of IRGs enrolled in risk formula. |
Stratification Survival Analysis
The prognostic value of each clinical parameter in TCGA was further explored with survival analysis. Distant metastasis was excluded owing to plenty of significantly inadequate data. Survival analyses combined with stratification analyses, including age (Figure 3A), gender (Figure 3B), tumor grade (Figure 3C), clinical stage (Figure 3D), and N (Figure 3E), T (Figure 3F) classification in the TNM system indicated that OSCC patients with a high-risk score had a remarkably undesirable overall survival rate compared to those with low-risk score.
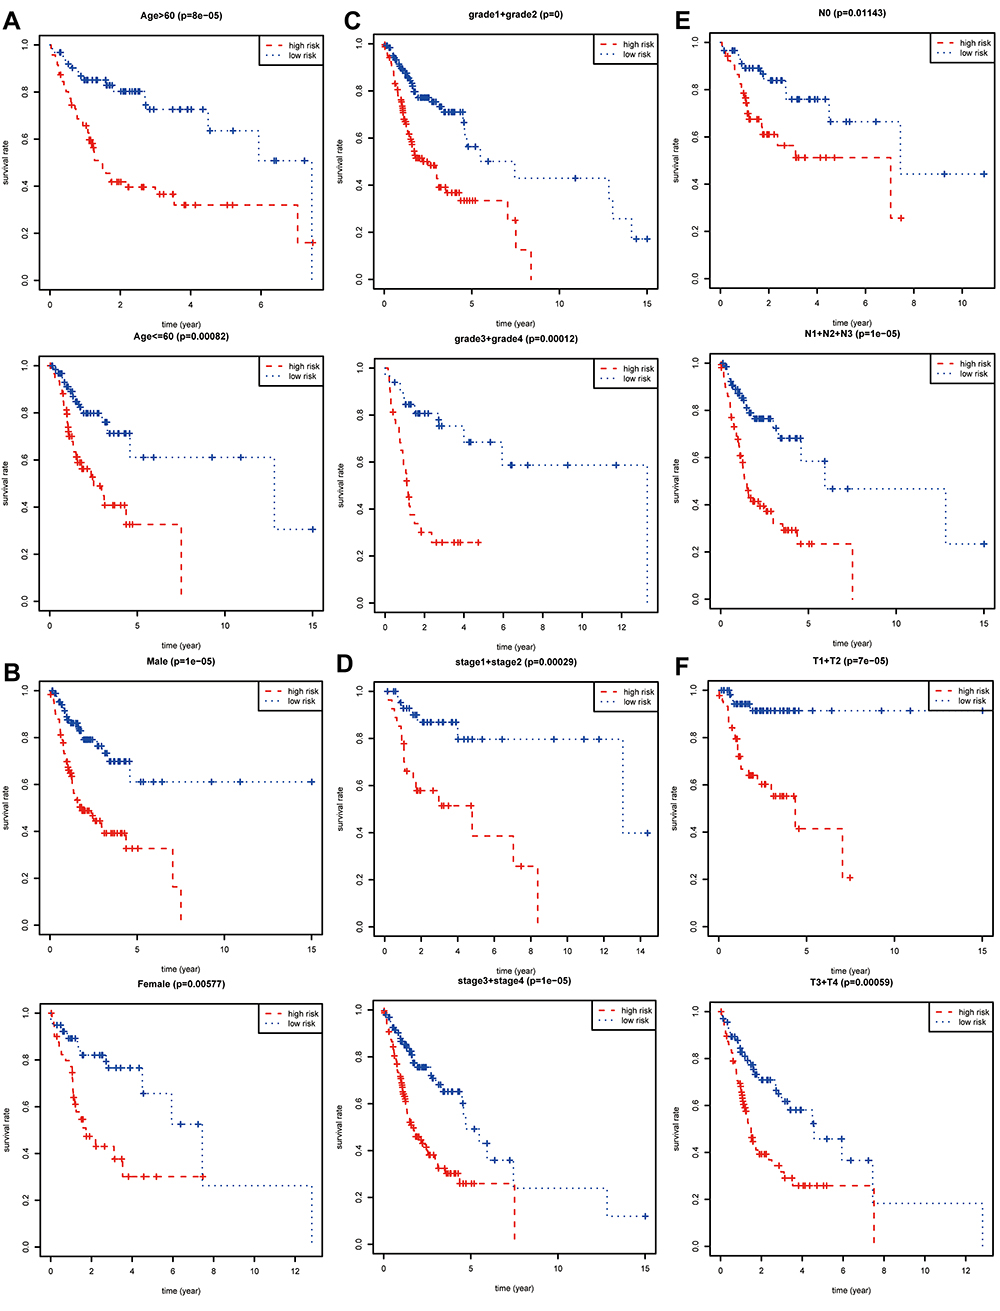 |
Figure 3 Stratification analysis and survival analysis. Based on gene expression signature, stratification analyses including age (A), gender (B), tumor grade (C), clinical stage (D), N classification (E), and T classification (F) in the TNM system combined with survival analyses were performed in R software “survival” package. |
Correlation Analysis
Bioinformatics analyses showed that risk score based on IRGs might be an independent prognostic biomarker in OSCC (Figure 4A and B). Furthermore, correlation analyses indicated that prognostic factors ESRRG and IL1A were also related to T classification in the TNM system (Figure 4C and D). To our surprise, the low CTSG expression level was not only associated with unfavorable overall survival, but also relevant to terminal clinical stage and high T classification (Figure 4E and F). In addition, high-risk score meant higher T classification (Figure 4G) and advanced clinical stage (Figure 4H), and was related to lower levels of immune cells including B-cell (Figure 5A), CD4_T-cell (Figure 5B), CD8_T-cell (Figure 5C), Neutrophil (Figure 5D), Macrophage (Figure 5E), and Dendritic (Figure 5F) in OSCC.
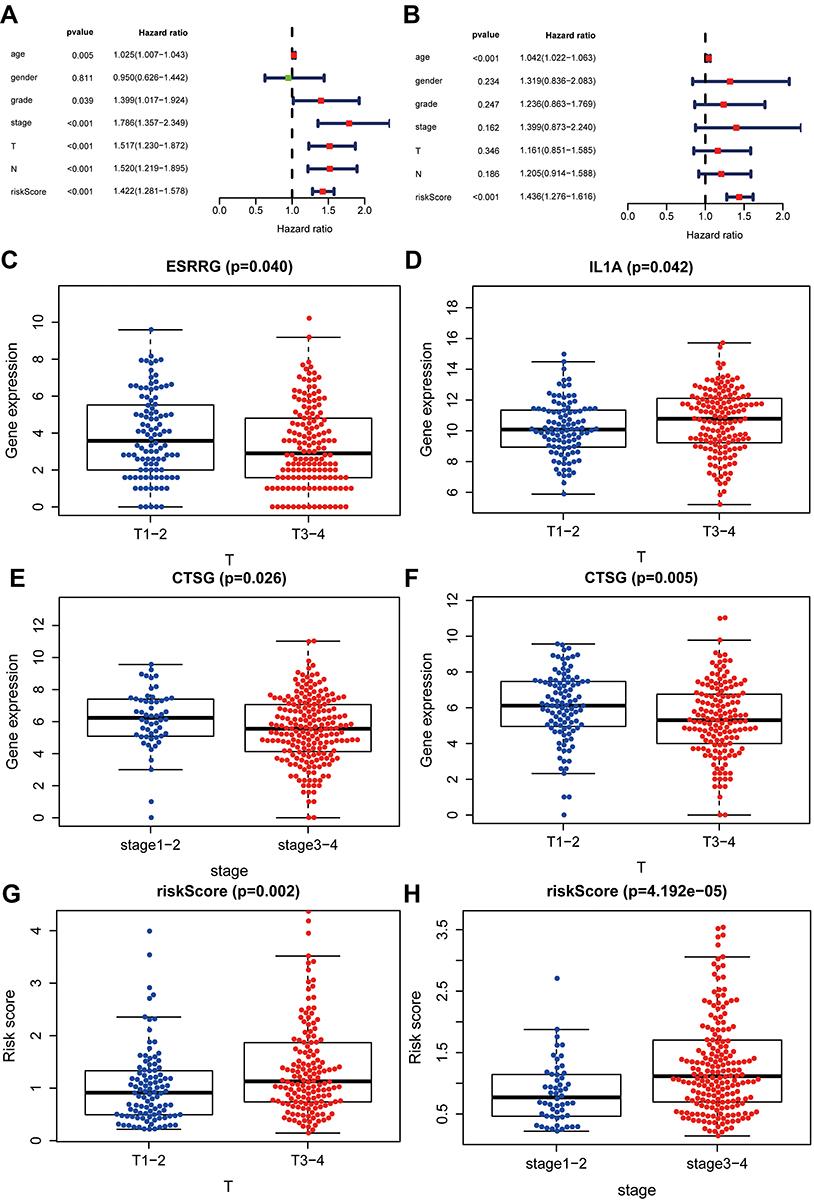 |
Figure 4 Correlation analysis between risk score and clinical parameters. (A, B) Bioinformatics indicated that risk score may be an independent prognostic biomarker. (C, D) High-risk score meant high T classification in the TNM system and terminal clinical stage (stage Ⅰ+Ⅱ, stage III+Ⅳ). (E, F) High ESRRG and low IL1A expression level meant low T classification. (G, H) Low CTSG expression level meant high T classification in TNM system and terminal clinical stage. |
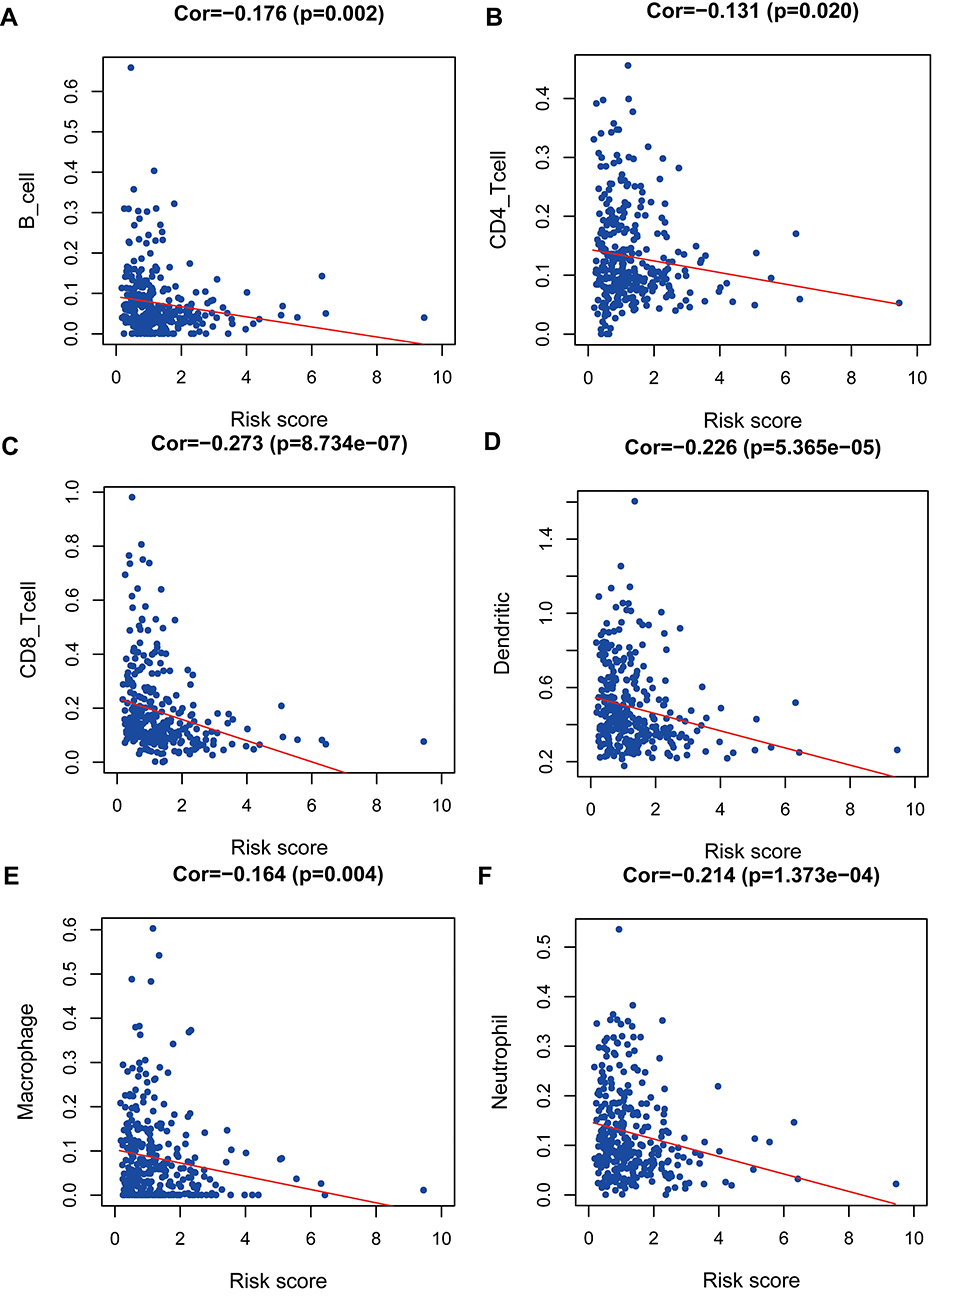 |
Figure 5 Correlation analysis between risk score and immune cells including B-cell (A), CD4_T-cell (B), CD8_T-cell (C), Neutrophil (D), Macrophage (E), and Dendritic (F) in TCGA OSCC patients. |
CTSG Inhibits OSCC Cells Proliferation, Migration/Invasion
CTSG, a member of the peptidase S1 protein family, is found in azurophil granules of neutrophilic polymorphonuclear leukocytes. It may participate in the killing and digestion of engulfed pathogens, and connective tissue remodeling at sites of inflammation. In our study, bioinformatics analyses indicated that CTSG may be an independent prognostic biomarker in OSCC. Therefore, CTSG expression level was detected in OSCC (Figure 6A and B) tissues. Western blot assay showed that CTSG protein level was downregulated in eight out of 10 OSCC cases (Figure 6C). Subsequently, CTSG overexpression vectors were transfected into SCC9 and SCC25 cell lines, and the transfection efficiency was detected by QPCR and Western blot (Figure 7A and B). As shown in the results, overexpression of CTSG inhibited the EMT pathway, which is remarkably relevant to cancer initiation and progression18 in OSCC via upregulation of E-cadherin and downregulation of N-cadherin, MMP2, MMP9, and Vimentin in SCC9 and SCC25 cells (Figure 7C). The protein–protein interaction network also indicated that CTSG and MMP9 had interactive regulation (SupplementaryFigure S2C). Finally, the results of CCK8, clonogenic, and transwell assay indicated that overexpression of CTSG obviously inhibited the proliferation, migration, and invasion in OSCC cells (Figure 7D and E; Figure 8A–E).
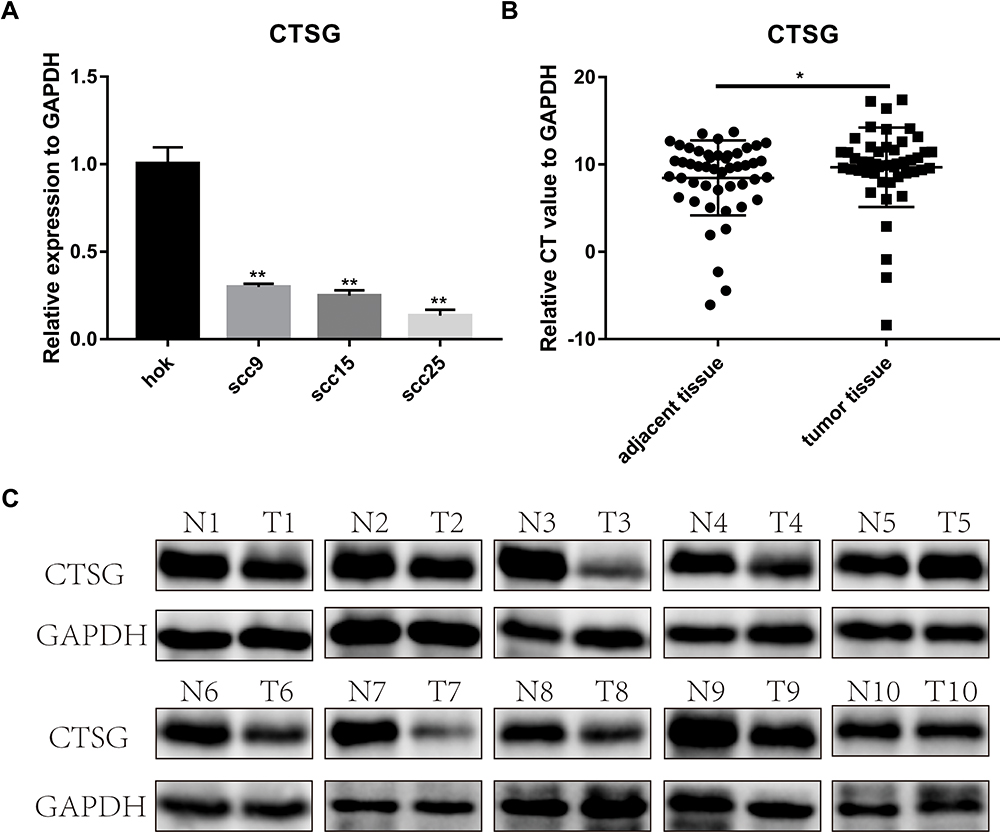 |
Figure 6 CTSG was differentially-expressed in OSCC. (A) CTSG was lower expression level in SCC9 (P=0.0021); SCC15 (P=0.0018); SCC25 (P=0.0012). (B) CTSG relative CT value in OSCC specimens and adjacent normal specimens (P=0.0433). The higher the relative CT value, the lower the CTSG expression level. (C) CTSG protein level in 10 OSCC cases. Eight cases were lower protein level in OSCC tumor tissues. N meant adjacent normal control, while T stands for tumor tissues. Significant differences were supposed at *P<0.05; **P<0.01. |
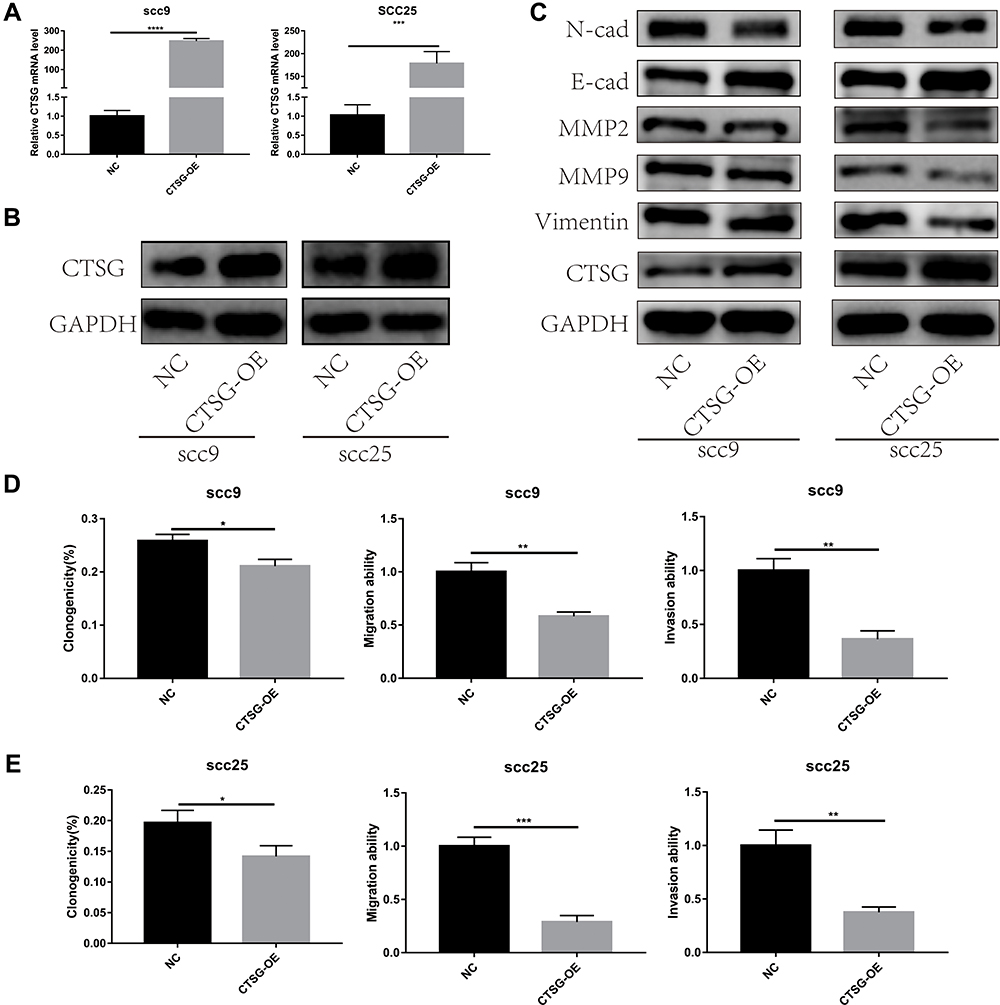 |
Figure 7 CTSG inhibited the activity of EMT pathway and OSCC progression. (A, B) Transfection efficiency was detected by qRT-PCR and Western blot assay (SCC9, P<0.0001; SCC25, P=0.0003). (C) Overexpression of CTSG up-regulated E-cadherin and down-regulated N-cadherin, MMP2, MMP9, and Vimentin both in SCC9 and SCC25 cell lines. (D) SCC9 cell lines clonogenicity (P=0.0103), migration (P=0.0017), and invasion (P=0.0012) statistical analyses. (E), SCC25 cell lines clonogenicity (P=0.0236), migration (P=0.0003), and invasion (P=0.0021) statistical analyses. NC stands for negative control, while CTSG-OE represents CTSG overexpression. Significant differences were supposed at *P<0.05; **P<0.01; ***P<0.001; ****P<0.0001. |
 |
Figure 8 CTSG inhibits OSCC cells proliferation, migration, and invasion. (A, B) CCK8 assay indicated that high CTSG expression inhibits OSCC cells proliferation (SCC9; 3-day, P=0.0018, 4 days, P=0.0045; SCC25; 3-day, P=0.0235, 4 days, P=0.0067). (C) CTSG overexpression inhibited the clonogenicity in vitro. (D, E) CTSG overexpression reduced the migration and invasion ability of OSCC cell lines. NC stands for negative control, while CTSG-OE represents CTSG overexpression. Significant differences were supposed at *P<0.05; **P<0.01. |
Discussion
Owing to the high recurrence rate and unsatisfied prognosis, OSCC poses a great challenge to modern healthcare. Recently, studies have demonstrated that the immune system was associated with OSCC initiation and progression.7 Therefore, it might be helpful to identify effective biomarkers of OSCC through exploring the role of whole IRGs by integrated bioinformatics analysis.
In our study, 381 IRGs and 62 TFs were identified to be differentially expressed in OSCC. A co-expression network was constructed successfully to investigate the regulatory relationship between IRGs and TFs. Some node genes were associated with OSCC. For instance, FOXM1 was identified as a novel predictor of tumor recurrence and its potential involvement in epithelial–mesenchymal transition (EMT) in OSCC.19 BIRC5, regulated by FOXM1 in the co-expression network, was an independent prognostic factor for patients with OSCC.20 In addition, E2F1, a transcription factor of BIRC5, was also relevant to OSCC progression.21 HIF1A regulated RGMA expression which was associated with OSCC proliferation.22 TGFB1, regulated by HIF1A in the co-expression network, could induce THBS1 to promote OSCC invasion.23 These node genes played a vital role in OSCC initiation and progression; therefore, the specific regulatory relationship between these TFs and IRGs should be further explored. Subsequently, a gene expression signature according to prognostic IRGs was built which could predict the prognosis of OSCC accurately. Correlation analyses indicated that risk level was related to T classification and clinical stage. In addition, the higher risk score meant the lower immune cells level and terrible overall survival in OSCC patients, which indicated that the immune function deficiency was closely relevant to the prognosis of patients with OSCC. Integrated bioinformatics analysis indicated that risk level according to IRGs might be an independent prognostic biomarker. Therefore, the 10 IRGs may be prognostic biomarkers of OSCC. Most of them were proved to be related to various cancers. For example, CTSG could promote cell migration and multicellular aggregation in human breast cancer MCF-7 cells through depending on E-cadherin24 and was an immunotherapeutic target in acute myeloid leukemia (AML).25 Our study showed that CTSG could inhibit OSCC proliferation, migration, invasion, and the induction of EMT in vitro, which plays a key role in tumorigenesis and progression, and a higher CTSG expression level meant well-pleasing overall survival and early-stage tumor. Our results indicated that CTSG plays a vital inhibitory role in OSCC carcinogenesis and may be a potential biomarker and therapeutic target for OSCC. The study demonstrated that CTSG could activate MMP2 which was associated with inflammatory cells in tumor invasion and angiogenesis. According to the CTSG protein–protein interaction network, CTSG, MMP9, and SERPINB4 had a mutual regulation relationship. Recently, numerous studies indicated that MMP9 might be involved in tumor invasion, metastasis,26 angiogenesis, and local tumor progression in OSCC,27 which indicating that CTSG might play a significant role in OSCC by interaction with MMP9. In addition, Masashi Shiiba et al28 suggested that SERPIN-family genes, including SERPINB4, played a crucial role in OSCC carcinogenesis and might be involved in tumor suppression, which showed that CTSG might have an interaction with these genes and a close relation with OSCC initiation and progression. The study showed that extracellular mast cell-derived IL-17F at the tumor invasion front was associated with better disease-specific survival in patients with all-stages and early-stages of oral tongue SCC29 and serum IL-17F combined with vascular endothelial growth factor (VEGF) served as potential diagnostic biomarkers for OSCC.30 Furthermore, Hatano et al31 identified that overexpression of JAG2 was associated with undesirable overall survival, and JAG2 may be a potential prognostic biomarker in OSCC, which was similar to our results. ESRRG was verified as a negative regulator of the Wnt signaling pathway in gastric cancer (GC).32 Li et al33 demonstrated that IL1A was related to the proliferation of cervical carcinoma cells. In our study, these IRGs were closely correlated with the prognosis of OSCC and might be potential biomarkers in OSCC via bioinformatic analysis. However, the roles of them in OSCC remain obscure, and further studies should be made to explore their mechanism.
Conclusions
In conclusion, our studies showed that IRGs were involved in OSCC initiation, progression, and prognosis via bioinformatics analyses. A co-expression network was constructed to predict the regulatory relationship between IRGs and TFs. In addition, a gene expression signature according to prognostic IRGs could predict OSCC patients' prognosis and immune cells level accurately, and the risk-score was served as an independent prognostic biomarker in OSCC, indicating that these IRGs might play a crucial role in OSCC progression. Finally, CTSG played an important role in OSCC carcinogenesis and might be a potential immunotherapeutic target for OSCC.
Data Statement
All data for this study are available from the corresponding authors if required.
Publication Ethics
The NanFang Hospital ethics committee (AF/SC-09/03.2) approved this study. And the use of all cell lines was approved by the NanFang Hospital ethics committee. This study complied with the Declaration of Helsinki.
Consent for Publication
All of the authors provided consent for publication.
Acknowledgments
This research was supported by the National Natural Science Foundation of China (81472536); the Science and Technology Planning Project of Guangdong Province (2017A020215181; 2014A020212440); the Project of Educational Commission of Guangdong Province of China (2018KTSCX026); the Scientific Research Planning Project of Southern Medical University (CX2018N016); and the Presidential Foundation of the Nanfang Hospital (2014027; 2019Z030).
Author Contributions
All authors made a significant contribution to the work reported, whether that is in the conception, study design, execution, acquisition of data, analysis and interpretation, or in all these areas; took part in drafting, revising, or critically reviewing the article; gave final approval of the version to be published; have agreed on the journal to which the article has been submitted; and agree to be accountable for all aspects of the work.
Disclosure
The authors report no conflicts of interest in this work.
References
1. Nakaoka T, Ota A, Ono T, et al. Combined arsenic trioxide-cisplatin treatment enhances apoptosis in oral squamous cell carcinoma cells. Cell Oncol. 2014;37(2):119–129. doi:10.1007/s13402-014-0167-7
2. Huang F, Xin C, Lei K, et al. Noncoding RNAs in oral premalignant disorders and oral squamous cell carcinoma. Cell Oncol. 2020;43(5):763–777. doi:10.1007/s13402-020-00521-9
3. Chai AWY, Lim KP, Cheong SC. Translational genomics and recent advances in oral squamous cell carcinoma. Sem Cancer Biol. 2020;61:71–83. doi:10.1016/j.semcancer.2019.09.011
4. Chaw SY, Abdul MA, Dalley AJ, et al. Epithelial to mesenchymal transition (EMT) biomarkers – e-cadherin, beta-catenin, APC and Vimentin – in oral squamous cell carcinogenesis and transformation. Oral Oncol. 2012;48(10):997–1006. doi:10.1016/j.oraloncology.2012.05.011
5. Glazer CA, Chang SS, Ha PK, et al. Applying the molecular biology and epigenetics of head and neck cancer in everyday clinical practice. Oral Oncol. 2009;45(4–5):440–446. doi:10.1016/j.oraloncology.2008.05.013
6. Sima P, Vannucci L, Vetvicka V. Immunity in cancer and atherosclerosis. Ann Transl Med. 2019;7(9):204. doi:10.21037/atm.2019.04.56
7. Gonzalez H, Hagerling C, Werb Z. Roles of the immune system in cancer: from tumor initiation to metastatic progression. Genes Dev. 2018;32(19–20):1267–1284. doi:10.1101/gad.314617.118
8. Elhousiny M, Miller K, Ariyawadana A, et al. Identification of inflammatory mediators associated with metastasis of oral squamous cell carcinoma in experimental and clinical studies: systematic review. Clin Exp Metastasis. 2019;36(6):481–492. doi:10.1007/s10585-019-09994-x
9. Leemans CR, Braakhuis BJM, Brakenhoff RH. The molecular biology of head and neck cancer. Nat Rev Cancer. 2011;11(1):9–22. doi:10.1038/nrc2982
10. Palucka AK, Coussens LM. The Basis of Oncoimmunology. Cell. 2016;164(6):1233–1247. doi:10.1016/j.cell.2016.01.049
11. Miyauchi S, Kim SS, Pang J, et al. Immune Modulation of Head and Neck Squamous Cell Carcinoma and the Tumor Microenvironment by Conventional Therapeutics. Clin Cancer Res. 2019;25(14):4211–4223. doi:10.1158/1078-0432.CCR-18-0871
12. Maggioni D, Pignataro L, Garavello W. T-helper and T-regulatory cells modulation in head and neck squamous cell carcinoma. Oncoimmunology. 2017;6:e1325066. doi:10.1080/2162402X.2017.1325066
13. Harding JJ, El DI, Abou-Alfa GK. Immunotherapy in hepatocellular carcinoma: primed to make a difference? Cancer Am Cancer Soc. 2016;122:367–377.
14. Caldeira PC, de Andrade SA, de Aguiar MCF. Differential infiltration of neutrophils in T1–T2 versus T3–T4 oral squamous cell carcinomas: a preliminary study. BMC Res Notes. 2015;8(1):569. doi:10.1186/s13104-015-1541-x
15. Shimizu S, Hiratsuka H, Koike K, et al. Tumor-infiltrating CD8+T-cell density is an independent prognostic marker for oral squamous cell carcinoma. Cancer Med. 2019;8(1):80–93. doi:10.1002/cam4.1889
16. Huang G-Z, Wu -Q-Q, Zheng Z-N, et al. M6A-related bioinformatics analysis reveals that HNRNPC facilitates progression of OSCC via EMT. Aging. 2020;12(12):12. doi:10.18632/aging.103333
17. Huang G-Z, Wu -Q-Q, Zheng Z-N, et al. Identification of candidate biomarkers and analysis of prognostic values in oral squamous cell carcinoma. Fron Oncol. 2019;9:1054. doi:10.3389/fonc.2019.01054
18. Brabletz T, Kalluri R, Nieto MA, et al. EMT in cancer. Nat Rev Cancer. 2018;18(2):128–134. doi:10.1038/nrc.2017.118
19. Luo Y-D, Ding X, Du H-M, et al. FOXM1 is a novel predictor of recurrence in patients with oral squamous cell carcinoma associated with an increase in epithelial‑mesenchymal transition. Mol Med Rep. 2019;19(5):4101–4108. doi:10.3892/mmr.2019.10094
20. Troiano G, Guida A, Aquino G, et al. Integrative histologic and bioinformatics analysis of BIRC5/survivin expression in oral squamous cell carcinoma. Int J Mol Sci. 2018;19.
21. Jin S, Ma H, Yang W, et al. Cell division cycle 7 is a potential therapeutic target in oral squamous cell carcinoma and is regulated by E2F1. J Mol Med. 2018;96(6):513–525. doi:10.1007/s00109-018-1636-7
22. Lu Y, Li Y, Wang Z, et al. Downregulation of RGMA by HIF-1A/miR-210-3p axis promotes cell proliferation in oral squamous cell carcinoma. Biomed Pharmacother. 2019;112:108608. doi:10.1016/j.biopha.2019.108608
23. Pal SK, Nguyen CTK, Morita K-I, et al. THBS1 is induced by TGFB1 in the cancer stroma and promotes invasion of oral squamous cell carcinoma. J Oral Pathol Med. 2016;45(10):730–739. doi:10.1111/jop.12430
24. Morimoto‐Kamata R, Yui S. Insulin-like growth factor-1 signaling is responsible for cathepsin G-induced aggregation of breast cancer MCF-7 cells. Cancer Sci. 2017;108(8):1574–1583. doi:10.1111/cas.13286
25. Alatrash G, Garber HR, Zhang M, et al. Cathepsin G is broadly expressed in acute myeloid leukemia and is an effective immunotherapeutic target. Leukemia. 2017;31(1):234–237. doi:10.1038/leu.2016.249
26. Xu G, Wei J, Huangfu B, et al. Animal model and bioinformatics analyses suggest the TIMP1/MMP9 axis as a potential biomarker in oral squamous cell carcinoma. Mol Carcinog. 2020;59(11):1302–1316. doi:10.1002/mc.23258
27. Ren JG, Zhang W, Liu B, et al. Clinical Significance and Roles in Angiogenesis of Circulating Microparticles in Oral Cancer. J Dental Res. 2016;95(8):860–867. doi:10.1177/0022034516641037
28. Shiiba S. Down-regulated expression of SERPIN genes located on chromosome 18q21 in oral squamous cell carcinomas. Oncol Rep. 2010;24(1):241–249. doi:10.3892/or_00000852
29. Almahmoudi R, Salem A, Sievilainen M, et al. Extracellular interleukin-17F has a protective effect in oral tongue squamous cell carcinoma. Head Neck. 2018;40(10):2155–2165. doi:10.1002/hed.25207
30. Ding L, Hu E-L, Xu Y-J, et al. Serum IL-17F combined with VEGF as potential diagnostic biomarkers for oral squamous cell carcinoma. Tumour Biol. 2015;36(4):2523–2529. doi:10.1007/s13277-014-2867-z
31. Hatano K, Saigo C, Kito Y, et al. Overexpression of JAG2 is related to poor outcomes in oral squamous cell carcinoma. Clin Exp Dent Res. 2020;6(2):174–180. doi:10.1002/cre2.267
32. Kang M-H, Choi H, Oshima M, et al. Estrogen-related receptor gamma functions as a tumor suppressor in gastric cancer. Nat Commun. 2018;9(1):1920. doi:10.1038/s41467-018-04244-2
33. Li M, Yang J, Liu K, et al. p16 promotes proliferation in cervical carcinoma cells through CDK6-HuR-IL1A axis. J Cancer. 2020;11(6):1457–1467. doi:10.7150/jca.35479
 © 2021 The Author(s). This work is published and licensed by Dove Medical Press Limited. The full terms of this license are available at https://www.dovepress.com/terms.php and incorporate the Creative Commons Attribution - Non Commercial (unported, v3.0) License.
By accessing the work you hereby accept the Terms. Non-commercial uses of the work are permitted without any further permission from Dove Medical Press Limited, provided the work is properly attributed. For permission for commercial use of this work, please see paragraphs 4.2 and 5 of our Terms.
© 2021 The Author(s). This work is published and licensed by Dove Medical Press Limited. The full terms of this license are available at https://www.dovepress.com/terms.php and incorporate the Creative Commons Attribution - Non Commercial (unported, v3.0) License.
By accessing the work you hereby accept the Terms. Non-commercial uses of the work are permitted without any further permission from Dove Medical Press Limited, provided the work is properly attributed. For permission for commercial use of this work, please see paragraphs 4.2 and 5 of our Terms.