")
Back to Journals » International Journal of General Medicine » Volume 15
Bioinformatic Analysis of the Expression and Clinical Significance of the DNA Replication Regulator MCM Complex in Bladder Cancer
Authors Chen R, Hu B, Jiang M, Deng W, Zheng P, Fu B
Received 4 April 2022
Accepted for publication 26 May 2022
Published 7 June 2022 Volume 2022:15 Pages 5465—5485
DOI https://doi.org/10.2147/IJGM.S368573
Checked for plagiarism Yes
Review by Single anonymous peer review
Peer reviewer comments 2
Editor who approved publication: Dr Scott Fraser
Ru Chen,1,2,* Bing Hu,1,* Ming Jiang,1,* Wen Deng,1 Ping Zheng,3 Bin Fu1,4
1Department of Urology, the First Affiliated Hospital of Nanchang University, Nanchang City, Jiangxi Province, People’s Republic of China; 2Department of Urology, The First Hospital of Putian City, Putian, Fujian, People’s Republic of China; 3Department of Urology, Shangrao municipal Hospital, Shangrao, 334000, Jiangxi Province, People’s Republic of China; 4Jiangxi Institute of Urology, Nanchang City, Jiangxi Province, People’s Republic of China
*These authors contributed equally to this work
Correspondence: Bin Fu, Email [email protected]
Objective: The minichromosome maintenance (MCM) complex (MCM2, MCM3, MCM4, MCM5, MCM6, and MCM7), which regulates DNA replication and cell cycle progression, is essential for the development and progression of multiple tumors, but their role in bladder cancer development remains unclear. In the present study, the biological role and clinical significance of the MCM complex in bladder cancer were systematically elucidated.
Materials and Methods: We analyzed DNA mutations, mRNA expression and protein levels, protein–protein interaction (PPI) networks, functional enrichment, prognostic value of MCM2/3/4/5/6/7 in bladder urothelial carcinoma (BLC) and the connections between the immune cell infiltration and the overall survival of BLC patients with the MCM expression levels using Oncomine, Gene Expression Profiling Interactive Analysis (GEPIA), the Cancer Genome Atlas database (TCGA), Human Protein Atlas, UALCAN, STRING, cBioPortal, TIMER and GSCALite databases.
Results: The outcomes showed that the mRNA expression level of each member of the MCM complex was significantly correlated with histologic grade and tumor histology in BLC patients. Moreover, survival analysis showed that MCM/2/3/4/5/6/7 mRNA expressions were significantly associated with prognosis in patients with bladder cancer. Moreover, we experimentally validated the overexpression of the MCM2-7 complex in the BLC. Based on functional enrichment and PPI network analysis, the MCM complex might promote the progression of bladder cancer by activating DNA replication and accelerating cell cycle progression. In addition, MCM2/3/4/5/6/7 genes were also significantly associated with tumor immune cells infiltration and the drug sensitivity in BLC.
Conclusion: Our study suggests that the MCM complex especially MCM2/4/6/7 might be potential molecular therapeutic targets for BLC treatment and might be useful biomarkers for diagnosis and prognosis.
Keywords: bladder cancer, minichromosome maintenance complex, bioinformatics, potential biomarkers
Introduction
Bladder cancer (BC), a common urothelial carcinoma, is characterized by high morbidity and mortality.1 BLC is more than four times more common in men than in women, with a worldwide incidence of 9.6 per 100,000 and 2.4 per 100,000. In men, BLC ranks the sixth of all newly diagnosed cancers and the ninth most deadly tumor worldwide.2 Bladder cancer is divided into non-muscle-invasive bladder cancer (NMIBC) and muscle-invasive bladder cancer (MIBC). Lots of patients' futures developed into muscular invasion urothelial carcinomas with a very lower 5-year survival rate. Due to the high incidence and recurrence rates, it is necessary to investigate the relevant genetic pathways underlying the genesis and development of bladder cancer to look for a therapeutic target to improve the survival rates of patients with bladder cancer.
Genome instability is defined as the high frequency of mutations within the genome of a cellular lineage. Genomic variation, which helps regulate cancer genes, includes single-nucleotide variants, small insertions and deletions (indels), and copy number variants.3 Dysregulation of DNA replication in cells contributes to tumor formation and progression. Minichromosome maintenance proteins (MCMs) were originally identified in Saccharomyces cerevisiae as necessary factors for the maintenance of extrasomal DNA.4 It has been reported that MCMs are essential for tightly regulating DNA replication to maintain normal cellular processes, especially during DNA initiation as well as elongation. In many studies, genomic instability caused by MCM variants has been shown to be associated with cancer prognosis. Abnormal expression and activation of MCMs are often detected in various precancerous lesions and malignancies and contribute to genomic instability and uncontrolled cell cycle progression. The MCM2-7 complex proteins in the MCM family are related to each other and form a family of DNA helicases which implicated at the first committed step of DNA synthesis.5
Members of the MCM family, especially MCM2-7, are evolutionarily and functionally conservative throughout eukaryotes. MCM2-7 are the only proteins present throughout the cell cycle, while dividing.6 All of them take part in the regulation of heterochromatin, gene expression, and developmental programs. The helicolytic enzyme activity can only be achieved when MCM2, MCM3, MCM4, MCM5, MCM6 and MCM7 form hex-mer, which is the basis of functional activity.7 Previous studies have reported abnormal expression of some MCM2-7 members and their prognostic value on BLC. For example, by upregulating the expression of MCM5 in BLC cell lines, estrogen receptor β can promote tumor cell proliferation and invasion.8 To date, the prognostic values of individual MCM2-7 members in the development and progression of BLC remain unclear.
In this research, with the use of multiple databases, we solved this problem by analyzing the expression and mutation status of members of the minichromosome maintenance complex of proteins (MCM2-7) in BLC, and their relationship with clinicopathological features, prognosis, tumor immune cell infiltration and the drug sensitivity based on the multiple databases. A complete and comprehensive analysis of MCM2-7 in BLC will be performed to further clarify the underlying molecular mechanisms involved in the development of BLC for developing novel prognostic biomarkers and effective therapeutic targets.
Materials and Methods
Ethics Statement
Our research protocol was approved by the Ethics Committee of the First Affiliated Hospital of Nanchang University. Data were retrieved from online databases, and tissue samples were obtained from patients who had given permission for their samples to be used in research and admitted to the Department of Urology in hospital.
ONCOMINE Database
Oncomine (https://www.oncomine.org) is the largest oncogene chip database and integrated data-mining platform designed to mine genetic information about cancer. With Oncomine, differential expression analysis of the MCM2-7 complex between cancerous tissue and adjacent tissue could be performed using a Student’s t-test to generate a p-value.9 The cut-off of p value and fold change were as follows: p value: 0.01, fold change: 1.5, gene grade: 10%, data type: mRNA.
UALCAN
UALCAN (http://ualcan.path.uab.edu) is an online tool based on CPTAC database and TCGA for gene expression profiling in cancer-free and cancerous tissues.10 Differential expression analysis of the MCM2-7 complex was performed by querying the UALCAN portal. Differential mRNA expression in tumor histology was also achieved from the database. Using Student’s t-test, *p < 0.05, **p < 0.01 and ***p < 0.001 are considered statistically significant.
Human Protein Atlas
Immunohistochemistry-based expression data are collected from the Human Protein Atlas (https://www.proteinatlas.org). Immunohistochemical image analysis was used to directly compare the expression of MCM2-7 protein in normal human tissues and tumor tissues.
The Cancer Genome Atlas (TCGA) Database
There are more than 30 kinds of sequencing information and clinical data of human tumors in TCGA. Using genome sequencing, the genome variation map of human cancer was mapped, and a systematic analysis was conducted to understand the molecular mechanisms of cancer cell genesis and development, with the aim of obtaining new diagnosis and treatment methods. In our study, the clinical pathological parameters of 414 cases of patients with BLC were downloaded from UCSC XENA website (https://xena.ucsc.edu/). Data analysis was conducted with R software (R software, version 3.6.3). The clinical data are summarized in Table 1.
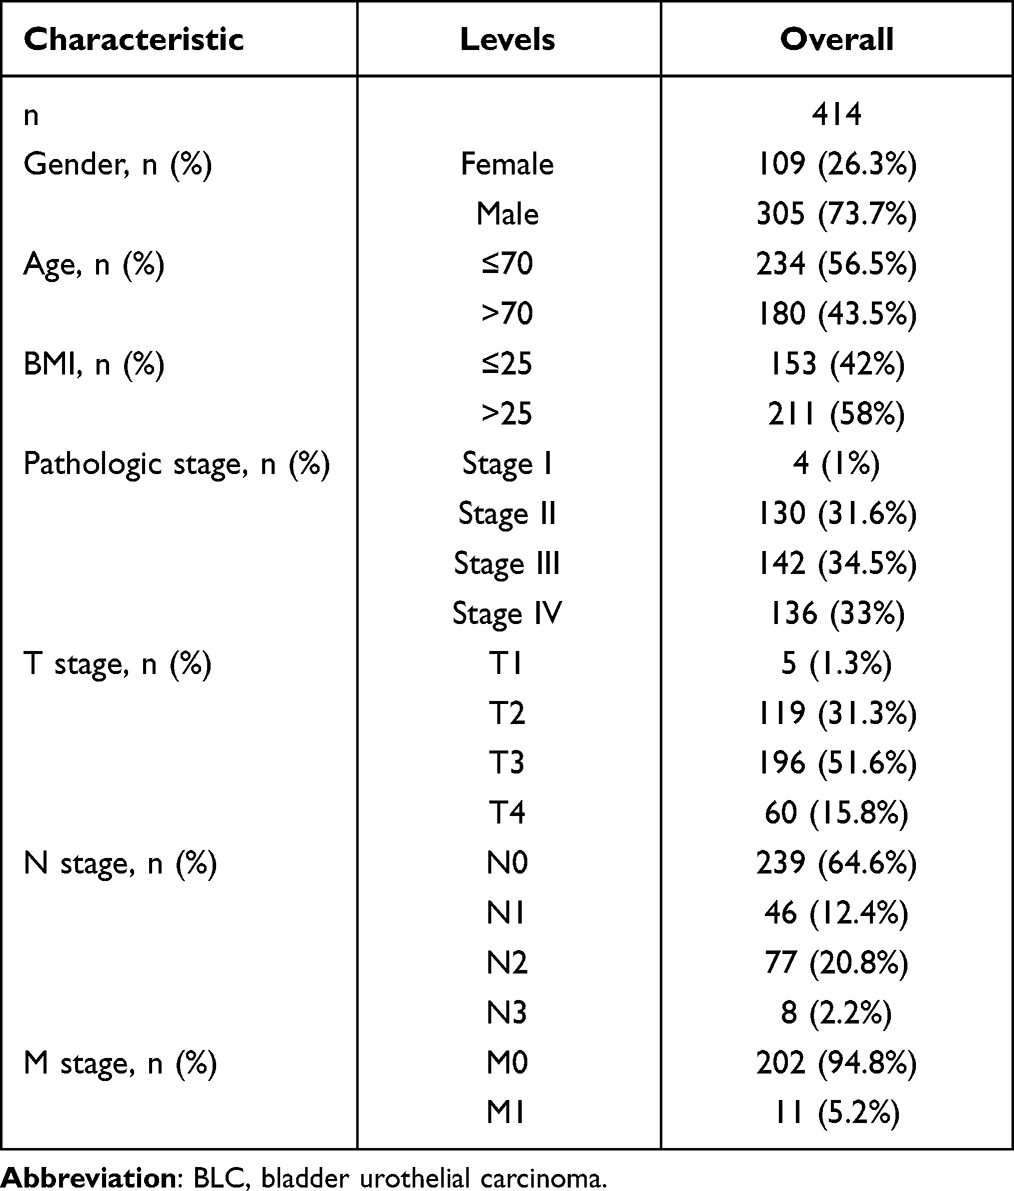 |
Table 1 Clinical Data Were Reviewed in 414 Patients with BLC from the TCGA |
cBioPortal
cBioPortal (www.cbioportal.org) is an online website for exploring, visualizing and analyzing multidimensional cancer genomic dataset. In this study, we analyzed genomic maps of members of the MCM2-7 family containing mutations, protein expression z-scores (RPPA), mRNA expression z-scores (RNA Seq V2 RSEM), and putative copy number changes from GISTIC.
GEPIA Dataset
The GEPIA database is an online dataset for analyzing the RNA sequencing expression data based on TCGA and the Genotype-Tissue Expression (GTEx) projects. In our study, we obtained data related to MCM2-7 mRNA expression and clinical prognosis from GEPIA database.
Gene Ontology (GO) and Kyoto Encyclopedia of Genes and Genomes (KEGG) Analysis
Functions and pathways of MCM2-7 mutations and 50 genes associated with MCM2-7 mutations were analyzed by GO and KEGG using R software. The functional roles of MCM2-7 complex mutations and 50 genes significantly associated with MCM2-7 mutations on the basis of three aspects were analyzed by GO function including cellular components, biological processes, molecular functions and Pathway analyses were performed using KEGG including the relevant pathways in biological processes.
STRING Database Analysis
STRING database (http://string-db.org/) was used as a cellular PPI network. The MCM complex and 50 neighbor genes interacted with each other and were performed using the database. The result of PPI network was downloaded from the webpage.
Reagents
TRIzol reagent was bought from CWBIO (Beijing, China), PrimeScript RT Master Mix and SYBR Green Premix reagents were purchased from TaKaRa (Japan).
Cell Lines and Cell Culture
The BLC cell lines (BIU-27, T24), which were obtained from the ATCC, were cultured in RPMI−1640 and DEMEM medium (GIBCO, Thermo Fisher Scientific, Inc.) supplemented with 10% fetal bovine serum (FBS; Gibco; Invitrogen; Thermo Fisher Scientific, Inc.)
Patients and Tumor Tissues
16 paired BLC tissues and paired-adjacent normal bladder tissues, which were pathologically confirmed by two independent pathologists were immediately frozen in liquid nitrogen after surgical removal in the First Affiliated Hospital of Nanchang University from 2021 to 2022 and stored in liquid nitrogen until use. The study protocol was approved by the hospital ethics committee and the informed consents were obtained from six participants in the study.
RNA and Quantitative Real-Time PCR
Total RNA from 16 for tumor tissues and 16 for paired adjacent normal tissues and BLC cell lines were extracted by Trizol. The 1 µg RNA from each sample was used for cDNA synthesis (Tiangen) according to the manufacturer’s protocol. Primers used were listed as follows: GAPDH forward GTCTCCTCTGACTTCAACAGCG, GAPDH reverse: ACCACCCTGTTGCTGTAGCCAA; MCM2 forward: GCCTCTCCAAGGATCAGCAG, MCM2 reverse: GAGCCAGGCCTCTCTTGATG; MCM3 forward: TGGGGATTCATACGACCCCT, MCM3 reverse: GTGAGTCTGCCGTCTTTGGA; MCM4 forward: TCTCGTTGACAAGGTCCAGC, MCM4 reverse: ACTCGAATAGGCACAGCTCG; MCM5 forward: GACCTGGCCAAGCTGAAGAA, MCM5 reverse: GTTTCTCTGCAGCCTCTGCT; MCM6 forward: AGGTAGATGAGGGTGCTGGT, MCM6 reverse: GGCTTTGGGAGCAGACTCTT; and MCM7 forward: ATCCGGGGCATCAACAT, MCM7 reverse: GGTCAGTCCACTCACGG.
Statistical Analysis
Statistical analyses on the qRT-PCR were analyzed in the GraphPad prism 9.0.0. The data were analyzed with the Mann Whitney U-test and p value <0.05 was considered statistically significant.
GSCALite
GSCALite (http://bioinfo.life.hust.edu.cn/web/GSCALite/) is an important online website for the cancer genome analysis platform, which provides gene differential expression, overall survival, single nucleotide variation, copy number variation, methylation, pathway activity, miRNA regulation, normal tissue expression, and drug sensitivity. Furthermore, we utilized it to analyze pathway activity, miRNA network and the drug sensitivity of MCM2/3/4/5/6/7 in BLC.
TIMER
TIMER (http://cistrome.org/TIMER/) is a TCGA database visual website developed for analyses of tumor immunity.11 The correlation between members of MCM2/3/4/5/6/7 and infiltration of immune cells in BLC was explored in the gene module. The somatic copy number alteration (SCNA) module was used to associate genetic copy number alterations of MCM2/3/4/5/6/7 with the abundance of immune infiltrates.
Results
Overexpression of Different Members of the MCM Complex in Patients with BLC
We explore the different prognosis and potential therapeutic value of MCM members in patients with BLC. ONCOMINE database (www.oncomine.org), UALCAN (http://ualcan.path.uab.edu), and Human Protein Atlas (https://www.proteinatlas.org) were used to analyze mRNA expression and protein expression. The results are shown in Figure 1 and Table 2. The mRNA expression of the MCM complex in 20 types of cancer was detected for the first time and compared with that found in normal tissues using the Oncomine database. In multiple datasets, mRNA expression of MCM2/3/4/5/6/7 was significantly increased in BLC tissues. Table 2 shows the mRNA expression levels in different datasets. In Sanchez-Carbayo Bladder 2 Infiltrating Bladder Urothelial Carcinoma, compared with normal tissues, MCM2 over-expression was 4.918 times (p = 5.75E-21). While in Superficial BLC, the fold-change expression of MCM2 in adjacent normal tissues was 4.437 lower than in cancerous tissues (p = 8.53E-16).12 In Lee Bladder infiltrating Bladder Urothelial Carcinoma, the fold change in MCM2 mRNA expression in tumor tissues compared with adjacent non-malignant tissues was 2.225 (p = 1.47E-8). In Dyrskjot Bladder 3 datasets, MCM3 in superficial BLC was found in BLC tissues compared with that in normal tissues with a fold change of 2.308 (p = 4.44E-9),13 while Sanchez-Carbayo observed a 2.504-fold increase in MCM3 mRNA expression in BLC samples (p = 1.93E-19).12 Similarly, in the Sanchez-Carbayo infiltrating bladder urothelial carcinoma dataset, a 2.90-fold increase in MCM4 mRNA expression was found in BLC tissues compared to normal tissues (p = 1.32E-23)12 and in superficial BLC, MCM4 was found in BLC tissues compared with normal tissues with a fold change of 6.066 (p = 1.48E-14). In Dyrskjot Bladder 3 datasets, a 2.132-fold increase in MCM4 mRNA expression was found in BLC tissues compared with that in normal tissues (p = 8.96E-8). In Sanchez-Carbayo Bladder 2 Infiltrating Bladder Urothelial Carcinoma, compared with normal tissues, MCM5 over-expression was 4.683 times (p = 1.87E-12). While in Superficial BLC, the result demonstrates that MCM5 expression was higher in BLC tissues by 10.132-fold compared with normal tissues (p = 4.46E-21).12 In Dyrskjot Bladder 3 datasets, compared with normal tissues, MCM6 expression was 5.318-fold hyper-expressed in cancer tissues (p = 8.26E-6). In Dyrskjot Bladder 3 Infiltrating Bladder Urothelial Carcinoma, compared with normal tissues, MCM7 over-expression was 7.628 times (p = 3.01E-8), while in Superficial BLC, MCM7 was unregulated 10.974-fold in carcinoma compared with its expression in normal bladder tissues (p = 6.84E-14).13 Further, the mRNA expression of different MCM2-7 members was acquired from the R software running result based on TCGA database, which was different from ONCOMINE database. As is shown in Figure 2A-F, the mRNA expression of MCM2-7 members in BLC tissues was significantly higher than that in normal samples based on the TCGA database (p<0.05).
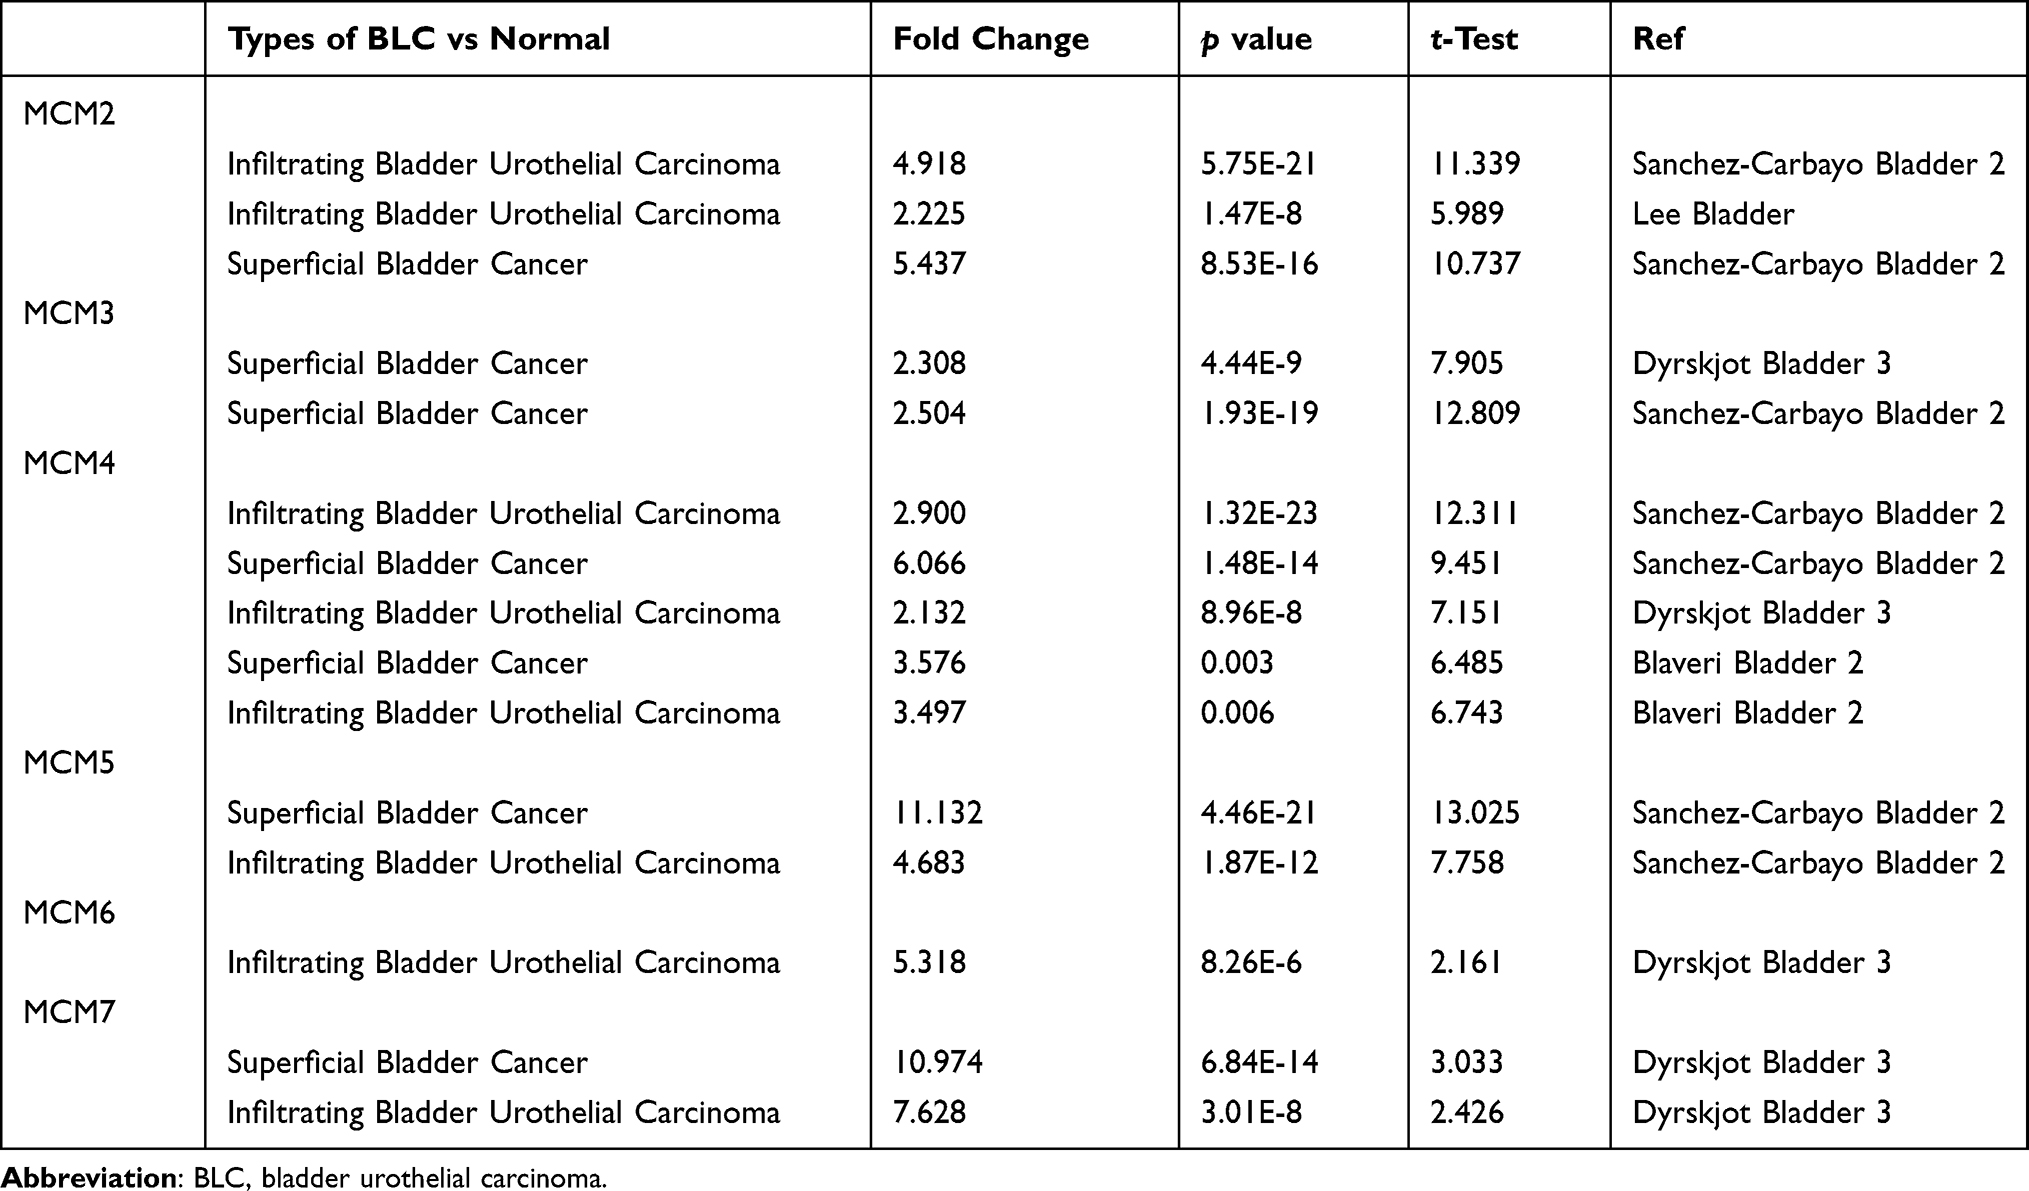 |
Table 2 Significant Changes of MCM 2–7 Complex Expression in Transcription Level Between BLC and Normal Bladder Tissues (ONCOMINE) |
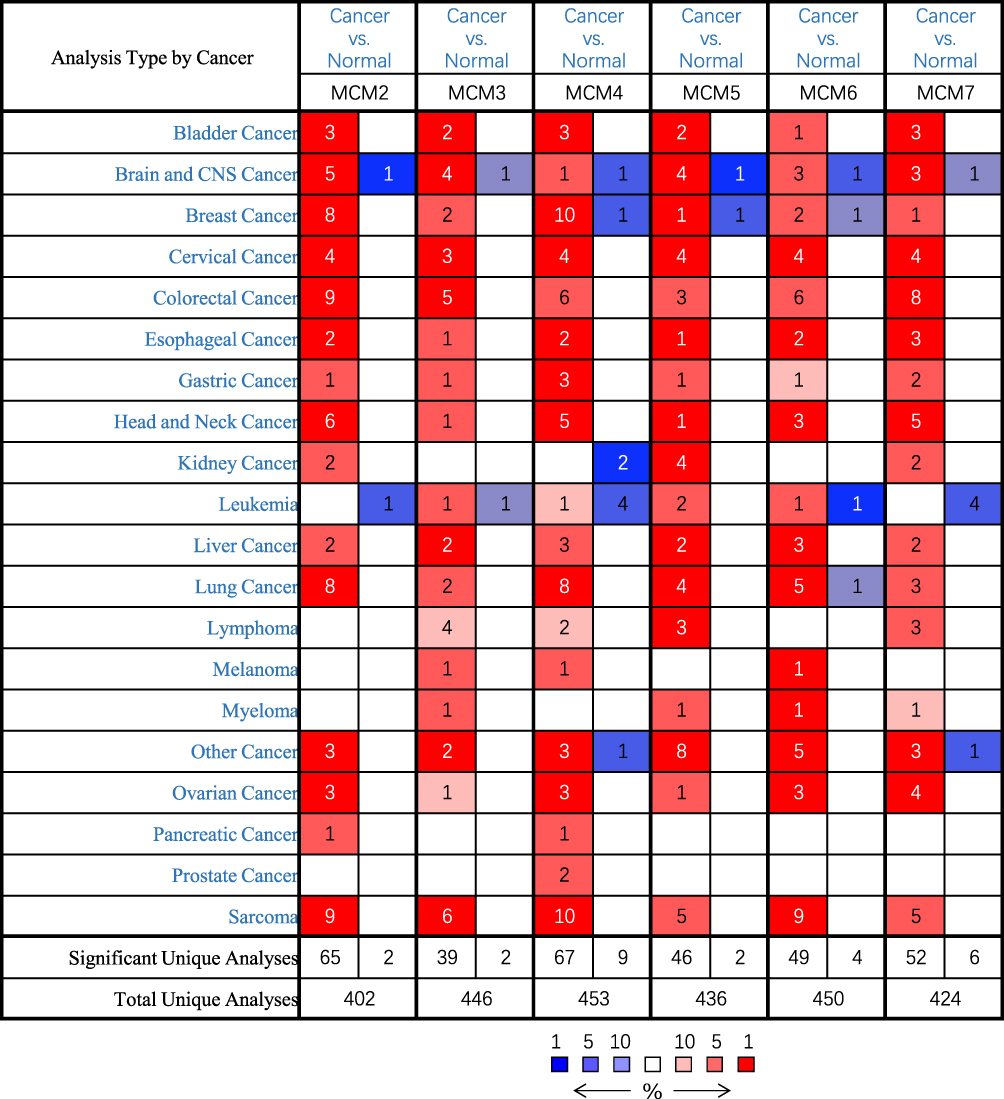 |
Figure 1 Transcriptional expression of MCM2/3/4/5/6/7 in 20 different types of cancer diseases (ONCOMINE database). Difference of transcriptional expression was compared by Student's t-test. Cut-off of p value and fold change were as following: p value: 0.01, fold change: 1.5, gene rank: 10%, data type: mRNA. |
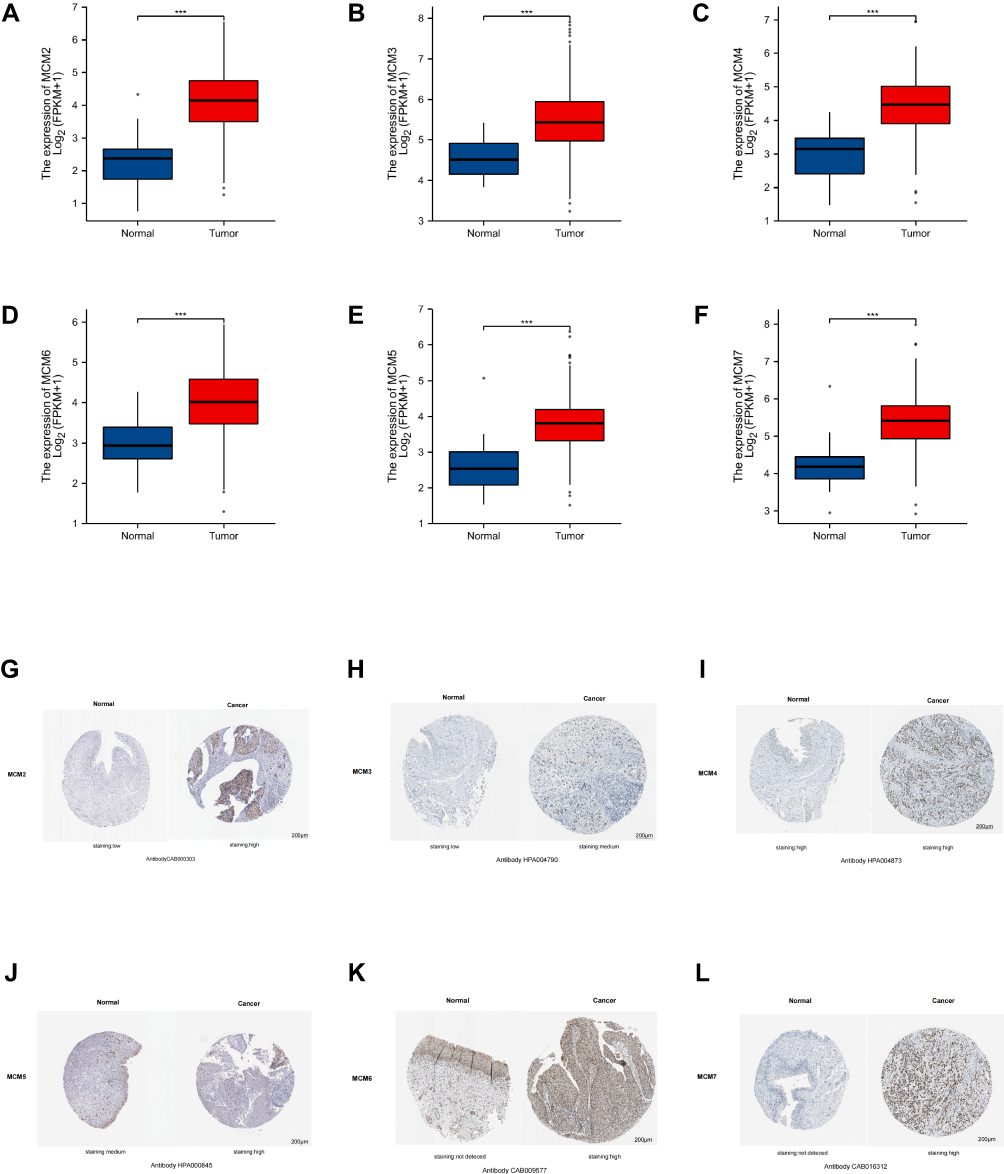 |
Figure 2 mRNA expression of distinct MCM2/3/4/5/6/7 members in BLC tissues and adjacent normal bladder tissues. mRNA expressions of MCM2/3/4/5/6/7 were found to be overexpressed in primary BLC tissues compared to normal samples (A–F). Immunohistochemistry images of MCM2/3/4/5/6/7 in bladder cancer (BLC) and normal bladder tissues (Human Protein Atlas). Low protein expressions of MCM2/3 were found in normal bladder tissues, while their medium and high protein expressions were observed in BLC tissues (G and H). Both normal bladder tissue and BLC tissues express high levels of MCM4 protein (I). Medium expression of MCM5 was observed in normal bladder tissue, whereas high expression of MCM5 protein was observed in BLC tissues (J). MCM6/7 proteins were not expressed in normal bladder tissues, whereas their high expressions were observed in BLC tissues (K and L). *** p < 0.001. |
After examining the MCM2-7 mRNA expression in BLC, to further explore the protein expression level of MCM2-7 in BLC, we used the Human Protein Atlas database. As shown in Figure 2G-L, MCM2 protein was low expressed in normal bladder tissue, whereas high expression of MCM2 protein was observed in BLC tissues. MCM3 protein was low expressed in normal bladder tissue, whereas medium expression of MCM3 protein was observed in BLC tissues. The protein expression of MCM4 in normal bladder tissues was the same as that in BLC tissues. Medium expression of MCM5 was observed in normal bladder tissue, whereas high expression of MCM5 protein was observed in BLC tissues. MCM6/7 proteins were not detected in normal bladder tissues, whereas high expressions of them were observed in BLC tissues. To sum up, our results showed that transcriptional expressions of MCM2-7 were overexpressed and so were MCM2/3/5/6/7 protein expressions in patients bearing BLC. For further verification, the mRNA expression of MCM2-7 complex in BLC tissues and cell lines was detected by qRT-PCR. As are shown in Figure 3A, when compared with the normal human uroepithelial cell line (SV‐HUC‐1), the expression of the MCM complex was significantly overexpressed in 2 different BLC cell lines (T24 and BIU‐87). As is shown in Figure 3B-G, in 16 pairs of BLC tissues and matched to adjacent tissues, MCM2/3/4/5/6/7 was upregulated in bladder cancer tissues compared with the corresponding non-carcinoma tissues.
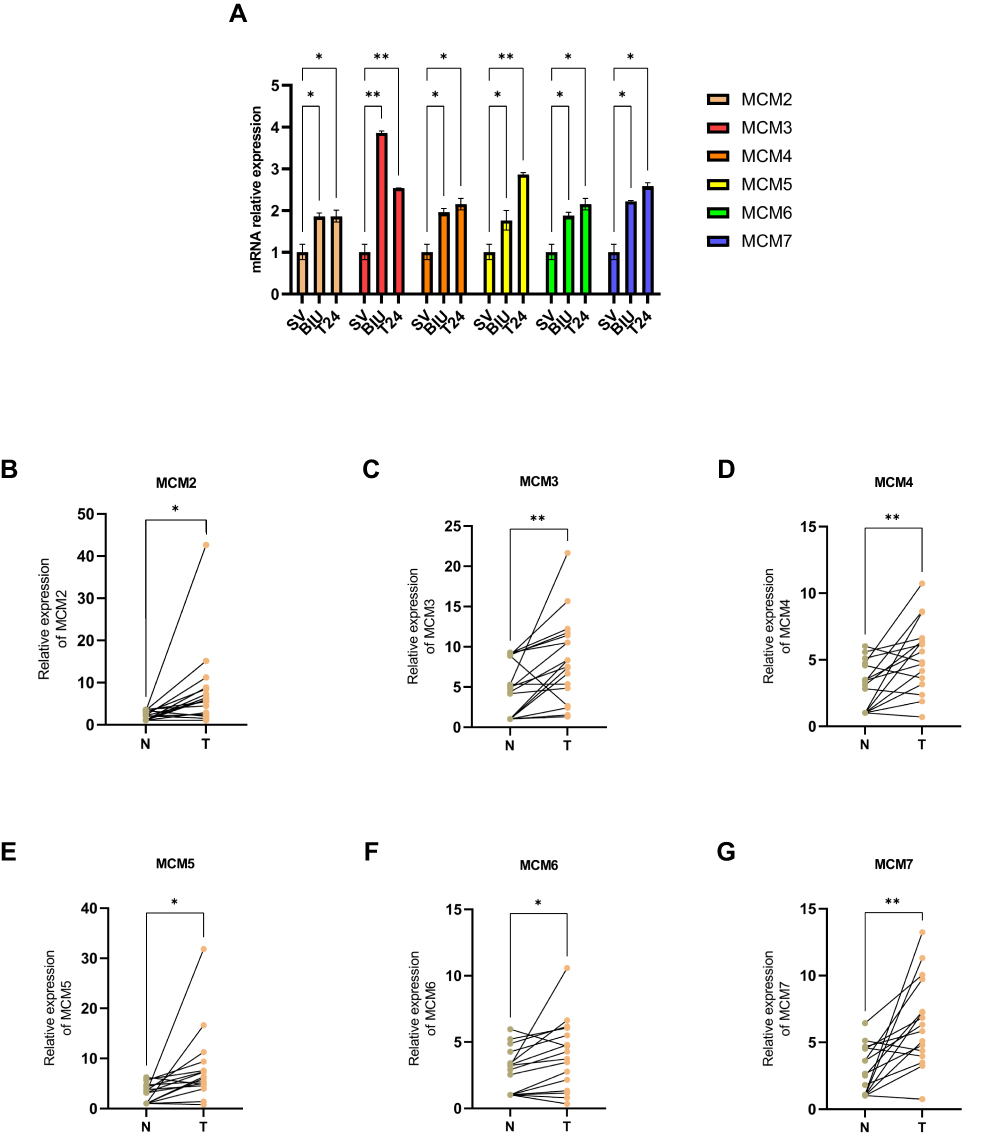 |
Figure 3 qRT-PCR was used to detect the mRNA expressions of MCM2/3/4/5/6/7 in normal human uroepithelial cell line (SV‐HUC‐1) and bladder cancer cell lines (BIU, T24) (A). mRNA expression of MCM2/3/4/5/6/7 was performed in BLC tissues and paired normal tissues (B–G). ns indicates not significant; *p <0.05; **p <0.01. |
These data above suggested that the protein expression of the MCM complex was significantly increased in BLC tissue compared to that in normal bladder tissue based on our experimental results and the public databases.
Correlation Between mRNA Expression of MCM2/3/4/5/6/7 Members and Clinicopathological Characteristics of BLC Patients
We further investigated the relationship between MCM2/3/4/5/6/7 mRNA expression and its association with the clinicopathological parameters, including histologic grade and tumor histology from TCGA datasets (https://portal.gdc.cancer.gov/), in patients with BLC. As is shown in Figure 4A-F, the mRNA expressions of MCM2/4/5/6/7 members in high-grade tumor tissues were significantly upregulated compared with low-grade tumor tissues. We found that MCM4/7 mRNA expressions have a positive correlation with tumor grades: with the increase in tumor grade, the mRNA expression tended to be higher. Similarly, as is shown in Figure 4G-L, the expression of MCM2/4/6/7 in the bladder papilloma was lower than that in the bladder non-papilloma, while no major differences in the amount of MCM3/5 mRNA expression were found between papillomas and non-papillomas. In conclusion, mRNA expression of MCM2/4/6/7 members was significantly correlated with the clinicopathological parameters of BLC patients.
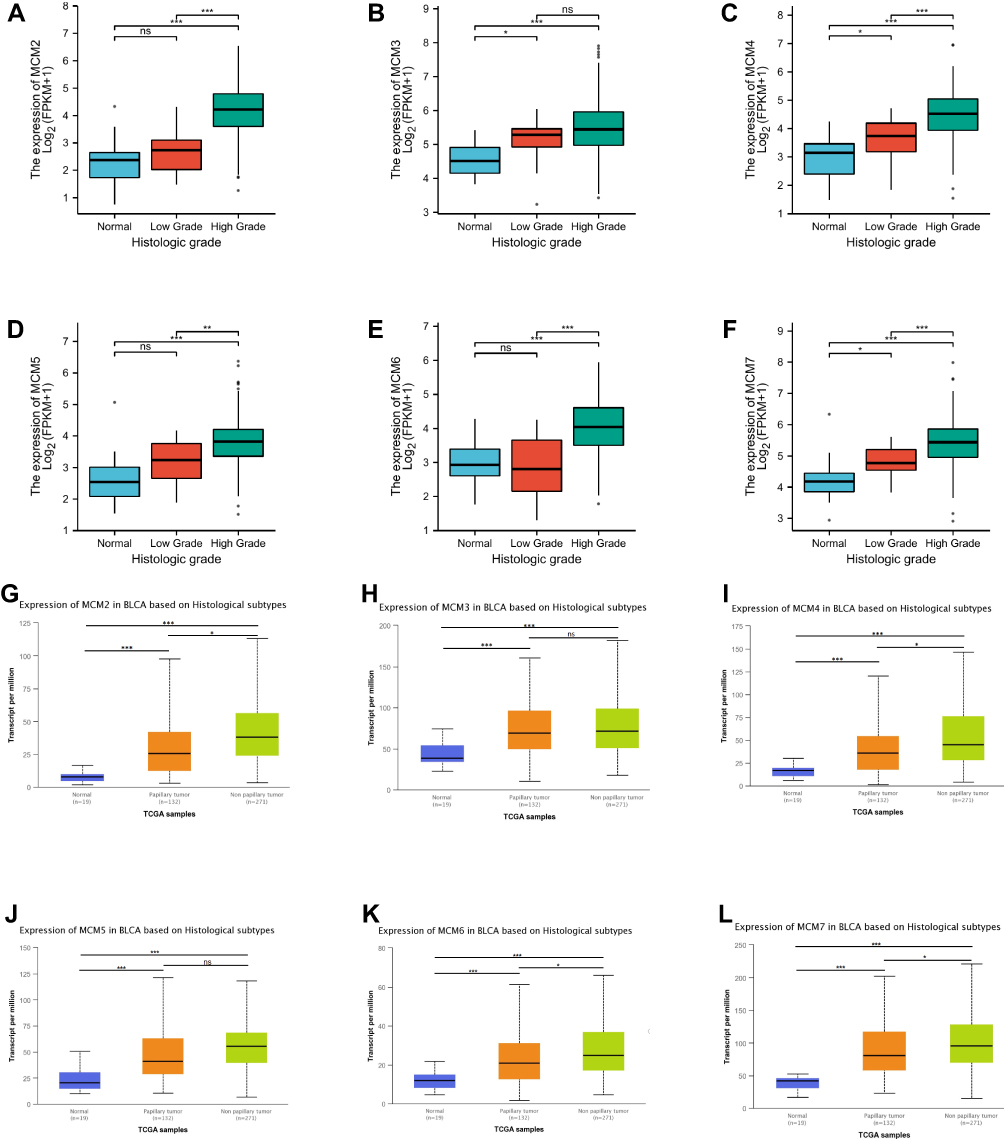 |
Figure 4 Relationship between mRNA expression of distinct MCM2/3/4/5/6/7 and individual histologic grade of BLC patients (A-F). The mRNA expressions of MCM3/4/7 were significantly related to patients’ histologic grade (B, C and F). Relationship between mRNA expression of distinct MCM2-7 complex members and individual tumor histology of BLC patients (G-L). The mRNA expressions of MCM2/4/6/7 were significantly related to patients’ histologic grade (G, I, K and L). ns indicates not significant; *p <0.05, **p <0.01, ***p <0.001. |
Prognostic Value of mRNA Expression of MCM2/3/4/5/6/7 in BLC Patients
We used Survival plots (http://gepia.cancer-pku.cn/detaill) to analyze the prognostic values of the MCM2/3/4/5/6/7 mRNA expressions in BLC patients. The mRNA expressions in MCM2/3/4/5/6/7 members were significantly associated with prognosis in patients with BLC. As is shown in Figure 5A-F, our results showed that higher mRNA expression in MCM2/4/5/6/7 members was associated with poorer DFS (disease free survival) in BLC patients. Next, we further analyzed the relationship between mRNA expression of MCM2/3/4/5/6/7 members and prognosis of BLC patients. Higher mRNA expression of MCM2 (HR = 2 and p = 0.0027), MCM4 (HR = 1.8 and p = 0.015), MCM5 (HR = 1.5 and p = 0.012), MCM6 (HR = 2.3 and p = 0.0076) and MCM7 (HR = 1.7 and p = 0.0015) was significantly associated with shorter DFS in patients with BLC, while the higher expression of MCM3 mRNA was not associated with DFS in patients with BLC. As is shown in Figure 5G-L, our results showed that higher mRNA expression of MCM2 (HR = 2.3 and p = 0.024), MCM4 (HR = 2.2 and p = 0.042) and MCM6 (HR = 2 and p = 0.022) members was associated with poorer OS in BLC patients, while the higher expression of MCM3 (HR = 0.94 and p = 0.69), MCM5 (HR = 1.1 and p = 0.62) and MCM7 (HR = 1 and p = 0.95) mRNA showed no correlation with prognosis for BLC patients. These results suggested that MCM/2/3/4/5/6/7 mRNA expressions were significantly associated with prognosis in patients with BLC and might serve as useful clinical biomarkers for predicting disease-free survival and overall survival in patients with BLC.
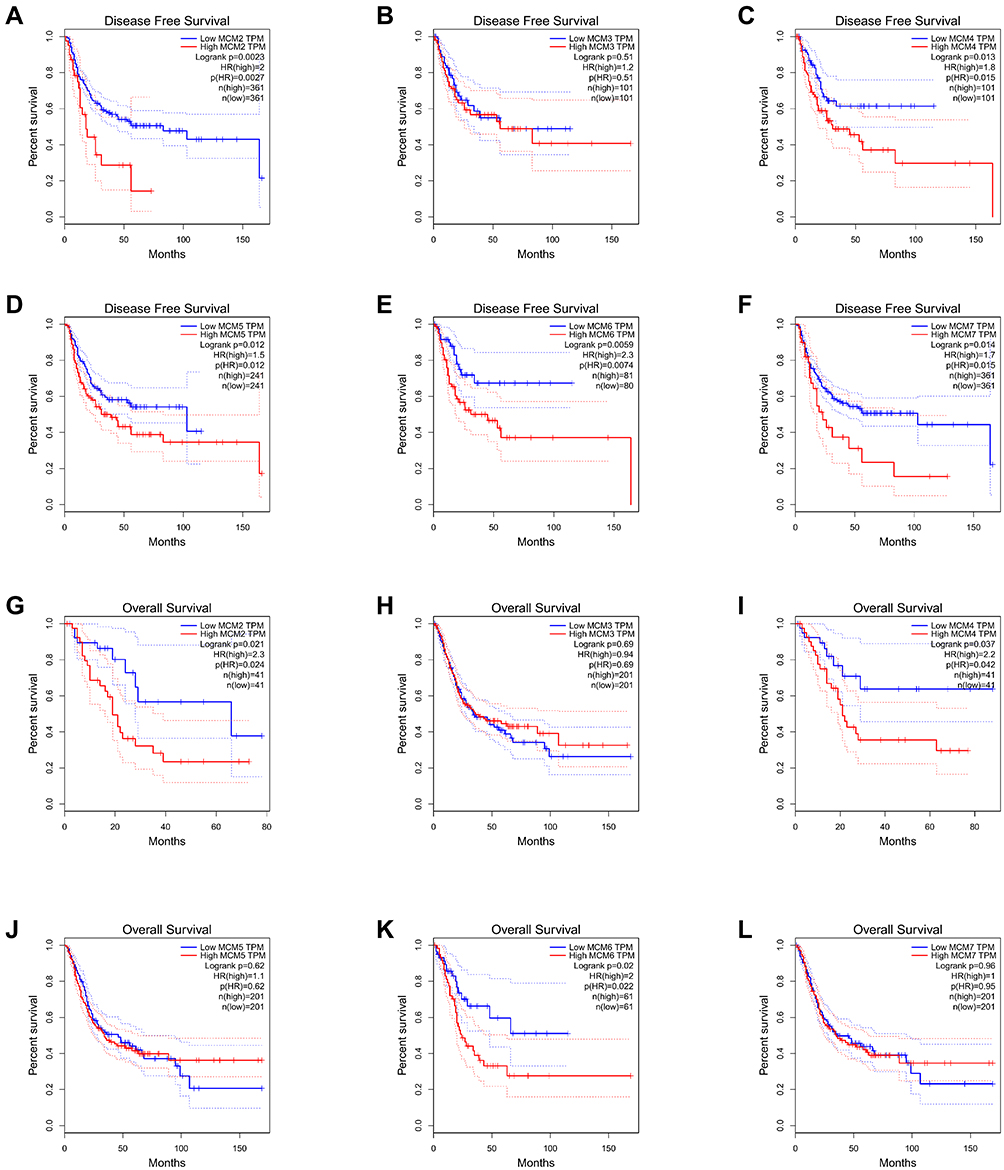 |
Figure 5 Prognostic value of mRNA expression of distinct MCM2/3/4/5/6/7 in BLC patients (A-F). The mRNA expression of MCM2/4/5/6/7 was associated with poor DFS (disease free survival) in BLC patients (A and C–F). Prognostic value of mRNA expression of distinct MCM2-7 members in BLC patients (overall survival) (G-L). The mRNA expression of MCM2/4/6 was associated with poor OS in BLC patients (G, I and K). |
Diagnostic Value of mRNA Expressions of MCM2/3/4/5/6/7 in BLC Patients
We further investigated the relationship between MCM2/3/4/5/6/7 mRNA expression and diagnostic efficacy and value of distinguishing between benign and malignant lesions from UCSC XENA (https://xenabrowser.net/datapages/), in patients with BLC.14 BLC (bladder urothelial carcinoma) and GTEX corresponding normal tissue data of TCGA were extracted. As shown in Figure 6, in distinguishing the outcomes of benign and malignant, the predictive ability of MCM2 variable was relatively accurate (AUC = 0.918, 95% CI:0.874–0.962), the predictive ability of MCM3 variable had certain accuracy (AUC = 0.823, 95% CI:0.7666–0.880), the predictive ability MCM4 variable had certain accuracy (AUC = 0.876, 95% CI:0.833–0.919), the predictive ability of MCM5 variable had certain accuracy (AUC = 0.863, 95% CI:0.796–0.929), the predictive ability of MCM6 variable had certain accuracy (AUC = 0.821, 95% CI:0.764–0.877), the predictive ability of MCM7 variable had certain accuracy (AUC = 0.822, 95% CI:0.7533–0.891). These results indicated that mRNA expressions of MCM2/3/4/5/6/7 were significantly associated with the diagnosis of BLC, and they might be useful as candidate biomarkers of diagnostic performance for BLC.
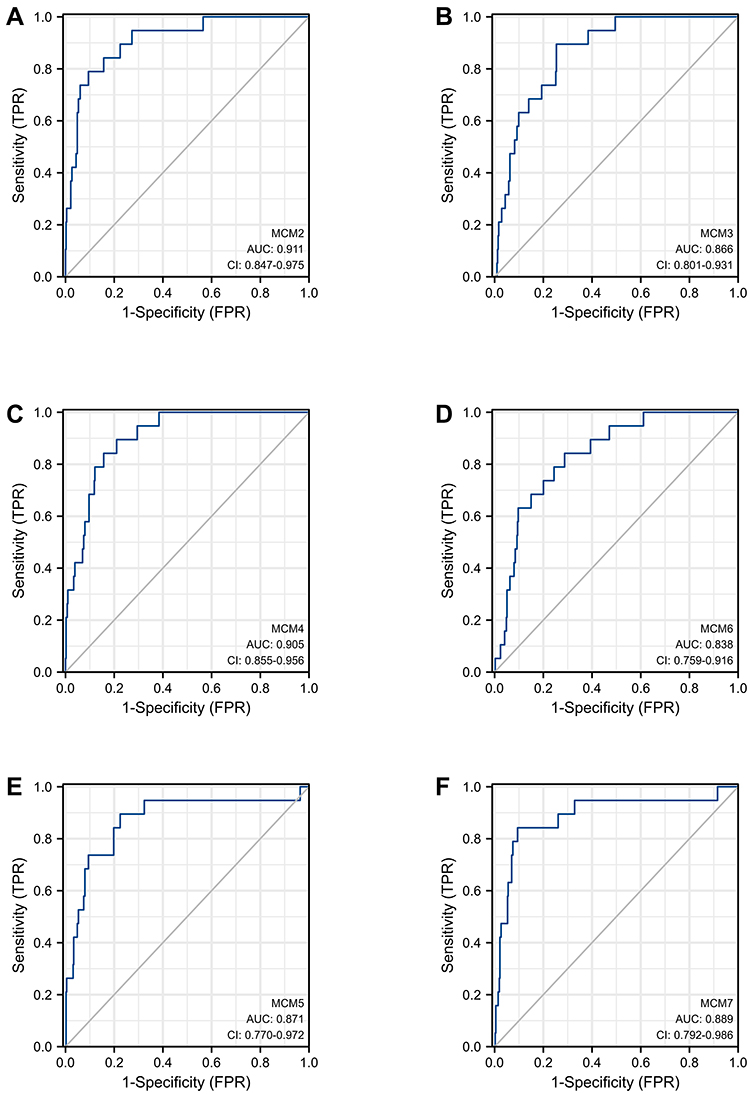 |
Figure 6 Receiver operating characteristic (ROC) curve for MCM2-7 mRNA expressions in normal bladder tissue and bladder cancer (BLC) (A-F). |
Genetic Mutations in the MCM Complex and Their Associations with OS and DFS of BLC Patients
We analyzed the association of MCM2-7 alterations with OS and DFS in patients with BLC. We interrogated The Cancer Genome Atlas BLC data set by using the cBioPortal web tool (http://www.cbioportal.org/). As is shown in Figure 7, high mutation rate was observed in BLC patients. MCM2/3/4/5/6/7 members were altered in 160 (39%) of queried patients and the mutation rate was 39%. MCM4, MCM2, MCM3 and MCM7 had the highest degree of variation, and the mutation rates were 16%, 14%, 10%, and 10%, respectively. Results from the Kaplan–Meier plot and P value showed that genetic variation in MCM2-7 was not statistically correlated with OS (p = 0.871) and DFS (p = 0.442) in BLC patients (Figure 7C and D). The results revealed that dysregulation of the MCM complex was not primarily attributed to DNA alterations. Further analysis revealed that MCM complex mRNA was regulated by a number of non-coding RNAs, which indicated that regulation of non-coding RNAs might play a vital role in alterations of the MCM complex (Figure 7E).
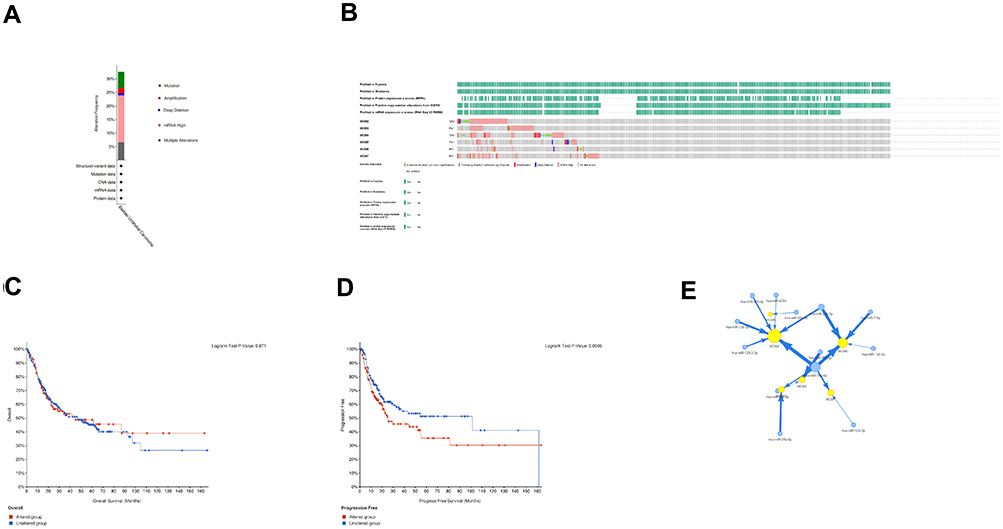 |
Figure 7 The genetic alteration of MCM complex in BLC (A). Alteration frequency of MCM2/3/4/5/6/7 based on the cBioProtal database (B). Kaplan–Meier plots revealed the overall survival and progression-free survival of BLC patients with or without MCM complex alterations (C and D). The network among MCM2/3/4/5/6/7 and miRNAs (E). |
Predicted Functions and Pathways of the Changes in MCM2/3/4/5/6/7 and the 50 Most Frequently Altered Neighbor Genes in Patients with BLC
Functions of MCM2/3/4/5/6/7 as well as the 50 frequently altered neighbor genes were analyzed by GO and KEGG pathway enrichment analysis using limma packages of R software.15 We constructed a protein interaction network including MCM2-7 complex as well as the 50 most frequently altered neighbor genes using the STRING interactive database (Figure 8A). These genes are able to interact with the Mcm2–7 complex. As is shown in Figure 8B, for predicting the functional roles of target host genes, we performed gene ontology enrichment analysis on the basis of three aspects including biological process, cell composition and molecular function. Biological processes such as GO:0006260 (DNA replication), GO:0006261 (DNA-dependent DNA replication), GO:0033260 (nuclear DNA replication), GO:0044786 (cell cycle DNA replication), GO:0071103 (DNA conformation change), were significantly regulated by MCM2/3/4/5/6/7 alterations in BLC. Cellular components, including GO:0098687 (chromosomal region), GO:0000793 (condensed chromosome), GO:0000775 (chromosome, centromeric region), GO:0000779 (condensed chromosome, centromeric region), GO:0000776 (kinetochore), were significantly associated with the MCM2/3/4/5/6/7 alterations. Molecular functions such as GO:0140097 (catalytic activity, acting on DNA), GO:0003678 (DNA helicase activity), GO:0003688 (DNA replication origin binding), GO:0004386 (helicase activity), GO:0043138 (3’-5’ DNA helicase activity), were also affected by MCM2/3/4/5/6/7 mutations. KEGG analysis could identify the pathways and frequently altered adjacent genes related to MCM2/3/4/5/6/7 alterations function. In KEGG analysis, 5 pathways, including hsa03030 (DNA replication), hsa04110 (Cell cycle), hsa03430 (Mismatch repair), hsa03420 (Nucleotide excision repair), hsa04114 (Oocyte meiosis), were associated with functional changes in MCM2/3/4/5/6/7 mutations in BLC (Table 3). These data indicated that the MCM complex was involved in DNA replication, the cell cycle, DNA helicase activity, and mismatch repair.
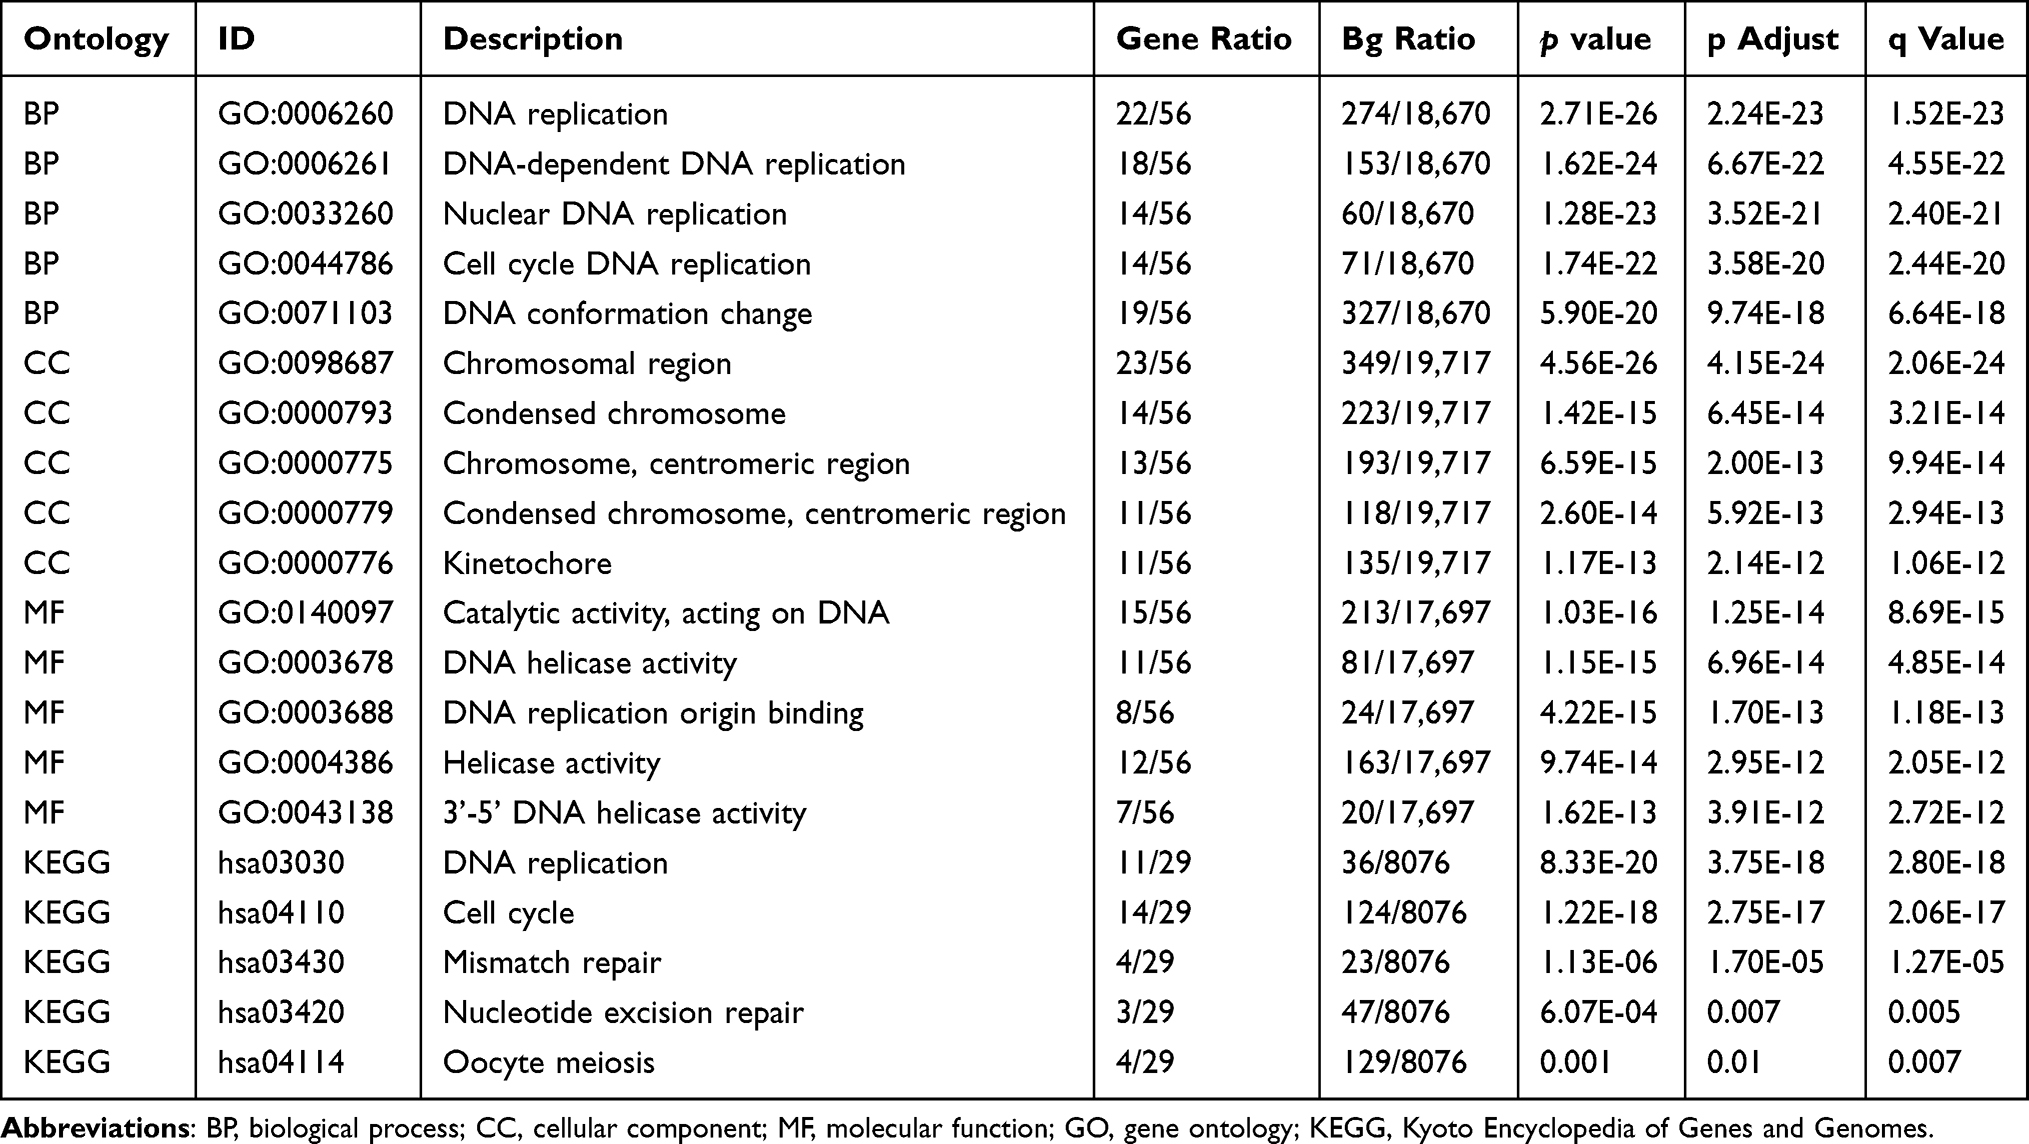 |
Table 3 GO (Gene Ontology) and KEGG (Kyoto Encyclopedia of Genes and Genomes) Functional Enrichment Analyses of MCM2/3/4/5/6/7 and Their 50 Associated Neighbor Genes |
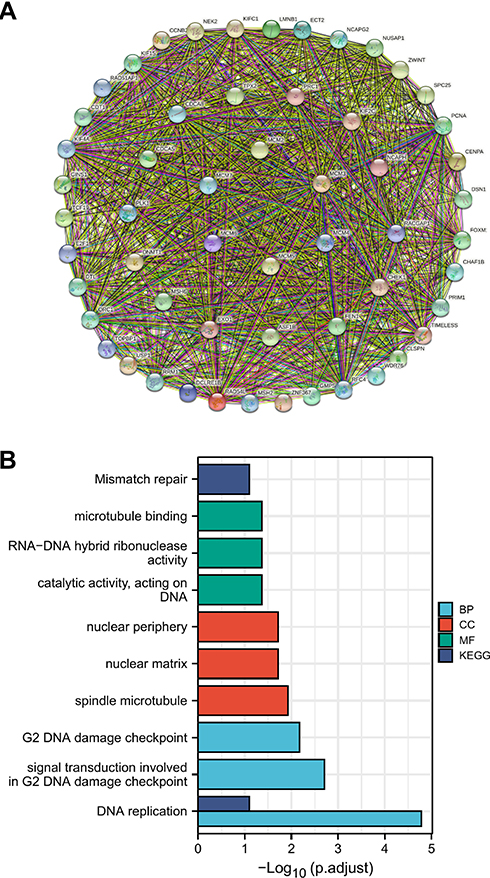 |
Figure 8 The network for MCM2/3/4/5/6/7 and the 50 most frequently altered neighbor genes (A). The enrichment analysis of MCM2/3/4/5/6/7 and the 50 most frequently altered neighbor genes associated with MCM complex alterations (B). |
Immune Infiltrations Analysis of the MCM Complex in BLC
Correlations between genes and immune infiltrations were estimated using TIMER. The abundance of CD8 + cell, neutrophil and dendritic cell showed positive associations with all the members of MCM 2/3/4/5/6/7. The abundance of CD4 + cell was not related to the expression of MCM 2/3/4/5/6/7, while the abundance of B cell was not related to the expression of the MCM complex except for MCM3. The abundance of macrophage showed positive associations with MCM 2/4/5/6 and showed no associations with MCM 3/7 (Figure 9A). To further reveal the somatic copy number alterations (SCNA) of the MCM complex in patients with BLC, we found that the SCNA of MCM3/6/7 was significantly correlated with the infiltrating levels of CD4+ T cells, neutrophils, and dendritic cells. The SCNA of MCM2 had a significant correlation with the infiltration level of CD4 + T cells and neutrophils, while that of MCM4 was in significant connections with the infiltrating levels of neutrophils. Meanwhile, the SCNA of MCM5 was significantly associated with dendritic cells, B cells, neutrophils, macrophages and CD8+ T cells (Figure 9B). Collectively, the MCM complex was closely related to the immune infiltration in patients bearing BLC. These findings indicate that the MCM complex could have a major impact on the immune status of patients with BLC.
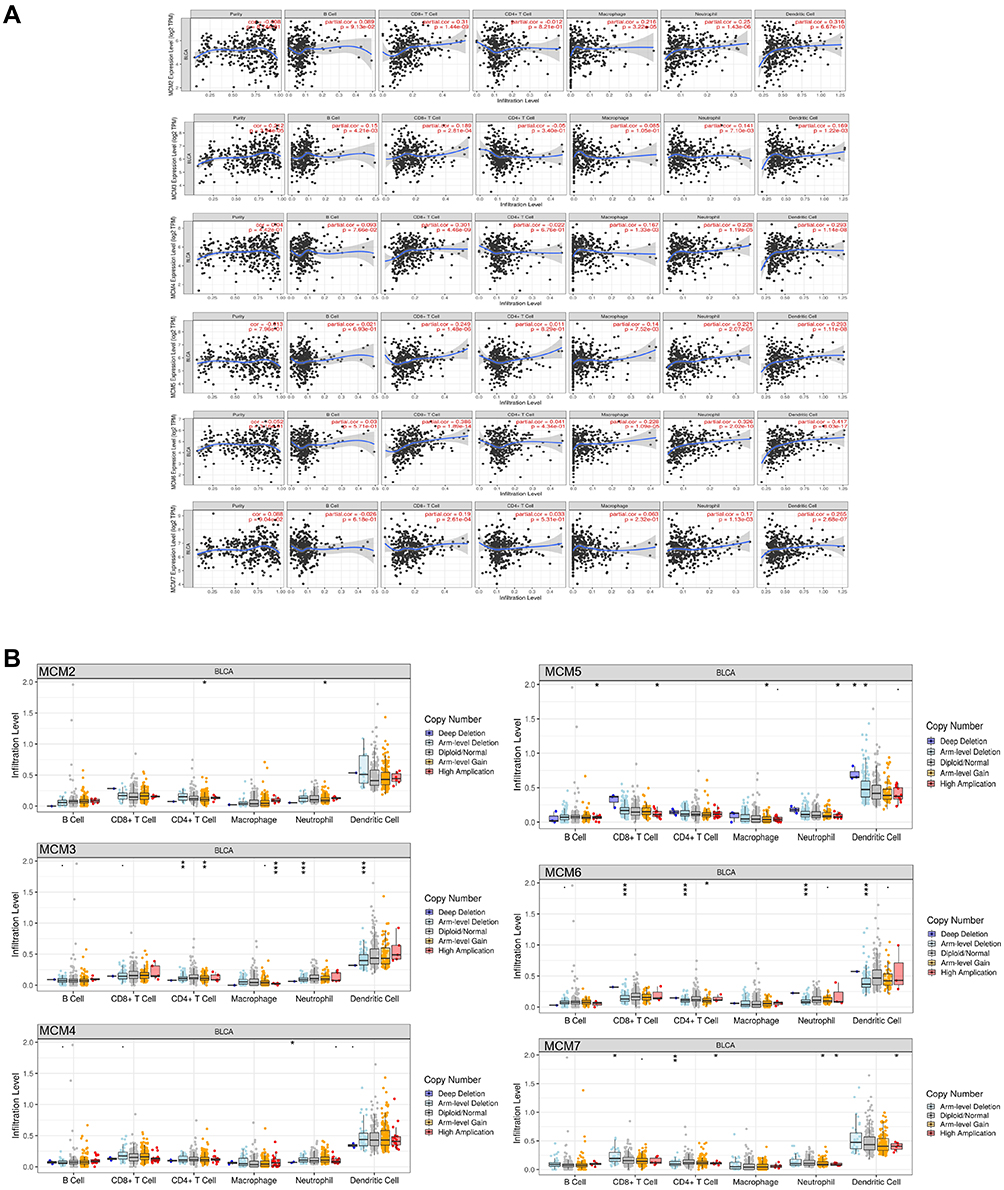 |
Figure 9 Association between the MCM2/3/4/5/6/7 expression level with immune infiltration level (A), and the comparison of tumor infiltration levels in BLC with different somatic copy number alterations for MCM2/3/4/5/6/7 (B). ns indicates not significant; p ≥ 0.05; * p < 0.05; ** p<0.01; and *** p <0.001. |
Verification of the Drug Sensitivity of the MCM Complex
For drug susceptibility analysis, through the GSCALite platform we summarized the correlation between the MCM2/3/4/5/6/7 expressions and the sensitivity of Genomics of Drug Sensitivity in Cancer (GDSC) and Cancer Therapeutics Response Portal (CTRP) drugs (top 30) in pan-cancer (Figure 10). We found that the drug sensitivity of the MCM complex was significantly associated with chemotherapy resistance and further confirmed that the MCM complex was involved in multidrug resistance in BLC patients.
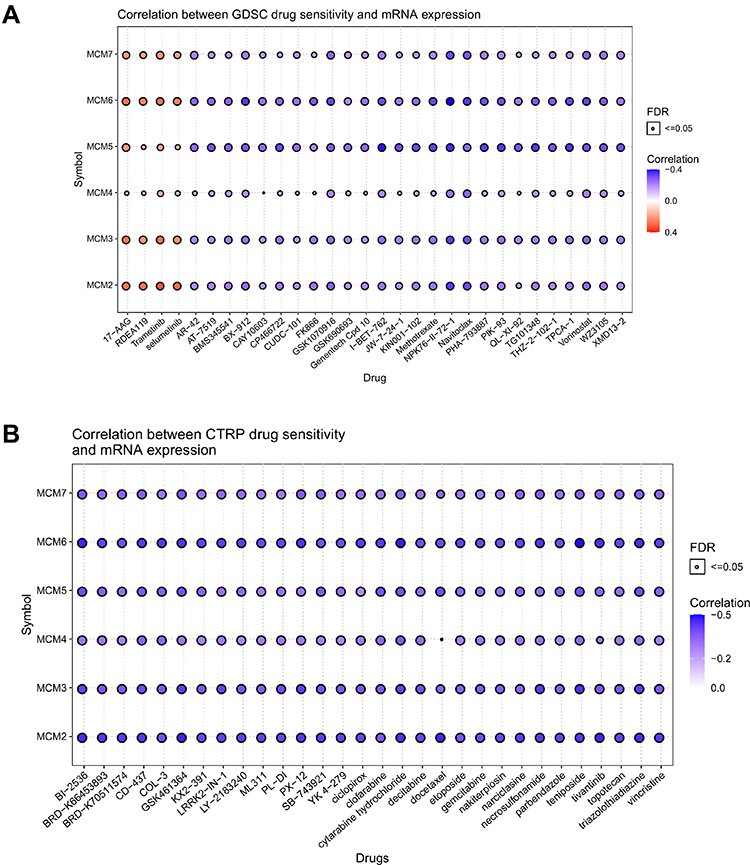 |
Figure 10 Drug resistance analysis of MCM2/3/4/5/6/7 based on GDSC (A) and CTRP (B) using the GSCALite web server. |
Pathway Enrichment of the MCM Complex in BLC
The pathways of the MCM complex were enriched with GSCALite. There were 10 pathways which were related to the function of MCM2/3/4/5/6/7 in BLC (Figure 11). The expressions of MCM2/3/4/5/6/7 were in a high level in apoptosis and the expressions of the MCM complex were also at a high level in cell cycle. The expressions of the MCM complex were almost inhibited in RAS/MAPK and hormone estrogen receptor (ER)-related pathways. These results indicated that the multiple signaling pathways and the biological function might be regulated by changes in the target genes.
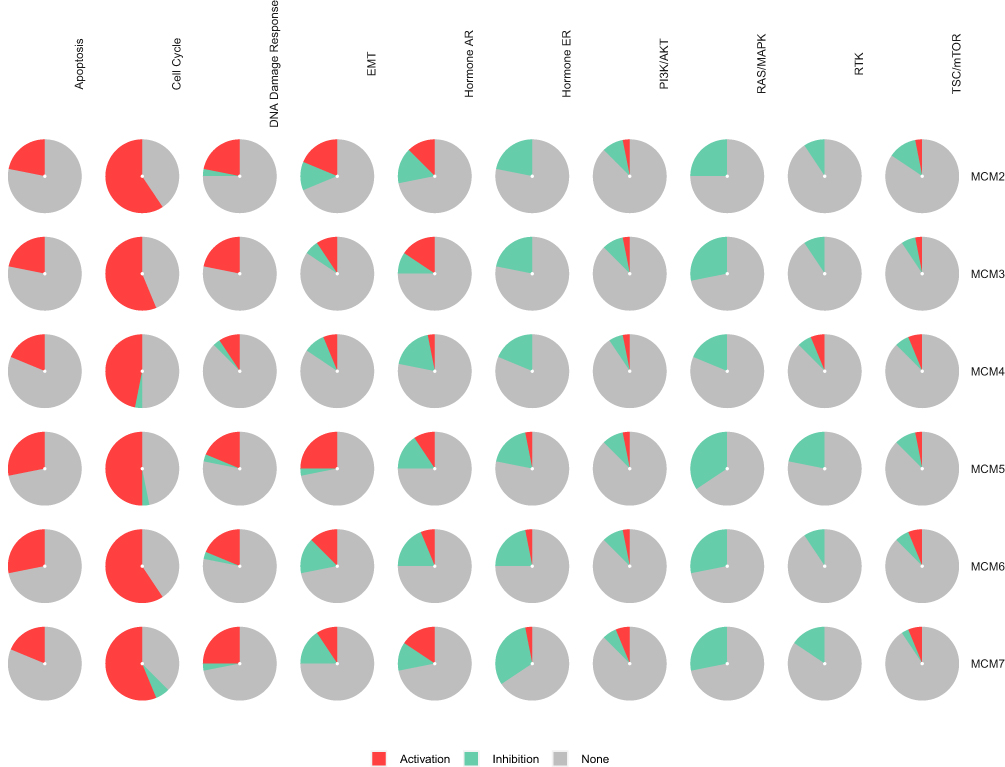 |
Figure 11 The pathway enrichment analysis of MCM2/3/4/5/6/7 genes with the GSCALite web server. |
Discussion
The minichromosome maintenance (MCM) complex is a group of six structurally related protein subunits that assemble to form hexamers.16 The MCM proteins are believed to be closely associated with the development of tumor. MCM2-7 complex proteins can be found throughout the cell cycle, so they are useful as a universal biomarker for tumor growth. To date, dysregulation of the MCM complex has been widely observed in many types of cancer, such as common digestive tract tumors, gastric cancer,17 liver cancer,18 colon cancer,19 prostate cancer,20 kidney renal clear cell carcinoma,21 glioma,22 as well as ovarian cancer.23 Compared with tumor proliferation index markers such as antigen Ki-67, the microchromosome maintenance proteins stand for potentially more accurate proliferation biomarkers for determining proliferation scores within tumors.24 Although the role of MCM complex in oncogenesis and prognosis of several cancers has been partially confirmed, no comprehensive analysis of the MCM complex in BLC has been conducted in the literature to date. Hence, we systematically analyzed mRNA expression and protein levels, protein interactions, functional enrichment, diagnostic value, immune infiltration and prognostic value of the MCM complex in detail and provided experimental validation. In this study, the results showed that the mRNA levels of MCM complex were significantly increased in BLC tissues compared to those in normal bladder tissues from the TCGA database and GTEx database, while the protein levels of all MCMs except for MCM4 were increased, which indicated that MCM4 might be regulated by the non-coding RNA.
Our study revealed that the expression of MCM2 was significantly increased in BLC tissues and cell lines, which was associated with OS and DFS as well as MCM4/6. Burger M et al found that MCM2 was an independent predictor of recurrence in Ta/T1 BC, which predicted a risk of cancer recurrence in stage Ta/T1 BLC, and was more accurate than CK20, Ki67 and histological grade.25 Kunal Kapoor et al26 reported that immunocytochemical detection of MCM2 from urinary samples was detected to own a good sensitivity and specificity for the diagnosis of BLC and it might be used as a potential biomarker for the diagnosis of BLC. Our study indicated that the variable MCM2 had a high accuracy in predicting the outcome of benign and malignant (AUC = 0.911, 95% CI = 0.847–0.975). High MCM2 expression was significantly correlated with poor OS and DFS, as well as histologic grade, suggesting an oncogenic role of MCM2.
Until now, MCM3 has been reported to be overexpressed in various tumors and its specific high expression in cancer cells makes it a promising biomarker for the detection of cancer,27 but little is known about the expression and role of MCM3 in BLC. In our current study, the expression of MCM3 in BLC tissues was upregulated compared with the normal tissues. However, MCM3 expression had nothing to do with histologic grade in BLC patients. No statistically significant correlation was found between high MCM3 expression and DFS and OS in BLC. The reason for this phenomenon may be due to the fact that the MCM3 is regulated by miR-26p-5p according to the miRNA network (Figure 7E).
The MCM4 gene expression is downregulated in metastatic advanced BLCs and plays an essential role in replication and cell cycle.28 However, the expression of MCM4 in BLC tissues was higher than that in normal tissues in our study, while the protein levels of all MCM4 were equal. The reason for this phenomenon may be that this could be involved with transcriptional as well as posttranscriptional regulatory mechanisms, such as the regulation of non-coding RNA.29 The point mutation in MCM4 (F345I, G364R, and G486D) that disturbs MCM2-7 function causes genomic instability, which results in tumorigenesis.30,31 Furthermore, high MCM4 expression was significantly associated with poor DFS, OS and tumor grade in patients with BLC, which seemed consistent with the role of MCM4 as an oncogene. In our study, we showed that patients with high MCM5 expression group showed significantly shorter DFS compared with lower MCM5 expression. The research found that the expression level of MCM5 was increased in muscle-invasive bladder cancer compared with non-muscle-invasive bladder cancer and was relatively high in high-grade BLC.32 Iawen Hsu et al8 reported that estrogen receptor beta promoted the BLC cell proliferation and invasion by up-regulating the expression of MCM5. Furthermore, we demonstrated that MCM5 expression in BLC tissues was higher than that in normal bladder tissues, while an elevated expression was not associated with a shorter overall survival time among BLC patients. In an earlier proof-of-concept study, elevated Mcm5 levels in urine cell sediments were strongly predictive of bladder cancer.33 MCM5 urine expression had moderate sensitivity to detect non-muscle invasive relapse and could correctly diagnose T1 stage relapse or high-grade tumor.34 Immunocytochemistry with MCM5 antibodies from urine can improve the ability of urinary cytology to detect urothelial carcinoma of the bladder.35 Another study also indicated that MCM5 was a novel biomarker for the diagnosis of ovarian cancer.36 In predicting the outcome of benign and malignant, MCM5 had certain accuracy (AUC = 0.871, 95% CI: 0.770–0.972) based on our study, so that we could infer that MCM5 might be a promising early diagnostic biomarker for BLC.
There are few studies investigating the role of MCM6 in BLC. DNA mutation is a potent driver of tumorigenesis in replicating cells.37 The MCM6 gene mutation value is the lowest in the MCM complex based on our study, so MCM6 is rarely reported in the literature for BLC. The expression of MCM6 was significantly increased in breast cancer compared with the corresponding paracancerous tissues,38 which was similar to the PCR tests for the expression of MCM6 in BLC tissues we collected. Additionally, MCM4 and MCM6 expressions have been linked to the tumor stage.39 Furthermore, patients with increased MCM6 expression had worse long-term survival and higher cumulative recurrence rates.40 In our study, high MCM6 expression was significantly associated with poor OS and DFS in all BLC patients, and had a relatively high accuracy (AUC = 0.838, 95% CI: 0.759–0.916) in differentiating benign and malignant bladder tumors. The expression of MCM6/7 was closely correlated with the four main types of immune cells (CD8+ T cells, CD4+ T cells, neutrophils and dendritic cells). These results indicated that the MCM6/7 might play a key role in the prognosis and the immune status of BLC patients.
As an essential member of the MCM complex, MCM7 plays a crucial role in maintaining the initial stability of DNA replication,41 and MCM7 participates in the degradation of MCM2-7 in a ubiquitin-dependent manner during termination.42 By inhibiting the expression of MCM7, it could effectively inhibit the growth of BLC cells.43 Kim et al found that cisplatin resistance in BLC was associated with up-regulation of MCM7 expression.44 Moreover, it has been shown that MCM4 and MCM7 are better markers than Ki-67 for detecting esophageal cancers.45 In our study, we demonstrated that MCM7 expression was higher in BLC tissues than that in normal tissues and that this expression was positively correlated with clinical tumor grade and poor DFS in BLC.
In this study, a bioinformatics method was used to analyze transcriptional levels, mutations, and their association with the main pathological parameters of BLC patients and to explore the potential biological role and prognostic value of the MCM complex in BLC, which brought important insights into the clinical application of the MCM complex as potential diagnostic biomarkers, prognostic factors and therapeutic targets. Clearly, this study has some limitations. First, the molecular mechanisms of the role of the MCM complex in BLC should be further explored via experiments in vivo and in vitro. In addition, since this study was a retrospective study, it required further investigation to support the results.
Conclusion
A comprehensive analysis of the role of the MCM complex in BLC is presented here, which takes into account the expression levels, genetic alterations, PPI, immune infiltration, drug sensitivity as well as prognostic factors. We found that higher expressions of the MCM2/4/6/7 were detected to be significantly associated with worse pathological characteristics of patients bearing BLC, including histologic grade, tumor histology, poor OS and DFS. The MCM complex has moderate-to-high accuracy in the differential diagnosis of benign and malignant bladder tumors, so they might become potential diagnostic markers for BLC. MCM2-7 were significantly associated with immune infiltration and chemotherapy resistance. In summary, the results of this study indicated that the MCM complex especially MCM2/4/6/7 might be potential molecular therapeutic targets for BLC treatment and might be useful biomarkers for diagnosis and prognosis.
Data Sharing Statement
The original contributions presented in this study are included in the article.
Ethics Approval and Consent to Participate
This study was conducted in accordance with the Ethical Standards of the Institutional Ethics Committee of First Affiliated Hospital of Nanchang University and with the 1964 Helsinki declaration and its later amendments or comparable Ethical Standards. All patients provided informed consent.
Acknowledgments
We thank the two independent pathologists who confirmed the pathologic diagnosis of tumor tissues. Co-first authors: Chen Ru, Hu Bing, and Jiang Ming.
Funding
There is no funding to report.
Disclosure
The authors declare no conflicts of interest in relation to this work.
References
1. Antoni S, Ferlay J, Soerjomataram I, Znaor A, Jemal A, Bray F. Bladder Cancer Incidence and Mortality: a Global Overview and Recent Trends. Eur Urol. 2017;71(1):96–108. doi:10.1016/j.eururo.2016.06.010
2. Saginala K, Barsouk A, Aluru JS, Rawla P, Padala SA, Barsouk A. Epidemiology of Bladder Cancer. Med Sci. 2020;8(1):548. doi:10.3390/medsci8010015
3. Vedham V, Verma M. Cancer-associated infectious agents and epigenetic regulation. Methods Mol Biol. 2015;1238:333–354. doi:10.1007/978-1-4939-1804-1_18
4. Ishimi Y. Corrigendum: regulation of MCM2-7 function. Genes Genet Syst. 2019;94(3):139. doi:10.1266/ggs.94.139
5. Maiorano D, Lutzmann M, Mechali M. MCM proteins and DNA replication. Curr Opin Cell Biol. 2006;18(2):130–136. doi:10.1016/j.ceb.2006.02.006
6. Deegan TD, Diffley JF. MCM: one ring to rule them all. Curr Opin Struct Biol. 2016;37:145–151. doi:10.1016/j.sbi.2016.01.014
7. Lindner K, Gregan J, Montgomery S, Kearsey SE. Essential role of MCM proteins in premeiotic DNA replication. Mol Biol Cell. 2002;13(2):435–444. doi:10.1091/mbc.01-11-0537
8. Hsu I, Chuang KL, Slavin S, et al. Suppression of ERbeta signaling via ERbeta knockout or antagonist protects against bladder cancer development. Carcinogenesis. 2014;35(3):651–661. doi:10.1093/carcin/bgt348
9. Rhodes DR, Yu J, Shanker K, et al. ONCOMINE: a cancer microarray database and integrated data-mining platform. Neoplasia. 2004;6(1):1–6. doi:10.1016/s1476-5586(04
10. Chandrashekar DS, Bashel B, Balasubramanya SAH, et al. UALCAN: a Portal for Facilitating Tumor Subgroup Gene Expression and Survival Analyses. Neoplasia. 2017;19(8):649–658. doi:10.1016/j.neo.2017.05.002
11. Li B, Severson E, Pignon JC, et al. Comprehensive analyses of tumor immunity: implications for cancer immunotherapy. Genome Biol. 2016;17(1):174. doi:10.1186/s13059-016-1028-7
12. Villanueva J, Shaffer DR, Philip J, et al. Differential exoprotease activities confer tumor-specific serum peptidome patterns. J Clin Invest. 2006;116(1):271–284. doi:10.1172/JCI26022
13. Dyrskjot L, Kruhoffer M, Thykjaer T, et al. Gene expression in the urinary bladder: a common carcinoma in situ gene expression signature exists disregarding histopathological classification. Cancer Res. 2004;64(11):4040–4048. doi:10.1158/0008-5472.CAN-03-3620
14. Vivian J, Rao AA, Nothaft FA, et al. Toil enables reproducible, open source, big biomedical data analyses. Nat Biotechnol. 2017;35(4):314–316. doi:10.1038/nbt.3772
15. Yu G, Wang LG, Han Y, He QY. clusterProfiler: an R package for comparing biological themes among gene clusters. OMICS. 2012;16(5):284–287. doi:10.1089/omi.2011.0118
16. Zeng T, Guan Y, Li YK, et al. The DNA replication regulator MCM6: an emerging cancer biomarker and target. Clin Chim Acta. 2021;517:92–98. doi:10.1016/j.cca.2021.02.005
17. Guo F, Kong WN, Feng YC, et al. Comprehensive Analysis of the Expression and Prognosis for MCMs in Human Gastric Cancer. Technol Cancer Res Treat. 2020;19:1533033820970688. doi:10.1177/1533033820970688
18. Jia W, Xie L, Wang X, et al. The impact of MCM6 on hepatocellular carcinoma in a Southern Chinese Zhuang population. Biomed Pharmacother. 2020;127:110171. doi:10.1016/j.biopha.2020.110171
19. Burger M. MCM2 and MCM5 as prognostic markers in colon cancer: a worthwhile approach. Dig Dis Sci. 2009;54(2):197–198. doi:10.1007/s10620-008-0416-6
20. Meng MV, Grossfeld GD, Williams GH, et al. Minichromosome maintenance protein 2 expression in prostate: characterization and association with outcome after therapy for cancer. Clin Cancer Res. 2001;7(9):2712–2718.
21. Jang NR, Baek J, Ko Y, Song PH, Gu MJ. High MCM6 Expression as a Potential Prognostic Marker in Clear-cell Renal Cell Carcinoma. In Vivo (Brooklyn). 2021;35(1):299–306. doi:10.21873/invivo.12259
22. Cai HQ, Cheng ZJ, Zhang HP, et al. Overexpression of MCM6 predicts poor survival in patients with glioma. Hum Pathol. 2018;78:182–187. doi:10.1016/j.humpath.2018.04.024
23. Levidou G, Ventouri K, Nonni A, et al. Replication protein A in nonearly ovarian adenocarcinomas: correlation with MCM-2, MCM-5, Ki-67 index and prognostic significance. Int J Gynecol Pathol. 2012;31(4):319–327. doi:10.1097/PGP.0b013e31823ef92e
24. Giaginis C, Vgenopoulou S, Vielh P, Theocharis S. MCM proteins as diagnostic and prognostic tumor markers in the clinical setting. Histol Histopathol. 2010;25(3):351–370. doi:10.14670/HH-25.351
25. Burger M, Denzinger S, Hartmann A, Wieland WF, Stoehr R, Obermann EC. Mcm2 predicts recurrence hazard in stage Ta/T1 bladder cancer more accurately than CK20, Ki67 and histological grade. Br J Cancer. 2007;96(11):1711–1715. doi:10.1038/sj.bjc.6603784
26. Kapoor K, Datta C, Pal DK. Immunocytochemical detection of minichromosome maintenance protein 2 as a potential urinary-based marker of bladder cancer: a prospective observational study. Indian J Urol. 2020;36(1):32–36. doi:10.4103/iju.IJU_128_19
27. Ha SA, Shin SM, Namkoong H, et al. Cancer-associated expression of minichromosome maintenance 3 gene in several human cancers and its involvement in tumorigenesis. Clin Cancer Res. 2004;10(24):8386–8395. doi:10.1158/1078-0432.CCR-04-1029
28. Park SY, Kim HM, Koo JS. Differential expression of cancer-associated fibroblast-related proteins according to molecular subtype and stromal histology in breast cancer. Breast Cancer Res Treat. 2015;149(3):727–741. doi:10.1007/s10549-015-3291-9
29. Li Y, Zou J, Zhang Q, et al. Systemic Analysis of the DNA Replication Regulator MCM Complex in Ovarian Cancer and Its Prognostic Value. Front Oncol. 2021;11:681261. doi:10.3389/fonc.2021.681261
30. Kawabata T, Luebben SW, Yamaguchi S, et al. Stalled fork rescue via dormant replication origins in unchallenged S phase promotes proper chromosome segregation and tumor suppression. Mol Cell. 2011;41(5):543–553. doi:10.1016/j.molcel.2011.02.006
31. Ishimi Y. Regulation of MCM2-7 function. Genes Genet Syst. 2018;93(4):125–133. doi:10.1266/ggs.18-00026
32. Korkolopoulou P, Givalos N, Saetta A, et al. Minichromosome maintenance proteins 2 and 5 expression in muscle-invasive urothelial cancer: a multivariate survival study including proliferation markers and cell cycle regulators. Hum Pathol. 2005;36(8):899–907. doi:10.1016/j.humpath.2005.06.008
33. Stoeber K, Swinn R, Prevost AT, et al. Diagnosis of genito-urinary tract cancer by detection of minichromosome maintenance 5 protein in urine sediments. J Natl Cancer Inst. 2002;94(14):1071–1079. doi:10.1093/jnci/94.14.1071
34. Bialek L, Czerwinska K, Fus L, et al. MCM5 urine expression (ADXBLADDER) is a reliable biomarker of high-risk non- muscle-invasive bladder cancer recurrence: a prospective matched case-control study. Cancer Biomark. 2021;30(2):139–143. doi:10.3233/CBM-200316
35. Brisuda A, Hacek J, Cechova M, Skapa P, Babjuk M. Diagnosis of urinary bladder urothelial carcinoma by immunocytology with p53, MCM5, MCM2 and Ki-67 antibodies using cell blocks derived from urine. Cytopathology. 2019;30(5):510–518. doi:10.1111/cyt.12698
36. Stockley J, Akhand R, Kennedy A, Nyberg C, Crosbie EJ, Edmondson RJ. Detection of MCM5 as a novel non-invasive aid for the diagnosis of endometrial and ovarian tumours. BMC Cancer. 2020;20(1):1000. doi:10.1186/s12885-020-07468-y
37. Alexandrov LB, Nik-Zainal S, Wedge DC, Campbell PJ, Stratton MR. Deciphering signatures of mutational processes operative in human cancer. Cell Rep. 2013;3(1):246–259. doi:10.1016/j.celrep.2012.12.008
38. Issac MSM, Yousef E, Tahir MR, Gaboury LA. MCM2, MCM4, and MCM6 in Breast Cancer: clinical Utility in Diagnosis and Prognosis. Neoplasia. 2019;21(10):1015–1035. doi:10.1016/j.neo.2019.07.011
39. Das M, Prasad SB, Yadav SS, et al. Over expression of minichromosome maintenance genes is clinically correlated to cervical carcinogenesis. PLoS One. 2013;8(7):e69607. doi:10.1371/journal.pone.0069607
40. Liu M, Hu Q, Tu M, et al. MCM6 promotes metastasis of hepatocellular carcinoma via MEK/ERK pathway and serves as a novel serum biomarker for early recurrence. J Exp Clin Cancer Res. 2018;37(1):10. doi:10.1186/s13046-017-0669-z
41. Chuang TD, Luo X, Panda H, Chegini N. miR-93/106b and their host gene, MCM7, are differentially expressed in leiomyomas and functionally target F3 and IL-8. Mol Endocrinol. 2012;26(6):1028–1042. doi:10.1210/me.2012-1075
42. Moreno SP, Bailey R, Campion N, Herron S, Gambus A. Polyubiquitylation drives replisome disassembly at the termination of DNA replication. Science. 2014;346(6208):477–481. doi:10.1126/science.1253585
43. Toyokawa G, Masuda K, Daigo Y, et al. Minichromosome Maintenance Protein 7 is a potential therapeutic target in human cancer and a novel prognostic marker of non-small cell lung cancer. Mol Cancer. 2011;10:65. doi:10.1186/1476-4598-10-65
44. Kim SH, Ho JN, Jin H, et al. Upregulated expression of BCL2, MCM7, and CCNE1 indicate cisplatin-resistance in the set of two human bladder cancer cell lines: T24 cisplatin sensitive and T24R2 cisplatin resistant bladder cancer cell lines. Investig Clin Urol. 2016;57(1):63–72. doi:10.4111/icu.2016.57.1.63
45. Choy B, LaLonde A, Que J, Wu T, Zhou Z. MCM4 and MCM7, potential novel proliferation markers, significantly correlated with Ki-67, Bmi1, and cyclin E expression in esophageal adenocarcinoma, squamous cell carcinoma, and precancerous lesions. Hum Pathol. 2016;57:126–135. doi:10.1016/j.humpath.2016.07.013
 © 2022 The Author(s). This work is published and licensed by Dove Medical Press Limited. The full terms of this license are available at https://www.dovepress.com/terms.php and incorporate the Creative Commons Attribution - Non Commercial (unported, v3.0) License.
By accessing the work you hereby accept the Terms. Non-commercial uses of the work are permitted without any further permission from Dove Medical Press Limited, provided the work is properly attributed. For permission for commercial use of this work, please see paragraphs 4.2 and 5 of our Terms.
© 2022 The Author(s). This work is published and licensed by Dove Medical Press Limited. The full terms of this license are available at https://www.dovepress.com/terms.php and incorporate the Creative Commons Attribution - Non Commercial (unported, v3.0) License.
By accessing the work you hereby accept the Terms. Non-commercial uses of the work are permitted without any further permission from Dove Medical Press Limited, provided the work is properly attributed. For permission for commercial use of this work, please see paragraphs 4.2 and 5 of our Terms.