")
Back to Journals » International Journal of General Medicine » Volume 14
Bioinformatic Analysis of Hepatocellular Carcinoma Cell Lines to the Efficacy of Nimotuzumab
Authors Wang Y, Zhang M, Gong Y, Wu Q, Zhang L, Jiao S
Received 25 March 2021
Accepted for publication 28 May 2021
Published 17 June 2021 Volume 2021:14 Pages 2611—2621
DOI https://doi.org/10.2147/IJGM.S312770
Checked for plagiarism Yes
Review by Single anonymous peer review
Peer reviewer comments 2
Editor who approved publication: Dr Scott Fraser
Yu Wang,1 Meng Zhang,2,3 Yixin Gong,2 Qiyan Wu,1 Lijun Zhang,1 Shunchang Jiao1
1Department of Oncology, Oncology Faculty, Chinese PLA General Hospital, Beijing, People’s Republic of China; 2Department of Research and Development, Beijing DCTY® Biotech Co.,Ltd, Beijing, People’s Republic of China; 3Department of Hepatobiliary Surgery, PLA Rocket Force Characteristic Medical Center, Beijing, People’s Republic of China
Correspondence: Shunchang Jiao
Department of Oncology, Oncology Faculty, Chinese PLA General Hospital, Beijing, People’s Republic of China
Tel +86-1066875308
Email [email protected]
Introduction: Hepatocellular carcinoma (HCC) continues to be a cancer with rising incidence, high mortality, and recurrence rate. The therapeutic effects on HCC are not satisfactory currently. Epidermal growth factor receptor (EGFR) is an important factor, while anti-EGFR agencies have not shown ideal results in HCC.
Materials and Methods: We tested efficacy of nimotuzumab and EGFR expression on cell surface in six HCC cell lines (Hep 3B2.1– 7, Li-7, PLC/PRF/5, SK-HEP-1, SNU-182, and SNU-387). Then, we analyzed RNA sequences of every cell line and performed a bioinformatic analysis. Differentially expressed genes (DEGs) were analyzed. The data, TCGA-LIHC from The Cancer Genome Atlas (TCGA) and GSE102079 from Gene Expression Omnibus (GEO), were used to analyse DEGs of Hoshida subclass.
Results: Hep 3B2.1– 7 and PLC/PRF/5 were sensitive to nimotuzumab whereas Li-7, SK-HEP-1, SNU-182, and SNU-387 cell lines were resistant. Then, we compared the DEGs between sensitive and resistant group cell lines. We enriched DEGs in GO and KEGG and performed GSEA in each group. Genes in two groups did not show obvious different expressions in EGFR pathways, while Hoshida subclass of HCC seemed to associate with the efficacy of nimotuzumab in that S2 and S3 showed better therapeutic effect than S1. Therefore, we analyzed genes in human tumor samples which were from TCGA-LIHC and GSE102079. We found that COL1A1, COL1A2, COL3A1, and MMP9 were the focus DEGs of S1 and S2 & S3 related to EGFR.
Conclusion: The efficacy of nimotuzumab in HCC did not show direct relevance with EGFR protein expression and EGFR-related pathway. However, efficacy could associate with Hoshida subclass of HCC. Three ECM genes (COL1A1, COL1A2, COL3A1) and MMP9 were paid attention, as they might play important roles in the curative effect of nimotuzumab in HCC.
Keywords: bioinformatic analysis, hepatocellular carcinoma, cell line, nimotuzumab, Hoshida subclass, TCGA, GEO
Introduction
Primary liver cancers, of which hepatocellular carcinoma (HCC) is the main type, are the third leading cause of cancer-related mortality worldwide.1,2 It is estimated that new cases of HCC reached 906,000, with mortality as high as 830,000 annually.2,3 The incidence of HCC has increased over the last years, and over half of the global incidence and mortality of HCC occurs in China, attributed to HBV infection.4 Radical therapeutic options for HCC patients are radical surgical resection, local ablation or liver transplantation, but these are confined to a small proportion of patients with early-stage HCC. HCC patients at an advanced stage will receive the systemic treatment, including chemotherapy, targeted therapy and immunotherapy, as a means of prolonging life, although most current drugs show limited efficacy.5,6 Due to the high morbidity and high mortality of HCC, novel therapy is an urgent need in HCC treatment.
The epidermal growth factor receptor (EGFR) is a well-known classic onco-therapeutic target in various tumors. It is a cell-surface receptor belonging to ErbB family. It plays a vital role as a regulator of pathways involved in cancer pathogenesis and progression. Hence, specific EGFR inhibition is one of the key targets for cancer therapy. Anti-EGFR monoclonal antibodies (mAbs) and tyrosine kinase inhibitors (TKIs) are two major approaches that have demonstrated benefits for targeting EGFR. mAbs, including cetuximab, panitumumab, necitumumab and nimotuzumab, which ligand-bind directly to the extracellular domain of EGFR, block the activation of downstream signaling pathways.7 TKIs, such as gefitinib, afatinib, osimertinib, could internalize into cells and inhibit the phosphorylated activation by binding with the intracellular tyrosine kinase site of EGFR.8 However, these anti-EGFR agents have not been proved in a positive evaluation in HCC despite the expression of EGFR being commonly high.9–12 Some studies showed that the complex signaling pathways are the primary cause of drug resistance in HCC cells.13,14
Nimotuzumab is a humanized IgG1 isotype anti-EGFR mAb with two ligands, while other anti-EGFR mAbs only have one, developed at the Center of Molecular Immunology in Cuba.15 Nimotuzumab was approved for the treatment of glioma, esophageal cancer, squamous cell carcinoma of the head and neck and pancreatic cancer in Cuba and some of these conditions in China.16–18 Nimotuzumab’s data on HCC-related clinical trials were not available. However, it was observed that nimotuzumab was highly effective in a patient with advanced HCC who progressed after multi-line and multi-course treatment in our hospital. Another patient in the same situation was reported as well.19 It was of interest to us, and we aimed to explore the efficacy and resistance mechanism of nimotuzumab in HCC.
We selected six HCC cell lines for nimotuzumab susceptibility experiments and tested the EGFR protein on cell surface. Then we conducted RNA sequencing of all HCC cell lines. After that, bioinformatic analysis was performed to compare the differences in gene expression between the sensitive and the resistant cell lines.
Materials and Methods
Cell Lines and Cell Culture
The human HCC cell lines Hep 3B2.1–7, Li-7, PLC/PRF/5, SK-HEP-1, SNU-182, and SNU-387 were obtained from the National Collection of Authenticated Cell Cultures in Shanghai. After resuscitation, all the cell lines were cultured in DMEM medium supplemented with 10% fetal bovine serum (Biological Industries) containing 1% double resistance in a 5% humidified CO2 incubator at 37°C. All cell lines were authenticated by short tandem repeat analysis. These cells were observed under a microscope every day. Then they were passaged and cultured when grown to mid-log phase (OD600 nm 0.4–0.6). After third passage, cells were used for subsequent experiments.
Flow Cytometry Analysis
Flow cytometry analyzed the expressions of EGFR protein on cell surface of the cell lines. After separation, cultivation, and passage, the third generation of cell lines were digested by 0.05% pancreatin and the obtained cell suspension was centrifuged in 1000 rpm for 5 min. The cell density was adjusted to 1×10⁶/mL, after which 1mL cell was added in the labeled flow cytometry tubes. After centrifugation the supernatant was discarded. The cells were washed twice with PBS. Cells were stained with fluorochrome-conjugated monoclonal antibodies: EGFR and IgG2b (BD Pharmingen, USA) as an isotype control in accordance with the manufacturer’s specifications. These antibodies were proven by their manufacturers to be cross-reactive with mouse antigens. Samples were mixed well and incubated at 4°C for 10–15 min in the dark, and they were washed twice with PBS prior to analysis. Thousands of fluorescent cells were accumulated and detected by flow cytometer (Canto II, BD Biosciences, USA).
Cell Proliferation Assay (CCK-8)
The cells from the cell lines were seeded at a density of 5×10⁴ cells/mL in 100 μL/well (5000 cells/well) in 96-well plates. Then 200 μL of PBS were added into wells in the plate which were then placed in the incubator. Cell proliferation assays were classified into two groups: control and nimotuzumab. The negative controls (C0) contained medium that was not supplemented with a drug. Nimotuzumab were amended with four different concentrations (C1-C4): 25 μg/mL, 50 μg/mL, 100 μg/mL, and 200 μg/mL. The mediums were supplemented with different concentrations of nimotuzumab. After the cell attached to the wall, the solutions with different drugs were added into the well (three replicated per group) and continued to be cultured. Supernatants were discarded after 72 h. 90 μL of fresh growth medium and 10 μL CCK-8 solution were added to each well. Then plates were incubated in an incubator for 1–4 h and the color change in the reaction solution was noted by visual observation. The optical density (OD) of each well was measured at 450 and 600 nm. The experiments were independently repeated at least 3 times.
RNA-Sequencing (RNA-Seq)
Total RNA from cell lines were extracted and purified using an RNA extraction kit (Qiagen). Then mRNAs were enriched by polyA selection. Library preparations were conducted using an Illumina TruSeq RNA sample prep kit (Illumina, Beijing, China) following the manufacturer’s instructions and subjected to sequencing on a HiSeq 4000 platform (Novogene).
Bioinformatic Analysis
RNA-seq raw reads were processed using fastp to filter out sequencing adapters, low-quality reads.20 Clean reads were aligned to the human reference genome (GRCh38.91) by HISAT2.21 The relative abundances of genes were measured in FPKM (Fragments per kilobase per million mapped reads) using StringTie.22
Differentially expressed genes (DEGs) between groups were evaluated with the R (version 4.0.2) package “DESeq2”, “edgeR”, “limma” using FPKM data. Genes were nominated to be differentially expressed with two cut-off values (fold-change > 2 and p <0.02).23 Gene ontology and KEGG enrichment analyses were performed using the “clusterProfiler” package in R.24–26 Gene Set Enrichment Analysis (GSEA) was conducted using GSEA 4.1.0 software with gene sets annotated in the Molecular Signatures Database (MSigDB v.7.2).27,28 The cut-off values for GSEA results were fold-change >1.8, PCT score >0.3 and false discovery rate (FDR) q-value <0.1. Heatmaps were generated in R package “pheatmap”.
The Cancer Genome Atlas (TCGA) and Gene Expression Omnibus (GEO) Data Analysis
Raw counts of RNA-sequencing data and corresponding clinical information from TCGA-LIHC were obtained from The Cancer Genome Atlas (TCGA) dataset (https://portal.gdc.cancer.gov/) in May 2021, in which the method of acquisition and application complied with the guidelines and policies. All the above analysis methods and R package were implemented by R foundation for statistical computing and ggplot2.
All microarray data from GSE102079 was submitted to the GEO database (http://www.ncbi.nih.gov/geo). The raw data were downloaded as MINiML files. The extracted data were normalized and processed by log2 transformation. The microarray data were normalized using the “preprocessCore” package in R software. Probes were converted to gene symbols according to the platform annotation information of the normalized data.
Statistical Analysis
Data were analyzed and graphed using GraphPad Prism 9. Data were presented as mean ± SEM. Experiments that involved a single comparison between two groups were analyzed with t-tests, whereas differences between multiple groups were analyzed with one-way analysis of variance (ANOVA). A p-value <0.05 was regarded as statistically significant.
Results
Expressions of EGFR Protein Have No Correspondence with Efficacy of Nimotuzumab
To explore whether the expression of EGFR protein contacted with the anti-EGFR agency, nimotuzumab, we analyzed the expressions of EGFR protein on every cell face of the six cell lines by flow cytometry. Results from flow cytometry (Figure 1A) revealed that all six HCC cell lines expressed EGFR protein relative to isotype. There were no significant differences of expression level among these cell lines. Hep 3B2.1–7 showed the highest mean fluorescence intensity (MFI) and had a significant difference with other liver cell lines besides PLC/PRF/5. PLC/PRF/5 had a higher MFI than the rest of the four cell lines but these did not differ significantly from each other. In conclusion, Hep 3B2.1–7 had a higher expression of EGFR protein than other liver cell lines and EGFR protein of other liver cell lines did not show a significant difference.
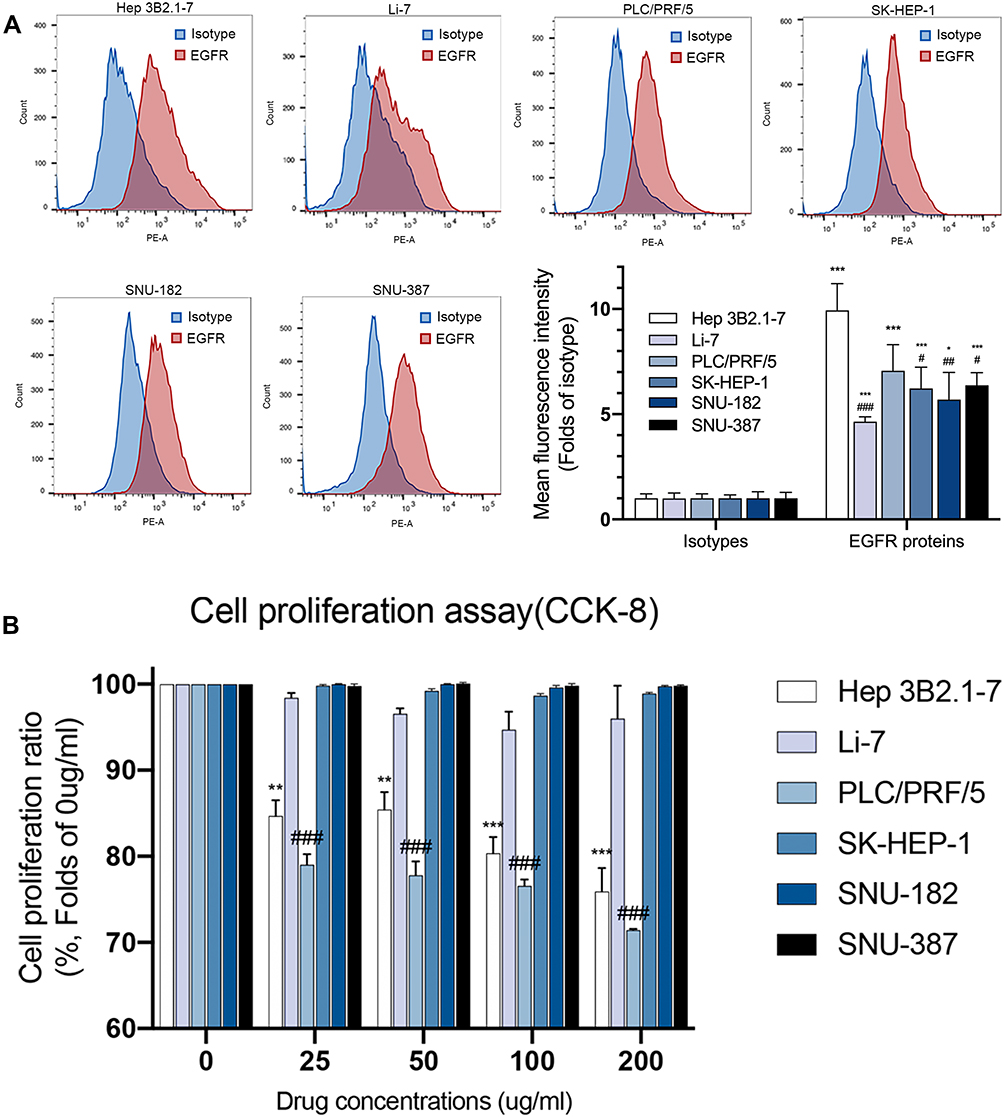 |
Figure 1 Expressions of EGFR protein have no correspondence with efficacy of nimotuzumab. (A) Representative flow cytometric histograms showed the expressions of EGFR protein on cells surface of six HCC cell lines (Hep 3B2.1–7, Li-7, PLC/PRF/5, SK-HEP-1, SNU-182, SNU-387). Mean fluorescence intensity (MFI) of flow cytometric histograms (mean ± SEM of 3 independent experiments). Statistical differences were determined by one-way ANOVA and Student’s t-test, with *p<0.05, **p<0.01, ***p<0.0001 against isotype; #p<0.05, ##p<0.01, ###p<0.0001 against Hep 3B2.1–7. (B) Cell proliferation was evaluated using the CCK-8 assay. Statistical differences were determined by Student’s t-test, with *p<0.05, **p<0.01, ***p<0.0001 against Hep 3B2.1–7 C0; #p<0.05, ##p<0.01, ###p<0.0001 against PLC/PRF/5 C0 (C0 = negative control). |
We then examined the impact of nimotuzumab on HCC cell proliferation by CCK-8 assay. The cells were divided into two sets, treated for 72 h with either control or nimotuzumab with different concentrations. Cell proliferation assay (Figure 1B) results demonstrated that nimotuzumab did not inhibit HCC cells proliferation at all in Li-7, SK-HEP-1, SNU-182 and SNU-387 cell lines at every concentration. Hep 3B2.1–7 and PLC/PRF/5 cell lines were inhibited by nimotuzumab at every concentration. With the concentration increase, these two cell lines proliferated less. Hep 3B2.1–7 cell line proliferation ratio was 75.92% and PLC/PRF/5 cell line was 71.43% on nimotuzumab 200 ug/mL.
According to the EGFR protein expression above, the sensitive cell line Hep 3B2.1–7 had a relatively higher expression on EGFR protein. However, PLC/PRF/5 did not show a significant difference with other resistant cell lines in EGFR protein. So, these results showed no correspondence between the expression of EGFR proteins and drug efficacy of nimotuzumab which was an anti-EGFR agent.
Differentially Expressed Genes Between Resistant and Sensitive HCC Cell Lines
To explore the differences between resistant HCC cell lines (Li-7, SK-HEP-1, SNU-182 and SNU-387) and sensitive cell lines (Hep 3B2.1–7 and PLC/PRF/5) on a genetic level, we analyzed RNA-sequences from the six HCC cell lines. After processing reads, we removed low-quality sequences, and the clean read mapped more than 95% of the raw data. Protein-coding genes and non-coding RNAs were all included.
We separated the six HCC cell lines into two groups, resistant and sensitive. The resistant group was chosen as reference. After that, we performed DESeq2, edgeR and limma voom in R to get differentially expressed genes (DEGs) between two groups. Results from three ways were intersected. A total of 480 DEGs (p<0.05, fold change ≥2) were detected with 114 up-regulated genes and 366 down-regulated genes in the sensitive group (Figure 2).
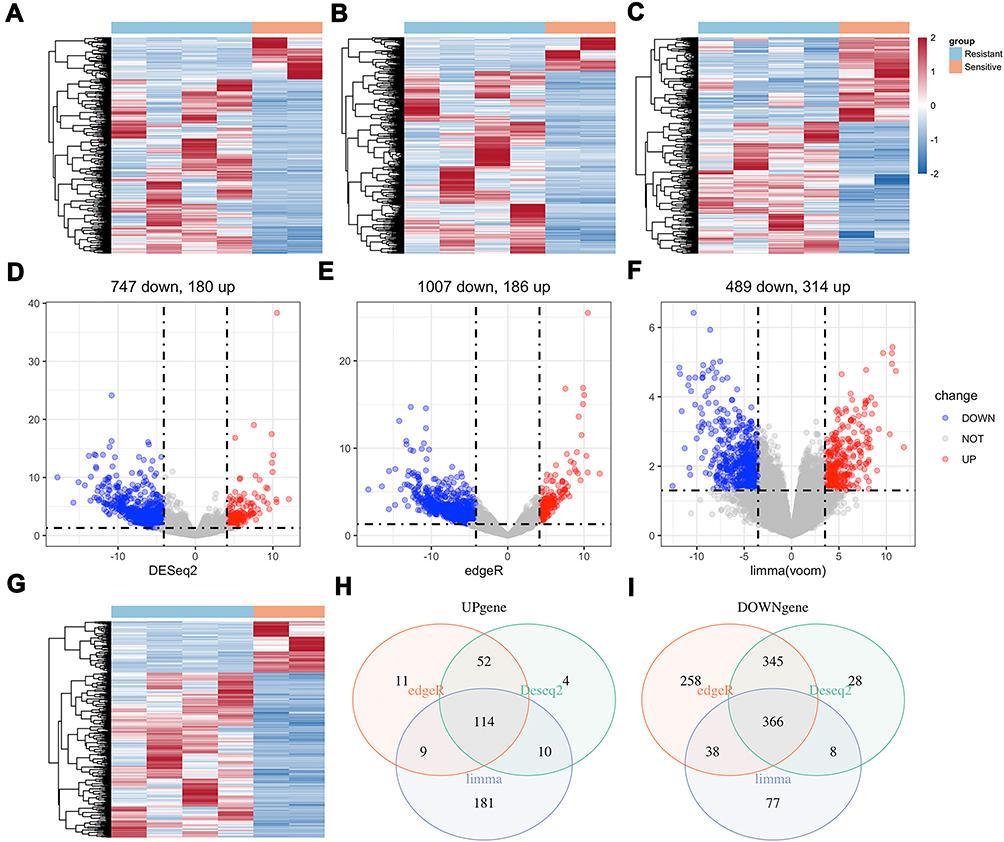 |
Figure 2 DEGs between sensitive and resistant HCC cell lines were analyzed by DESeq2, edgeR and limma voom packages in R: (A–C) Heatmap of DEGs and (D–F) Volcano plots of DEGs in three ways. Intersection of three ways of DEGs: (G) Heatmap and (H and I) Venn diagram. A total of 114 up-regulated genes (p<0.05, fold change ≥2) and 366 down-regulated genes (p<0.05, fold change ≥2) were detected in sensitive group (resistant group as reference). The color-ratio bar and plot indicate intensity of gene up-regulation (red) and down-regulation (blue). |
Enrichment in Differentially Expressed Genes
Gene ontology (GO) enrichment analysis was performed to classify the DEGs function. According to the database annotation, DEGs can be categorized into 220 functional groups consisting of three domains: “biological process,” “cellular component,” and “molecular function.” Top 10 enrichment groups are shown in Figure 3A. The GO enrichment results of all DEGs are significantly enriched in “extracellular matrix organization (GO:0030198)”, “extracellular structure organization (GO:0043062)” and “urogenital system development (GO: 0001655).”
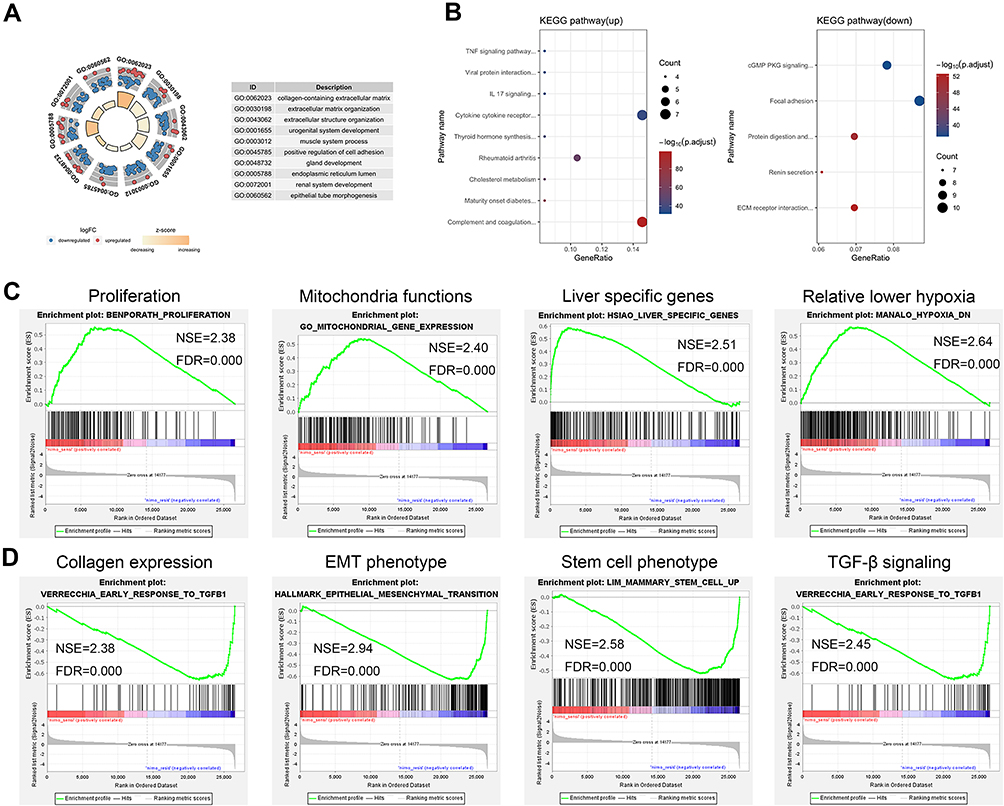 |
Figure 3 GO enrichment analysis and KEGG pathway enrichment of DEGs. (A) Enrichment analysis of gene ontology terms. (B) Enrichment analysis of KEGG pathway in up-regulated genes and down-regulated genes. Top gene sets in GSEA in sensitive (C) and resistant (D) groups. |
Kyoto Encyclopedia of Genes and Genomes (KEGG) database was used as an alternative approach to categorize gene function with emphasis on biochemical pathways. In total, 48 up-DEGs and 115 down-DEGs were collected by KEGG (Figure 3B). DEGs were assigned to 9 and 5 KEGG pathways in up and down genes. Most of the up-regulated DEGs were enriched in “Cytokine-cytokine receptor interaction” (7, 14.58%), “Complement and coagulation cascades” (7, 14.58%). Down-regulated DEGs are mainly enriched in “Focal adhesion” (10, 8.70%), followed by “cGMP-PKG signaling pathway” (9, 7.83%).
Gene Set Enrichment Analysis in Resistant and Sensitive Groups
Gene Set Enrichment Analysis (GSEA) is a conventional approach to identify pathways related to gene expression. After the filters, we chose 10 terms in resistant and sensitive groups which were associated with our study topic in enriched terms (supplement 1). Then, the top 50 enriched terms in each group were analyzed by GSEA automatically (supplement 2). After that, we compared the top automatic terms and our chosen terms and picked four similar terms in each group from these two ways for further analysis. The results revealed that sensitivity was associated with proliferation, mitochondria functions, liver specific genes, relative lower hypoxia (Figure 3C), while resistance was related to collagen expression, EMT phenotype, stem cell phenotype, and TGF beta signaling (Figure 3D).
Interaction of EGFR-Related Gene Sets and Gene Expression in Resistant and Sensitive Groups
Nimotuzumab was a classical anti-EGFR monoclonal antibody, so we wanted to explore the interaction of EGFR-related gene sets and gene expression in resistant and sensitive cell lines. According to the GSEA analysis, we found EGFR tyrosine kinase inhibitor resistance and Kobayashi EGFR signaling 24HR, two EGFR-related gene sets, revealed to sensitive group genes besides the traditional EGF/EGFR signaling pathway gene set. After that, we analyzed gene expression of sensitive and resistant cell lines in these three pathways (Figure 4A–C). However, these cell lines could not be clustered in two groups by cluster parameters.
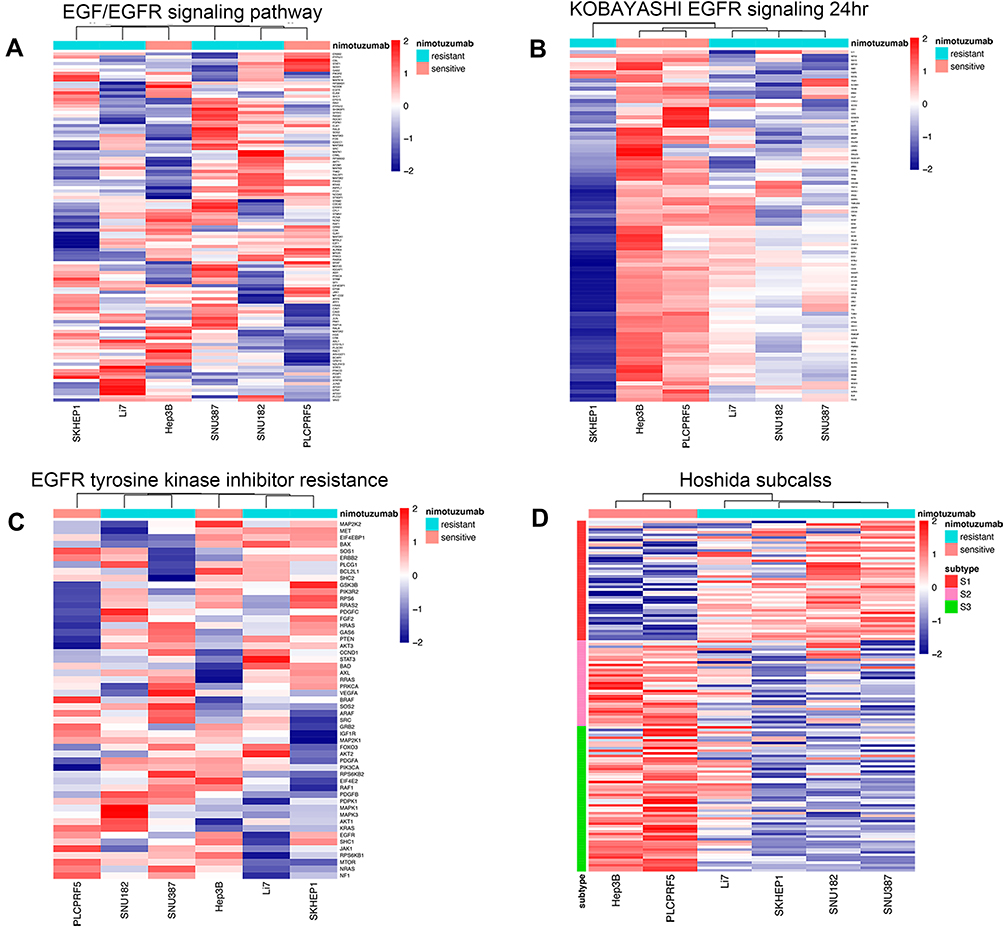 |
Figure 4 Interaction of EGFR-related gene sets and Hoshida subclass of HCC with gene expression in sensitive and resistant groups. (A) EGF/EGFR signaling pathway. (B) Kobayashi EGFR signaling 24HR. (C) EGFR tyrosine kinase inhibitor resistance. (D) Hoshida subclass of HCC. |
Sensitivity of Nimotuzumab Might Associate with Hoshida Subclass of HCC
Hoshida subclass of HCC was a class with different AFP level and mechanism of carcinoma.29 Since one enriched gene term of sensitive cell lines from GESA above was Hoshida subclass S3, we tested the gene expression of six cell lines in Hoshida subclass genes (Figure 4D). It was interesting that two sensitive cell lines showed a significant high expression in S2 & S3 subclass genes and low expression in S1 subclass genes. Meanwhile, four resistant cell lines revealed a high expression in S1 subclass genes and low expression in S2 & S3 subclass genes. According to these results, we inferred that differences between mechanisms of three Hoshida subclasses might play important roles in the efficacy of nimotuzumab to HCC.
Differentially Expressed Genes Between Hoshida S1 and S2&S3 in Human Tumor Samples
We found that Hoshida subclass may be a key to the efficacy of nimotuzumab to HCC. Thus, we wanted to explore the DEGs in real human tumor samples between Hoshida S1 and S2 & S3. Data of array from GSE102079 which were from the Gene Expression Omnibus (GEO). Data of RNA sequences were from The Cancer Genome Atlas (TCGA) dataset (TCGA-LIHC). We filtered all data and kept HCC samples. After that, we divided all tumor samples to Hoshida S1, S2 and S3 according to gene expression in every subclass gene set. Counts in S1/S2/S3 subclass were 42/37/73 in GSE102079 and 93/112/169 in TCGA-LIHC.
We got DEGs between S1 versus S2 and S1 versus S3 (Figure 5). Array data from GSE102079 were calculated by limma. RNA-seq data from TCGA-LIHC also was analyzed from intersection of DESeq2, edgeR and limma voom. Then we intersected DEGs of S1 versus S2 with DEGs of S1 versus S3. After that, we compared DEGs between GSE102079 and TCGA-LIHC. Thus, we got 20 down-related genes after these procedures (supplement 3). We listed all these 20 gene-related pathways and EGFR-related pathways and found four genes had the same pathways with EGFR. These four genes were COL1A1, COL1A2, COL3A1 and MMP9, which might relate to efficacy of nimotuzumab in HCC.
 |
Figure 5 DEGs between Hoshida S1 and S2&S3 in GSE102079 and TCGA-LIHC. (A) Venn diagram in up-regulated genes. (B) Venn diagram in down-regulated genes. (C) DEGs were analyzed from GSE102079. (D) DEGs were analyzed from TCGA-LIHC. |
Discussion
Hepatocellular carcinoma (HCC) continues to be a cancer with rising incidence, high mortality, and recurrence rate. The therapeutic effects on HCC are not satisfactory currently. EGFR is an important factor in HCC and previous studies have demonstrated that EGFR is involved in various HCC mechanisms including cell proliferation, late-stage metastasis, treatment and drug resistance.30–35 However, anti-EGFR agencies do not show ideal results in HCC involving extremely complicated pathways.10,12 Lin et al. reported that the anti-EGFR drug resistance in HCC is caused by the promoted interaction of EGFR with mTORC2.13 Zhang et al. found that CD317 activates EGFR in resistant progress as well.14 To explore the resistance mechanism in depth and apply the possibility of EGFR targeted drugs, our research analyzed six HCC cell lines (Hep 3B2.1–7, Li-7, PLC/PRF/5, SK-HEP-1, SNU-182, SNU-387) for sensitivity to nimotuzumab. Then we compared the RNA-seq differences between sensitive and resistant group cell lines. We enriched DEGs in GO and KEGG and performed GSEA in each group. Genes in the two groups did not show obvious different expressions in EGFR pathways, while Hoshida subclass of HCC seemed to associate with efficacy of nimotuzumab. Therefore, we analyzed genes in real human tumor samples which were from TCGA (TCGA-LIHC) and GEO (GSE102079). We found that COL1A1, COL1A2, COL3A1, and MMP9 were the focus DEGs of S1 and S2&S3 related to EGFR.
We discovered that all HCC cell lines had positive expression of EGFR protein on cell surface. It was also reported that EGFR was expressed in most HCC previously.36,37 Expression of EGFR protein had no correspondence with efficacy of nimotuzumab. Higher EGFR expression did not equal to better effect. It was also observed in triple-negative breast cancer (TNBC) that TNBC tumors express EGFR but the clinical efficacy of anti-EGFR therapy in TNBC is low.38 That might relate to the RTK family receptors which are generally thought to be activated by ligand binding promoting homodimerization. Dimer ligand may consist of two same RTKs (e.g., EGFR/EGFR) or two different RTKs (e.g., EGFR/FGFR) on the cell surface.39 Therefore, EGFR expression alone could not reflect the real situation of EGFR on the cell surface. Moreover, our research also found that EGFR-related pathway gene sets did not express differences between sensitive and resistant cell lines. These results revealed that EGFR might connect with other pathways in cancer cell proliferation, so other survival pathways existed under anti-EGFR drug. Therefore, further study of this aspect is needed.
After GO and KEGG enrichment were used in DEGs between resistant and sensitive groups, we performed GSEA in each resistant and sensitive group. At that time, we found
Hoshida subclass of HCC might be a key to efficacy of nimotuzumab. Two sensitive group cell lines showed a high expression in S2 & S3 genes, which proved that these two cell lines Hep 3B2.1–7 and PLC/PRF/5 were Hoshida S2. Resistant group showed a high expression in S1 genes that also proved that SNU-182, SNU-387 and SK-HEP-1 were Hoshida S1.29 Li-7 was uncertain in past studies. Different subclasses had different mechanisms of HCC progress in that S1 reflected aberrant activation of the WNT signaling pathway, S2 was characterized by proliferation as well as MYC and AKT activation, and S3 was associated with hepatocyte differentiation.29 Different mechanisms of HCC progress might lead to different efficacy of nimotuzumab. We should explore the advanced association between the subclass mechanisms and anti-EGFR drug.
After analyzing the DEGs in real human tumor samples between S1 and S2 & S3, we got four genes, COL1A1, COL1A2, COL3A1, and MMP9. COL1A1, COL1A2, and COL3A1 are all extracellular matrix (ECM) genes and MMP9 is the downstream gene of EGFR. In addition to functioning as structural scaffold elements, ECM proteins can serve a wide array of signaling functions especially during fibrogenesis and fibrosis resolution which results in liberation and activation of growth factor signaling cascades and cancer development in injured livers.40 MMP9 is involved in cancer progression and pre-metastatic niche formation in HCC.41 There are many studies that show some targeted factors like cancer-associated fibroblasts (CAFs) and M2 macrophages can influence MMP9 expression to promote HCC development.42,43 The detailed relation of anti-EGFR treatment and ECM and MMP9 should be researched in the future.
HCC cell lines might have a difference in vivo and our study were not concluded using large amounts of data. These limitations may affect our study results. However, the results of our study may provide a new direction of anti-EGFR drug in HCC. We could collect more human HCC tissues to explore the connection of genes and nimotuzumab especially in Hoshida subclass in the future. Meanwhile, ECM genes and MMP9 should be researched in relation with efficacy of nimotuzumab in HCC.
Conclusions
Li-7, SK-HEP-1, SNU-182, and SNU-387 cell lines were resistant to nimotuzumab, while Hep 3B2.1–7 and PLC/PRF/5 cell lines were sensitive. The efficacy of nimotuzumab did not show direct relevance with EGFR protein expression and EGFR-related pathway. However, efficacy could be associated with Hoshida subclass of HCC in that S2 & S3 showed better therapeutic effect than S1. After we compared DEGs between S1 and S2 & S3 related to EGFR, three ECM genes (COL1A1, COL1A2, COL3A1) and MMP9 were focused on, which might play important roles in curative effect of nimotuzumab in HCC.
Acknowledgments
This work was supported by China Postdoctoral Science Foundation [grant number BX20190383]. The authors wanted to thank Shanghai Lide Biotech Co., Ltd for help in the bioinformatic analysis work.
Disclosure
The authors declare no conflicts of interest in regard to this manuscript.
References
1. Balabaud C, Bioulac-Sage P, Ferrell L, et al. Well-differentiated hepatocellular neoplasm of uncertain malignant potential. Hum Pathol. 2015;46(4):634–635. doi:10.1016/j.humpath.2014.10.029
2. Globocan. Estimated number of new cases in 2020. Available from https://gco.iarc.fr/today/online-analysis-table.
3. Globocan. Estimated number of deaths in 2020. Available from https://gco.iarc.fr/today/online-analysis-table.
4. Chen JG, Zhang SW. Liver cancer epidemic in china: past, present and future. Semin Cancer Biol. 2011;21(1):59–69. doi:10.1016/j.semcancer.2010.11.002
5. National Comprehensive Cancer Network: Nccn clinical practice guidelines in oncology. Hepatobiliary cancers, version 1; 2020. Available from https://www.nccn.org/professionals/physician_gls/default.aspx.
6. Chinese Society of Clinical Oncology. Guidelines of chinese society of clinical oncology (csco). Hepatocellular carcinoma; 2020.V1. Available from http://www.csco.org.cn/cn/index.aspx.
7. Zaczek A, Brandt B, Bielawski KP. The diverse signaling network of egfr, her2, her3 and her4 tyrosine kinase receptors and the consequences for therapeutic approaches. Histol Histopathol. 2005;20(3):1005–1015. doi:10.14670/HH-20.1005
8. Baselga J. Why the epidermal growth factor receptor? The rationale for cancer therapy. Oncologist. 2002;7(Suppl 4):2–8. doi:10.1634/theoncologist.7-suppl_4-2
9. Daveau M, Scotte M, Francois A, et al. Hepatocyte growth factor, transforming growth factor alpha, and their receptors as combined markers of prognosis in hepatocellular carcinoma. Mol Carcinog. 2003;36(3):130–141. doi:10.1002/mc.10103
10. Chiorean EG, Ramasubbaiah R, Yu M, et al. Phase II trial of erlotinib and docetaxel in advanced and refractory hepatocellular and biliary cancers: hoosier oncology group gi06-101. Oncologist. 2012;17(1):13. doi:10.1634/theoncologist.2011-0253
11. Llovet JM, Bruix J. Molecular targeted therapies in hepatocellular carcinoma. Hepatology. 2008;48(4):1312–1327. doi:10.1002/hep.22506
12. Zhu AX, Stuart K, Blaszkowsky LS, et al. Phase 2 study of cetuximab in patients with advanced hepatocellular carcinoma. Cancer. 2007;110(3):581–589. doi:10.1002/cncr.22829
13. Lin XM, Hu L, Gu J, et al. Choline kinase alpha mediates interactions between the epidermal growth factor receptor and mechanistic target of rapamycin complex 2 in hepatocellular carcinoma cells to promote drug resistance and xenograft tumor progression. Gastroenterology. 2017;152(5):1187–1202. doi:10.1053/j.gastro.2016.12.033
14. Zhang G, Li X, Chen Q, et al. Cd317 activates egfr by regulating its association with lipid rafts. Cancer Res. 2019;79(9):2220–2231. doi:10.1158/0008-5472.Can-18-2603
15. Crombet-Ramos T, Rak J, Perez R, Viloria-Petit A. Antiproliferative, antiangiogenic and proapoptotic activity of h-r3: a humanized anti-egfr antibody. Int J Cancer. 2002;101(6):567–575. doi:10.1002/ijc.10647
16. Ramakrishnan MS, Eswaraiah A, Crombet T, Piedra P, Saurez G, Iyer H, Arvind AS. Nimotuzumab, a promising therapeutic monoclonal for treatment of tumors of epithelial origin. MAbs. 2009;1(1):41–48. doi:10.4161/mabs.1.1.7509
17. Reddy BK, Lokesh V, Vidyasagar MS, et al. Nimotuzumab provides survival benefit to patients with inoperable advanced squamous cell carcinoma of the head and neck: a randomized, open-label, phase iib, 5-year study in indian patients. Oral Oncol. 2014;50(5):498–505. doi:10.1016/j.oraloncology.2013.11.008
18. Strumberg D, Schultheis B, Scheulen ME, et al. Phase ii study of nimotuzumab, a humanized monoclonal anti-epidermal growth factor receptor (egfr) antibody, in patients with locally advanced or metastatic pancreatic cancer. Invest New Drugs. 2012;30(3):1138–1143. doi:10.1007/s10637-010-9619-8
19. Song P, Yang J, Li X, et al. Hepatocellular carcinoma treated with anti-epidermal growth factor receptor antibody nimotuzumab: a case report. Medicine (Baltimore). 2017;96(39):e8122. doi:10.1097/md.0000000000008122
20. Chen S, Zhou Y, Chen Y, Gu J. Fastp: an ultra-fast all-in-one fastq preprocessor. Bioinformatics. 2018;34(17):i884–i890. doi:10.1093/bioinformatics/bty560
21. Kim D, Paggi JM, Park C, Bennett C, Salzberg SL. Graph-based genome alignment and genotyping with hisat2 and hisat-genotype. Nat Biotechnol. 2019;37(8):907–915. doi:10.1038/s41587-019-0201-4
22. Pertea M, Pertea GM, Antonescu CM, Chang TC, Mendell JT, Salzberg SL. Stringtie enables improved reconstruction of a transcriptome from rna-seq reads. Nat Biotechnol. 2015;33(3):290–295. doi:10.1038/nbt.3122
23. Ritchie ME, Phipson B, Wu D, Hu Y, Law CW, Shi W, Smyth GK. limma powers differential expression analyses for rna-sequencing and microarray studies. Nucleic Acids Res. 2015;43(7):e47. doi:10.1093/nar/gkv007
24. Ashburner M, Ball CA, Blake JA, et al. Gene ontology: tool for the unification of biology. The gene ontology consortium. Nat Genet. 2000;25(1):25–29. doi:10.1038/75556
25. Kanehisa M, Furumichi M, Tanabe M, Sato Y, Morishima K. Kegg: new perspectives on genomes, pathways, diseases and drugs. Nucleic Acids Res. 2017;45(D1):D353–D361. doi:10.1093/nar/gkw1092
26. Yu G, Wang LG, Han Y, He QY. Clusterprofiler: an r package for comparing biological themes among gene clusters. OMICS. 2012;16(5):284–287. doi:10.1089/omi.2011.0118
27. Subramanian A, Kuehn H, Gould J, Tamayo P, Mesirov JP. Gsea-p: a desktop application for gene set enrichment analysis. Bioinformatics. 2007;23(23):3251–3253. doi:10.1093/bioinformatics/btm369
28. Liberzon A, Subramanian A, Pinchback R, Thorvaldsdottir H, Tamayo P, Mesirov JP. Molecular signatures database (msigdb) 3.0. Bioinformatics. 2011;27(12):1739–1740. doi:10.1093/bioinformatics/btr260
29. Hoshida Y, Nijman SM, Kobayashi M, et al. Integrative transcriptome analysis reveals common molecular subclasses of human hepatocellular carcinoma. Cancer Res. 2009;69(18):7385–7392. doi:10.1158/0008-5472.CAN-09-1089
30. Kira S, Nakanishi T, Suemori S, Kitamoto M, Watanabe Y, Kajiyama G. Expression of transforming growth factor alpha and epidermal growth factor receptor in human hepatocellular carcinoma. Liver. 1997;17(4):177–182. doi:10.1111/j.1600-0676.1997.tb00803.x
31. Ito Y, Takeda T, Sakon M, et al. Expression and clinical significance of erb-b receptor family in hepatocellular carcinoma. Br J Cancer. 2001;84(10):1377–1383. doi:10.1054/bjoc.2000.1580
32. Kannangai R, Sahin F, Torbenson MS. Egfr is phosphorylated at ty845 in hepatocellular carcinoma. Mod Pathol. 2006;19(11):1456–1461. doi:10.1038/modpathol.3800665
33. Zhu W, Qin L. Golm1-regulated egfr/rtk recycling is a novel target for combating hcc metastasis. Sci China Life Sci. 2017;60(1):98–101. doi:10.1007/s11427-016-0311-x
34. Liang Y, Peng J, Li N, et al. Smart nanoparticles assembled by endogenous molecules for sirna delivery and cancer therapy via cd44 and egfr dual-targeting. Nanomedicine. 2019;15(1):208–217. doi:10.1016/j.nano.2018.09.018
35. Li WY, Li Q, Jing L, et al. P57-mediated autophagy promotes the efficacy of egfr inhibitors in hepatocellular carcinoma. Liver Int. 2019;39(1):147–157. doi:10.1111/liv.13957
36. Buckley AF, Burgart LJ, Sahai V, Kakar S. Epidermal growth factor receptor expression and gene copy number in conventional hepatocellular carcinoma. Am J Clin Pathol. 2008;129(2):245–251. doi:10.1309/WF10QAAED3PP93BH
37. Yamaguchi K, Bi C, Ma N. Concomitant and isolated expression of tgf-alpha and egf-r in human hepatoma cells supports the hypothesis of autocrine, paracrine, and endocrine growth of human hepatoma. J Surg Oncol. 1995;58(4):240–245. doi:10.1002/jso.2930580409
38. Baselga J, Gomez P, Greil R, et al. Randomized phase ii study of the anti-epidermal growth factor receptor monoclonal antibody cetuximab with cisplatin versus cisplatin alone in patients with metastatic triple-negative breast cancer. J Clin Oncol. 2013;31(20):2586–2592. doi:10.1200/JCO.2012.46.2408
39. Paul MD, Hristova K. The rtk interactome: overview and perspective on rtk heterointeractions. Chem Rev. 2019;119(9):5881–5921. doi:10.1021/acs.chemrev.8b00467
40. Affo S, Yu LX, Schwabe RF. The role of cancer-associated fibroblasts and fibrosis in liver cancer. Annu Rev Pathol. 2017;12(1):153–186. doi:10.1146/annurev-pathol-052016-100322
41. Wu S, Zheng Q, Xing X, et al. Matrix stiffness-upregulated loxl2 promotes fibronectin production, mmp9 and cxcl12 expression and bmdcs recruitment to assist pre-metastatic niche formation. J Exp Clin Cancer Res. 2018;37(1):99. doi:10.1186/s13046-018-0761-z
42. Liu G, Yin L, Ouyang X, Zeng K, Xiao Y, Li Y. M2 macrophages promote hcc cells invasion and migration via mir-149-5p/mmp9 signaling. J Cancer. 2020;11(5):1277–1287. doi:10.7150/jca.35444
43. Zhou Y, Ren H, Dai B, et al. Hepatocellular carcinoma-derived exosomal mirna-21 contributes to tumor progression by converting hepatocyte stellate cells to cancer-associated fibroblasts. J Exp Clin Cancer Res. 2018;37(1):324. doi:10.1186/s13046-018-0965-2
 © 2021 The Author(s). This work is published and licensed by Dove Medical Press Limited. The full terms of this license are available at https://www.dovepress.com/terms.php and incorporate the Creative Commons Attribution - Non Commercial (unported, v3.0) License.
By accessing the work you hereby accept the Terms. Non-commercial uses of the work are permitted without any further permission from Dove Medical Press Limited, provided the work is properly attributed. For permission for commercial use of this work, please see paragraphs 4.2 and 5 of our Terms.
© 2021 The Author(s). This work is published and licensed by Dove Medical Press Limited. The full terms of this license are available at https://www.dovepress.com/terms.php and incorporate the Creative Commons Attribution - Non Commercial (unported, v3.0) License.
By accessing the work you hereby accept the Terms. Non-commercial uses of the work are permitted without any further permission from Dove Medical Press Limited, provided the work is properly attributed. For permission for commercial use of this work, please see paragraphs 4.2 and 5 of our Terms.