")
Back to Journals » Drug Design, Development and Therapy » Volume 15
Bioequivalence Evaluation of Two Formulations of Tenofovir Alafenamide Tablets in Healthy Subjects Under Fasting and Fed Conditions
Authors Li Q, Jia L, Hu W, Dong S, Cai C
Received 15 February 2021
Accepted for publication 25 May 2021
Published 16 June 2021 Volume 2021:15 Pages 2551—2562
DOI https://doi.org/10.2147/DDDT.S304108
Checked for plagiarism Yes
Review by Single anonymous peer review
Peer reviewer comments 2
Editor who approved publication: Dr Qiongyu Guo
Qiuying Li,1 Lihui Jia,1 Wenli Hu,1 Shu Dong,2 Chaohong Cai1
1Department of Drug Clinical Trial Management Agency, General Hospital of Northern Theater Command, Shenyang, People’s Republic of China; 2Clinical Trial Operations and Management Unit, Jilin Sihuan Pharmaceutical Co. Ltd, Meihekou, People’s Republic of China
Correspondence: Chaohong Cai; Lihui Jia
Department of Drug Clinical Trail Management Agency, General Hospital of Northern Theater Command, Shenyang, People’s Republic of China
Tel +86-24-28897206
Fax +86-24-23890028
Email [email protected]; [email protected]
Purpose: To evaluate the bioequivalence and safety of two formulations of 25 mg tenofovir alafenamide tablets in Chinese healthy male and female subjects under fed and fasting conditions.
Patients and Methods: This was a randomized, open-label, single-center, crossover study consisting of a fasting trial with two periods and a fed trial with four periods. In total, 42 healthy subjects were enrolled in the fasting trial and 32 healthy subjects were enrolled in the fed trial. In each period, blood samples for pharmacokinetic analysis were collected until 72 hours post-dose. The plasma concentrations of tenofovir alafenamide and tenofovir were measured and noncompartmental analysis was used to determine pharmacokinetic parameters. Throughout the entire study, subjects’ safety was monitored by assessment of physical examinations, vital signs, 12-lead electrocardiography, clinical laboratory parameters, and treatment emergent adverse events (TEAEs).
Results: Forty subjects completed the fasting trial and 32 subjects completed the fed trial. The 90% confidence intervals (CIs) of the geometric mean ratios for AUC0-t, AUC0-∞, and Cmax for the two formulations were within 80.00% to 125.00%, which met the bioequivalence acceptance criteria. The study drugs were well tolerated by all subjects.
Conclusion: This study demonstrated that the test formulation of 25 mg tenofovir alafenamide tablets was bioequivalent to the formulation marketed under the brand name VEMLIDY® in healthy Chinese male and female subjects under fasting and fed conditions.
Keywords: tenofovir alafenamide, safety, pharmacokinetics, bioequivalence
Introduction
Chronic hepatitis B (CHB) is an infectious disease caused by the hepatitis B virus (HBV) and can result in fibrosis, cirrhosis, and hepatocellular carcinoma (HCC). In 2017, the World Health Organization (WHO) announced that over 390 million people were positive for hepatitis B surface antigen (HBsAg).1 Globally, HCC is the third-leading cause of cancer deaths, and there is a high disease burden in areas where HBV is endemic.2 In Asian and the Western Pacific regions, the morbidity from HBV infection is higher than that in northern European countries and the United States.3 Within Asia, China has a higher HBsAg seroprevalence and a huge population.4 CHB requires long-term treatment and the burden to the patient and the healthcare system is substantial. Various efforts and different levels of progress have been made by different countries with respect to controlling HBV infection and the treatment of CHB disease, with the ultimate aim of eliminating viral hepatitis as a public health threat by 2030.5
To prevent death from cirrhosis and HCC caused by CHB, appropriate therapeutic agents are needed. The current first-line clinical therapy for CHB disease is oral antiviral medicine. It has been effective in terms of continuous viral suppression in patients with CHB.6 Tenofovir disoproxil fumarate (TDF) remains widely used and is recommended in several updated guidelines on HBV infection.6 However, nephrotoxicity and reduction in bone mineral density were observed in patients using TDF over long periods.7,8 Therefore, alternative drugs with high antiviral efficiency and a good safety profile are urgently needed for the treatment of CHB.
Tenofovir alafenamide (formerly GS-7340, TAF) is a new nucleotide analog for the treatment of CHB. TAF is a prodrug of tenofovir (TFV) and is efficiently hydrolyzed to TFV by intracellular enzymes.9–11 Compared with TDF, TAF is more stable in plasma and remains more intact after penetration through hepatocytes; delivering a higher proportion of active metabolite (tenofovir diphosphate).12,13 Therefore, a lower dose of TAF can realize a higher antiviral efficacy with a lower concentration in vivo and less renal accumulation of TFV.14,15
In previous studies, TAF had significantly lower effects on renal function and bone mineral density than TDF.7,16 A Phase 1 clinical study conducted by Agarwal et al compared the efficacy and safety of 300 mg TDF to 8, 25, 40, or 120 mg TAF for the treatment of CHB over 28 days.17 It was found that at TAF doses of 25 mg or lower, TFV exposure was reduced significantly, by over 92%, relative to TDF.17 Two large-scale Phase 3 clinical studies have been performed, comprising 285 and 581 patients with HBV who received 25 mg TAF once daily for 96 and 48 weeks, respectively.18,19 Over 48 weeks of treatment, TAF led to smaller changes in albumin and protein levels in the urine. In terms of bone mineral density, the mean percentage change for TAF was lower than that of the TDF arms at week 48. An unexpected finding was that patients receiving TAF had an increased proportion of normalized alanine aminotransferase than the patients receiving TDF19 These results show that TAF may cause highly efficient viral suppression and have a good safety profile.
TAF was developed by Gilead Sciences, Inc., and is sold under the trade name VEMLIDY®. TAF is already approved in the USA and the European Union, and was approved as a new drug in China for the treatment of CHB in adults and adolescents (over 12 years of age, with a body weight of over 35 kg) in 2018. TAF’s compound patents are licensed in China, Europe, Japan, the United States and other countries. TAF’s compound patents expire in China, Europe and Japan as early as July 2021. As the patent is about to expire, many Chinese domestic enterprises have begun to layout the TAF generic drug market. In China, drug companies can develop this drug before the patent expires and then market it after the protection period has passed. According to the “Drug Registration Administration Measures”, TAF’s application for registration is classified as Class 4, which is a copy of an original drug already on the market in China. This kind of drug should be consistent with the quality and efficacy of the original drug. CHB requires long-term treatment and it carries a heavy financial burden. Thus, the availability of a generic formulation made in China, which is equivalent to the brand in terms of efficacy and quality, would be of great importance for the treatment of CHB, as it would be affordable for Chinese patients. Currently, there are limited pharmacokinetic data on TAF in healthy Chinese subjects. Therefore, this study was conducted to evaluate the pharmacokinetic parameters of TAF after dosing of 25 mg tenofovir alafenamide tablets under fasting and fed conditions, and the results showed that the two formulations were bioequivalent in healthy Chinese subjects.
Materials and Methods
Study Design and Subjects
This was a randomized, open-label, single-center, crossover study consisting of a fasting trial with two periods and a fed trial with four periods. The washout period between study drug administration in each of these trials was 10 days. This study was performed in accordance with the Declaration of Helsinki and the Good Clinical Practice guidelines. The clinical protocols for the fasting trial and fed trial were approved (approval No. 2019–35 and 2019–36) by an independent institutional ethics committee at the General Hospital of Northern Theater Command. The trials were registered with registration number CTR20191561 and CTR20191570, respectively.
Fasting Trial
Subjects were assigned a screening number and subsequently allocated a randomization number. The subjects were randomized to either sequence TR (test product in the first period and reference product in the second period) or sequence RT (reference product in the first period and test product in the second period) according to the randomization number and drug allocation table. Forty-two eligible subjects participated in the fasting trial and received 25 mg tenofovir alafenamide tablets. In each period, subjects were fasted from all food and drink (excluding mineral water) for a minimum of 10 hours prior to drug administration, and took one tablet of the test or reference preparation with 240 mL of water.
Fed Trial
Subjects were assigned a screening number, and subsequently allocated a randomization number. The subjects were randomized to either sequence TRTR (test product in the first period, reference product in the second period, test product in the third period, and reference product in the fourth period) or sequence RTRT (reference product in the first period, test product in the second period, reference product in the third period, and test product in the fourth period) according to the randomization number and drug allocation table. Thirty-two eligible subjects participated in the fed trial and received 25 mg tenofovir alafenamide tablets. In each period, subjects were fasted from all food and drink (except mineral water) for a minimum of 10 hours, and were then required to consume a high-calorie, high-fat meal (approximately 150 kcal of protein, 250 kcal of carbohydrate, and 500 kcal of fat) 30 minutes before dosing. The study drugs were taken with 240 mL of water.
Trial Conduct
Before any study procedures were performed, all subjects voluntarily signed an appropriate informed consent form. Eligibility assessments were performed within 14 days of the first dose to ensure that subjects met the inclusion criteria and did not meet any exclusion criteria. The inclusion criteria were as follows: healthy subjects of 18 years of age or older at screening, with a body mass index (BMI) between 19 and 26 kg/m2, with a body weight of not less than 50 kg for men and not less than 45 kg for women; normal or no clinical significant results for vital signs (blood pressure, pulse, and body temperature), physical examinations, 12-lead electrocardiograms, and clinical laboratory examinations (hematology, urinalysis, glucose, renal and liver function, coagulation function, and serology) at the time of screening; no plan to donate whole blood or components of blood (eg, plasma, platelets) from the beginning until the completion of the final study; no plan to donate eggs or sperm or for the subject/subject’s partner to become pregnant within 3 months of final study drug administration; and voluntarily taking effective contraceptive measures. The exclusion criteria comprised individuals with known contraindications or hypersensitivity to tenofovir alafenamide; liver dysfunction, renal insufficiency, or clinically significant abnormal hematology; positive test results for HBsAg, anti-HCV, anti-TP and/or anti-HIV antibodies; any surgical procedure or disease that may have affected the absorption of drugs, such as dyspepsia, esophageal reflux, gastric bleeding or peptic ulcer within 6 months prior to screening; smoking more than five cigarettes per day; excessive daily consumption of tea, coffee and/or caffeine-rich beverages (eight or more cups, 1 cup = 250 mL) during the 3 months prior to screening; use of any prescribed drug within 28 days before dosing; drug or alcohol abuse; any lifestyle conditions or special diet that may have significantly alter the absorption, distribution, metabolism or excretion of the study preparations within 48 hours of the first dosing day; participated in other clinical trial within 3 months; history of difficulty with blood collection, including needles; and any other conditions deemed unsuitable for inclusion by the investigator. In each period, all female subjects were tested for pregnancy on the day before study preparation administration.
Eligible subjects for the fasting and fed trials were admitted to the clinic in the afternoon of the day before dosing. Water was allowed 1 hour before and after dosing. Standard meals were given 4 hours and 10 hours post dose. After drug administration, subjects’ physical activity was restricted. Vital signs measurements were collected before dosing and at 2, 8, 24, 48, and 72 hours after dosing. TEAEs were assessed throughout the entire study.
Study Preparations
In both the fasting and fed trials, the test preparation was 25 mg tenofovir alafenamide tablets (batch number: S20190302, content: 99.1%), produced by Jilin Sihuan Pharmaceutical Co. Ltd. (China) and the reference preparation was VEMLIDY® (batch number: 013162, content: 98.8%), produced by Gilead Sciences, Inc. (Singapore) Pte. Ltd.
Safety Evaluations
TEAEs were classed as adverse events appearing after receiving the medication. TEAEs and other safety parameters, including clinical laboratory examinations, vital signs, 12-lead ECG, and physical examination, were recorded during the entire study. The TEAEs were coded using the Medical Dictionary for Regulatory Activities (MedDRA) 22.0. TEAEs were determined based on the Common Terminology Criteria Adverse Events (CTCAE) 5.0 standard.
Sample Size Estimation
The sample size of the clinical trial was estimated from the intra-individual variation of AUC or Cmax. The fasting trial used a two-period crossover design. On the assumption that the intra-individual CV was 30%, a geometric mean ratio between 0.95 and 1.05, and alpha=0.05 (0.10 for both sides) for a one-sided test using PASS (Version 14.0.7) software, the sample size required to meet the bioequivalence standard was determined to be 38 subjects. To reduce the number of subjects required, the fed trial used a four-period crossover design. Using a geometric mean ratio between 0.95 and 1.05 and alpha=0.05 (0.10 for both sides) for a one-sided test, the sample size determined from a table look-up scheme to meet the standard requirements of bioequivalence was 26 subjects.20 After taking into account the potential for withdrawal of consent or dropout, the fasting trial enrolled 42 subjects and the fed trial enrolled 32 subjects.
Blood Sampling
In the fasting trial, 5 mL blood samples were collected prior to dosing and at 0.17, 0.25, 0.33, 0.5, 0.75, 1.0, 1.25, 1.5, 2.0, 2.5, 3.0, 4.0, 5.0, 8.0, 12, 24, 36, 48, and 72 hours after dosing from an indwelling catheter. In the fed trial, 5 mL blood samples were collected prior to dosing and at 0.17, 0.33, 0.5, 0.75, 1.0, 1.25, 1.5, 2.0, 2.33, 2.67, 3.0, 4.0, 5.0, 8.0, 12, 24, 48, and 72 hours after dosing from indwelling catheter.
Vacutainer K2EDTA anticoagulant tubes were precooled in advance before sample collection. After blood collection, the sample tubes were slightly inverted, mixed, and immediately placed in an ice bath. The collected blood samples were centrifuged (1700 ×g, 10 minutes, 4°C) and the plasma was transferred into two clean tubes (an analytical sample and a backup) on ice. The plasma samples were then stored at ≤–60°C until analysis.
Analysis of Drug Concentration
Validated liquid chromatography-tandem mass spectrometry (LC-MS/MS) methods are established for assaying the concentrations of TAF and TFV in human plasma. The lower limit of quantification (LLOQ) for TAF and TFV was 0.40 and 0.20 ng/mL, respectively. The linear ranges of the calibration curves were 0.40–400 ng/mL for TAF and 0.20–30 ng/mL for TFV. For TAF and TFV, the LLOQ was 0.40 and 0.20 ng/mL, the LOQ was 1.2 and 0.6 ng/mL, the GMOQ was 12 and 2.5 ng/mL, the MOQ was 120 and 12 ng/mL, and the HOQ was 320 and 24 ng/mL, respectively. The precision, expressed as the coefficient of variation (CV), ranged from 1.7% to 5.1% for intra-batch precision and 2.7% to 4.4% for inter-batch precision for TAF and from 1.6% to 7.3% for intra-batch precision and 2.0% to 6.4% for inter-batch precision for TFV. The accuracy ranged from 97.2% to 105% for intra-batch accuracy and 98.5% to 103.3% for inter-batch accuracy for TAF, and from 96.5% to 105% for intra-batch accuracy and 100% to 101.2% for inter-batch accuracy for TFV. The results of stability tests indicated that TAF and TFV were stable from the period of collection to post treatment. The Analyst software (versions 1.6.2 and 1.6.3; Applied Biosystems, USA) was used for data acquisition and integration and the concentrations were calculated using Watson LIMS 7.4.1 (Thermo Fisher Corporation, USA).
Pharmacokinetic Evaluation
The mean, standard deviation, median, maximum, minimum, and CV of plasma concentration at each time point were listed in the pharmacokinetics concentration set (PKCS). The pharmacokinetic parameters of each subject were calculated based on the PKCS by a noncompartmental model. Cmax and Tmax were directly observed from the plasma concentration versus time profiles. The apparent elimination rate constant (λz) was calculated using the last measurable concentration. The elimination half-life (t1/2) was calculated from the formula: In2/λz. The area under the concentration versus time curve from time 0 to time of the last quantifiable drug concentration (AUC0–t) was calculated using the log-linear trapezoidal method. The area under the concentration versus time curve from time 0 to infinity (AUC0-∞) was calculated according to the formula: AUC0-t + Ct/λz, where Ct was the last quantifiable drug level. %AUCex was calculated according to the formula: (AUC0–∞ – AUC0–t)/AUC0–∞ × 100%.
Statistical Analysis
The safety and bioequivalence evaluations were analyzed using SAS 9.4 (SAS Institute, Cary, NC, USA) and WinNonlin® 8.1 statistical software (Pharsight Corporation, Mountain View, CA, USA). The arithmetical mean, standard deviation (SD), coefficient of variation (CV), maximum, minimum, and geometric mean (GM) of all subjects’ parameters were used to describe inter-individual variation. After natural logarithmic (ln) transformation of the major pharmacokinetic parameters (Cmax, AUC), a linear mixed effects model was used for analysis. In the model, sequence, period, and treatment were considered as fixed effects, and subject (sequence) was considered as a random effect. The 90% CIs of the geometric mean ratio of major pharmacokinetic parameters of two drugs were calculated, and their equivalence was compared. SWR is the ln-transformed value of intra-individual standard deviation for the reference formulation. If SWR <0.294, that is, the intra-individual coefficient of variation of the reference formulation (CVWR) <30%, the average bioequivalence (ABE) was used to evaluate bioequivalence. If SWR was ≥0.294, that is CVWR was ≥30%, reference-scaled average bioequivalence (RSABE) was used to evaluate bioequivalence. The acceptance criteria for bioequivalence were that the 90% CI of the geometric mean ratio of major pharmacokinetic parameters of both study preparations were within 80–125%.
Results
Subjects’ Disposition and Demography
In the fasting trial, 128 subjects were screened and 42 healthy subjects were enrolled. Overall, 40 subjects completed the study: one subject withdrew consent due to personal reasons in the first period without dosing and one subject withdrew owing to a TEAE in the first period on the day of dosing. The eligible subjects were 31 male subjects and 11 female subjects, between 20 and 48 years of age, with a BMI between 19.30 and 25.90 kg/m2.
In the fed trial, 97 subjects were screened and 32 healthy subjects were enrolled. All subjects completed the fed trial. The eligible subjects were 20 male subjects and 12 female subjects, between 18 and 46 years of age, with a BMI between 19.10 and 25.80 kg/m2. Subject demographics are presented in Table 1.
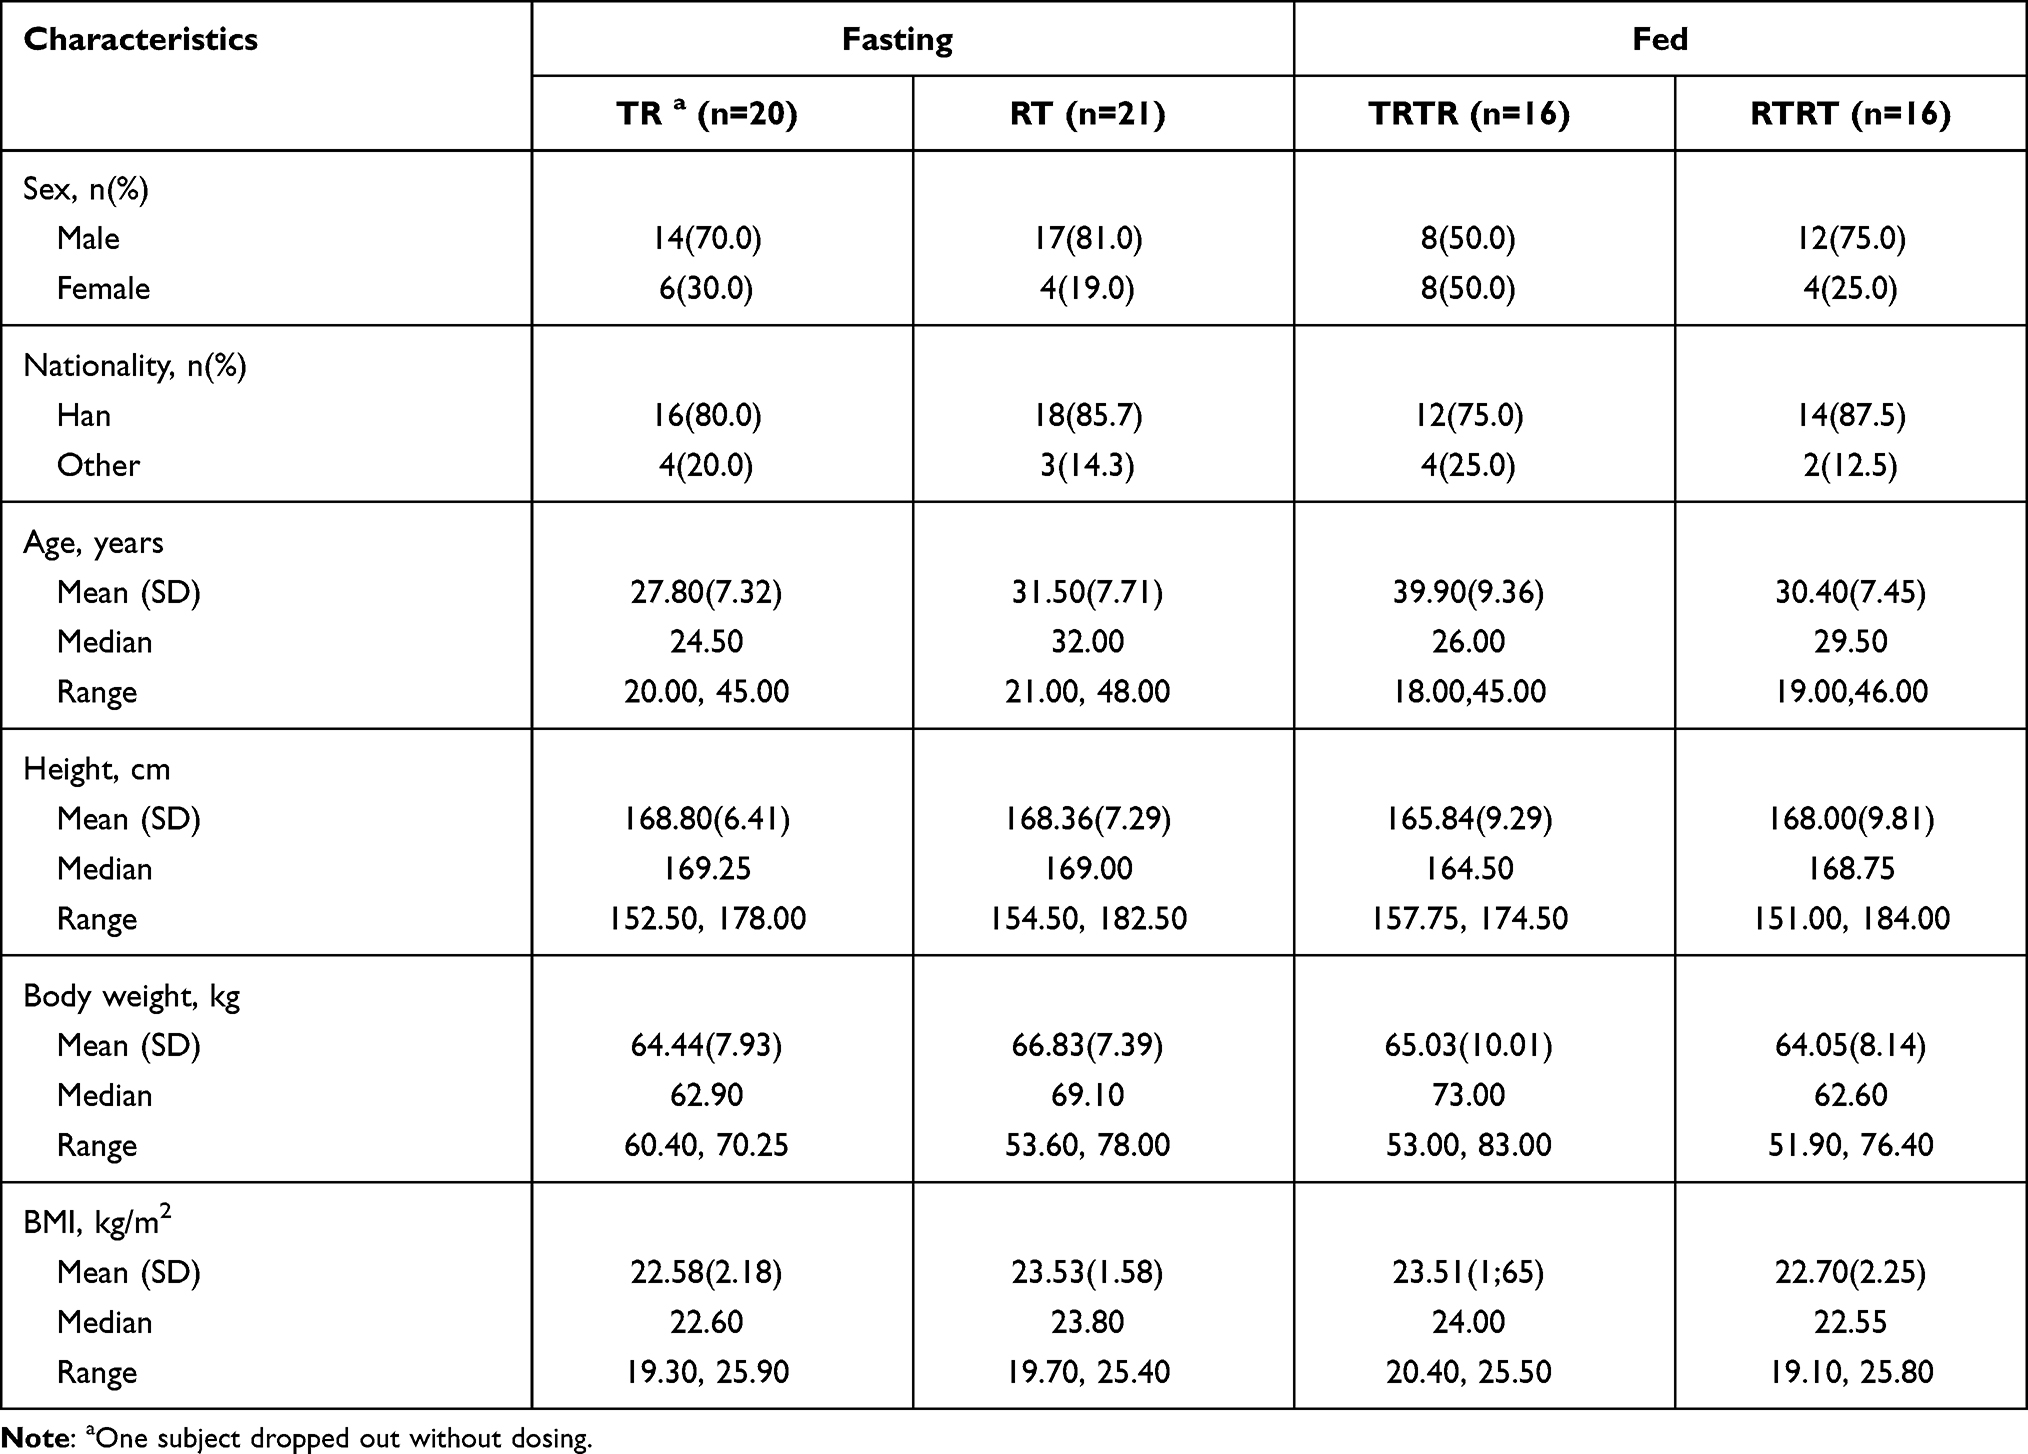 |
Table 1 Demographics of the Subjects Under Fasting and Fed Conditions |
Pharmacokinetic Analysis
In the fasting trial, after oral administration of 25 mg tenofovir alafenamide as the test and reference formulations, the Cmax values of TAF were 270.32 (140.40) ng/mL for the test drug and 278.14 (150.13) ng/mL for the reference drug, the AUC0-t values of TAF were 138.24 (62.58) h.ng/mL for the test drug and 145.80 (63.14) h.ng/mL for the reference drug, and the AUC0-∞ values of TAF were 138.63 (62.64) h.ng/mL for the test drug and 146.24 (63.23) h.ng/mL for the reference drug. The detailed pharmacokinetic data for TAF and TFV are presented in Table 2. The mean concentration versus time curves of TAF and TFV are presented in Figure 1.
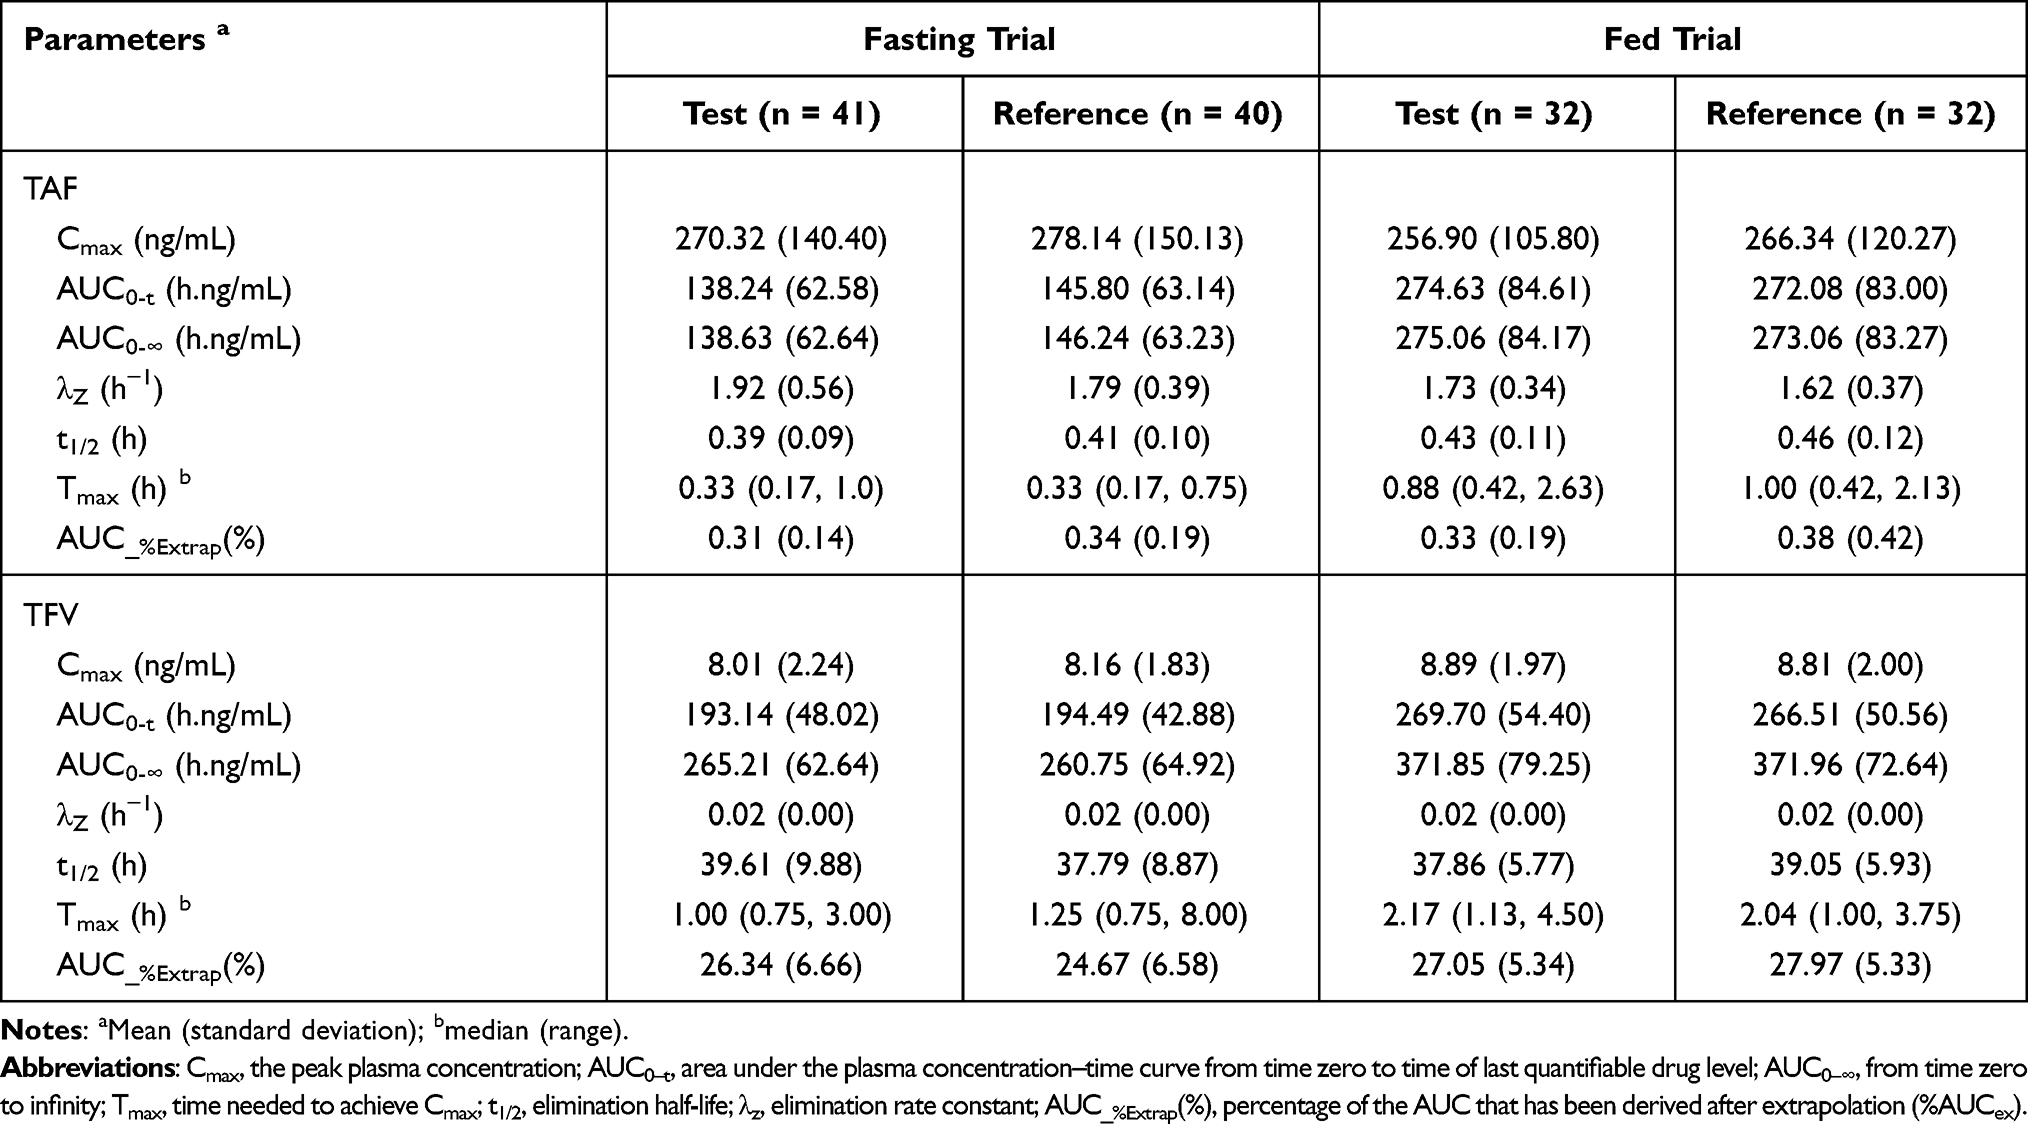 |
Table 2 Pharmacokinetic Parameters of Subjects After Single Dose of 25 mg Tenofovir Alafenamide Tablets Under Fasting and Fed Conditions |
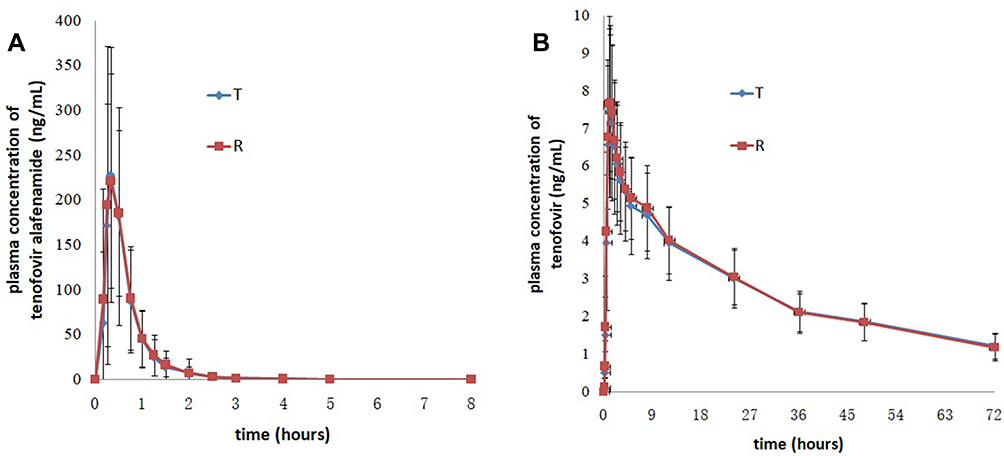 |
Figure 1 Mean plasma concentration versus time profiles of tenofovir alafenamide (A) and tenofovir (B) after single dose of the test and reference drugs under fasting conditions. Notes: Test drug, 25 mg tenofovir alafenamide tablets; reference drug, 25 mg tenofovir alafenamide tablets (VEMLIDY®). |
In the fed trial, after oral administration of 25 mg tenofovir alafenamide of test and reference formulations, the Cmax values of TAF were 256.90 (105.80) ng/mL for the test drug and 266.34 (120.27) ng/mL for the reference drug, the AUC0-t values of TAF were 274.63 (84.61) h.ng/mL for the test drug and 272.08 (83.00) h.ng/mL for the reference drug, and the AUC0-∞ values of TAF were 275.06 (84.17) h.ng/mL for the test drug and 273.06 (83.27) h.ng/mL for the reference drug. The detailed pharmacokinetic data for TAF and TFV are presented in Table 2. The mean concentration versus time curves for TAF and TFV are presented in Figure 2.
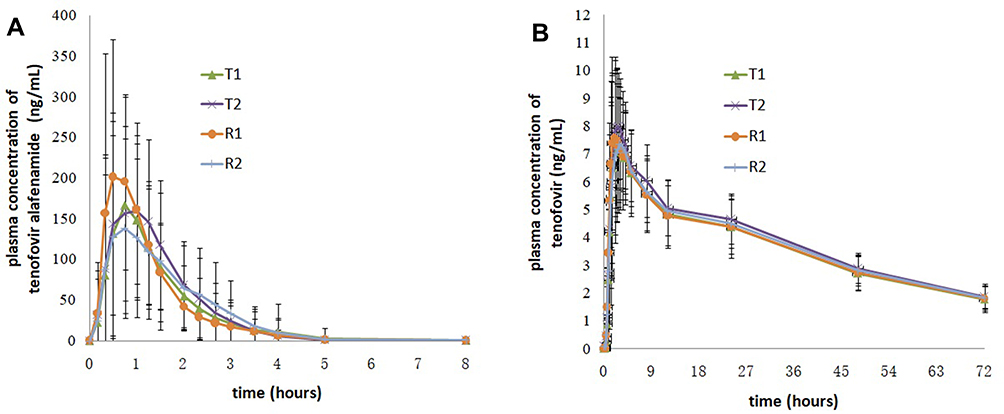 |
Figure 2 Mean plasma concentration versus time profiles of tenofovir alafenamide (A) and tenofovir (B) after single dose of the test and reference drugs under fed conditions. Notes: Test drug, 25 mg tenofovir alafenamide tablets; reference drug, 25 mg tenofovir alafenamide tablets (VEMLIDY®). |
Bioequivalence Analysis
In the fasting trial, the bioequivalence assessment results showed that the geometric mean ratios (90% CI) were 97.52% (83.72%, 113.59%), 95.93% (89.10%, 103.30%), and 95.91% (89.09%, 103.24%) for the Cmax, AUC0-t, and AUC0-∞ of TAF, respectively. The bioequivalence assessment of TAF and TFV after administration of 25 mg tenofovir alafenamide tablets is presented in Table 3.
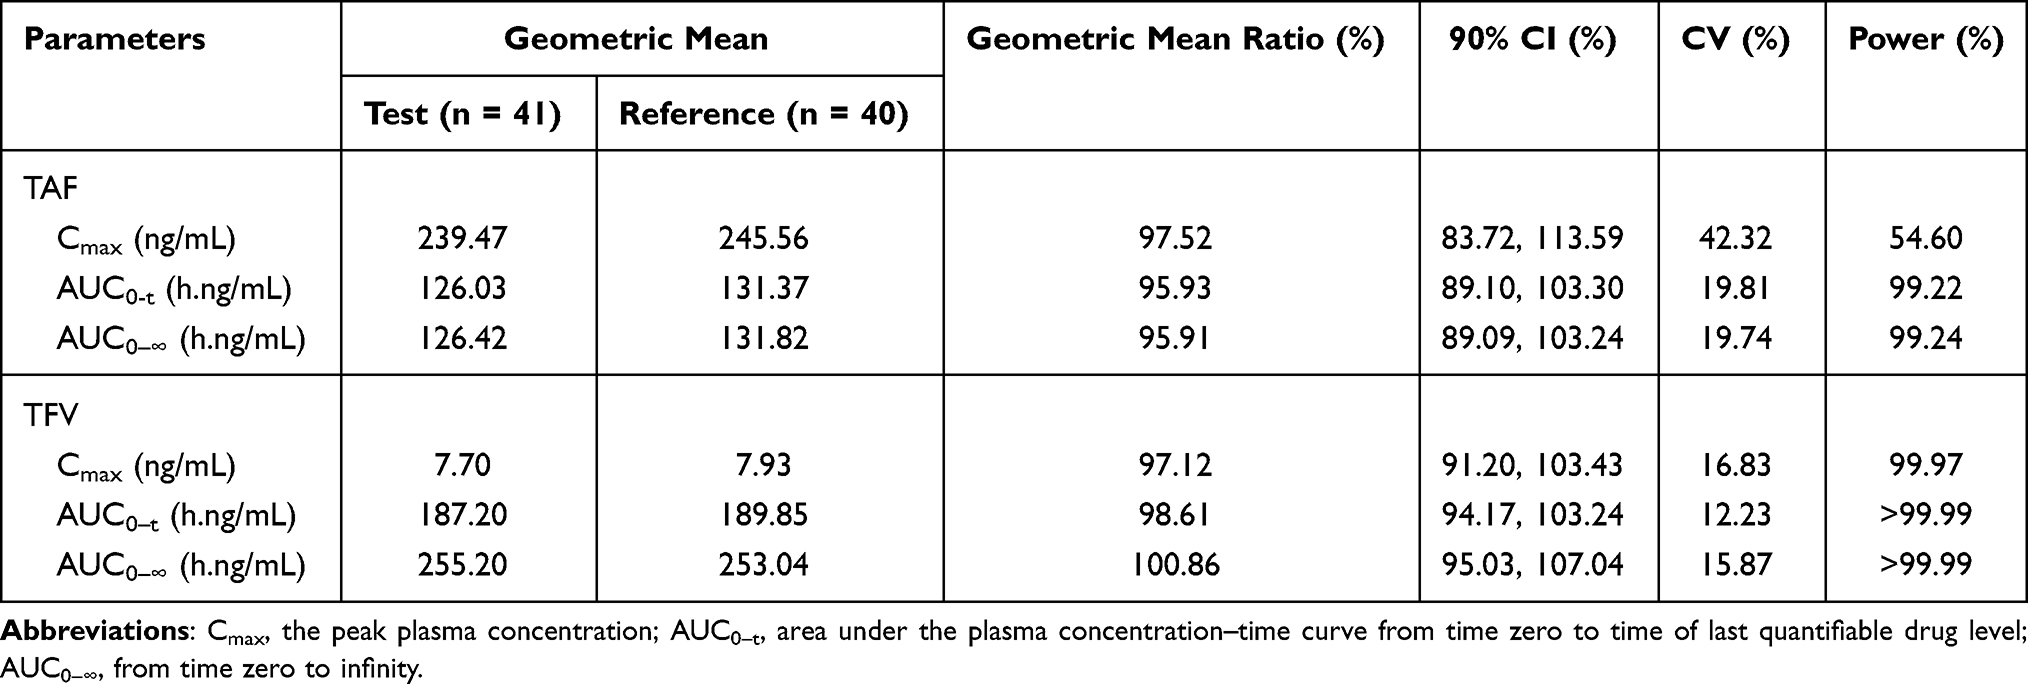 |
Table 3 The Pharmacokinetic Parameters and Bioequivalence Assessment of TAF and TFV After Administration of 25 mg Tenofovir Alafenamide Tablets Under Fasting Condition |
In the fed trial, the bioequivalence assessment results showed that the geometric mean ratios (90% CI) were 100.62% (86.87%, 116.56%), 101.36% (95.65%, 107.41%) and 101.11% (95.39%, 107.19%) for the Cmax, AUC0-t, and AUC0-∞ of TAF, respectively. The bioequivalence assessment of TAF and TFV after administration of 25 mg tenofovir alafenamide tablets is presented in Table 4. Under fed conditions, the CVWR of Cmax of TAF for the reference formulation was >30%; therefore, RSABE was used to evaluate bioequivalence. The 90% CIs of the geometric mean ratio of Cmax for TAF under fed conditions was 1.01, which was within the pre-specified acceptable bioequivalence range of 0.80–1.25 (Table 5).
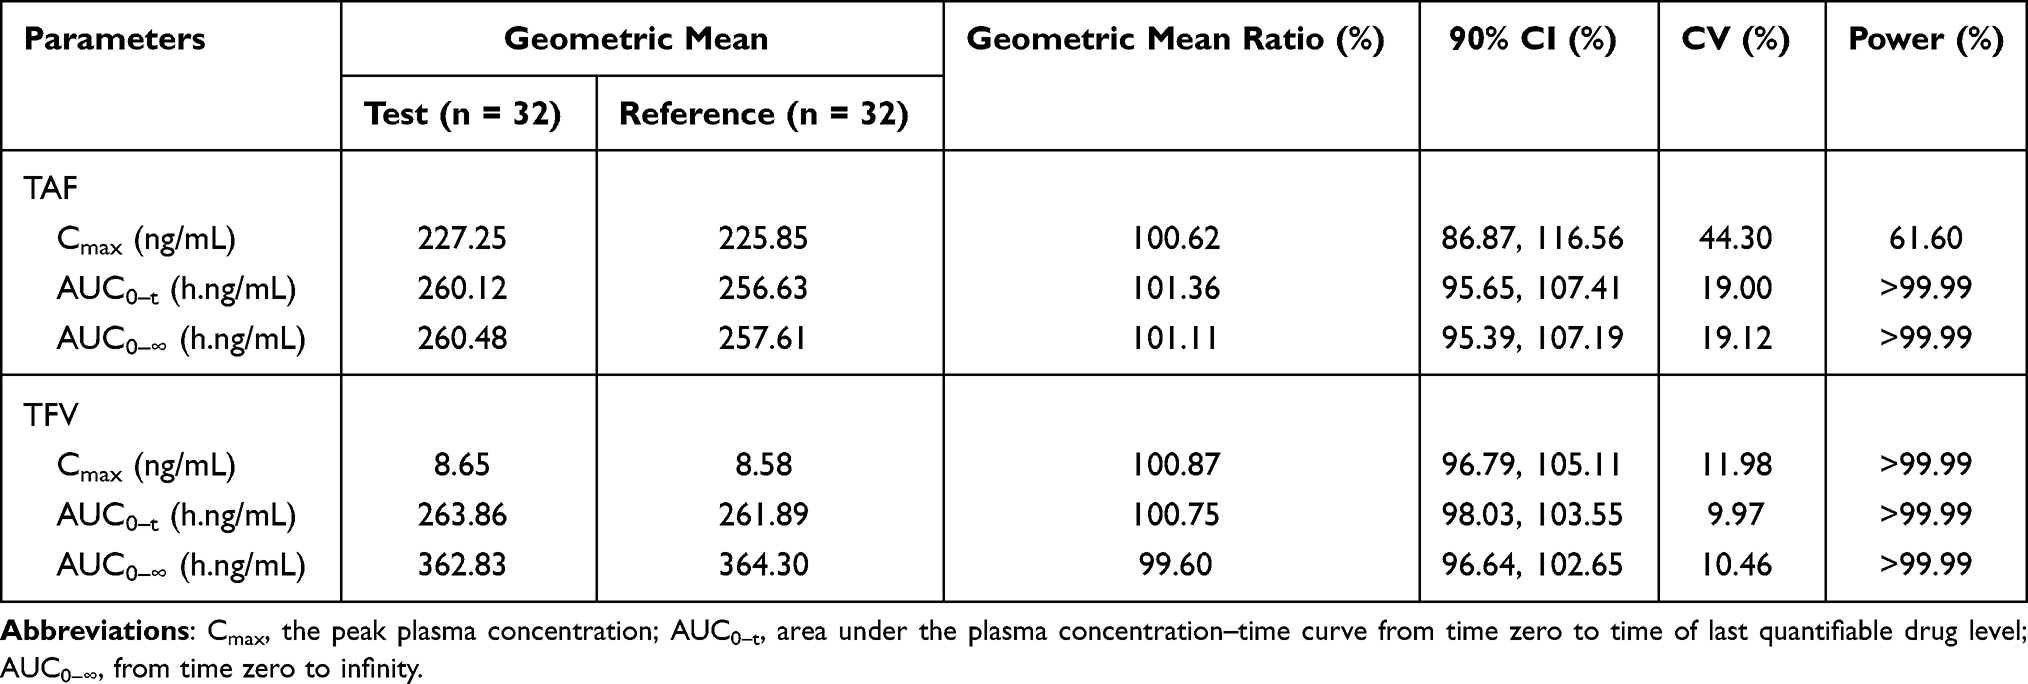 |
Table 4 The Pharmacokinetic Parameters and Bioequivalence Assessment of TAF and TFV After Administration of 25 mg Tenofovir Alafenamide Tablets Under Fed Condition |
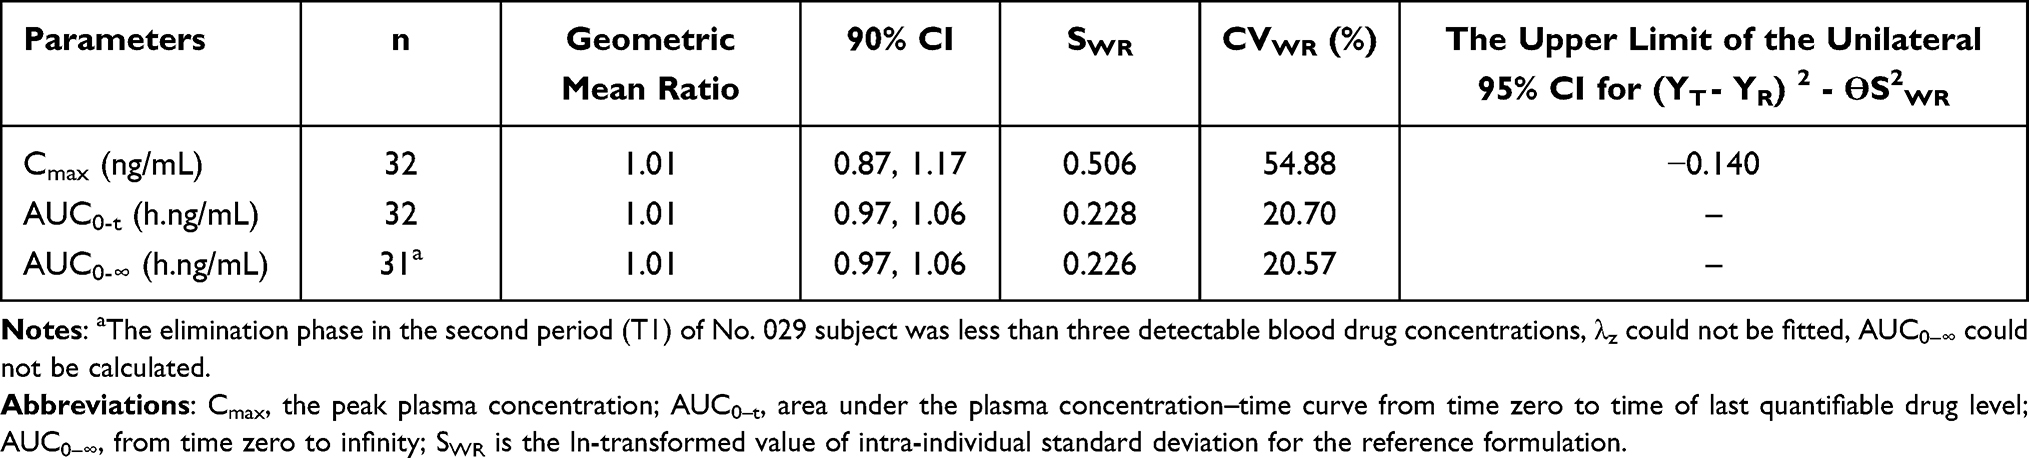 |
Table 5 Bioequivalence Assessment of TAF Using RSABE Method Under Fed Condition |
The ANOVA results of TAF and TFV under fed and fasted conditions are presented in Table 6. No significant effects (P >0.05) were found on the Cmax, AUC0-t, and AUC0-∞ of TAF and TFV for sequence, period, and treatment under fasting conditions. In contrast, under fed conditions, period had a significant effect (P <0.05) on the AUC0-t and AUC0-∞ of TAF, and a significant effect (P <0.05) on the Cmax, AUC0-t, and AUC0-∞ of TFV.
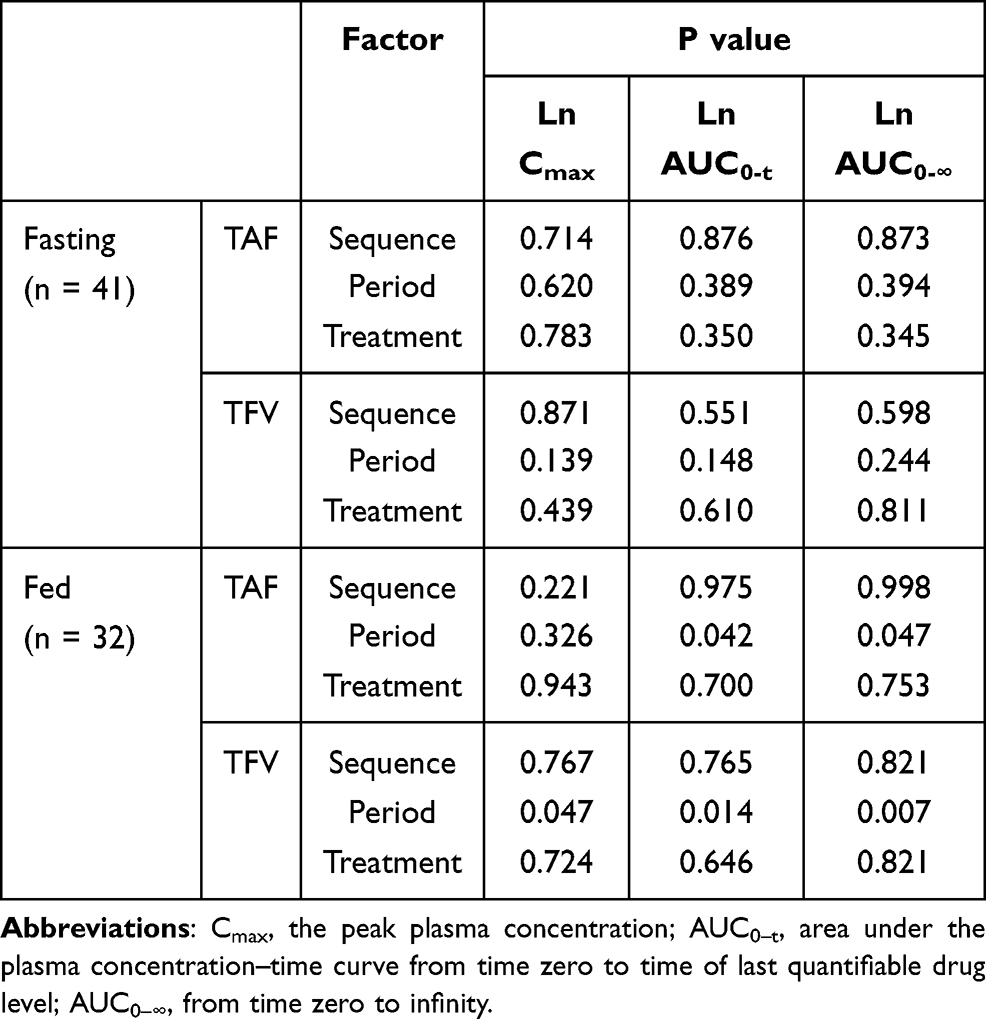 |
Table 6 ANOVA of TAF and TFV Under Fasting and Fed Conditions |
Safety
TEAEs were both for the fasting and fed trials. An adverse drug reaction (ADR) was defined as a drug-related adverse event.
In the fasting trial, 18 TEAEs were recorded for 15 subjects, a total incidence of 36.6%, with 4 TEAEs judged as possibly related to the study drug. The withdrawal of one subject in the fasting trial was due to tetany in the first period. The four ADRs in the fasting trial were nausea, dizziness, and drowsiness. In the fed trial, 21 TEAEs were recorded for 15 subjects, a total incidence of 46.9%, with 1 TEAE determined to be related to the study drug. The ADR in the fed trial was drowsiness.
All AEs recorded in the study were improved, cured, or disappeared. The ADRs of this study were consistent with those reported in the drug information. No deaths or SAEs occurred during the study. The incidence rate and comparison of TEAEs for the test and reference products are shown in Table 7.
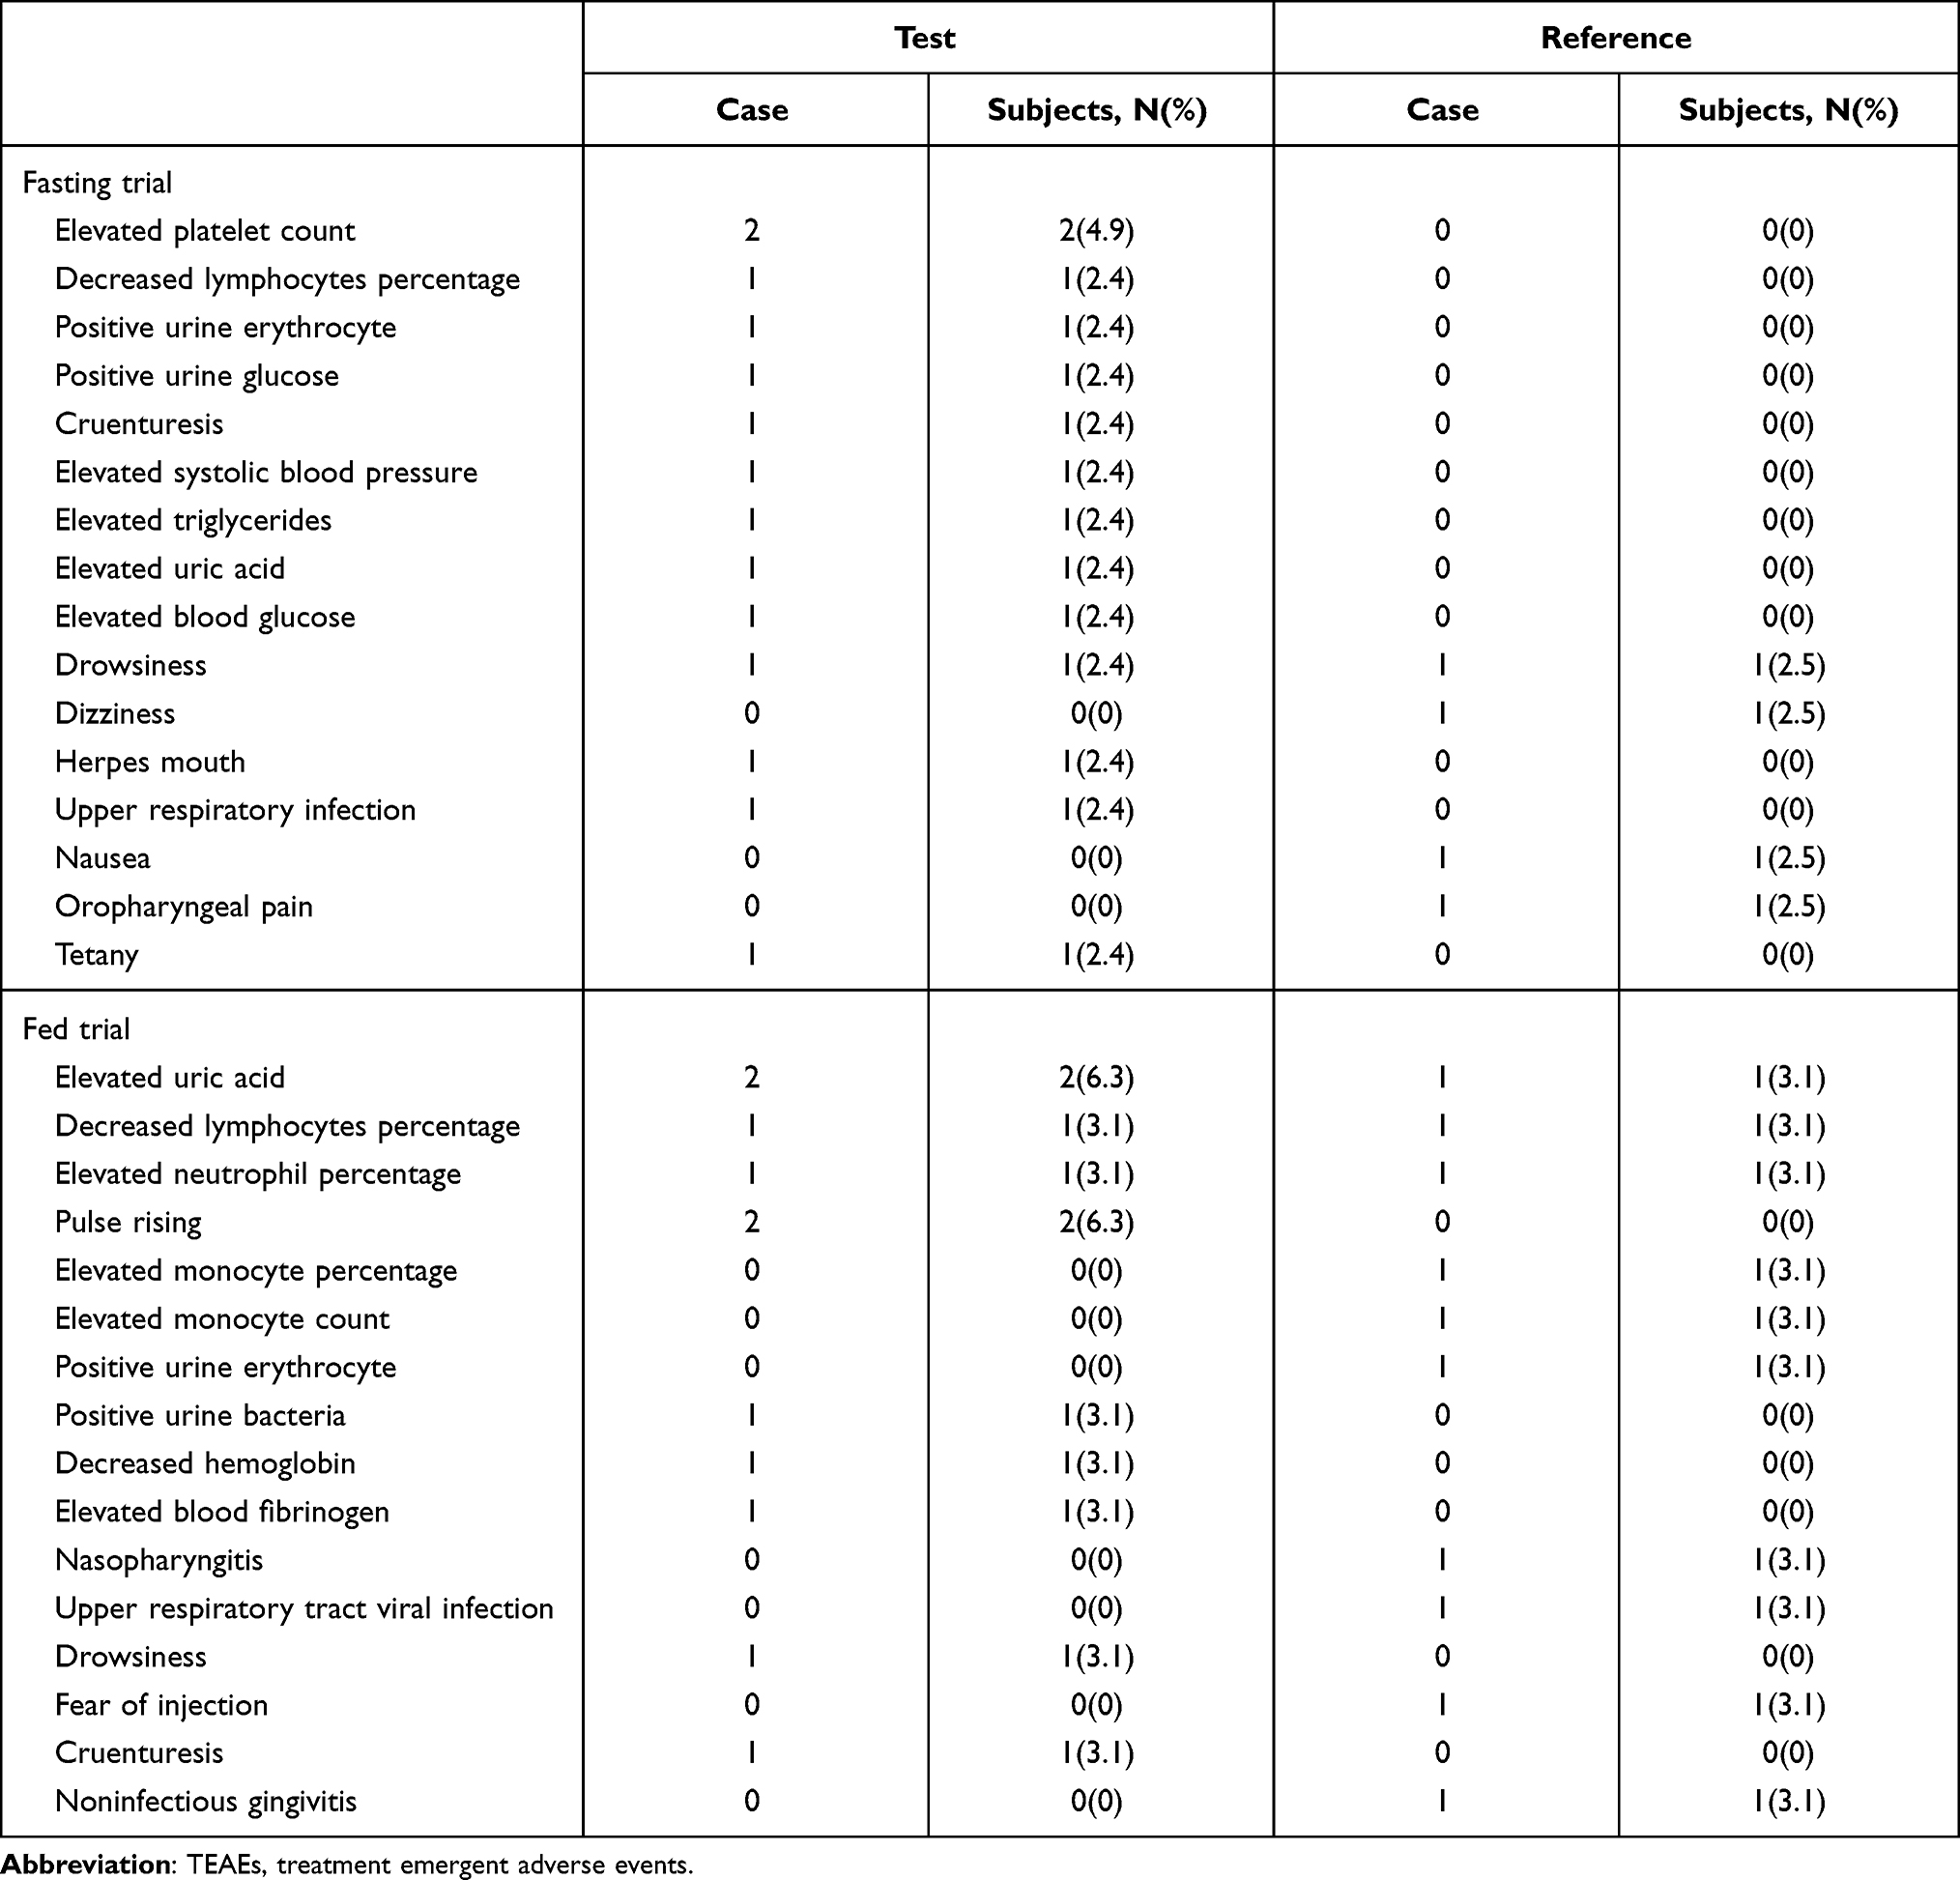 |
Table 7 Incidences of TEAEs in Subjects of the Test and Reference Formulations |
Discussion
Pharmacokinetic Comparison
The pharmacokinetic characteristics of TAF and TFV were evaluated based on the plasma concentrations of these two compounds and are fully described in this study. The rate of absorption after single oral dose of 25 mg tenofovir alafenamide tablets was assessed by Cmax and tmax.
In the fasting trial, the Cmax values for TAF were 270.32 (140.40) ng/mL for the test formulation and 278.14 (150.13) ng/mL for the reference formulation. In the fed trial, the Cmax values for TAF were 256.90 (105.80) ng/mL for the test formulation and 266.34 (120.27) ng/mL for the reference formulation, which were similar to those in the fasting trial. Thus, it could be concluded that food did not affect the Cmax of TAF after oral administration of 25 mg tenofovir alafenamide tablets.
In the fasting trial, the plasma concentration of TAF increased rapidly: the tmax was 0.33 hours for the test and reference formulations; concentrations declined up until 8 hours post-dose, when TAF was no longer detected in plasma. In the fed trial, tmax of TAF was 0.88 hours for test formulation and 1.00 hour for reference formulation, and TAF was no longer detectable in plasma after 8 hours post-dose. Compared with the fasting trial, the tmax of TAF in the fed trial was delayed. Thus, it was concluded that food could delay the time to reach Cmax and affect the rate of absorption of TAF in systemic circulation.
The extent of absorption after single oral dose of 25 mg tenofovir alafenamide tablets was evaluated using AUC0-t and AUC0-∞.
In the fasting trial, the mean AUC0-t of TAF for the test and reference formulations was 138.24 (62.58) h.ng/mL and 145.80 (63.14) h.ng/mL, respectively, the mean AUC0-∞ of TAF for the test and reference formulations was 138.63 (62.64) h.ng/mL and 146.24 (63.23) h.ng/mL, respectively. The mean AUC0-t of TFV for the test and reference formulations was 193.14 (48.02) h.ng/mL and 194.49 (42.88) h.ng/mL, respectively, and the mean AUC0-∞ was 265.21 (62.64) h.ng/mL and 260.75 (64.92) h.ng/mL, respectively. These values were similar to those in published literature.17 At present, there are limited reports on the influence of food on the exposure of TAF in healthy Chinese male and female subjects.
In the fed trial, the mean AUC0-t of TAF for the test and reference formulations was 274.63 (84.61) h.ng/mL and 272.08 (83.00) h.ng/mL, respectively, the mean AUC0-∞ of TAF for the test and reference formulations was 275.06 (84.17) h.ng/mL and 273.06 (83.27) h.ng/mL, respectively. The mean AUC0-t of TFV for the test and reference formulations was 269.70 (54.40) h.ng/mL and 266.51 (50.56) h.ng/mL, respectively, and the mean AUC0-∞ of TFV for the test and reference formulations was 371.85 (79.25) h.ng/mL and 371.96 (72.64) h.ng/mL, respectively.
After food intake, the mean AUC0-t and AUC0-∞ of TAF and TFV were both larger than those obtained in the fasting trial; systemic TAF exposure in the fed trial was almost twice as high as that in fasting trial. Compared with the existing literature,17 TAF exposure after a single oral dose of 25 mg tenofovir alafenamide tablets under fed conditions was equivalent to a 40 mg TAF dose under fasting conditions, indicating that fed dosing could increase the system exposure of TAF in the system and increase the extent of absorption of TAF. That is, the bioavailability of TAF was improved when the drug was taken with food.
From the mean concentration versus time curves of TAF under fed conditions, it was found that the curves were different for subjects randomized to the R1 (received reference formulation for the first time) and R2 (received reference formulation for the second time) sequences. The mean plasma concentrations for the R1 sequence occurred from 0.17 to 1.25 hours, which was higher than for the R2 sequence, and the mean plasma concentrations for the R1 sequence were lower than for the R2 sequence. Compared with the R2 sequence, the plasma concentrations of TAF for the R1 sequence had a relatively fast absorption phase and the elimination was also relatively fast. As the CV of TAF was above 30%, these differences in plasma concentrations were expected to be observed when subjects were administered the reference formulations. The mean Cmax of the reference formulation was 266.34 (120.27) ng/mL, which was similar to that of the test formulation (256.90 [105.80] ng/mL). The mean AUC0-t of TAF for the test and reference formulations was 138.24 (62.58) h.ng/mL and 145.80 (63.14) h.ng/mL, respectively, and the mean AUC0-∞ of TAF for the test and reference formulations were 138.63 (62.64) h.ng/mL and 146.24 (63.23) h.ng/mL, respectively. Thus, it could be concluded that there were no differences in the rate and extent of absorption between the reference and test formulation.
In this study, the mean %AUCex of TAF for the two formulations was <20%, indicating that sampling to 72 hours was sufficient to describe the PK profile. TFV is a metabolite of TAF, and the half-life is 100 times longer. The sampling time is not sufficient to describe the PK profile of TFV, as indicated by the mean %AUCex of TFV being mostly >20%. As the %AUCex was not part of the evaluation of bioequivalence and the geometric mean ratios (90% CI) of Cmax, AUC0-t, and AUC0-∞ of TFV were within the acceptance criteria for bioequivalence (80%, 125%), the bioequivalence results were not affected.
The plasma t1/2 values for TAF and TFV were 0.39–0.46 hours and 37.79–39.61 h, respectively; these values were similar to those reported in previous studies.19,21 The t1/2 of TFV was approximately 100-fold longer than that of TAF. Owing to the short t1/2 of TAF, there is lower systemic exposure to TFV, and it causes fewer adverse reactions, such as nephrotoxicity and decreased bone density, with a smaller effective dose (25 mg), which is consistent with reported results.17–19
The intra-individual variation in Cmax of TAF for the test formulation was 42.32% for the fasting trial and 44.30% for the fed trial. In the study overall, the intra-individual variation in AUC of TAF was less than 30%. These parameters can provide a reference for the estimation of the sample size required for the analysis of TAF in Chinese populations in future clinical trials.
Bioequivalence Assessment
Cmax, AUC0-t, and AUC0-∞ were defined as the main parameters for TAF to be used in the assessment of bioequivalence between the test and reference formulations. The criteria for bioequivalence were that the 90% CIs of the test/reference geometric mean ratio were between 80.00% and 125.00%, inclusive, for Cmax, AUC0-t, and AUC0-∞.
The geometric mean ratios (90% CI) of Cmax, AUC0-t, and AUC0-∞ for TAF in the fasting trial were 97.52% (83.72%, 113.59%), 95.93% (89.10%, 103.30%), and 95.91% (89.09%, 103.24%), respectively. The geometric mean ratios (90% CI) of Cmax, AUC0-t, and AUC0-∞ for TAF in the fed trial were 100.62% (86.87%, 116.56%), 101.36% (95.65%, 107.41%), and 101.11% (95.39%, 107.19%), respectively. The geometric mean ratios (90% CI) of Cmax, AUC0-t, and AUC0-∞ of TFV in the fasting and fed trials were both in the range of 80.00–125.00%. It was concluded that the geometric mean ratios (90% CIs) of TAF and TFV after administration of 25 mg tenofovir alafenamide tablets were both within the range of 80.00–125.00%, which met the criteria for bioequivalence given by the National Medical Products Administration (NMPA).22
Compliance and Tolerability
Overall, 40 and 32 subjects completed the fasting and fed trials, respectively, and both formulations of 25 mg tenofovir alafenamide tablets were well tolerated. In this study, the TEAEs included nasopharyngitis, upper respiratory infection, drowsiness, nausea, and dizziness; all TEAEs were in accordance with the package insert for TAF or those reported previously.17–19 There was only one withdrawal: one subject withdrew from the fasting trial because of a TEAE that was judged not to be related to the study drug.
As this study lasted for a short time and included only healthy Chinese subjects, the results cannot predict the long-term effects in patients. Further research is needed to determine the long-term tolerability and safety data of the test formulation in other populations and to confirm if the test formulation is similar to the reference formulation.
Conclusion
This randomized, open-label, single-dose study has shown that the test formulation of 25 mg tenofovir alafenamide tablets produced by Jilin Sihuan Pharmaceutical Co. Ltd. was bioequivalent to the formulation marketed under the brand name VEMLIDY® in healthy Chinese male and female subjects under fasting and fed conditions.
Data Sharing Statement
The data that support the findings of this study are available from the corresponding author upon reasonable request.
Acknowledgment
We are grateful to the subjects that participated in the study and team members at the Phase I Clinical Trial Center in General Hospital of Northern Theater Command for their hard work.
Funding
This work was sponsored by Jilin Sihuan Pharmaceutical Co. Ltd.
Disclosure
The authors report that there are no conflicts of interest.
References
1. James SL, Abate D, Abate KH, et al. Global, regional, and national incidence, prevalence, and years lived with disability for 354 diseases and injuries for 195 countries and territories, 1990–2017: a systematic analysis for the Global Burden of Disease Study 2017. Lancet. 2018;392(10159):1789–1858.
2. GBD 2013 Mortality and Causes of Death Collaborators. Global, regional, and national age-sex specific all-cause and cause-specific mortality for 240 causes of death, 1990–2013: a systematic analysis for the Global Burden of Disease Study 2013. Lancet. 2015;385(9963):117–171. doi:10.1016/S0140-6736(14)61682-2
3. Ott JJ, Stevens GA, Groeger J, Wiersma ST. Global epidemiology of hepatitis B virus infection: new estimates of age-specific HBsAg seroprevalence and endemicity. Vaccine. 2012;30(12):2212–2219. doi:10.1016/j.vaccine.2011.12.116
4. Custer B, Sullivan SD, Hazlet TK, Iloeje U, Veenstra DL, Kowdley KV. Global epidemiology of hepatitis B virus. J Clin Gastroenterol. 2004;38(10 Suppl 3):S158–S168. doi:10.1097/00004836-200411003-00008
5. Smith S, Harmanci H, Hutin Y, et al. Global progress on the elimination of viral hepatitis as a major public health threat: an analysis of WHO member state responses 2017. JHEP Rep. 2019;1(2):81–89. doi:10.1016/j.jhepr.2019.04.002
6. Sarin SK, Kumar M, Lau GK, et al. Asian-Pacific clinical practice guidelines on the management of hepatitis B: a 2015 update. Hepatol Int. 2016;10(1):1–98.
7. Hall AM, Hendry BM, Nitsch D, Connolly JO. Tenofovir-associated kidney toxicity in HIV-infected patients: a review of the evidence. Am J Kidney Dis. 2011;57(5):773–780. doi:10.1053/j.ajkd.2011.01.022
8. Seto WK, Asahinas YM, Peng CY, Stancius C, Abdurakhmanov D, Flaherty JF. Reduced changes in bone mineral density in CHB patients receiving tenofovir alafenamide (TAF) compared with tenofovir disoproxil fumarate. Hepatology. 2016;64:35A.
9. Buti M, Riveiro-Barciela M, Esteban R. Tenofovir alafenamide fumarate: a new tenofovir prodrug for the treatment of chronic hepatitis B infection. J Infect Dis. 2017;216(Suppl suppl_8):S792–S796. doi:10.1093/infdis/jix135
10. Babusis D, Phan TK, Lee WA, Watkins WJ, Ray AS. Mechanism for effective lymphoid cell and tissue loading following oral administration of nucleotide prodrug GS-7340. Mol Pharm. 2013;10(2):459–466. doi:10.1021/mp3002045
11. Ogawa E, Furusyo N, Nguyen MH. Tenofovir alafenamide in the treatment of chronic hepatitis B: design, development, and place in therapy. Drug Des Dev Ther. 2017;11:3197–3204. doi:10.2147/DDDT.S126742
12. Parsons TL, Gwenden KN, Marzinke MA. Interspecies differences in tenofovir alafenamide fumarate stability in plasma. Antimicrob Agents Chemother. 2020;64(9):e00930–e00920. doi:10.1128/AAC.00930-20
13. Golla VM, Kurmi M, Shaik K, Singh S. Stability behaviour of antiretroviral drugs and their combinations. 4: characterization of degradation products of tenofovir alafenamide fumarate and comparison of its degradation and stability behaviour with tenofovir disoproxil fumarate. J Pharm Biomed Anal. 2016;131:146–155. doi:10.1016/j.jpba.2016.08.022
14. Murakami E, Wang T, Park Y, et al. Implications of efficient hepatic delivery by tenofovir alafenamide (GS-7340) for hepatitis B virus therapy. Antimicrob Agents Chemother. 2015;59(6):3563–3569. doi:10.1128/AAC.00128-15
15. Ruane PJ, DeJesus E, Berger D, et al. Antiviral activity, safety, and pharmacokinetics/pharmacodynamics of tenofovir alafenamide as 10-day monotherapy in HIV-1-positive adults. J Acquir Immune Defic Syndr. 2013;63(4):449–455. doi:10.1097/QAI.0b013e3182965d45
16. Liu Y, Miller MD, Kitrinos KM. Tenofovir alafenamide demonstrates broad cross-genotype activity against wild-type HBV clinical isolates and maintains susceptibility to drug-resistant HBV isolates in vitro. Antiviral Res. 2017;139:25–31. doi:10.1016/j.antiviral.2016.12.012
17. Agarwal K, Fung SK, Nguyen TT, et al. Twenty-eight day safety, antiviral activity, and pharmacokinetics of tenofovir alafenamide for treatment of chronic hepatitis B infection. J Hepatol. 2015;62(3):533–540. doi:10.1016/j.jhep.2014.10.035
18. Chan HL, Fung S, Seto WK, et al. Tenofovir alafenamide versus tenofovir disoproxil fumarate for the treatment of HBeAg-positive chronic hepatitis B virus infection: a randomised, double-blind, phase 3, non-inferiority trial [published correction appears in Lancet Gastroenterol Hepatol. 2016 Nov;1(3):e2]. Lancet Gastroenterol Hepatol. 2016;3:185–195. doi:10.1016/S2468-1253(16)30024-3
19. Buti M, Gane E, Seto WK, et al. Tenofovir alafenamide versus tenofovir disoproxil fumarate for the treatment of patients with HBeAg-negative chronic hepatitis B virus infection: a randomised, double-blind, phase 3, non-inferiority trial [published correction appears in Lancet Gastroenterol Hepatol. 2016 Nov;1(3):e2]. Lancet Gastroenterol Hepatol. 2016;3:196–206. doi:10.1016/S2468-1253(16)30107-8
20. Tothfalusi L, Endrenyi L. Sample sizes for designing bioequivalence studies for highly variable drugs. J Pharm Pharm Sci. 2012;15(1):73–84. doi:10.18433/j3z88f
21. Hsu YC, Wei MT, Nguyen MH. Tenofovir alafenamide as compared to tenofovir disoproxil fumarate in the management of chronic hepatitis B with recent trends in patient demographics. Expert Rev Gastroenterol Hepatol. 2017;11(11):999–1008. doi:10.1080/17474124.2017.1386554
22. National Medical Products Administration. Technical guidelines for bioequivalence study of chemical generic drugs which evaluated with pharmacokinetic parameters as the endpoint. 2018. Available from: http://www.cde.org.cn/zdyz.do?method=largePage&id=353342c97683d4fb.
 © 2021 The Author(s). This work is published and licensed by Dove Medical Press Limited. The full terms of this license are available at https://www.dovepress.com/terms.php and incorporate the Creative Commons Attribution - Non Commercial (unported, v3.0) License.
By accessing the work you hereby accept the Terms. Non-commercial uses of the work are permitted without any further permission from Dove Medical Press Limited, provided the work is properly attributed. For permission for commercial use of this work, please see paragraphs 4.2 and 5 of our Terms.
© 2021 The Author(s). This work is published and licensed by Dove Medical Press Limited. The full terms of this license are available at https://www.dovepress.com/terms.php and incorporate the Creative Commons Attribution - Non Commercial (unported, v3.0) License.
By accessing the work you hereby accept the Terms. Non-commercial uses of the work are permitted without any further permission from Dove Medical Press Limited, provided the work is properly attributed. For permission for commercial use of this work, please see paragraphs 4.2 and 5 of our Terms.