")
Back to Journals » International Journal of Nanomedicine » Volume 14
Biodistribution, Clearance And Morphological Alterations Of Intravenously Administered Iron Oxide Nanoparticles In Male Wistar Rats
Authors Gaharwar US , Meena R , Rajamani P
Received 14 July 2019
Accepted for publication 10 October 2019
Published 6 December 2019 Volume 2019:14 Pages 9677—9692
DOI https://doi.org/10.2147/IJN.S223142
Checked for plagiarism Yes
Review by Single anonymous peer review
Peer reviewer comments 2
Editor who approved publication: Dr Thomas Webster
Usha Singh Gaharwar, Ramovatar Meena, Paulraj Rajamani
School of Environmental Sciences, Jawaharlal Nehru University, New Delhi 110067, India
Correspondence: Paulraj Rajamani
School of Environmental Sciences, Jawaharlal Nehru University, New Delhi 110067, India
Tel +91 11 2670 4162
Email [email protected]
Introduction: Nanoparticles are used worldwide because of their unique properties, with large-scale application in various fields, such as medicine, cosmetics and industries. In view of their widespread use, the potential adverse effects of nanoparticles have become a significant cause for concern, in terms of not only human health and safety but also the environment. The present investigation focused on establishing the bioaccumulation patterns and ultrastructural changes induced by retained iron oxide nanoparticles (IONPs) in various target organs of rats.
Methods: Twenty-four male Wistar rats were randomly divided into four groups. Experimental animals were intravenously administered different doses of IONPs (7.5 mg/kg, 15 mg/kg and 30 mg/kg) once in a week for 4 weeks. Urine and feces samples were collected on a daily basis to assess nanoparticle clearance and analyzed via atomic absorption spectroscopy (AAS). At the end of the experiment, rats were euthanized and different organs, including spleen, liver, kidney, lung, heart, testis and brain, were dissected. Bioaccumulation of iron in organs and ultrastructural changes induced by IONPs were determined.
Results: The maximal concentration of iron was detected in spleen and minimal concentration in the brain. The level of iron accumulation in organs was as follows: spleen>blood>liver>kidney>lung>heart>testis>brain. The excretion profile in urine revealed maximum excretion on the day following administration that was maintained until day 28, whereas the iron content in feces remained high during the first three days after injection. A similar pattern was observed throughout the duration of the experiment. Ultrastructural alterations were detected in spleen, kidney, lung, heart, testis, brain and liver, indicative of cellular damage induced by accumulating nanoparticles in these organs.
Conclusion: Intravenous administration of IONPs results in ultrastructural changes and dose-dependent bioaccumulation in different organs of rats.
Keywords: metal oxide nanoparticles, bioaccumulation, ultrastructural changes, toxicity, metabolic cages
Introduction
Over the past few decades, metal oxide nanomaterials (NMs) have been used in sunscreens, cosmetics, paints, electrical appliances, textile and food products, along with medical fields, such as disease diagnosis, therapeutic agents, drug delivery systems and antimicrobial agents. Wider scope of application of NMs due to their extraordinary physiochemical characteristics has resulted in increased human exposure. These particles may be introduced daily in human life through diverse means, such as water, food, medicines and other commercial products.1 Nanoparticles (NPs) incorporated through different modes of administration enter the blood circulation and are distributed to various organs including the liver, spleen, kidney, testis, thymus, heart, lung and brain.2–5 The specific route of administration and NPs size govern biodistribution patterns. Following intravenous administration, NPs distribution to various systems (colon, lung, bone marrow, liver, spleen, and lymphatics) has been reported.6 Earlier, Hanini and co-workers7 showed that a single intravenous injection of γ-Fe2O3 NPs (0.8 mg/kg) exerts toxicity to the liver, kidney and lung in Wistar rats. Sub-chronic (28 days) oral toxicity of iron oxide NPs (56 nm) was subsequently confirmed in female Wistar rats.8 Several studies suggest that orally administered NPs reach the blood circulation and concentrate in various organs. For instance, iron oxide NPs taken up through inhalation effectively penetrate the blood–brain barrier and are deposited extensively in heart, liver, spleen, lung, kidney, brain, stomach, small intestine, and bone marrow, with the highest concentrations detected in liver and spleen.9–12 Recently, intramuscularly injected PEGlyted FeS2 NP deposits were observed in liver, lung, muscles and kidney of mouse post-injection and excreted from the body after 21 days.13
To evaluate the NPs concentration in target tissue or other sites, biodistribution studies are essential. In vivo imaging and histopathological techniques are commonly utilized to assess biological interactions, biodistribution patterns, and toxicities of different drug carriers or nano-devices. However, studies focusing on in vivo biodistribution in different organs and metabolic processing of iron oxide NMs within organisms are lacking.14 Emerging understanding of the potential in vitro and in vivo toxicity of iron oxide highlights the need to conduct wide-ranging research on accumulation and clearance of iron oxide nanoparticles (IONPs) using appropriate in vivo systems. The existing in vivo data on biodistribution and deposition patterns of IONPs administered to animals are limited and inconsistent. Prior to clinical application, the potential harmful effects of IONPs should, therefore, be established via preclinical analyses.
In the present study, biodistribution of IONPs in whole blood, liver, kidney, heart, brain, spleen, lung, and testis and clearance from urine and feces was investigated using a Wistar rat model.
Materials And Methods
Reagents
Iron oxide NPs (Fe2O3) were procured from Intelligent Materials Pvt. Ltd. (Wilmington DE, USA). All other chemicals used were of analytical grade and purchased from commercial companies.
IONP Characterization
Scanning electron microscopy (SEM) and transmission electron microscopy (TEM) were employed for measurement of size and morphology of iron oxide NPs. Briefly, aqueous suspensions of iron oxide NPs in phosphate buffer saline (PBS) (1.37 mM NaCl, 4.3 mM Na2HPO4, 2.7 mM KCl, 1.4 mM KH2PO4, pH 7.4) were ultrasonicated for 15 mins in a water bath. A drop of the homogenous suspension was placed on a copper grid and allowed to air dry at room temperature (RT, 25°C). The grid was placed on a sample holder for visualization under a transmission electron microscope (JEOL-JEM-2100F) operating at 200 kV. Field emission scanning electron microscopy (FE SEM) and scanning electron microscopy (SEM; ZEISS, GERMANY EV-40) were additionally used to analyze NP size and morphology at 15 kV. An energy-dispersive X-ray analyzer (EDX-200) coupled with SEM was applied to determine the elemental composition of nanomaterials (NMs). In brief, a drop of the NM suspension was placed on a mirror attached on a stub by a carbon tape. Next, NPs were coated with gold and visualized under a microscope. The stability and size changes of IONPs were measured using the dynamic light scattering (DLS) method (633 nm; Malvern Zetasizer; Nano, Malvern, UK) in PBS. Iron oxide NPs were prepared (0.1 mg IONPs/mL) and stored in PBS at 4°C for 1 week. NP suspensions were loaded onto a sample holder and dynamic light scattering (DLS) data were acquired.
Cell Cytotoxicity
Cytotoxicity was evaluated via the 3-(4,5-dimethylthiazol-2-yl) diphenyltetrazolium bromide (MTT) assay. HeLa cells selected for assay were grown in 96-well plates in Dulbecco’s modified Eagle medium (DMEM; Gibco, USA) containing 10% fetal bovine serum and 1% penicillin and streptomycin in a 5% CO2 incubator at 37°C until subconfluence. Different concentrations of iron oxide NPs were added to cultures (10, 20, 40, 80 and 100 μg/mL). After 24 hrs, the medium was discarded and cells washed with PBS (pH 7.4), followed by incubation with 90 µl fresh medium and 10 µl MTT (5 mg/mL) per well for 4 hrs. Subsequently, the medium was discarded and cells were incubated with 200 µl dimethyl sulfoxide (Sigma) to dissolve formazan crystals. Absorbance was measured at 570 nm on a microtiter well plate with an ELISA plate reader (Bio-Rad 840). All experiments were performed in triplicate. Percentage viability was determined based on the ratio of mean absorbance of treated samples to that of control cells:

Experimental Animals
In the present study, adult Wistar rats (6–8 weeks old) were obtained from the Central Laboratory for Animal Resources (CLAR), Jawaharlal Nehru University, New Delhi, India. All animals were kept in stress-free, hygienic and animal-friendly conditions. Stainless steel metabolic cages were used to house animals for 28 days under standard temperature (21±3°C) and humidity (50 ±10) conditions and a 12-hr light/dark cycle. Rats were provided food pellets and water ad libitum. After acclimatization, rats were randomly assigned to four groups (each consisting of six rats). All experiments were approved and recommended by the Institutional Animal Ethics Committee (IAEC), Jawaharlal Nehru University, New Delhi, India.
Iron Oxide NP Administration
Twenty-four rats were randomly distributed into four different groups. Before the commencement of treatment, freshly prepared NP suspensions were sonicated in saline for experimental use. All animals were anesthetized with sodium thiopentone. Initially, two rats were treated with 1 mg/kg NPs through intravenous injection in the caudal vein and monitored for 24 hrs. We observed no mortality or adverse symptoms. A preliminary study was performed to evaluate approximate lethal dose 50 (LD50), which was calculated via the “staircase method” using fewer animals for each dose (only two) and an increasing number of NP doses. To determine LD50, 5 different doses (25, 50, 75, 100, 125 mg/kg) were selected for intravenous injection through the caudal vein and toxicity symptoms/reactions were examined over a range of time intervals (1, 2, 6 and 24 hrs).15 After 24 hrs, no clinical signs of toxicity and death were observed. Accordingly, three doses (7.5, 15 and 30 mg/kg) were selected for subsequent experiments. To this end, rats were randomly divided into four groups of six animals each. The first group injected with sterile saline solution was considered the control. The remaining three groups were injected with 7.5, 15 and 30 mg/kg NPs on days 1, 8, 15 and 22.
Determination Of Body Weights And Organ Coefficients
Body weights were recorded on a daily basis for the entire study period and average body weight was calculated for all animals. After 28 days, animals from all groups were sacrificed, followed by immediate dissection and weighing of various organs (liver, kidney, spleen, heart, lungs, testis and brain). Coefficients of organs (liver, kidney, spleen, heart, lungs, testis and brain) were determined by dividing tissue weight (g) by body weight (g).
Food And Water Consumption
Food and water consumption were calculated on a daily basis. Animal feed was weighed before distribution into each cage. The amount of feed left over on the subsequent day was subtracted from the initial amount and the difference taken as daily feed intake. Similarly, for water intake, a known volume of water was supplied to each cage. The remaining water content in each bottle was measured the following day and subtracted from the initial volume. The average of 2 days of feed and water intake was calculated and plotted for experimental analysis.
Iron Content Analysis In Urine And Feces
Iron concentrations in respective tissues were quantified via atomic absorption spectroscopy (AAS; Thermo-Scientific). All animals were kept in metabolic cages and urine and fecal samples were collected daily for the duration of the study. Metabolic cages were designed to contain two inlets (one for water and the other for food) and two outlets (one for urine and one for feces samples), with one animal per cage. Urine and feces samples were collected daily for 16 days, followed by days 22, 23 and 28. Approximately 0.5 mL urine and 0.5 g feces samples were pre-digested in nitric acid overnight, followed by digestion at 80°C for 12 hrs and further at 130–150°C for 30 mins. Finally, 70% perchloric acid was added for 6 hrs and samples were heated to dryness. Samples were diluted in Milli Q water from Millipore System and metal contents were analyzed using AAS.
Iron Content In Tissues
At the end of the experimental period, the biodistribution patterns of NPs in different organs were determined. To fulfill this objective, animals of all four groups were housed in special stainless steel “metabolic” cages for 28 days. Following sacrifice, organs including liver, kidney, heart, brain, spleen, testis, lung were dissected and whole blood samples were collected. The same procedure was applied for iron content analysis as that for urine and fecal samples, and 25 mL milli Q was used for sample preparation followed by AAS analysis.
Transmission Electron Microscopy
For ultrastructural analysis, TEM was performed. Liver, testis, spleen, brain, kidney, lung and heart tissues were cut into small sections (~ 1 to 1.5 mm), immediately fixed in Karnovsky’s fixative (2.5% glutaraldehyde +4% paraformaldehyde +0.1 M phosphate buffer) for 4 hrs at room temperature (RT), incubated at 4°C overnight and washed with phosphate buffer saline. Tissues were maintained in 1% osmium tetra-oxide for 1 hr post-fixation. After washing in PBS, tissues were sequentially dehydrated in graded alcohol solutions (50%, 70%, 80%, 95%, and 100%). Further treatment of tissue with propylene oxide (30 min), propylene oxide resin (overnight), and pure resin was conducted for 48 hrs. Thereafter, tissues were embedded in Better Equipment for Electron Microscopy (BEEM) capsules. Ultrathin sections (70 nm) were generated, stained with 1% lead acetate and visualized under a JEOL-JEM-2100F transmission electron microscope (TEM) at 120 kV.16
Statistical Analysis
Statistical analyses were conducted using Graph Pad Prism 5, and results were expressed as means±SD (n=6). One-way analysis of variance (ANOVA) was used to determine statistical significance and multiple comparisons were performed using Tukey’s test. Significance was set at p<0.05.
Results
Characterization Of IONPs
Shape, size and uniformity of NPs were determined via TEM (Figure 1A). The lattice fringe of IONPs is presented in Figure 1B. The average size of NPs determined was ~30–35 nm. Spherical morphology was confirmed through TEM, SEM and FE SEM analyses of IONPs (Figures 1A and 2A and B), whereas EDX spectral observation of particle surface and chemical composition revealed 47.12% iron (Fe) and 49.70% oxygen (O) content (Figure 2C), confirming that the IONP sample was devoid of impurities. The hydrodynamic size changes of iron oxide in PBS were examined at pH 7.4 for 1 week (Figure 3) to estimate stability. Iron oxide particles were in the nanorange and remained stable over 7 days (Figure 3).
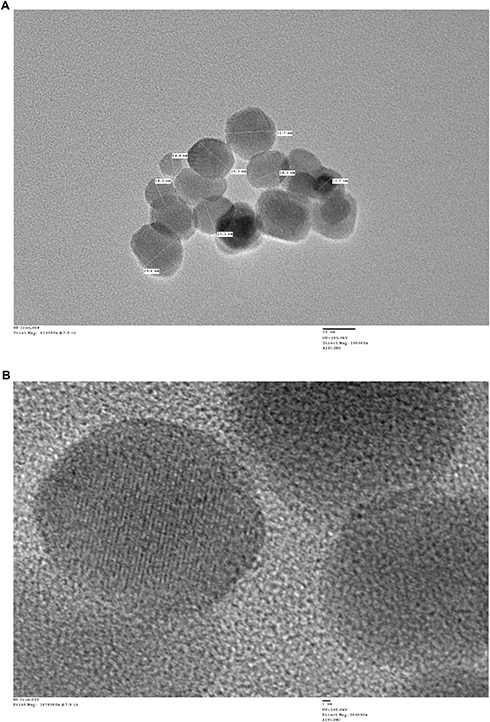 |
Figure 1 Characterization of iron oxide nanoparticles. (A) Transmission electron microscope (TEM) images of IONPs depicting the shape and size of nanoparticles. Scale bar size, 20 nm. (B) Crystal lattice image of IONPs; bar size of 1 nm. Analysis was performed at 200 kV. |
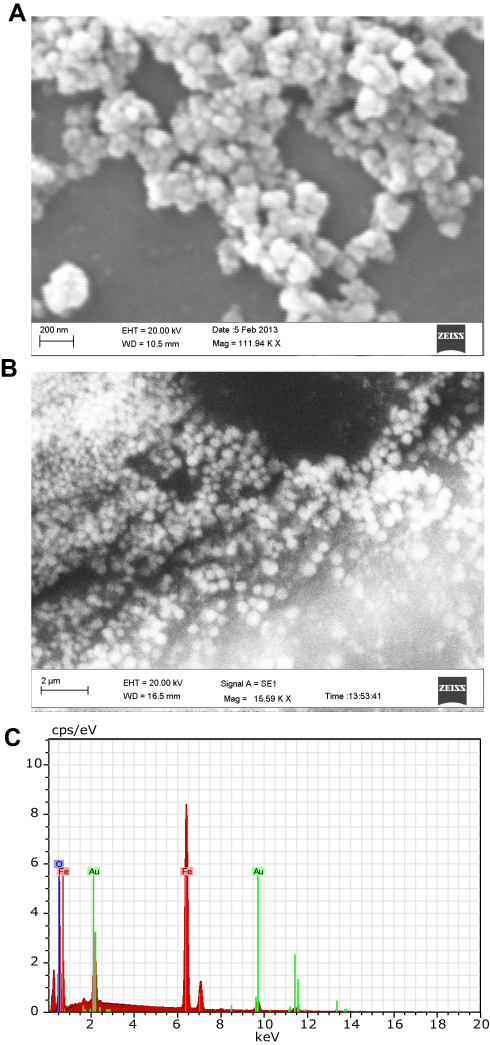 |
Figure 2 (A) Scanning electron microscopy (SEM) image of iron oxide nanoparticles. (B) Field emission scanning electron microscopy (FE SEM) image of IONPs confirming a spherical shape. (C) Energy-dispersive X-ray profile confirming the elemental composition of IONPs, depicting peaks of iron and oxygen (IONPs in a gold grid). Analysis was conducted at 15 kV. |
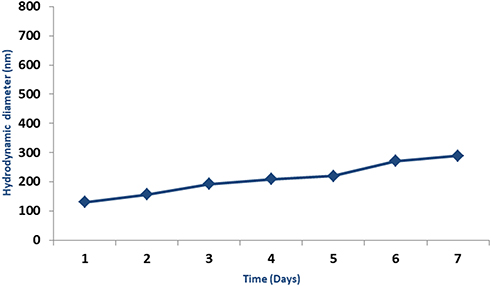 |
Figure 3 Hydrodynamic diameters measured via dynamic light scattering (DLS) of iron oxide nanoparticles in PBS recorded daily for 7 days. Data in graphs are presented as mean ± standard deviation for nanoparticle samples (n=3). Error bars represent standard deviation. |
Biocompatibility Of IONPs
The MTT assay was employed to evaluate the biocompatibility of iron oxide NPs. The HeLa cell line was selected for the assessment of in vitro cytotoxicity. While no significant toxicity was observed at lower doses of treatment (10 µg/mL), higher doses (20, 40, 80 and 100 µg/mL) led to marked changes and reduced viability, compared to the control group (Figure 4). Based on the results, we suggest that iron oxide NPs induce mild cytotoxicity in cancer cells.
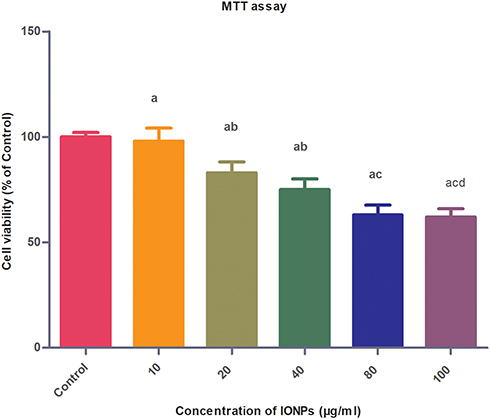 |
Figure 4 Biocompatibility assessment of IONPs in HeLa cells via MTT assay. Cells were treated with 10, 20, 40, 80 and 100 µg/mL IONPs for 24 hrs. Data in graphs are presented as mean ± standard deviation (n=3). Error bars represent standard deviation. Statistical significance was determined using one-way analysis of variance (ANOVA) and multiple comparisons conducted using Tukey’s test. Inter-group significant differences (p<0.05) are marked by letters: a (vs control), b (vs 10 µg/mL IONPs), c (vs 20 µg/mL IONPs), d (vs 40 µg/mL IONPs), and e (vs 80 µg/mL IONPs). |
Morphological Findings, Body Weight Coefficient And Organ Coefficient
We observed no mortality or adverse symptoms in any groups/individual animals treated with different doses of NPs, other than irritation and dullness. No unusual behavior or abnormalities were evident, such as difficulties with breathing or movement. Overall, no apparent toxicity was observed in IONPs-treated animals. The effects of NPs on body weight are shown in Figure 5. Similar trends were observed for all animals in each group. Body weight increased normally in all groups, with no evidence of weight loss. Organ coefficients for liver, kidney, spleen, testis, brain, heart and lungs were not significant in all experimental groups (Figure 6). These results clearly illustrate that the NPs do not interfere with rat growth.
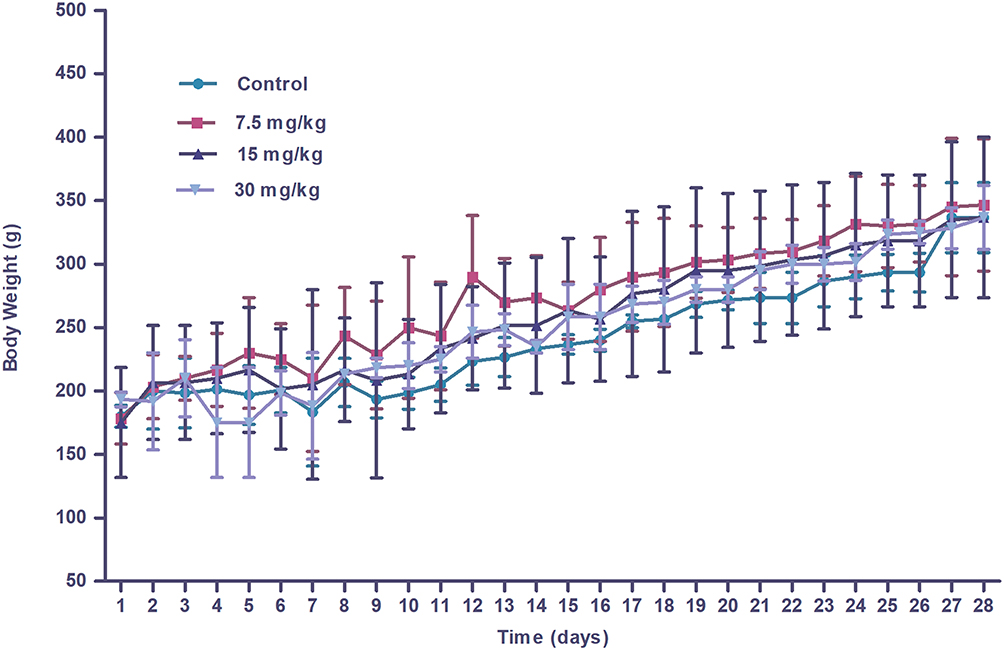 |
Figure 5 Body weights of Wistar rats following injection of different doses of IONPs or control recorded daily for 28 days. Results are expressed as mean ± SD (n=3). No significant differences were observed among the control and treated groups over the 28-day period. |
 |
Figure 6 Coefficient of organs (liver, kidney, spleen, heart, lung, testis and brain) of Wistar rats injected with different doses of IONPs relative to control. Coefficient of organs represents the ratio of organ weight (g) to animal body weight (g). Differences between nanoparticle-injected and control groups were not significant. |
Food And Water Intake
Food and water intake patterns are shown in Figures 7 and 8, respectively. Decreased water intake was observed in animals that were administered higher doses of NPs (30 mg/kg) during earlier time points while changes in intake were not significant during the rest of the study period. Similarly, food intake was decreased in the high-dose groups during the initial days following treatment, with no significant changes at later stages.
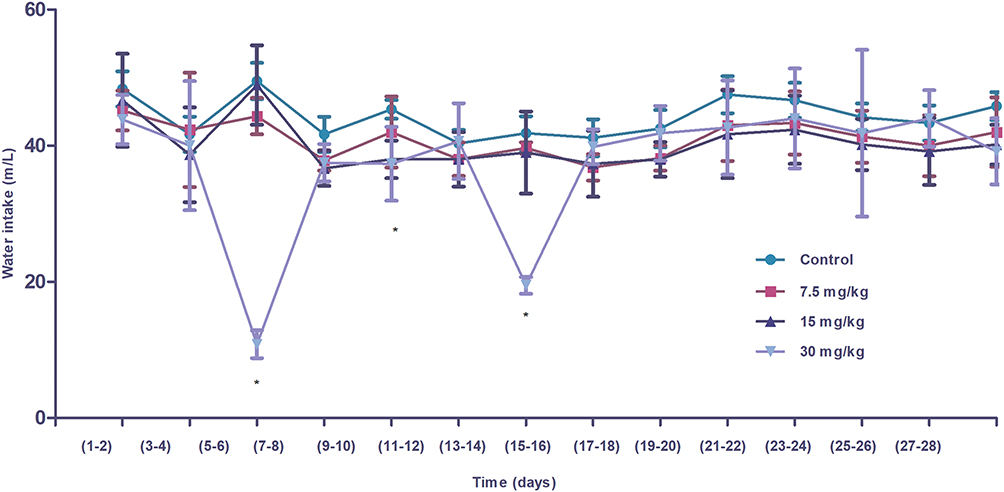 |
Figure 7 Water intake (mL) of control and experimental Wistar rats administered different doses of IONPs. Differences in intake were significant in the 30 mg/kg nanoparticle-administered group, compared to control, during the initial period after treatment but not in the later stages. Statistical significance was determined using one-way analysis of variance (ANOVA) and multiple comparisons conducted using Tukey’s test. * Statistically significant (p<0.05). |
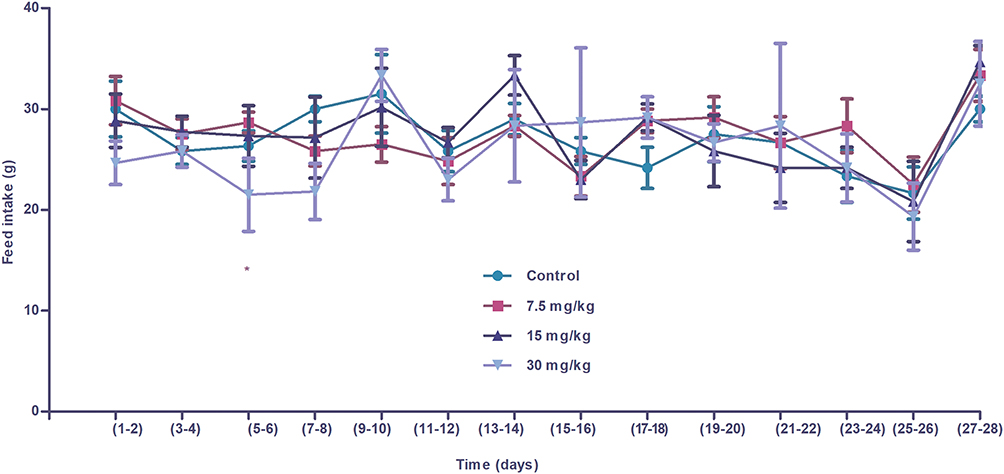 |
Figure 8 Feed intake (g) of control and experimental Wistar rats administered iron oxide nanoparticles. Significant differences in feed intake were observed only at high doses of nanoparticles (30 mg/kg), compared to the control group. Differences in feed intake in the remaining groups treated with lower doses of IONPs were not statistically significant. Statistical significance was determined using one-way analysis of variance (ANOVA) and multiple comparisons conducted using Tukey’s test. * Statistically significant (p<0.05). |
Elimination Of NPs Through Urine And Feces
IONPs clearance through urine and feces was quantified by determining the iron content in samples collected from the experimental groups on a daily basis from days 2 to 16, 22, 23, and 28 of the experiment. The maximum NPs content were measured in urine samples after the first treatment, which was maintained until day 28 in each treatment group. A dose-dependent excretion pattern was observed in urine samples (Figure 9A and B). The clearance rate of NPs decreased gradually after each injection and reached minimal values at the end of the week. Iron content in feces peaked in the first three days after treatment and remained constant over the remaining period (Figure 10A and B). Furthermore, dose-dependent excretion in feces was observed in rats. However, minimum excretion of NPs in feces was observed after every 7th day post-injection and highest excretion on days 2, 9, 16 and 23 of the experiment. The time and dose-dependent excretions observed in both urine and feces were clearly indicative of the redistribution of NPs.
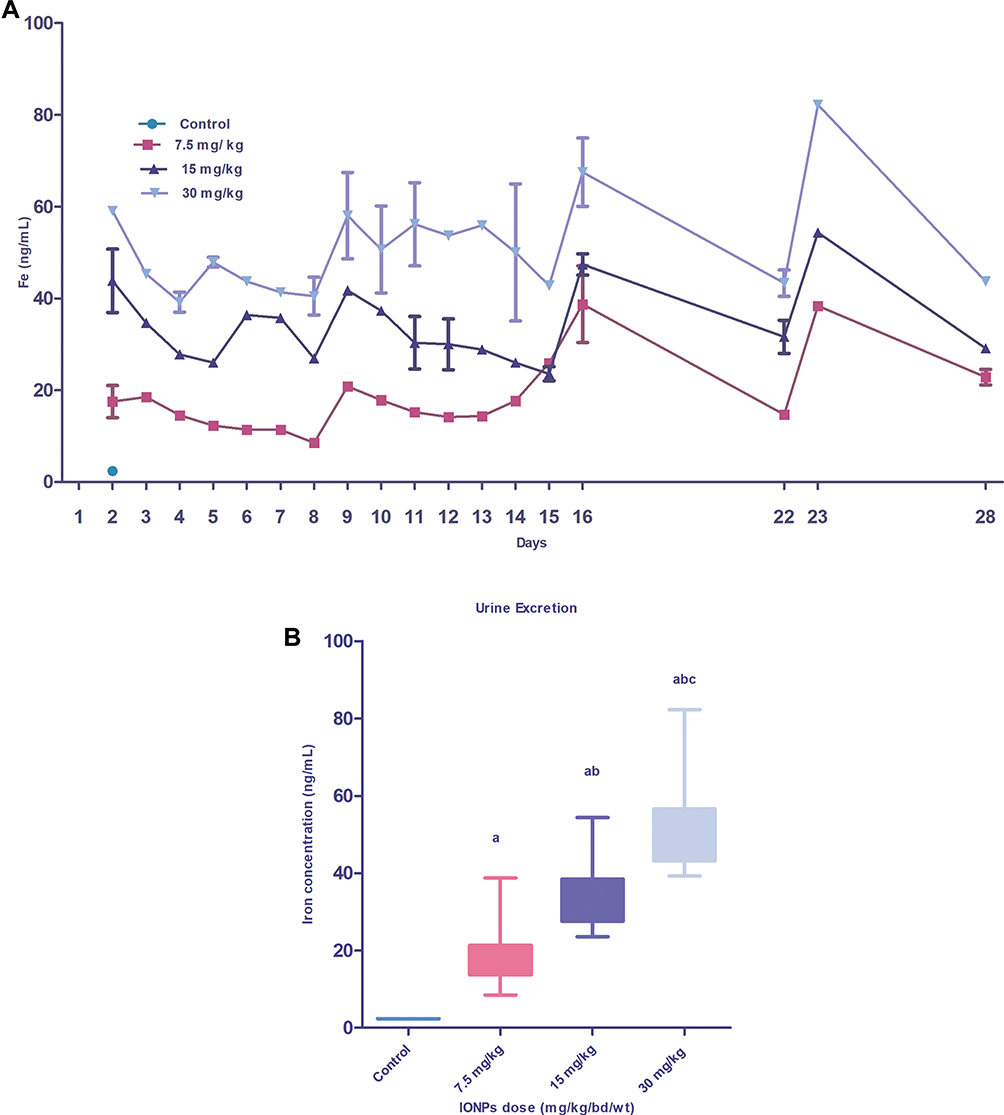 |
Figure 9 Graph showing iron content excreted through urine of animals injected with different IONPs doses. Daily iron concentration excreted in urine (ng/mL) during the study period (28 days) (A). Box plot depicts the mean iron concentration excreted through urine over 28 days (B). Data are presented as mean ± standard deviation (n=3). Error bars represent standard deviation. Statistical significance was determined using one-way analysis of variance (ANOVA) and multiple comparisons conducted using Tukey’s test. Significant inter-group differences (p<0.05) are marked by letters: a (vs control), b (vs 7.5 mg/kg IONPs), and c (vs 15 mg/kg IONPs). |
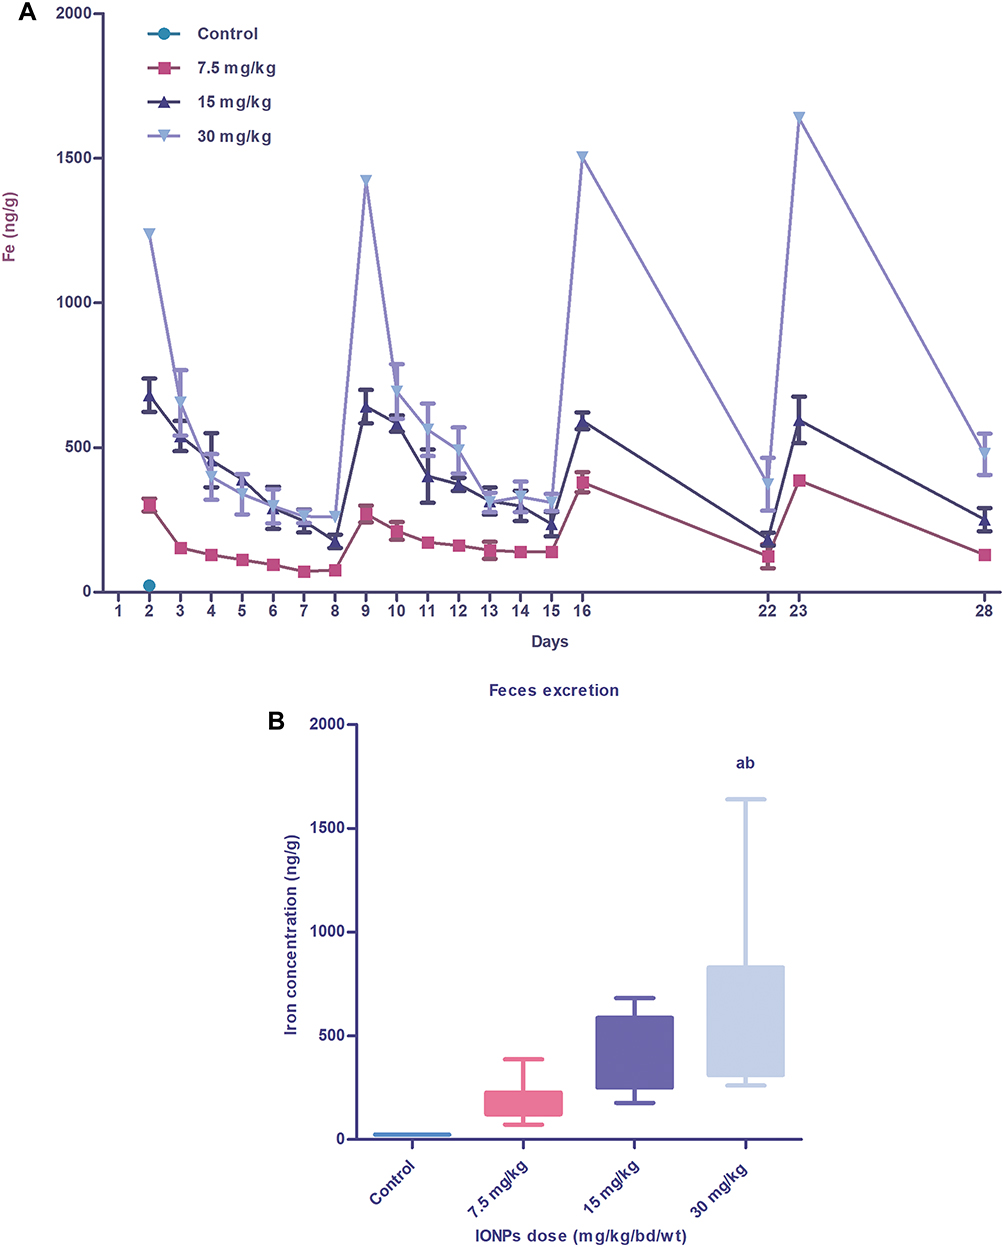 |
Figure 10 Iron content excreted through feces of animals injected with different doses of IONPs. Iron concentrations in feces (ng/g dry weight) excreted daily during the exposure period (28 days) (A). Box plot depicts mean iron concentrations excreted through feces over 28 days (B). Data represent mean ± standard deviation of nanoparticle concentrations in feces (n=3). Error bars denote standard deviation. Statistical significance was determined using one-way analysis of variance (ANOVA) and multiple comparisons conducted using Tukey’s test. Significant inter-group differences (p<0.05) are marked by letters: a (vs control), b (vs 7.5 mg/kg IONPs), and c (vs 15 mg/kg IONPs). |
Biodistribution Of Iron Oxide NPs In Different Tissues/Organs Of Rat
Our results indicate that the iron translocates into different tissues, i.e., liver, lungs, kidney, spleen, heart, brain and testis through blood. A dose-dependent increase in iron levels was observed in liver, whole blood, heart, testis, spleen, kidneys, lungs and brain of rats that were administered IONPs. Significant concentrations (p<0.05) of iron were detected in organs that were administered 30 mg/kg IONPs. The accumulation pattern in organs was as follows: spleen>blood>liver>kidney>lungs>heart>testis>brain (Figure 11). A significant dose-dependent deposition was detected in spleen, blood, liver, heart and lung, compared to the control group (p<0.05). However, significant distribution of iron oxide NPs in kidney was evident only in groups treated with higher doses (15 and 30 mg/kg) (p<0.05) whereas low-dose (7.5 mg/kg) treatment did not induce major changes relative to control. The lowest concentrations of iron were determined in brain and testis. However, only the highest treatment dose led to significant accumulation of IONPs in brain and testis.
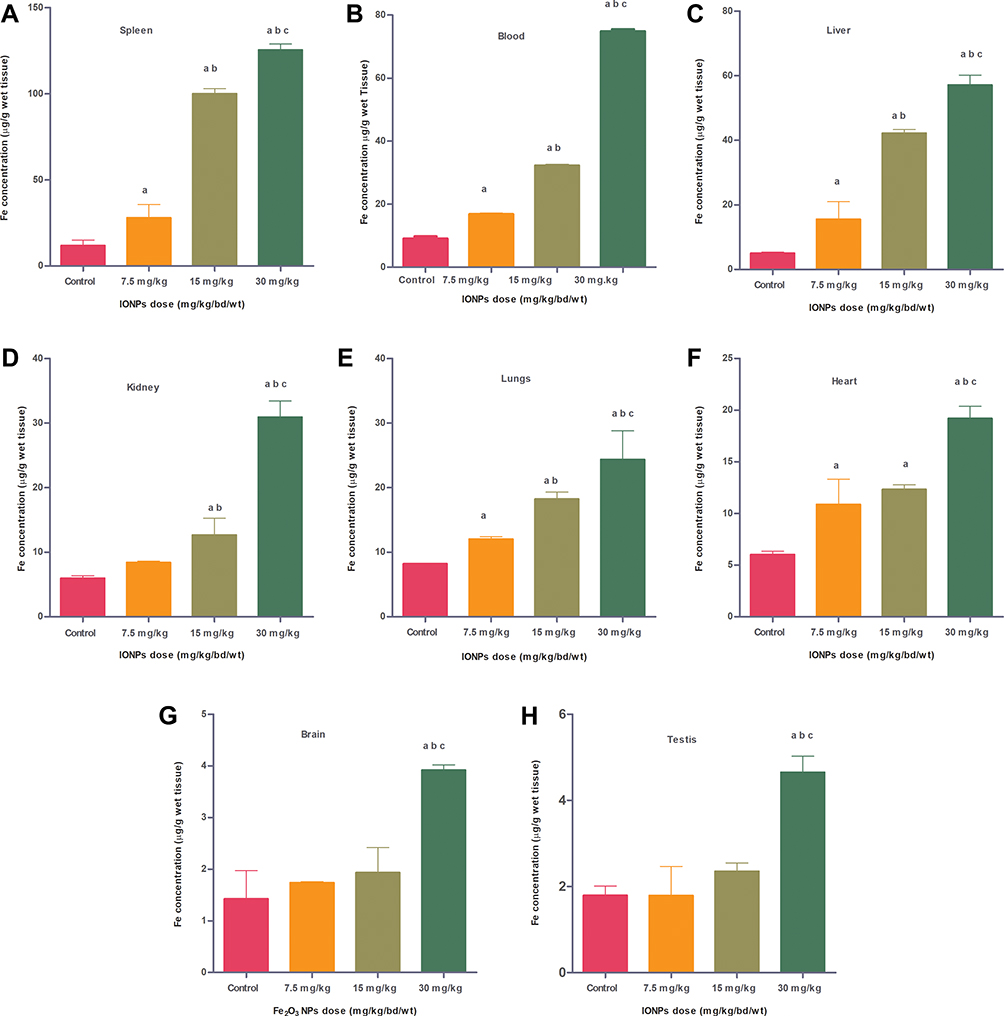 |
Figure 11 Bioaccumulation patterns of IONPs in different organs of Wistar rat, specifically, spleen (A), blood (B), liver (C), kidney (D), lungs (E), heart (F) brain (G) and testis (H) treated with varying doses of IONPs. Statistically significant (p<0.05) accumulation of IONPs was observed in a dose-dependent manner in the organs examined, except testis and brain, where significant distribution was evident only in the high-dose (30 mg/kg) group. Results are presented as mean ± standard deviation (n=6). Error bars represent standard deviation. Statistical significance was determined using one-way analysis of variance (ANOVA) and multiple comparisons conducted using Tukey’s test. Significant inter-group differences (p<0.05) are marked by letters: a (vs control), b (vs 7.5 mg/kg IONPs), and c (vs 15 mg/kg IONPs). |
Ultrastructural Changes Induced By Iron Oxide NPs
After intravenous administration, IONPs circulate in the blood and reach different organs including kidney, spleen, liver, lung, heart, testis and brain. TEM findings confirmed alterations within the tissue ultrastructure in association with NPs accumulation. Ultrastructural examination through an electron microscope showed the presence of NPs that could underlie the pathological changes in the spleen (Figure 13). As shown in Figure 12, ultrathin sections of control liver tissue displayed hepatocytes with normal nuclei and a distinct nuclear envelope. Other cytoplasmic organelles, including mitochondria and flattened rough endoplasmic reticulum, were intact and well-developed and a significant number of glycogen granules were observed. Animals treated with 30 mg/kg NPs showed cytoplasmic changes in liver tissues, such as mild vacuolization and intra-cytoplasmic swollen fat globules of various sizes, in addition to fragmented rough endoplasmic reticulum. Similarly, kidney ultrastructure in rats treated with the highest NPs dose (30 mg/kg) displayed irregular mitochondrial shapes, vacuoles in the cytoplasm and lysosomal structures (Figure 12). Morphological alterations were detected in testicular cells of treated animals, specifically, degenerative changes and vacuolization of cytoplasm, compared to the control group (Figure 13). Moreover, NPs deposition was apparent in lung and heart tissues of treated groups. Vacuolated mitochondria and damage were clearly observed in heart and lung tissue, in contrast to intact nuclear membrane and other organelles in control tissue (Figure 14). The ultrastructural images of brain depicted in Figure 15 clearly demonstrate the effects of NPs.
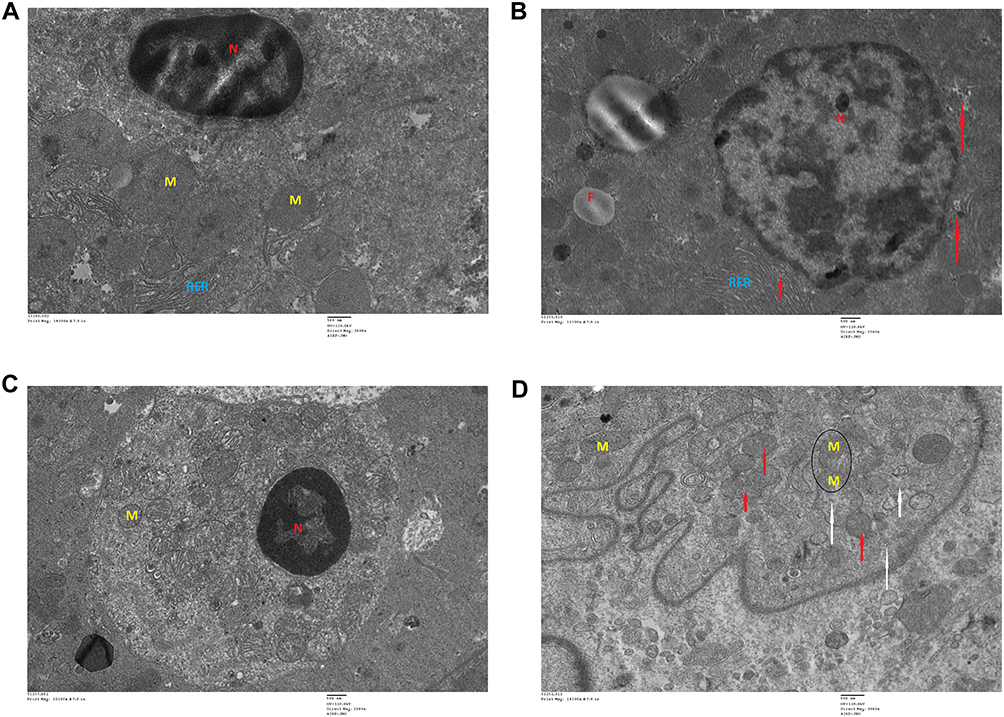 |
Figure 12 Transmission electron microscopy (TEM) images of different organs (A and B of liver, C and D of Kidney) of Wistar rats injected with different doses of IONPs and control. Liver ultrastructure shows nanoparticles (red arrows), fat globules (F), nucleus (N), mitochondria (M), rough endoplasmic reticulum (RER), glycogen granules (G), vesicles (V). (A) Control and (B) 30 mg/kg-treated group's liver image. (C) Control and (D) 30 mg/kg-treated group's kidney, vacuolization in cytoplasm (white arrows), damaged mitochondria (black circle), lysosomes (red arrows), mitochondria (M), and nucleus (N). |
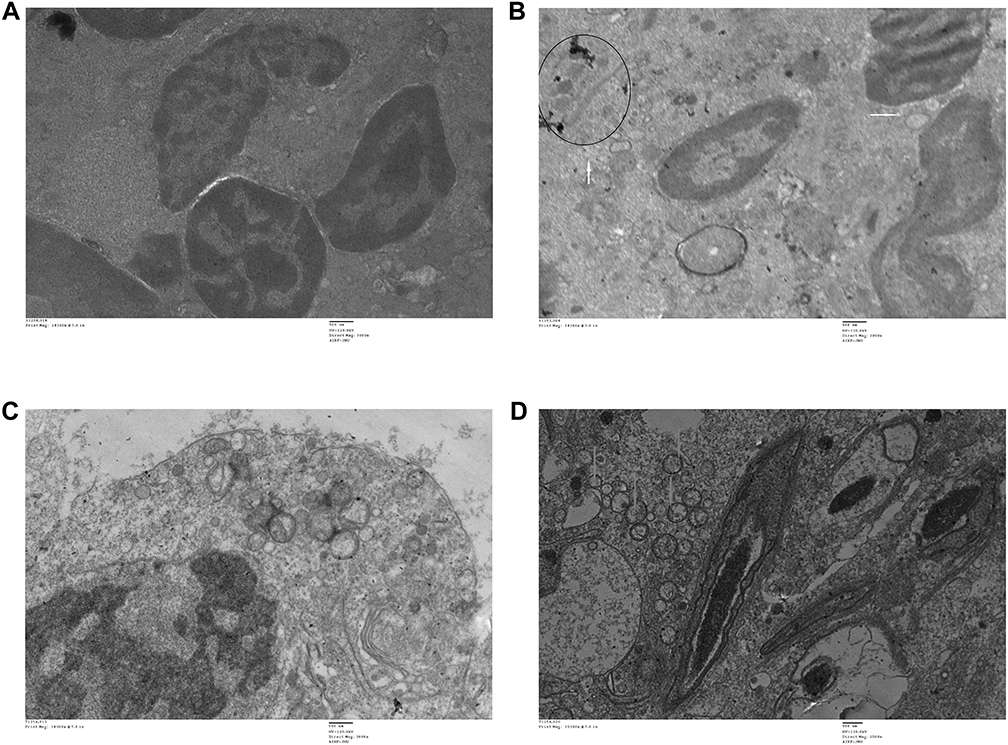 |
Figure 13 Transmission electron microscopy (TEM) images of different organs (E and F of spleen, and C and D of testis) of Wistar rats treated with IONPs and control. (A) Control and (B) 30 mg/kg-treated group's Spleen ultrastructure shows, vacuolization in cytoplasm (white arrows), nanoparticles (black circles). (C) Control and (D) 30 mg/kg-treated group's ultrastructure of testis-treated group shows degenerated and highly vacuolated cytoplasm (red arrows). |
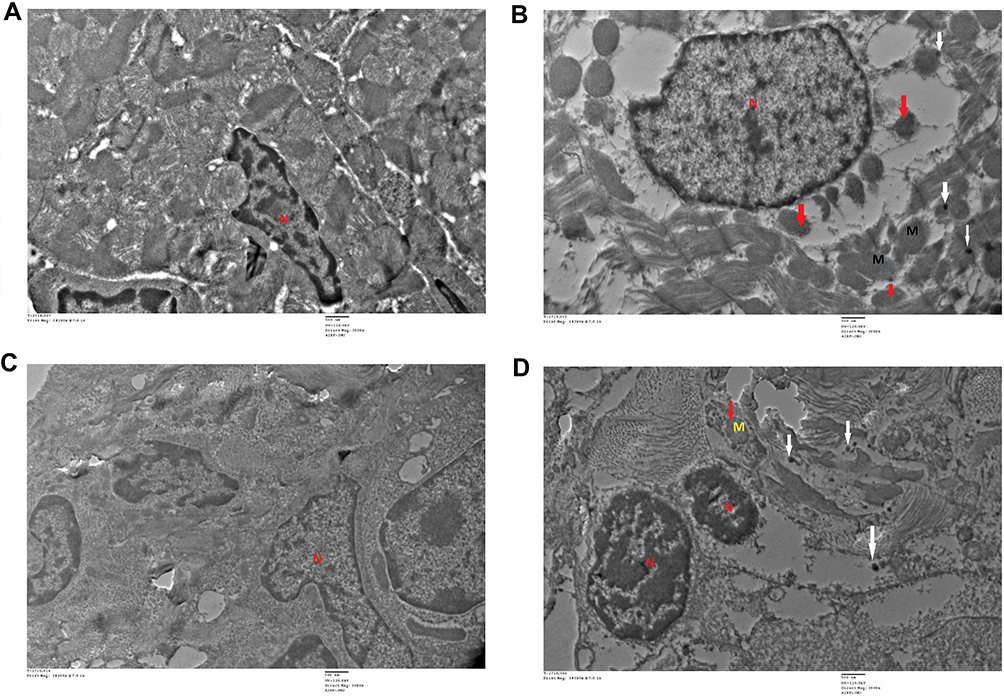 |
Figure 14 Transmission electron microscopy (TEM) images of different organs (A and B of Heart and C and D of lung) of Wistar rats treated with IONPs and control. (A) Control and (B) 30 mg/kg-treated group's ultrastructure of heart nucleus (N), mitochondria (M), nanoparticle deposition (white arrow), mitochondrial Cristae vacuolization (red arrow). (C) Control and (D) 30 mg/kg-treated group's ultrastructure of lung nucleus (N), mitochondria (M), nanoparticle deposition (white arrows), mitochondrial Cristae vacuolization (red arrows). |
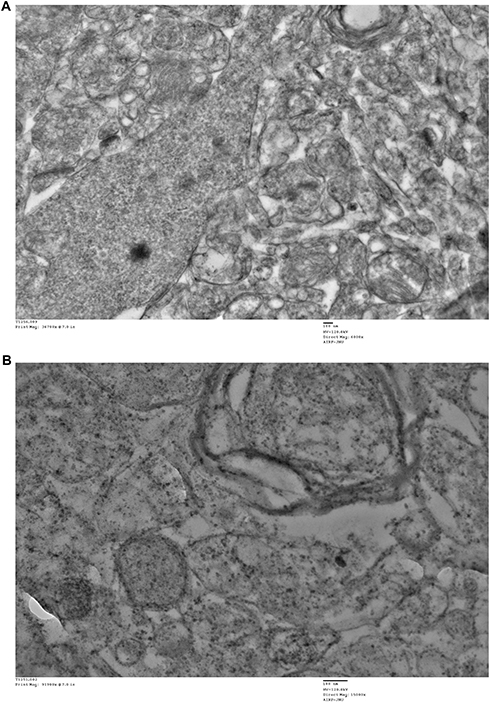 |
Figure 15 Transmission electron microscopy (TEM) images of brain tissue of Wistar rats injected with a high dose of IONPs (30 mg/kg) and control. Control group shows intact cellular organelles (A), 30 mg/kg treated group’s image showing disintegrated cellular organelles (B). |
Discussion
Research on NMs has become progressively more dynamic owing to their widespread use in therapeutic and commercial applications.17,18 While various nanocarriers have been developed for biomedical applications, iron oxide NPs are the only clinically accepted magnetic nanoparticles (MNPs). Recently, concerns have been raised regarding the potential adverse effects of NPs on humans and the environment. In the current study, we have addressed the effects and clearance of IONPs from the body along with NPs deposition in different organs using a male Wistar rat model.
Our results are in accordance with previous reports showing that NPs do not interfere with growth processes of exposed animals. NMs did not induce significant alterations in the body weights of rats, compared to their control counterparts.7,19,20 On the other hand, Kim et al21 showed a significant dose-dependent decrease in body weight in male rats treated with 500 mg/kg silver NPs (56 nm) at 4, 5 and 7 weeks (p<0.05), with non-significant changes at 13 weeks (90 days). Any factor that influences water intake will also affect feed intake. As expected, similar patterns of food and water intake were observed in this study. Intake of both food and water was decreased in high-dose (30 mg/kg)-exposed animals, indicative of suppressed appetite and effects on routine performance.
Although inter-individual variations have been observed in different animals treated with NPs, the overall results indicate that IONPs are successfully excreted through urine and feces. Moreover, high concentration detected in feces may be due to the excretion of NPs from the liver into the intestine via the hepatobiliary process.22 Based on these results, we suggest that the elimination procedure through urine and feces is linked with the distribution capacity of systemic circulation in different organs of animals. Excretion data revealed that higher amounts of NPs are excreted through feces than urine. Our results are in accordance with previous studies demonstrating the presence of higher concentrations of IONPs in kidney,10 suggestive of limited excretion of NPs through urinary pathways.
After entering the systemic circulation, NMs are delivered to different organ systems, such as testis, thymus, heart, lung, blood cells, liver, spleen, kidney, and brain.2–5 Transport of NPs from the walls of blood vessels to organs occurs predominantly through transcytosis. The blood circulation ensures the delivery of NPs administered through different routes to the same organs.23 Translocation of NPs additionally depends on size, charge, chemical composition and site of administration. Larger NPs are eliminated more rapidly from blood than their smaller counterparts.24 Spleen, the most vascular organ in the body, is a key part of the immune system and also recycles red blood cells. NPs can reach the spleen through two potential pathways, specifically, either internalization in Red blood cells (RBCs) or transport via macrophages. In the present study, increased concentrations of IONPs were observed in spleen, suggesting transport through macrophages. AAS results indicate that degradation of IONPs leads to significant deposition in spleen. Thus, iron deposition may be mainly attributable to ferritin-containing macrophages, IONPs, and old red blood cells. The immune system is also potentially responsible for the delivery of NPs to spleen. Earlier studies have disclosed accumulation of silver NPs (20 nm) in the cytoplasm of spleen cells in both the white and red pulp zones.25
In the present study, high concentrations of iron were detected in liver of rats after 28 days, suggesting that the liver acts as a primary line of defense against NPs. Liver is an additional vascular and main defensive organ that functions in detoxification. Moreover, the liver contains a large number of resident macrophages (Kupffer cells), which could facilitate NPs deposition in this organ. Increased iron content in liver is attributed to active participation of the reticuloendothelial system (RES) in NPs sequestration.26–29 Another possible mechanism underlying the deposition of IONPs in liver is the activation of metalloproteins involved in the detoxification of heavy metals.30 Route of administration is an important contributory factor for the presence of NPs in liver. Data from the present study confirmed the highest NPs deposition in spleen and liver tissue of rats treated with IONPs. Our findings are consistent with previous reports of higher uptake of iron oxide NPs in liver and spleen upon intravenous injection in male Sprague–Dawley rats.9,31 Moreover, Li and Huang32 suggested that NMs size accounts for the extent of deposition. According to their report, larger NPs may be taken up by spleen and smaller particles (~100 nm) preferentially deposited in liver. Circulating blood passes through the liver and spleen, and these two organs also contain a high number of macrophages actively involved in the uptake of particles from blood, which could further facilitate IONPs uptake.33 Iron concentration is significantly increased in blood, potentially due to release from organs (liver and spleen) after breakdown into other monatomic iron forms and degradation of iron oxide NPs into iron-associated proteins in blood.9 Xenobiotic compounds or NPs can be eliminated through kidney from the systemic circulation.34,35 Our results disclosed higher concentrations of IONPs in kidneys of animals from NPs-exposed groups, compared to control, suggesting that IONPs entering through the blood circulation remain within the kidney or are finally excreted with urine. Renal glomerular filtration and tubular excretion in kidney are responsible for the excretion of NPs with urine. NPs deposition in kidney is reported to result in several adverse effects leading to organ injury, including morphological changes, histopathological damage and biochemical alterations.36–38 Moreover, earlier studies have shown deposition of polyacrylic acid (PAA)–coated Fe2O3 NPs in the liver (Kupffer cells and reticuloendothelial system) and kidney (mesangial cells, podocytes and proximal tubular cells).39 Accumulation of different NPs in kidney regions, such as cortical glomeruli, basal membrane and renal tubules,21,26,40,41 in addition to silver NPs uptake by kidney cortex and medulla have been reported.42 Earlier studies indicate that intraperitoneal administration of silver NPs induces cytoplasmic changes in liver and kidney tissues43 while intravenously administered silver NPs accumulate in different organs, including liver, kidney, spleen, brain and lungs.25 Another recent investigation demonstrated that magnetic hollow porous carbon NPs (MHPCNs) are primarily deposited in spleen, lung and liver.44
In the present study, iron oxide NPs deposits were detected in lungs and heart and induced ultrastructural changes resulting in organ damage. Accumulation of NPs in the lung may be due to specific vascularization and increased vessel permeability to circulating NPs.7 Biodistribution of iron in the heart is proposed to be attributed to the accumulation of transferrin-bound and non-transferrin-bound Fe.45 A recent study on intravenously injected superparamagnetic iron oxide NP (SPION) microbubbles in rats revealed that biodistribution of NPs in liver, lung and spleen is mostly associated with macrophages.46 Accumulation of iron in brain at higher doses was additionally observed, suggesting that IONPs can effectively cross the blood–brain barrier (BBB). One of the possible pathways of iron transport into the brain is through the transferrin receptor, as transferrin binds and transports iron to different organs.47 Increased free iron content in the brain is a matter of concern since transferrin-bound iron does not result in toxicity.48 Similar results have been reported by other researchers.31,41,49 The slight increase in brain iron level detected did not induce behavioral alterations in NPs-exposed animals throughout the investigation, indicating no significant toxic effects of NPs on the brain. In the present study, higher dose-treated groups showed significant deposition of NPs in testis, which may be a cause for concern in terms of reproductive health. Previously, oral administration of silver NPs induced histological and ultrastructural changes, such as germinal cell necrosis and vacuolated mitochondria, in rat's testis after 90 days of treatment.50 Moreover, Miresmaeili et al51 reported a significant reduction in the number of primary spermatocytes, spermatids and spermatozoa, whereas the number of Sertoli cells and seminiferous tubule diameters were not markedly altered. Meanwhile, disorganized and disrupted seminiferous tubules as well as inflammation in testicular cells were observed during histopathological analysis of Wistar rats injected with TiO2 NPs, while nanoparticles did not induce any visible morphological changes though NPs were localized in the different organelles.52
Data from previous studies showing that higher amounts of intravenously injected iron oxide NPs reach the liver and spleen than kidney, lungs, heart and brain in male Sprague–Dawley rats31 are consistent with our findings. Earlier, extensive circulation of intragastrically administered Fe3O4 NPs in different target organs and tissues of Institute of Cancer Research (ICR) mice including heart, brain, stomach, small intestine, liver, spleen, lung, kidney and bone marrow was reported.8,10 In addition, sizes or surface treatment of NPs were shown to influence biodistribution and deposition in vivo and associated with tissue and organ damage in animals.53,54
Conclusion
Our atomic absorption spectroscopy (AAS) results confirmed dose-dependent deposition of IONPs in tissues, and the transmission electron microscopy (TEM) findings showed that IONPs accumulation leads to tissue damage. Liver and spleen were identified as the crucial target organs with maximum NPs accumulation. The IONPs accumulation pattern was as follows: spleen> liver>kidney> lung>heart> testis>brain.
The highest clearance of IONPs occurred through urine the day after the first treatment and remained high, followed by a decrease on the last day (28th day), whereas excretion of iron through feces peaked for an initial 3 days and reduced gradually thereafter. The potential abnormalities related to IONPs that are utilized in a range of therapeutic and biological applications require further investigation, with the ultimate objective of producing and using functionalized IONPs devoid of cytotoxicity that can be efficiently taken up by tissues and fulfill the requirements of specific applications.
Acknowledgements
We are grateful to the University Grant Commission (UGC), India, for proving junior research fellowship (JRF) and senior research fellowship (SRF) . Jawaharlal Nehru University is acknowledged for financial assistance. We thankfully acknowledge the Advanced Instrumentation Research Facility, Jawaharlal Nehru University, for SEM and TEM analyses and the Central Instrument Facility, School of Environmental Sciences (SES), Jawaharlal Nehru University, for AAS analysis.
Disclosure
The authors report no conflicts of interest in this work.
References
1. Oberdorster G, Maynard A, Donaldson K, et al. Principles for characterizing the potential human health effects from exposure to nanomaterials: elements of a screening strategy. Part Fibre Toxicol. 2005;2:8. doi:10.1186/1743-8977-2-8
2. Akerman ME, Chan WC, Laakkonen P, Bhatia SN, Ruoslahti E. Nanocrystal targeting in vivo. Proc Natl Acad Sci. 2002;99:12617–12621. doi:10.1073/pnas.152463399
3. Ballou B, Lagerholm BC, Ernst LA, Bruchez MP, Waggoner AS. Noninvasive imaging of quantum dots in mice. Bioconjugate Chem. 2004;15:79–86. doi:10.1021/bc034153y
4. Cagle DW, Kennel SJ, Mirzadeh S, Alford JM, Wilson LJ. In vivo studies of fullerene-based materials using endohedral metallofullerene radiotracers. Proc Natl Acad Sci. 1999;96:5182–5187. doi:10.1073/pnas.96.9.5182
5. De Jong WH, Hagens WI, Krystek P, Burger MC, Sips AJ, Geertsma RE. Particle size-dependent organ distribution of gold nanoparticles after intravenous administration. Biomaterials. 2008;29:1912–1919. doi:10.1016/j.biomaterials.2007.12.037
6. Arora S, Rajwade JM, Paknikar KM. Nanotoxicology and in vitro studies: the need of the hour. Toxicol Appl Pharm. 2011;258:151–165. doi:10.1016/j.taap.2011.11.010
7. Hanini A, Schmitt A, Kacem K, Chau F, Ammar S, Gavard J. Evaluation ofiron oxide nanoparticle biocompatibility. Int J Nanomed. 2011;6:787–794. doi:10.2147/IJN.S17574
8. Singh SP, Rahman MF, Murty USN, Mahboob M, Grover P. Comparative study of genotoxicity and tissue distribution of nano and micron sized iron oxide in rats after acute oral treatment. Toxicol Appl Pharm. 2013;266:56–66. doi:10.1016/j.taap.2012.10.016
9. Gu L, Fang RH, Sailor MJ, Park JH. In vivo clearance and toxicity of monodisperse iron oxide nanocrystals. ACS Nano. 2012;6:4947–4954. doi:10.1021/nn300456z
10. Wang J, Chen Y, Chen B, et al. Pharmacokinetic parameters and tissue distribution of magnetic Fe3O4 nanoparticles in mice. Int J Nanomed. 2010;21:861–866. doi:10.2147/IJN.S13662
11. Wang L, Wang L, Ding W, Zhang F. Acute toxicity of ferric oxide and zinc oxide nanoparticles in rats. J Nanosci Nanotechnol. 2010;10:8617–8624. doi:10.1166/jnn.2010.2483
12. Zhu MT, Feng WY, Wang B, et al. Comparative study of pulmonary responses to nano-and submicron-sized ferric oxide in rats. Toxicology. 2008;247:102–111. doi:10.1016/j.tox.2008.02.011
13. Meng Z, Wei F, Ma W, et al. Design and synthesis of “all‐in‐one” multifunctional FeS2 nanoparticles for magnetic resonance and near‐infrared imaging guided photothermal therapy of tumors. Adv Funct Mater. 2016;26:8231–8242. doi:10.1002/adfm.201603776
14. Powers KW, Palazuelos M, Moudgil BM, Roberts SM. Characterization of the size, shape, and state of dispersion of nanoparticles for toxicological studies. Nanotoxicology. 2007;1:42–51. doi:10.1080/17435390701314902
15. Randhawa MA. Calculation of LD50 values from the method of Miller and Tainter, 1944. J Ayub Med Coll Abbottabad. 2009;21:184–185.
16. Gaharwar US, Meena R, Rajamani P. Iron oxide nanoparticles induced cytotoxicity, oxidative stress and DNA damage in lymphocytes. J Appl Toxicol. 2017;37:1232–1244. doi:10.1002/jat.3485
17. Kateb B, Chiu K, Black KL, et al. Nanoplatforms for constructing new approaches to cancer treatment, imaging, and drug delivery: what should be the policy? Neuroimage. 2011;54:106–124. doi:10.1016/j.neuroimage.2010.01.105
18. Szebeni J. Nanomedicine: application of nanotechnology in medicine. Opportunities in neuropsychiatry. Neuropsychopharmacol Hungarica. 2011;13:15–24.
19. Kumari M, Rajak S, Singh SP, et al. Biochemical alterations induced by acute oral doses of iron oxide nanoparticles in Wistar rats. Drug Chem Toxicol. 2013;36:296–305. doi:10.3109/01480545.2012.720988
20. Tiwari DK, Jin T, Behari J. Dose-dependent in-vivo toxicity assessment of silver nanoparticle in Wistar rats. Toxicol Mech Method. 2011;21:13–24. doi:10.3109/15376516.2010.529184
21. Kim YS, Song MY, Park JD, et al. Subchronic oral toxicity of silver nanoparticles. Part Fibre Toxicol. 2010;7:20. doi:10.1186/1743-8977-7-20
22. Souris JS, Lee CH, Cheng SH, et al. Surface charge-mediated rapid hepatobiliary excretion of mesoporous silica nanoparticles. Biomaterials. 2010;31:5564–5574. doi:10.1016/j.biomaterials.2010.03.048
23. Hagens WI, Oomen AG, de Jong WH, Cassee FR, Sips AJ. What do we (need to) know about the kinetic properties of nanoparticles in the body? Regul Toxicol Pharmacol. 2007;49:217–229. doi:10.1016/j.yrtph.2007.07.006
24. Neuberger T, Schöpf B, Hofmann H, Hofmann M, Von Rechenberg B. Superparamagnetic nanoparticles for biomedical applications: possibilities and limitations of a new drug delivery system. J Magn Magn Mater. 2005;293:483–496. doi:10.1016/j.jmmm.2005.01.064
25. Dziendzikowska K, Gromadzka-Ostrowska J, Lankoff A, et al. Time‐dependent biodistribution and excretion of silver nanoparticles in male Wistar rats. J Appl Toxicol. 2012;32:920–928. doi:10.1002/jat.2758
26. Patri A, Umbreit T, Zheng J, et al. Energy dispersive X-ray analysis of titanium dioxide nanoparticle distribution after intravenous and subcutaneous injection in mice. J Appl Toxicol. 2009;29:662–672. doi:10.1002/jat.1454
27. Shapero K, Fenaroli F, Lynch I, Cottell DC, Salvati A, Dawson KA. Time and space resolved uptake study of silica nanoparticles by human cells. Mol Biosyst. 2011;7:371–378. doi:10.1039/c0mb00109k
28. Sonavane G, Tomoda K, Makino K. Biodistribution of colloidal gold nanoparticles after intravenous administration: effect of particle size. Colloids Surf B. 2008;66:274–280. doi:10.1016/j.colsurfb.2008.07.004
29. Ren X, Zheng R, Fang X, et al. Red blood cell membrane camouflaged magnetic nanoclusters for imaging-guided photothermal therapy. Biomaterials. 2016;92:13–24. doi:10.1016/j.biomaterials.2016.03.026
30. Wijnhoven SW, Peijnenburg WJ, Herberts CA, et al. Nano-silver–a review of available data and knowledge gaps in human and environmental risk assessment. Nanotoxicology. 2009;3:109–138. doi:10.1080/17435390902725914
31. Jain TK, Reddy MK, Morales MA, Leslie-Pelecky DL, Labhasetwar V. Biodistribution, clearance, and biocompatibility of iron oxide magnetic nanoparticles in rats. Mol Pharm. 2008;5:316–327. doi:10.1021/mp7001285
32. Li SD, Huang L. Pharmacokinetics and biodistribution of nanoparticles. Mol Pharm. 2008;5:496–504. doi:10.1021/mp800049w
33. Kumar R, Roy I, Ohulchanskky TY, et al. In vivo biodistribution and clearance studies using multimodal organically modified silica nanoparticles. ACS Nano. 2010;4:699–708. doi:10.1021/nn901146y
34. Burns AA, Vider J, Ow H, et al. Fluorescent silica nanoparticles with efficient urinary excretion for nanomedicine. Nano Lett. 2008;9:442–448. doi:10.1021/nl803405h
35. Schipper ML, Iyer G, Koh AL, et al. Particle size, surface coating, and PEGylation influence the biodistribution of quantum dots in living mice. Small. 2009;5:126–134. doi:10.1002/smll.200800003
36. Chen Z, Meng H, Xing G, et al. Acute toxicological effects of copper nanoparticles in vivo. Toxicol Lett. 2006;163:109–120. doi:10.1016/j.toxlet.2005.10.003
37. Kim WY, Kim J, Park JD, Ryu HY, Yu IJ. Histological study of gender differences in accumulation of silver nanoparticles in kidneys of Fischer 344 rats. J Toxicol Enviro Health, Part A. 2009;72:1279–1284. doi:10.1080/15287390903212287
38. Wang J, Zhou G, Chen C, et al. Acute toxicity and biodistribution of different sized titanium dioxide particles in mice after oral administration. Toxicol Lett. 2007;168:176–185. doi:10.1016/j.toxlet.2006.12.001
39. Iversen NK, Frische S, Thomsen K, et al. Superparamagnetic iron oxide polyacrylic acid coated γ-Fe2O3 nanoparticles do not affect kidney function but cause acute effect on the cardiovascular function in healthy mice. Toxicol Appl Pharm. 2013;266:276–288. doi:10.1016/j.taap.2012.10.014
40. Kim YS, Kim JS, Cho HS, et al. Twenty-eight-day oral toxicity, genotoxicity, and gender-related tissue distribution of silver nanoparticles in Sprague-Dawley rats. Inhal. 2008;20:575–583. doi:10.1080/08958370701874663
41. Park EJ, Kim H, Kim Y, Choi K. Repeated-dose toxicity attributed to aluminum nanoparticles following 28-day oral administration, particularly on gene expression in mouse brain. Toxicol Environ Chem. 2011;93:120–133. doi:10.1080/02772248.2010.495191
42. Pujalté I, Passagne I, Brouillaud B, et al. Cytotoxicity and oxidative stress induced by different metallic nanoparticles on human kidney cells. Part Fibre Toxicol. 2011;8:1–16. doi:10.1186/1743-8977-8-10
43. Sarhan OMM, Hussein RM. Effects of intraperitoneally injected silver nanoparticles on histological structures and blood parameters in the albino rat. Int J Nanomed. 2014;9:1505. doi:10.2147/IJN.S56729
44. Wu F, Zhang M, Lu H, et al. Triple stimuli-responsive magnetic hollow porous carbon-based nanodrug delivery system for magnetic resonance imaging-guided synergistic photothermal/chemotherapy of cancer. ACS Appl Mater Interfaces. 2018;10:21939–21949. doi:10.1021/acsami.8b07213
45. Qian ZM, Chang YZ, Leung G, et al. Expression of ferroportin1, hephaestin and ceruloplasmin in rat heart. Biochim Biophys Acta (BBA). 2007;1772:527–532. doi:10.1016/j.bbadis.2007.02.006
46. Barrefelt A, Saghafian M, Kuiper R, et al. Biodistribution, kinetics, and biological fate of SPION microbubbles in the rat. Int J Nanomed. 2013;8:3241. doi:10.2147/IJN.S49948
47. Descamps L, Dehouck MP, Torpier G, Cecchelli R. Receptor-mediated transcytosis of transferrin through blood-brain barrier endothelial cells. Am J Physiol Heart Circ Physiol. 1996;270:H1149–H1158. doi:10.1152/ajpheart.1996.270.4.H1149
48. Gaasch JA, Lockman PR, Geldenhuys WJ, Allen DD, Van der Schyf CJ. Brain iron toxicity: differential responses of astrocytes, neurons, and endothelial cells. Neurochem Res. 2007;32:1196–1208. doi:10.1007/s11064-007-9290-4
49. Kiruba SCG, Tharmaraj V, Sironman TA, Pitchumani K. Toxicity and immunological activity of silver nanoparticles. Appl Clay Sci. 2010;48:547–551. doi:10.1016/j.clay.2010.03.001
50. Thakur M, Gupta H, Singh D, et al. Histopathological and ultra structural effects of nanoparticles on rat testis following 90 days (Chronic study) of repeated oral administration. J Nanobiotechnol. 2014;12:1–13. doi:10.1186/s12951-014-0042-8
51. Miresmaeili SM, Halvaei I, Fesahat F, Fallah A, Nikonahad N, Taherinejad M. Evaluating the role of silver nanoparticles on acrosomal reaction and spermatogenic cells in rat. Iran J Reprod Med. 2013;11:423.
52. Meena R, Kajal K, Paulraj R. Cytotoxic and genotoxic effects of titanium dioxide nanoparticles in testicular cells of male wistar rat. Appl Biochem Biotechnol. 2014;175:825–840. doi:10.1007/s12010-014-1299-y
53. Wang B, Feng WY, Wang M, et al. Transport of intranasally instilled fine Fe2O3 particles into the brain: micro-distribution, chemical states, and histopathological observation. Biol Trace Elem Res. 2007;118:233–243. doi:10.1007/BF02698086
54. Warheit DB, Webb TR, Reed KL, Frerichs S, Sayes CM. Pulmonary toxicity study in rats with three forms of ultrafine-TiO2 particles: differential responses related to surface properties. Toxicol. 2007;230:90–104. doi:10.1016/j.tox.2006.11.002
 © 2019 The Author(s). This work is published and licensed by Dove Medical Press Limited. The full terms of this license are available at https://www.dovepress.com/terms.php and incorporate the Creative Commons Attribution - Non Commercial (unported, v3.0) License.
By accessing the work you hereby accept the Terms. Non-commercial uses of the work are permitted without any further permission from Dove Medical Press Limited, provided the work is properly attributed. For permission for commercial use of this work, please see paragraphs 4.2 and 5 of our Terms.
© 2019 The Author(s). This work is published and licensed by Dove Medical Press Limited. The full terms of this license are available at https://www.dovepress.com/terms.php and incorporate the Creative Commons Attribution - Non Commercial (unported, v3.0) License.
By accessing the work you hereby accept the Terms. Non-commercial uses of the work are permitted without any further permission from Dove Medical Press Limited, provided the work is properly attributed. For permission for commercial use of this work, please see paragraphs 4.2 and 5 of our Terms.