")
Back to Journals » International Journal of Nanomedicine » Volume 16
Biodegradable Nanosonosensitizers with the Multiple Modulation of Tumor Microenvironment for Enhanced Sonodynamic Therapy
Authors Zhou H, Sun J, Wu J, Wei H, Zhou X
Received 18 December 2020
Accepted for publication 18 March 2021
Published 6 April 2021 Volume 2021:16 Pages 2633—2646
DOI https://doi.org/10.2147/IJN.S297571
Checked for plagiarism Yes
Review by Single anonymous peer review
Peer reviewer comments 3
Editor who approved publication: Professor Lei Yang
Hang Zhou,1,2,* Jiawei Sun,1,* Jiaqi Wu,1 Hong Wei,1 Xianli Zhou1
1In-Patient Ultrasound Department, Second Affiliated Hospital of Harbin Medical University, Harbin, Heilongjiang, 150081, People’s Republic of China; 2Department of Ultrasound, Second Affiliated Hospital of Zhejiang University, Hangzhou, Zhejiang, 310058, People’s Republic of China
*These authors contributed equally to this work
Correspondence: Xianli Zhou
In-Patient Ultrasound Department, Second Affiliated Hospital of Harbin Medical University, Harbin, Heilongjiang, 150081, People’s Republic of China
Tel/Fax +86-0451-86605362
Email [email protected]
Background: The specific microenvironment of solid tumors, which is characterized by hypoxia, overexpression of glutathione (GSH), and high accumulation of anti-inflammatory tumor-associated macrophages (TAMs), limits the efficiency of sonodynamic therapy (SDT).
Method and Results: Herein, a multifunctional nanoplatform was engineered to modulate the tumor microenvironment for highly efficient SDT. In this system, sonosensitizers and catalase were encapsulated in disulfide-bridged mesoporous organosilicon nanoparticles with high loading, which protected the activity of catalase and ensure the stability of sonosensitizers and enzyme. Subsequently, hyaluronic acid was grafted onto the nanoplatform to reeducate TAMs and induce the secretion of exogenous hydrogen peroxide. Due to the good protection of enzyme, the catalase within the nanoplatform efficiently produced the mount of O2 through decomposing the hydrogen peroxide in tumor tissues, which remarkably alleviated tumor hypoxia. Furthermore, degradation of the nanoparticles was observed in response to GSH, which effectively decreased the intracellular GSH level, further favoring SDT-triggered anticancer effect.
Conclusion: Based on the multiple adjustments to tumor microenvironment, our nanoplatform displayed extraordinary sonodynamic therapeutic effect with low systemic toxicity.
Keywords: sonodynamic therapy, hypoxia, tumor-associated macrophages, catalase, glutathione depletion
Introduction
Sonodynamic therapy (SDT), which utilizes high-frequency ultrasound to activate sonosensitizers to generate reactive oxygen species (ROS), has attracted great attention in the past decade due to its noninvasive characteristic and higher therapeutic depth compared with photodynamic therapy (PDT).1–4 However, the current SDT is still far from satisfactory due to the poor therapeutic efficacy in solid tumors.5,6 One of the factors is hypoxia, which greatly limits the generation of ROS.7,8 Similar to PDT, the generation of ROS in SDT is highly oxygen-dependent and involves a dramatic consumption of oxygen (O2).9–11 Unfortunately, the level of O2 in interior tumors is very low due to irregular proliferation of cancer cells and distorted vasculatures in tumors.12,13 To date, some strategies have been developed to relieve hypoxia in tumor tissues including increasing the O2 yield, decreasing the O2 consumption and directly delivering O2 into tumor tissues.14–17 Among those strategy, delivering catalase into tumor tissues to decompose endogenous H2O2 into O2 is an attractive strategy.18,19 However, due to low intracellular H2O2 levels and the slow regeneration rate of H2O2, simple utilization of catalase shows limited efficacy in the relief of hypoxia.20 In addition to hypoxia, another major obstacle is the overexpression of glutathione (GSH) in cancer cells, which can consume the generated ROS during SDT, further restricting the therapeutic efficiency of SDT.21–23 Therefore, there is a pressing need for developing strategies to substantially increase intracellular H2O2 levels and simultaneously decrease GSH levels.
Recently, some studies revealed that proinflammatory M1-polarized macrophages could release significant amounts of hydrogen peroxide, superoxide anion radicals, and nitric oxide to exert their antiproliferative and cytotoxic activities.24,25 Tumor tissues, especially in hypoxic regions, are enriched by macrophages, which are termed tumor-associated macrophages (TAMs).26–28 However, TAMs are often M2-polarized phenotypes, which contribute to maintaining hypoxic tumor microenvironment by upregulating hypoxia-inducible factors (HIFs) and altering the expression of vascular endothelial growth factor (VEGF).29–32 Therefore, reeducating TAMs was proposed to increase the generation of H2O2 and modulate tumor hypoxia. Hyaluronic acid (HA), a versatile and highly functional biopolymer, has molecular weight-dependent effects on reprogramming macrophage phenotype. A large number of literature validated that the low molecular weight HA can function as an alarm signal to reeducate the M2-polarized macrophages to M1-polarized phenotypes.33–36 Therefore, it is feasible to utilize HA-attached nanoparticles to induce M1 macrophage polarization and exogenous H2O2 secretion to overcome the inadequacy of endogenous H2O2.
In this work, a mesoporous organosilicon nanoplatform integrating sonosensitizers and CAT loading, with HA modification was designed for highly efficient SDT. On the one hand, the nanoplatform exhibited matrix-degradation property when exposed to GSH due to the cleavage of disulfide bonds, which not only facilitates the release of the payload in desired sites but also consumes the overexpressed GSH in cancer cells. On the other hand, HA attached to the nanoplatform enforced the polarization of M2 TAMs into M1 macrophages and induced the generation of exogenous H2O2. Furthermore, the well-protected CAT within the nanoplatform produced amounts of O2 through decomposing exogenous H2O2 in tumor tissues, which effectively alleviated tumor hypoxia. Therefore, the nanoplatform with an outstanding ability to modulate tumor microenvironment showed high SDT efficacy with low systemic toxicity (Scheme 1).
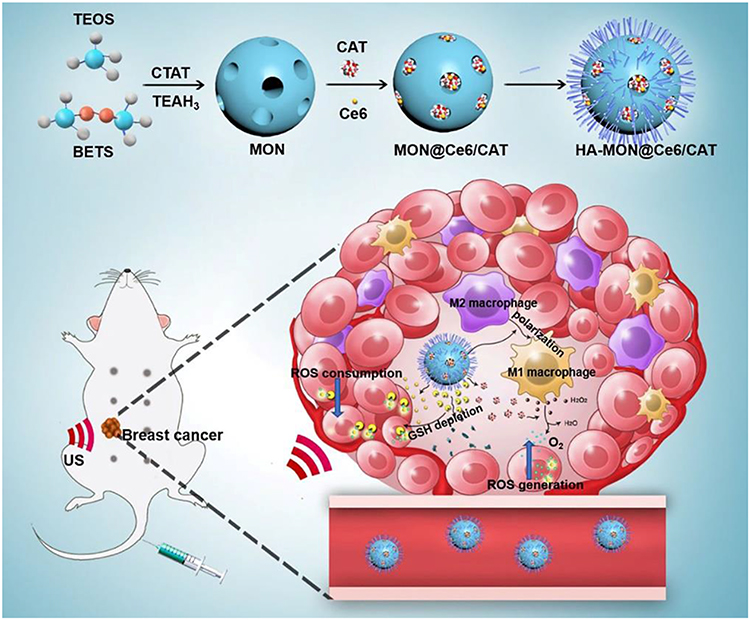 |
Scheme 1 Schematic illustration of the preparation procedure for the mesoporous organosilicon nanoplatform and the application on the multiple modulation of tumor microenvironment for enhanced sonodynamic therapy. |
Materials and Methods
Materials
Triethanolamine (TEAH3), cetyltrimethylammonium tosylate (CTAT), bis[3-(triethoxysilyl) propyl]tetrasulfide (BTESPT), Tetraethyl orthosilicate (TEOS), 3-aminopropyltriethoxysilane (APTES), reduced glutathione (GSH), carbodiimide hydrochloride (EDC), and sulfo-N-hydroxy succinimide (sulfo-NHS) were obtained from Sigma-Aldrich Co. (St Louis, MO, USA). Fetal bovine serum (FBS) and RPMI-1640 medium were purchased from GIBCO. CD 206 antibody, iNOS antibody, and antipimonidazole/FITC were obtained from Abcam. The kits for aspartate aminotransferase (AST), blood urea nitrogen (BUN), phosphocreatine kinase, alanine aminotransferase, and creatinine were obtained from Nanjing Jiancheng Bioengineering Institute (Jiangsu, China). The other chemical reagents and solvents were obtained from Beijing Chemical Reagent Co. (Beijing, China) and used without further purification.
The Synthesis of MONs
Disulfide-bridged mesoporous nanoparticles were prepared by a sol-gel approach. Briefly, 500 mg of cetyltrimethylammonium tosylate (CTAT) were mixed in 30 mL deionized water at 80°C for 30 min. Then, 400 μL tetraethoxysilane (TEOS) and 200 μL of bis [3-(triethoxysilyl) propyl] tetrasulfide (BTES) were added dropwise into the mixture. The resulting mixture was maintained at 80°C with stirring. After 3 h, the products were collected by centrifugation at 8000 r/min.Then, the collected products were refluxed in an ethanol solution of NH4NO3 (1.5% w/v) at 105°C for 8 h to form mesopores. After centrifugation and washing with ethanol, the MONs were obtained. To functionalize the surface of the MONs with -NH2, 100 μL of aminopropyltriethoxysilane (APS) was added to the prepared MONs in a dimethylformamide (DMF) solution. After stirring overnight, the mixture was reacted at 80°C for 1 h. Then, the amino-functionalized MONs were collected and purified by centrifugation and washed with ethanol. Mesoporous silica nanoparticles without disulfide were synthesized using the same protocol except that 400 μL TEOS and 200 μL of BTES were replaced with 600 μL TEOS.
Load of Ce6/CAT
Chlorine e6 (Ce6, 1 mg) was added to a 1 mL dimethylsulfoxide (DMSO) solution of the MONs (1 mg/mL) and stirred for 24 h. The unbound Ce6 was removed by centrifugation. The Ce6-loaded content was determined by measuring the UV-vis absorbance at a wavelength of 403 nm according to the equation: Ce6-loaded content (%) = Mass of Ce6 in MON@Ce6/Mass of MON@Ce6. To preload catalase (CAT), it was dissolved in water to form a CAT stock solution (1 mg/mL). Then, 10 mL of the CAT solution was added to 10 mL of the MON@Ce6 solution (1 mg/mL), and the mixture was shaken at 500 rpm for 24 h. Then, the CAT-adsorbed MONs@Ce6 (MON@Ce6/CAT) were collected by centrifugation, and the loaded content of CAT was determined by measuring the absorbance of the supernatant at 280 nm.
Modification of HA
HA was grafted onto the surface of the MONs@Ce6/CAT using the EDC/NHS method. Briefly, 50 mL of HA (100 mg), 370 mg of NHS, and 200 mg of EDC were added to 20 mL of deionized water. After intensive mixing, 100 mL of aqueous solution of MON@Ce6/CAT (5 mg/mL) was injected into the mixture. The pH of the resulting mixture was adjusted to 9.0 using triethylamine. After stirring at 40°C for 24 h, the HA-MON@Ce6/CAT were centrifugated and washed with ethyl alcohol for purification.
Degradation and Drug Release
Degradation of the HA-MON@Ce6/CAT was investigated in media mimicking the intracellular GSH conditions of cancer cells at 37°C with gentle shaking (100 rpm). Then, the samples were collected and visualized by TEM after 1 and 3 days of incubation. To study the release of Ce6, 10 mg of the HA-MON@Ce6/CAT was dialyzed against water or 5 × 10⁻³ M GSH PBS solution at pH 7.4 or 6.5. The cumulative release of Ce6 was quantified by measuring the UV-vis absorption at 403 nm at predetermined time points. To investigate the release of CAT, the HA-MONs@Ce6/CAT were dispersed in 5 × 10⁻³ M GSH PBS solution. Then, the released CAT in the supernatant was measured at the absorbance of 280 nm at designated intervals.
Catalytic Activity of HA-MON@Ce6/CAT
The catalytic activity of HA-MON@Ce6/CAT was evaluated using the Góth method.37 Briefly, 0.2 mg of free CAT, 1 mg of HA-MON@Ce6, and 1.2 mg of HA-MON@Ce6/CAT were incubated with 1 mL H2O2 solution (50 mM) at 37°C at pH 7.4 for various periods of time. Then, 1 mL of ammonium molybdate was injected into the complex solution to terminate the reaction. Then, the enzymatic activity of CAT was measured by detecting the absorbance of the solution at 400 nm. To determine the enzymatic stability, free CAT (0.2 mg) and HA-MON@Ce6/CAT (1.2 mg) were treated with protease K (0.5 mg/mL) at 37°C. Then, the enzymatic activities of the free CAT and HA-MONs@Ce6/CAT were measured using the same protocol at predetermined time points.
Cell Culture and in vitro SDT
Mouse breast cancer 4T1 cells were maintained in RPMI-1640 medium with 10% heat-inactivated fetal bovine serum at 37°C. No ethics committee permission was required for the use of all the cells because all the cell lines were certificated from ATCC. Normoxic 4T1 were cultured in a normoxic atmosphere (5% CO 2, 21% O2, and 74% N2). Hypoxic 4T1 were added 100 µM H2O2 and cultured in a hypoxic atmosphere (5% CO 2, 1% O2, and 94% N2).
Normoxic and hypoxic 4T1 were treated with different concentration of free Ce6, HA-MONs, HA-MON@Ce6, HA-MSN@Ce6, and HA-MON@Ce6/CAT. After 12 h of incubation, these cells were exposed to an ultrasound (US) with a frequency of 1 MHz at 1 W/cm2 for 60 s. Then, the cell viability of 4T1 cells was detected using an SRB assay.
Intracellular GSH and ROS Measurement
4T1 cells were treated with HA-MONs, HA-MON@Ce6/CAT, HA-MSNs, or HA-MSN@Ce6/CAT (100 μg/mL) for 12 h. Then, these cells were resuspended in PBS (10 μL) and mixed with 5% metaphosphoric acid (30 μL). Next, these cells were repeatedly frozen and thawed by liquid nitrogen and water. Last, the supernatant was collected by centrifugation, the intracellular GSH content was determined using a colorimetric microplate assay kit according to the manufacturer’s protocol. To test the intracellular ROS, the 4T1 were incubated with DCFH-DA for 20 min after various treatments under normoxic (5% CO 2, 21% O2, and 74% N2) and hypoxic (5% CO 2, 1% O2, and 94% N2) conditions. Then, these cells were washed with PBS three times. The fluorescence signal of these was observed using fluorescence microscopy and quantified by flow cytometry.
Reeducation of M2 Macrophages
RAW264.7 cells were incubated with 25 ng/mL IL-4 for 24 h to generate M2 macrophages. Then, these macrophages were incubated with 100 μg/mL MONs@Ce6/CAT or HA-MONs@Ce6/CAT for 3 h. Then, RNA from macrophages was extracted using a Qiagen RNeasy mini/micro kit following the manufacturer’s protocol, and the cell culture supernatants were collected and stored at −80°C for future use. Then, real-time PCR was performed using a Dynamo HS SYBR Green qPCR kit. The level of H2O2 in the cell culture medium was measured by a PeroXO quant assay kit.
Animal Experiments
Twenty-gram female Balb/c mice were purchased from the Animal Experimental Center of Zhejiang University. All the mice were raised in a conventional animal housing facility. The protocols of animal experiments were approved by the Ethics Committee for the Use of Experimental Animals of the Second affiliated hospital of Zhejiang University school of medicine, and the operation of animals was performed in agreement with the National Institute of Health Guide for the Care and Use of Laboratory Animals.
Immunogenicity of HA-MON@Ce6/CAT
Female Balb/c mice were injected with PBS, free catalase (2 mg/kg), or HA-MON@Ce6/CAT (12 mg/kg). Three days after administration, blood from each mouse was collected, and the serum was separated from the blood by centrifugation. Then, the titer of catalase-specific antibody in serum was determined using ELISA assay.
Immunofluorescent Staining and Flow Cytometry
To establish 4T1 tumor mouse models, 1 × 10⁶ 4T1 cells were orthotopically injected into the mammary fat pads of 6- to 8-week-old female Balb/c mice. After the tumors had grown to approximately 80 mm3, the 4T1 tumor-bearing mice were subjected to intravenous injection with MONs@Ce6/CAT and HA-MONs@Ce6/CAT (12 mg/kg). After 24 h injection, the tumor tissues were harvested, sliced, and stained with rabbit polyclonal CD206 antibody (M2 macrophage markers) and rabbit polyclonal iNOS antibody (M1 macrophage markers). Then, the M1/M2 ratio was measured by flow cytometry. To investigate the hypoxic status in the tumor tissues, tumor slices were stained with DAPI and antipimonidazole antibodies and observed using confocal microscopy.
In vivo Antitumor Effect and Biosafety
4T1 tumor-bearing mice were randomized into eight groups. The mice in the eight groups, including the control, MONs@Ce6/CAT (12 mg/kg), HA-MONs@Ce6/CAT (12 mg/kg), US, MONs@Ce6 (10 mg/kg) with US, MONs@Ce6/CAT (12 mg/kg) with US, HA-MONs@Ce6/CAT (12 mg/kg) with US and HA-MSNs@Ce6/CAT (12 mg/kg) with US, were intravenously injected with PBS or the nanoparticles every three days for a total of six injections. In the US-treated groups, the tumor regions were exposed to 1 Hz ultrasound at 1 W/cm2 for 60 s at 24 h postinjection. The mice were weighed, and the tumor volume in each mouse was measured using a digital caliper 2 days postinjection. The tumor volumes were calculated by the following equation: volume = length × width2 × 0.52. On the 23rd day, all the mice were sacrificed, and the tumors, blood, and major organs, including the liver, spleen, kidney, lung, and heart, were harvested. The tumors were weighed and then subjected to the fluorescence terminal deoxynucleotidyl transferase deoxyuridine triphosphate nick-end labeling (TUNEL) assay to measure the tumor apoptosis. Additionally, the collected organs were sliced and stained with hematoxylin-eosin. The serum was separated from the collected blood and used to assess the biochemical parameters, including alanine aminotransferase (ALT), aspartate aminotransferase (AST), blood urea nitrogen (BUN), and creatinine (CRE), following the manufacturer’s protocol.
Statistical Analysis
The differences between only two groups were analyzed by Student’s t-test. The differences among more than two groups were analyzed by one-way analysis of variance. p < 0.05 represented a statistically significant difference.
Results and Discussion
Synthesis and Characterization of MONs
Disulfide-bridged mesoporous organosilica nanoparticles (MONs) were synthesized by a sol-gel approach using cetyltrimethylammonium tosylate (CTAT) as a structure-directing agent, and bis [3- (triethoxysily) propyl] tetrasulfide (BTES) and tetraethoxysilane (TEOS) as co-precursors. As shown in Figure 1A, MONs possessed uniform spherical structures with diameters of approximately 40 nm. Nitrogen adsorption–desorption isotherms of these nanoparticles revealed the existence of mesopores, and the Brunner−Emmet−Teller (BET) surface area, pore size, and pore volume of MONs were 737.8 m2 g−1, 8.7 nm, and 0.98 cm3 g−1, respectively (Figure 1B, Figure S1). The high surface area, adequate pore size, and large pore volume of MONs indicated their excellent drug loading capability and accessibility for enzymes. To load Chlorin e6 (Ce6), MONs was functionalized with amino groups by a post graft method. Then, Ce6 was loaded into the framework of the mesoporous silica at a high loading content (20.1%) through electrostatic interactions. After preloading Ce6, the Ce6-loaded MONs (MON@Ce6) maintained a good accessibility for catalase (CAT), and a high loading capacity of 201µg/mg was obtained owing to their mesoporous structure. Then, we conjugated the HA on the surface of the MON@Ce6/CAT through EDC/NHS chemical reaction. The blurry boundary and mesoporous structure observed in the TEM images provide direct evidence of the modification of HA (Figure S2). Additionally, the Zeta potential of the HA-modified MON@Ce6/CAT (HA-MON@Ce6/CAT) remarkably decreased in comparison to that of MON@Ce6/CAT (Figure 1C). Furthermore, the FTIR analysis showed the characteristic adsorption peaks of carbonyl group at 1720 cm−1 appeared in the spectrum of HA-MON@Ce6/CAT (Figure S3). These results validated that HA was successfully coated onto the MON@Ce6/CAT. To investigate the amount of HA, the thermogravimetric analysis (TGA) was carried out. As shown in Figure S4, the weight loss of HA-MON@Ce6/CAT was 35.8% at 600°C. An additional weight loss of about 17.6% was measured regarding MSN-SS-HA due to the removal of HA on the nanoparticles. Thus, the amount of HA on the nanoparticles was 17.6%
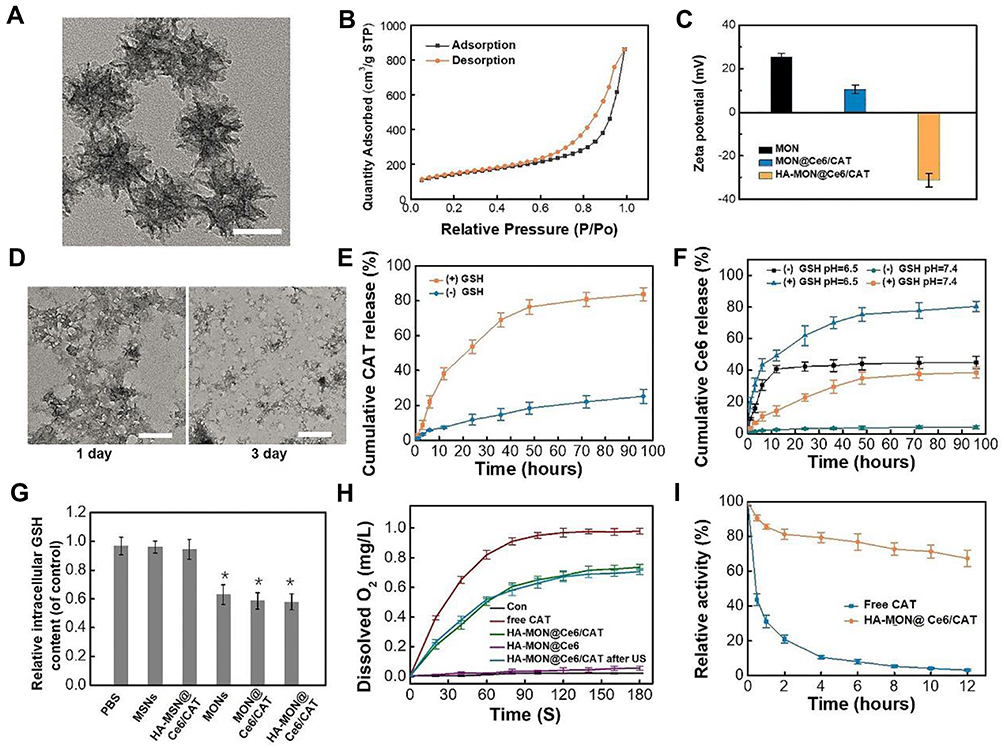 |
Figure 1 Characterization of HA-MONs@Ce6/CAT. (A) TEM images of MONs, scale bar = 30 nm. (B) N2 adsorption−desorption isotherms of MONs. (C) Zeta potential of MONs, MON@Ce6/CAT and HA-MON@Ce6/CAT. (D) TEM images of HA-MON@Ce6/CAT after immersed in 5 × 10⁻³ m GSH solution for 1 day and 3-day, scale bar = 30 nm. (E) CAT release behavior of HA-MON@Ce6/CAT under 5 × 10⁻³ M GSH solution or PBS. (F) Ce6 release behavior of HA-MON@Ce6/CAT under 5 × 10⁻³ M GSH solution or PBS at pH 6.5 or 7.4. (G) Intracellular GSH content after incubation with MONs, MON@Ce6/CAT, HA-MON@Ce6/CAT, MSNs or HA-MSN@Ce6/CAT for 12 h. *p < 0.05 versus PBS groups. (H) Generation of O2 in H2O2 solutions after treatment with free CAT, HA-MON@Ce6, HA-MON@Ce6/CAT with or without US. (I) The relative activity of free CAT and HA-MON@Ce6/CAT after protease K for various time. All the data represent the mean ± SD (n = 3). |
Degradation and Drug Release of HA-MON@Ce6/CAT
It is well known that a high concentration of glutathione (GSH) exists in cancer cells in comparison to the GSH concentration in normal cells and plasma.38 Considering the cleavage of disulfide bonds under redox conditions, we evaluated the degradation performance of HA-MON@Ce6/CAT in media mimicking the intracellular GSH conditions in cancer cells. As shown in Figure S5 and 1D, HA-MON@Ce6/CAT kept the intact structure after stocked in the media without GSH, whereas degraded at the first day and eventually fragmented at the third day in the media containing GSH. This GSH-responsive biodegradability resulted in HA-MON@Ce6/CAT to have the ability to selectively release drug within cancer cells. Then, we investigated the release of CAT under the same conditions. Less than 25% CAT was released from the HA-MON@Ce6/CAT without GSH, whereas the cumulative CAT release reached 83.1% in the presence of GSH, which was consistent with the degradation behavior of HA-MON@Ce6/CAT (Figure 1E). Similar to the release of CAT, high Ce6 release was measured in presence of GSH. Notably, the release of Ce6 was also pH-responsive, which was probably due to the protonation and dissociation triggered by the acidic microenvironment (Figure 1F). The tumor-microenvironmental responsive release was not only beneficial for reducing the undesired leakage of Ce6 into the bloodstream and protecting the CAT in the complex physiological environment but also improved the distribution of Ce6 and CAT within the cancer cells. As we all know, the high expression of GSH in cancer cells greatly compromises the effect of ROS generated during SDT. Our HA-MON@Ce6/CAT is expected to consume GSH through reductive reaction of disulfide bonds with GSH. To confirm the function of disulfide bonds in the nanoplatform, we prepared mesoporous silica nanocarriers with size and mesoporous structure similar to MONs but without disulfide bonds (MSNs) as contrast (Figure S6). Subsequently, 4T1 cells were incubated with various nanoparticles for 24 h and the intracellular GSH content was quantified using a colorimetric microplate assay kit. As shown in Figure 1G, the level of GSH significantly decreased after treatment with the MONs, MON@Ce6/CAT, and HA-MON@Ce6/CAT, whereas MSNs and HA-MSN@Ce6/CAT had no effect on the level of GSH in 4T1 cells, confirm the ability of HA-MON@Ce6/CAT on the GSH depletion. Additionally, the intracellular level of GSH in the HA-MON@Ce6/CAT-treated group was similar to those in the MON-treated group and in the MON@Ce6/CAT-treated group. These results indicated that the excellent ability in depleting GSH originated from the presence of disulfide bonds in MONs.
Enzymic Activity of the HA-MON@Ce6/CAT
We next evaluated the catalytic effect of the HA-MON@Ce6/CAT to decompose H2O2 into O2 using an oxygen probe. As shown in Figure 1H, the HA-MON@Ce6 without loaded CAT provided no catalytic effect on the decomposition of H2O2, whereas HA-MON@Ce6/CAT performed a good enzymatic activity to produce O2. Moreover, ultrasound (1 W cm−2; 1 MHz) showed no obvious effect on the enzyme activity of the MON@Ce6/CAT and free CAT, indicating that the catalytic capability could be remained in SDT treatment. Although the decomposing efficiency of O2 by the HA-MON@Ce6/CAT was slightly lower than that of free CAT, which was probably due to a limitation interaction between H2O2 and CAT by the mesoporous tunnels in the nanoparticles, the digestion of CAT by proteases was prevented in the MON@Ce6/CAT. As shown in Figure 1I, more than 60% of the HA-MON@Ce6/CAT retained its enzyme activity after incubation with protease K for 12 h, whereas the free CAT was rapidly digested by protease K and rapidly lost the enzyme activity. The improved stability of exogenous enzymes is crucial for in vivo applications.
In vitro SDT Effect
We next investigated the cytotoxicity of these nanoparticles towards 4T1 cell lines. As shown in Figure S7, free Ce6, HA-MONs, HA-MON@Ce6, HA-MSN@Ce6, or HA-MON@Ce6/CAT did not induce obvious cell deaths, confirming the good biocompatibility of our nanoparticles. To test the SDT efficacy of these nanoparticles, 4T1 cells were exposed to ultrasound (US) (1 W/cm2; 1 MHz; 60 s) after treated with free Ce6, HA-MONs, HA-MON@Ce6, HA-MSN@Ce6, or HA-MON@Ce6/CAT. A concentration-dependent inhibition of the cell viability was observed in the free Ce6-, HA-MON@Ce6-, HA-Ce6-, and HA-MON@Ce6/CAT-treated groups. Notably, the HA-MON@Ce6 exhibited a higher SDT efficacy than the free Ce6 and HA-MSN@Ce6, confirming the superiority of disulfide-bridged nanoparticles for SDT treatment (Figure 2A). Considering the existence of hypoxia in solid tumors, 4T1 cells were incubated in a hypoxic condition with the addition of H2O2 (100 µM) to mimic the tumor microenvironment, and then the SDT effect of these nanoparticles towards hypoxic MCF-7 cells was evaluated. As shown in Figure 2B, the SDT efficacy of HA-MON@Ce6 was greatly restricted in the hypoxic atmosphere, whereas HA-MON@Ce6/CAT still showed a good SDT efficiency, which was due to the generation of O2 from the decomposition of H2O2 by CAT. To further validate the enhanced SDT of HA-MON@Ce6/CAT, the intracellular ROS levels were measured using fluorescence microscopy and flow cytometry. Consistent with the results of cell viability, the ROS signals in HA-MON@Ce6-treated groups were approximate to that in HA-MON@Ce6/CAT-treated groups and obviously higher than that in HA-MSN@Ce6-treated groups in the normonic condition. On the contrary, HA-MON@Ce6/CAT showed an enhancement in ROS signals than HA-MON@Ce6 in a hypoxic condition with the addition of H2O2 (Figure 2C and D). These results indicated the enhanced SDT efficacy of HA-MON@Ce6/CAT in hypoxic cancer cells.
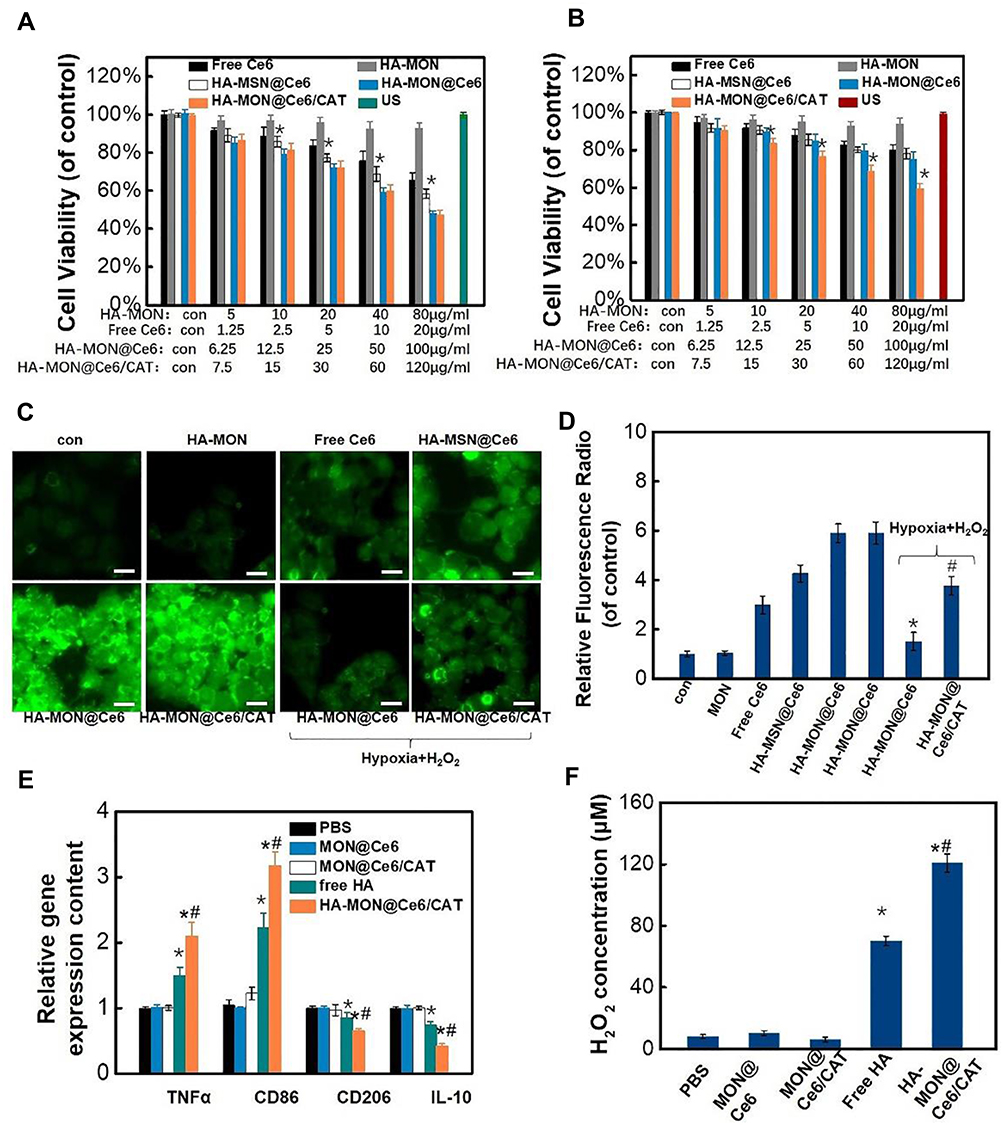 |
Figure 2 In vitro SDT effect and the reeducation of macrophages. Cytotoxicity of these nanoparticles in normoxic (A) and hypoxic (B) MCF-7 cells after exposed with US, *p < 0.05 versus MON@Ce6 groups (n = 6). (C) Intracellular reactive oxygen species (ROS) fluorescence images (bars =10 µm). (D) FACS quantitative analysis of ROS, *p < 0.05 versus HA-MON@Ce6 groups (normoxia), #p < 0.05 versus MON@Ce6 (hypoxia) groups (n = 6). (E) TNFα, CD86, CD206 and IL10 gene expression of cells after various treatments. *p < 0.05 versus PBS groups; #p < 0.05 versus free HA group (n = 6). (F) The secretion of H2O2 by macrophages after various treatments. *p < 0.05 versus PBS groups; #p < 0.05 versus free HA group. All the data represent the mean ± SD (n = 6). |
HA-MON@Ce6/CAT Reprogram M2-Like Macrophages Toward M1 Phenotypes
Although CAT within MON@Ce6/CAT is capable of catalyzing the decomposition of H2O2 into O2, the insufficient H2O2 levels and the slow regeneration rate of H2O2 in solid tumor tissues would limit the production efficiency of O2. Studies have indicated that hyaluronic acid (HA) has an immunotoxicology, which can induce macrophage polarization and promote the secretion of exogenous hydrogen peroxide (H2O2).36 Thus, we explored whether the HA-MON@Ce6/CAT could reeducate macrophages and improve the level of H2O2. M2 macrophages were treated with PBS, MON@Ce6, MON@Ce6/CAT, free HA or HA-MON@Ce6/CAT, and the transcriptome for expression of M1- and M2- mRNAs were detected by RT-PCR. As shown in Figure 2E, the M1-related TNFα and CD86 markers were upregulated, and the mRNA levels of M2-related CD206 and IL10 markers decreased in the free HA and HA-MON@Ce6/CAT-treated groups, whereas there was no significant variation in the level of these markers in the MON@Ce6 or MON@Ce6/CAT-treated groups compared with PBS groups. These results indicated that the HA-MON@Ce6/CAT could induce the polarization of M2 macrophages to the M1 phenotype. Furthermore, HA-MON@Ce6/CAT showed better ability to induce the polarization of M2 macrophages than free HA, which was probably due to the higher internalization of HA-MON@Ce6/CAT with macrophages. After confirming the ability of the HA-MON@Ce6/CAT to reprogram macrophages, we measured the production of H2O2 in the medium during the macrophage polarization process triggered by HA-MONs@Ce6/CAT. As expected, the concentration of H2O2 in the HA-MON@Ce6/CAT-treated group remarkably increased, which was more than that in free HA-treated group, indicating the efficient generation of H2O2 by HA-MON@Ce6/CAT (Figure 2F). These results suggested that our HA-MON@Ce6/CAT has great potential in alleviating tumor hypoxia.
The Relief of Tumor Hypoxia
To further investigate the ability of the HA-MON@Ce6/CAT with the relief tumor hypoxia, we intravenously MON@Ce6/CAT and HA-MON@Ce6/CAT into orthotropic 4T1 tumor-bearing mice. We first investigated the biodistribution of Cy5.5-labeled nanoparticles after various time of administration. As shown in Figure S8, MON@Ce6/CAT and HA-MON@Ce6/CAT were predominantly trapped in the tumor tissues and the reticuloendothelial system including the liver, spleen, and kidneys. The highest accumulation of these nanoparticles in the liver, spleen, kidneys, and tumor tissues, respectively, occurred at 12 h, 12 h, 12 h, and 24 h of post-injection, followed by a gradual decrease. Furthermore, HA-MON@Ce6/CAT showed a higher tumor-accumulation efficiency than MON@Ce6/CAT, which was probably because HA could effectively improve the tumor-targeting of nanoparticles through the specific interaction with CD44 overexpressed in tumor tissues.
To explore whether HA-MON@Ce6/CAT could enter into tumor-associated macrophages (TAMs), the tumors were collected and stained with CD206 (M2 macrophage markers) at 24 h postadministration. The overlay image in Figure S9 demonstrated that HA-MON@Ce6/CAT was phagocytosed by TAM, which would allow HA-MON@Ce6/CAT to switch TAM. To further investigate the ability of HA-MON@Ce6/CAT in reeducate TAMs, we stained the tumors with CD206 (M2 macrophage markers) and iNOS (M1 macrophage markers) after treated with MON@Ce6/CAT or HA-MON@Ce6/CAT for 24 h. As shown in Figure 3A and B, MONs@Ce6/CAT showed little effect on the percentage of M2 or M1 macrophages in tumor tissues, indicating MON@Ce6/CAT without the modification of HA could not induce TAMs to M1 polarization. In contrast, the percentage of M1 macrophages in tumor tissues increased while the percentage of M2 macrophages simultaneously decreased after treatment with HA-MON@Ce6/CAT. Furthermore, the M1/M2 ratio was obviously elevated to by the HA-MON@Ce6/CAT, which was in comparison to the control group and MONs@Ce6/CAT-treated groups. These results indicated that the HA modified onto the nanoparticles could induce the TAM polarization (Figure S10). To explore whether the HA-MON@Ce6/CAT could alleviate the tumor hypoxia, we first detect the level of H2O2 in the tumors after treatment with MON@Ce6, MON@Ce6/CAT, or HA-MON@Ce6/CAT for 24 h. As shown in Figure 3C, the level of H2O2 in the MONs@Ce6 treated groups was similar with that in control groups, indicating that MON@Ce6 has no effect on the level of H2O2. In contrast, MON@Ce6/CAT obviously decreased the level of H2O2 in tumor tissues, which could be explained that CAT in MON@Ce6/CAT decomposed endogenous H2O2 into O2. Notably, the level of H2O2 in HA-MON@Ce6/CAT groups remarkably increased, further suggesting the generation of exogenous H2O2 triggered by HA-MON@Ce6/CAT. We subsequently investigate the hypoxic status in the tumor tissues through immunofluorescence staining. As shown in Figure 3D and E, high hypoxia-associated green fluorescence signals in the tumor section were observed in the MON@Ce6 groups, whereas the fluorescence intensity significantly decreased after treated with MON@Ce6/CAT. As expected, HA-MON@Ce6/CAT showed strongest ability to attenuate tumor hypoxia. The efficient relief of tumor hypoxia originated from the combined effect that HA attached on the nanoplatform induce the secretion of H2O2 and CAT within nanoplatform decomposed H2O2 into O2.
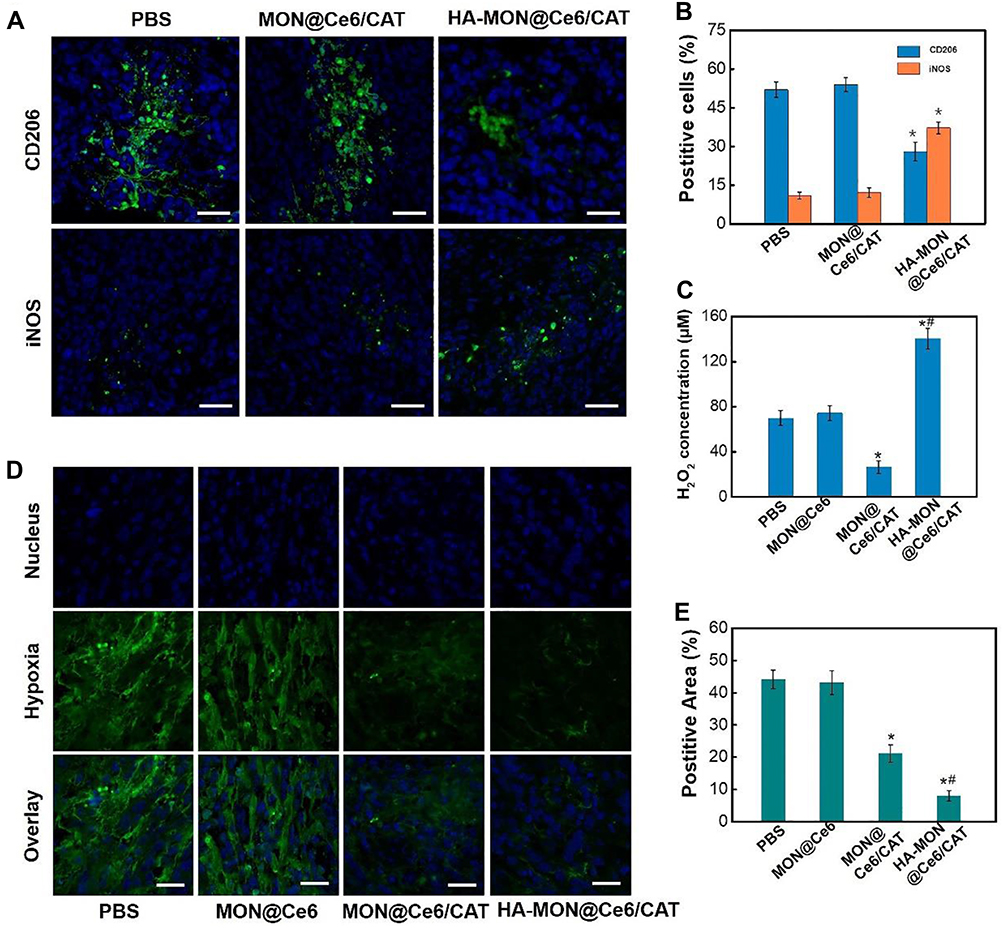 |
Figure 3 Polarization of tumor-associated macrophages by HA-MON@Ce6/CAT. (A) Immunofluorescence image of tumor sections stained with CD206 antibody and iNOS antibody after MON@Ce6/CAT and HA- MON@Ce6/CAT administration, scale bar =50 μm. (B) Flow cytometric assay of the phenotype of macrophages. *p < 0.05 versus PBS groups. Data represent the mean ± SD (n = 3). (C) H2O2 level of tumor tissues after administrated with MON@Ce6, MON@Ce6/CAT and HA- MON@Ce6/CAT. *p < 0.05 versus PBS groups; #p < 0.05 versus free MON@Ce6/CAT group. Data represent the mean ± SD (n = 3). (D) Immunofluorescence image of tumor sections stained with antipimonidazole antibody after various administration. (E) Quantitative analysis of hypoxia positive areas. *p < 0.05 versus PBS groups; #p < 0.05 versus MON@Ce6/CAT group. Data represent the mean ± SD (n = 3). |
Antitumor Effect and Biosafety
Encouraged by the excellent effect of HA-MON@Ce6/CAT in alleviating tumor hypoxia, we next investigated the in vivo SDT effect using orthotropic 4T1 BALB/c mouse tumor models. As shown in Figure 4A–C, mice treated only with MON@Ce6/CAT showed similar tumor growth as the control groups, suggesting that the MON@Ce6/CAT had little antitumor effect. HA-MONs@Ce6/CAT showed a slightly inhibitory effect on tumor growth, which might result from the polarization of TAM from the M2 phenotype to a tumor-inhibiting M1 phenotype and the variation of the tumor microenvironment. In addition, US without any nanoparticles had no tumor-inhibition effect, whereas the MON@Ce6 plus US significantly delayed the tumor growth, indicating the SDT efficacy of the MON@Ce6. Furthermore, the MON@Ce6/CAT showed a better SDT efficiency than the MON@Ce6, which was due to the increased O2 with the assistance of CAT to decompose endogenous H2O2 in the tumor tissue. Encouragingly, the highest level of tumor growth inhibition was observed in the HA-MON@Ce6 plus US groups, which was consistent with the observation that the HA-MON@Ce6 induced the secretion of exogenous H2O2 and maximally decreased tumor hypoxia. It is worth noting that the HA-MSN@Ce6 with US showed a lower tumor inhibition rate than the HA-MONs@Ce6 with US, further confirming the superiority of the MONs on the SDT treatment due to the depletion of GSH. We further explored the mechanism of antitumor effect by performing TUNEL staining of these tumors. As shown in Figure 4D and E, MON@Ce6 plus US induced tumor apoptosis, indicating that the tumor growth delay resulted from SDT-induced apoptosis of breast cancer. The tumors in the MON@Ce6/CAT+ US groups showed higher apoptotic rate than those in MON@Ce6+US, while HA-MON@Ce6/CAT with US induced the most apoptosis, which was consistent with the results of tumor inhibition. These results demonstrated that SDT effect could be enhanced after the HA modification.
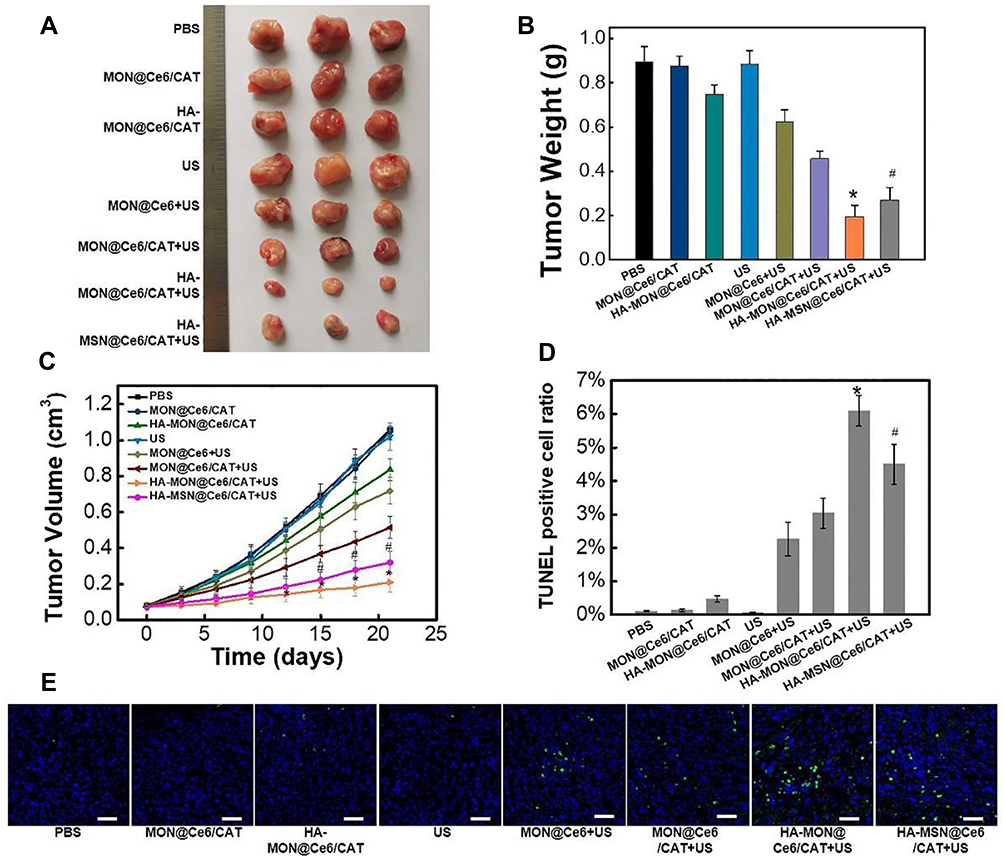 |
Figure 4 Antitumor effect. (A) Tumor images. (B) Tumor weights, (C) tumor growth curves, *p < 0.05 versus MON@Ce6/CAT+US groups; #p < 0.05 versus HA-MON@Ce6/CAT+US group. (D) Tumor apoptotic rate analysis in each treatment groups. All the data represent the mean ± SD, *p < 0.05 versus MON@Ce6/CAT+US groups; #p < 0.05 versus HA-MON@Ce6/CAT+US group (n = 3). (E) Images of the TUNEL fluorescent staining. The blue fluorescence represented the nucleus, and the green fluorescence indicated the location of the apoptotic cells; the scale bars = 50 μm. |
To evaluate the biosafety of HA-MON@Ce6/CAT, the body weight, organ histopathology, and blood chemistry indexes were detected at the end of the treatment. As shown in Figure S11 and Figures 5, 6A–E, body weight, organ histopathology, and blood biochemistry of the treated mice were similar to those of the mice in the control groups, indicating the low systemic toxicity of the HA-MON@Ce6. Considering that CAT, as an exogenous protein, often results in the undesired immunogenicity after intravenous administration, we also verified the immunogenicity of the HA-MON@Ce6. The mice were treated with the free CAT and the HA-MON@Ce6, and then the titer of catalase-specific antibody in the blood of mice measured. As expected, free CAT induced a high titer of the catalase-specific antibody. Notably, the titer of CAT-specific IgG in the HA-MON@Ce6-treated groups was remarkably decreased (Figure 6F). The reduced immunogenicity of the HA-MON@Ce6 would benefit future applications upon systemic administration.
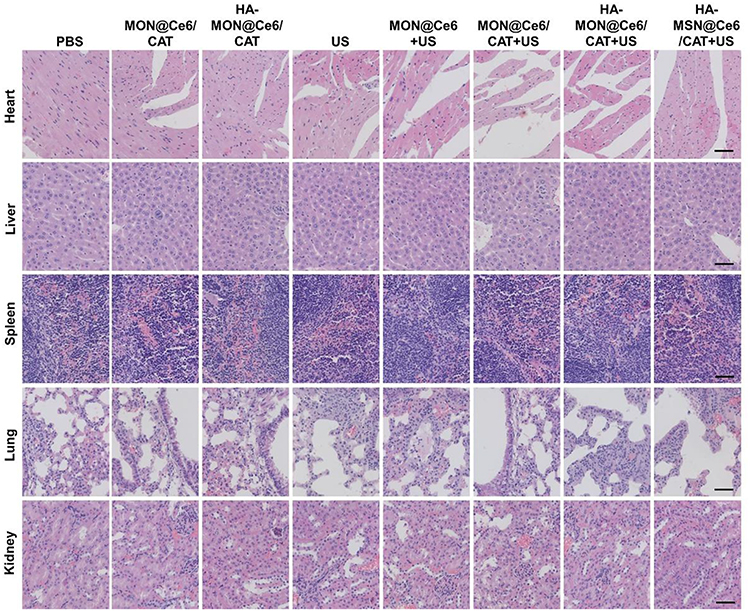 |
Figure 5 Haematoxylin and eosin (HE) staining images of the major organs including heart, liver, spleen, lung and kidney in the different treated 4T1 tumor-bearing mice, Scale bar = 50 μm. |
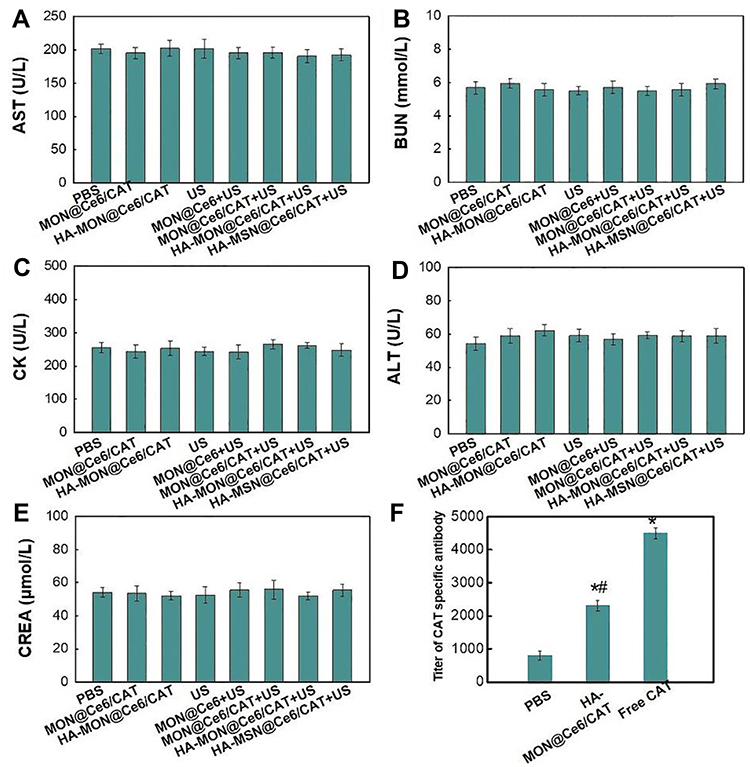 |
Figure 6 Analysis of biochemical indicators and immunogenicity. (A) aspartate aminotransferase (AST), (B) blood urea nitrogen (BUN), (C) phosphocreatine kinase (CK), (D) alanine aminotransferase (ALT), (E) creatinine (CRE) levels and (F) the titer of catalase-specific antibody in each treated mouse, *p < 0.05 versus PBS groups; #p < 0.05 versus Free CAT group. |
Conclusion
In summary, we designed disulfide-bridged mesoporous nanoparticles with Ce6/CAT loading and HA modification as a multifunctional nanoplatform to modulate the tumor microenvironment for highly efficient SDT. The HA-MONs@Ce6/CAT showed GSH-responsive degradability due to the existence of disulfide bonds in its framework, and it not only diminished intracellular GSH to decrease the loss of ROS but also achieved the tumor microenvironment-responsive responsive Ce6/CAT release. Additionally, the modification of HA enabled our nanoplatform to polarize M2-type TAMs to M1-type macrophages, which induced the generation of exogenous H2O2. Due to the protection of the enzyme by the nanoplatform, the CAT within the HA-MON@Ce6/CAT maintained the stability and enzymatic activity, thus efficiently catalyzing endogenous H2O2 in the tumor tissue to generate O2, which greatly attenuated tumor hypoxia. Therefore, an excellent SDT effect was achieved by our HA-MON@Ce6/CAT. More importantly, HA-MONs@Ce6/CAT exhibited a low systemic toxicity, and its immunogenicity was reduced compared with that of free CAT. Our nanoplatform, which could modulate the tumor microenvironment, provides a promising strategy for highly efficient and safe SDT in cancer treatments.
Acknowledgments
The study was supported by the Harbin Medical University Innovation Scientific Fund (Grant No. 2018-KYYWF-0496).
Disclosure
The authors report no conflicts of interest in this work.
References
1. Kuroki M, Hachimine K, Abe H, et al. Sonodynamic therapy of cancer using novel sonosensitizers. Anticancer Res. 2007;27:3673–3677.
2. Qian X, Zheng Y, Chen Y. Micro/Nanoparticle-Augmented Sonodynamic Therapy (SDT): breaking the Depth Shallow of Photoactivation. Adv Mater. 2016;28(37):8097–8129.
3. Shen S, Wu L, Liu J, et al. Core–shell structured Fe3O4@TiO2-doxorubicin nanoparticles for targeted chemo-sonodynamic therapy of cancer. Int J Pharm. 2015;486(486):380–388. doi:10.1016/j.ijpharm.2015.03.070
4. Jing X, Zhi Z, Jin L, et al. pH/redox dual-stimuli-responsive cross-linked polyphosphazene nanoparticles for multimodal imaging-guided chemo-photodynamic therapy. Nanoscale. 2019;11(19):9457–9467. doi:10.1039/C9NR01194C
5. Zhu P, Chen Y, Shi J. Nanoenzyme-augmented cancer sonodynamic therapy by catalytic tumor oxygenation. ACS Nano. 2018;12(4):3780–3795. doi:10.1021/acsnano.8b00999
6. Li C, Yang X, An J, et al. Red blood cell membrane-enveloped O2 self-supplementing biomimetic nanoparticles for tumor imaging-guided enhanced sonodynamic therapy. Theranostics. 2020;10(2):867–879. doi:10.7150/thno.37930
7. Ming L, Cheng K, Chen Y, Yang R, Chen D. Enhancement of tumor lethality of ROS in photodynamic therapy. Cancer Med. 2020. doi:10.1002/cam4.3592
8. Wang Z, Zhang Y, Ju E, et al. Biomimetic nanoflowers by self-assembly of nanozymes to induce intracellular oxidative damage against hypoxic tumors. Nat Commun. 2018;9(1):1–4.
9. Fu J, Li T, Zhu Y, Hao Y. Ultrasound‐activated oxygen and ROS generation nanosystem systematically modulates tumor microenvironment and sensitizes sonodynamic therapy for hypoxic solid tumors. Adv Funct Mater. 2019;29(51):1906195. doi:10.1002/adfm.201906195
10. Chen J, Luo H, Liu Y, et al. Oxygen-self-produced nanoplatform for relieving hypoxia and breaking resistance to sonodynamic treatment of pancreatic cancer. ACS Nano. 2017;11(12):12849–12862. doi:10.1021/acsnano.7b08225
11. Wang Z, Zhang F, Shao D, et al. Janus nanobullets combine photodynamic therapy and magnetic hyperthermia to potentiate synergetic anti-metastatic immunotherapy. Adv Sci. 2019;6(22):1901690.
12. Rong Y, Durden DL, Van Meir EG, Brat DJ. ‘Pseudopalisading’ necrosis in glioblastoma: a familiar morphologic feature that links vascular pathology, hypoxia, and angiogenesis. J Neuropathol Exp Neurol. 2006;65(6):529–539. doi:10.1097/00005072-200606000-00001
13. Wang Z, Chang Z, Shao D, et al. Janus gold triangle-mesoporous silica nanoplatforms for hypoxia-activated radio-chemo-photothermal therapy of liver cancer. ACS Appl Mater Interfaces. 2019;11(38):34755–34765. doi:10.1021/acsami.9b12879
14. Lin T, Zhao X, Zhao S, et al. O2-generating MnO2 nanoparticles for enhanced photodynamic therapy of bladder cancer by ameliorating hypoxia. Theranostics. 2018;8(4):990–1004. doi:10.7150/thno.22465
15. Zannella VE, Dal Pra A, Muaddi H, et al. Reprogramming metabolism with metformin improves tumor oxygenation and radiotherapy response. Clin Cancer Res. 2013;19(24):6741–6750. doi:10.1158/1078-0432.CCR-13-1787
16. Wang P, Li X, Yao C, et al. Orthogonal near-infrared upconversion co-regulated site-specific O2 delivery and photodynamic therapy for hypoxia tumor by using red blood cell microcarriers. Biomaterials. 2017;125:90–100. doi:10.1016/j.biomaterials.2017.02.017
17. Liu J, Chen Q, Zhu W, et al. Nanoscale-coordination-polymer-shelled manganese dioxide composite nanoparticles: a multistage Redox/pH/H2O2-responsive cancer theranostic nanoplatform. Adv Funct Mater. 2017;27(10):1605926.
18. Chen Q, Chen J, Liang C, et al. Drug-induced co-assembly of albumin/catalase as smart nano-theranostics for deep intra-tumoral penetration, hypoxia relieve, and synergistic combination therapy. J Controlled Release. 2017;263:79–89. doi:10.1016/j.jconrel.2016.11.006
19. Wang H, Chao Y, Liu J, et al. Photosensitizer-crosslinked in-situ polymerization on catalase for tumor hypoxia modulation & enhanced photodynamic therapy. Biomaterials. 2018;181:310–317. doi:10.1016/j.biomaterials.2018.08.011
20. Hao H, Sun M, Li P, Sun J, Liu X, Gao W. In situ growth of a cationic polymer from the N-Terminus of Glucose Oxidase To Regulate H2O2 generation for cancer starvation and H2O2 therapy. ACS Appl Mater Interfaces. 2019;11(10):9756–9762. doi:10.1021/acsami.8b20956
21. Liu C, Wang D, Zhang S, et al. Biodegradable Biomimic Copper/Manganese Silicate Nanospheres for Chemodynamic/Photodynamic Synergistic Therapy with Simultaneous Glutathione Depletion and Hypoxia Relief. ACS Nano. 2019;13(4):4267–4277. doi:10.1021/acsnano.8b09387
22. Zhu J, Chu C, Li D, et al. Fe(III)‐Porphyrin Sonotheranostics: a Green Triple‐Regulated ROS generation nanoplatform for enhanced cancer imaging and therapy. Adv Funct Mater. 2019;29(36):1904056. doi:10.1002/adfm.201904056
23. Zhong X, Wang X, Cheng L, et al. GSH‐Depleted PtCu3 Nanocages for chemodynamic‐ enhanced sonodynamic cancer therapy. Adv Funct Mater. 2020;30(4):1907954. doi:10.1002/adfm.201907954
24. Hao N, Lu M, Fan Y, Cao Y, Zhang Z, Yang S. Macrophages in tumor microenvironments and the progression of tumors. Clin Dev Immunol. 2012;2012(2012):948098. doi:10.1155/2012/948098
25. Zanganeh S, Hutter G, Spitler R, et al. Iron oxide nanoparticles inhibit tumour growth by inducing pro-inflammatory macrophage polarization in tumour tissues. Nat Nanotechnol. 2016;11(11):986–994. doi:10.1038/nnano.2016.168
26. Chanmee T, Ontong P, Konno K, Itano N. Tumor-associated macrophages as major players in the tumor microenvironment. Cancers. 2014;6(3):1670–1690. doi:10.3390/cancers6031670
27. Solinas G, Germano G, Mantovani A, Allavena P. Tumor-associated macrophages (TAM) as major players of the cancer-related inflammation. J Leukoc Biol. 2009;86(5):1065–1073. doi:10.1189/jlb.0609385
28. Binnewies M, Roberts EW, Kersten K, et al. Understanding the tumor immune microenvironment (TIME) for effective therapy. Nat Med. 2018;24(5):541–550. doi:10.1038/s41591-018-0014-x
29. Jeong H, Kim S, Hong B, et al. Tumor-associated macrophages enhance tumor hypoxia and aerobic glycolysis. Cancer Res. 2019;79(4):795–806. doi:10.1158/0008-5472.CAN-18-2545
30. Ai X, Hu M, Wang Z, et al. Enhanced cellular ablation by attenuating hypoxia status and reprogramming tumor-associated macrophages via NIR light-responsive upconversion nanocrystals. Bioconjug Chem. 2018;29(4):928. doi:10.1021/acs.bioconjchem.8b00068
31. Werno C, Menrad H, Weigert A, et al. Knockout of HIF-1α in tumor-associated macrophages enhances M2 polarization and attenuates their pro-angiogenic responses. Carcinogenesis. 2010;31(10):1863–1872. doi:10.1093/carcin/bgq088
32. Yamaguchi T, Fushida S, Yamamoto Y, et al. Tumor-associated macrophages of the M2 phenotype contribute to progression in gastric cancer with peritoneal dissemination. Gastric Cancer. 2016;19(4):1052–1065. doi:10.1007/s10120-015-0579-8
33. Rayahin JE, Buhrman JS, Zhang Y, Koh TJ, Gemeinhart RA. High and low molecular weight hyaluronic acid differentially influence macrophage activation. ACS Biomater Sci Eng. 2015;1(7):481–493. doi:10.1021/acsbiomaterials.5b00181
34. Lyle DB, Breger JC, Baeva LF, et al. Low molecular weight hyaluronic acid effects on murine macrophage nitric oxide production. J Biomed Mater Res A. 2010;94A(3):893–904.
35. Scheibner KA, Lutz MA, Boodoo S, Fenton MJ, Powell JD, Horton MR. Hyaluronan fragments act as an endogenous danger signal by engaging TLR2. J Immunol. 2006;177(2):1272–1281. doi:10.4049/jimmunol.177.2.1272
36. Song M, Liu T, Shi C, Zhang X, Chen X. Bioconjugated manganese dioxide nanoparticles enhance chemotherapy response by priming tumor-associated Macrophages toward M1-like phenotype and attenuating tumor hypoxia. ACS Nano. 2016;10(3):3872. doi:10.1021/acsnano.6b01206
37. Goth L. A simple method for determination of serum catalase activity and revision of reference range. Clin Chimica Acta. 1991;196(2):143–151. doi:10.1016/0009-8981(91)90067-M
38. Balendiran GK, Dabur R, Fraser D. The role of glutathione in cancer. Cell Biochem Funct. 2004;22(6):343–352. doi:10.1002/cbf.1149
 © 2021 The Author(s). This work is published and licensed by Dove Medical Press Limited. The full terms of this license are available at https://www.dovepress.com/terms.php and incorporate the Creative Commons Attribution - Non Commercial (unported, v3.0) License.
By accessing the work you hereby accept the Terms. Non-commercial uses of the work are permitted without any further permission from Dove Medical Press Limited, provided the work is properly attributed. For permission for commercial use of this work, please see paragraphs 4.2 and 5 of our Terms.
© 2021 The Author(s). This work is published and licensed by Dove Medical Press Limited. The full terms of this license are available at https://www.dovepress.com/terms.php and incorporate the Creative Commons Attribution - Non Commercial (unported, v3.0) License.
By accessing the work you hereby accept the Terms. Non-commercial uses of the work are permitted without any further permission from Dove Medical Press Limited, provided the work is properly attributed. For permission for commercial use of this work, please see paragraphs 4.2 and 5 of our Terms.