")
Back to Journals » International Journal of Nanomedicine » Volume 12
Biocompatibility of very small superparamagnetic iron oxide nanoparticles in murine organotypic hippocampal slice cultures and the role of microglia
Authors Pohland M , Glumm R, Wiekhorst F, Kiwit J, Glumm J
Received 10 November 2016
Accepted for publication 23 December 2016
Published 27 February 2017 Volume 2017:12 Pages 1577—1591
DOI https://doi.org/10.2147/IJN.S127206
Checked for plagiarism Yes
Review by Single anonymous peer review
Peer reviewer comments 2
Editor who approved publication: Dr Thomas Webster
Martin Pohland,1 Robert Glumm,1,2 Frank Wiekhorst,3 Jürgen Kiwit,4 Jana Glumm1,4
1Institute of Cell Biology and Neurobiology, Center for Anatomy, Charité – Universitätsmedizin Berlin, 2Clinic of Neurology, Jüdisches Krankenhaus, 3Department 8.2 Biosignals, Physikalisch-Technische Bundesanstalt, 4Clinic of Neurosurgery, HELIOS Klinikum Berlin Buch, Berlin, Germany
Abstract: Superparamagnetic iron oxide nanoparticles (SPIO) are applied as contrast media for magnetic resonance imaging (MRI) and treatment of neurologic diseases despite the fact that important information concerning their local interactions is still lacking. Due to their small size, SPIO have great potential for magnetically labeling different cell populations, facilitating their MRI tracking in vivo. Before SPIO are applied, however, their effect on cell viability and tissue homoeostasis should be studied thoroughly. We have previously published data showing how citrate-coated very small superparamagnetic iron oxide particles (VSOP) affect primary microglia and neuron cell cultures as well as neuron-glia cocultures. To extend our knowledge of VSOP interactions on the three-dimensional multicellular level, we further examined the influence of two types of coated VSOP (R1 and R2) on murine organotypic hippocampal slice cultures. Our data show that 1) VSOP can penetrate deep tissue layers, 2) long-term VSOP-R2 treatment alters cell viability within the dentate gyrus, 3) during short-term incubation VSOP-R1 and VSOP-R2 comparably modify hippocampal cell viability, 4) VSOP treatment does not affect cytokine homeostasis, 5) microglial depletion decreases VSOP uptake, and 6) microglial depletion plus VSOP treatment increases hippocampal cell death during short-term incubation. These results are in line with our previous findings in cell coculture experiments regarding microglial protection of neurite branching. Thus, we have not only clarified the interaction between VSOP, slice culture, and microglia to a degree but also demonstrated that our model is a promising approach for screening nanoparticles to exclude potential cytotoxic effects.
Keywords: VSOP, SPIO, hippocampus, organotypic, viability
Introduction
Contrast agents, such as superparamagnetic iron oxide nanoparticles (SPIO), are essential tools for diagnostic imaging in medicine. SPIO are suitable for magnetic resonance imaging (MRI) and are classified according to their size and structure into defined groups. They possess an iron oxide core of 5–8 nm and are stabilized with dextran or carboxydextran to an overall diameter of 50–120 nm.1 Using monomeric coating materials, it was possible to develop small monomer-coated SPIO. One very promising subgroup is citrate-coated very small superparamagnetic iron oxide particles (VSOP), which have a diameter of 7–10 nm.2
VSOP facilitate the binding of antigens or antibodies on their surface.3–6 Nonetheless, even after such modifications, VSOP are still small enough for extravasation between capillary fenestrae and endothelial gaps.7 In addition, VSOP can reliably mark specific cells and assist in their subsequent detection in in vivo migration.8–10 It was thus possible to monitor implanted VSOP-labeled neuronal progenitors over 6 weeks in addition to different kinds of immune competent cells.11,12 For that purpose, neutrophil granule cells and T cells were tagged with nanoparticles ex vivo, intravenously injected, and traced via MRI at inflammatory sites.13–15
Although VSOP have been tested in clinical phase II trials, further assessment of cytotoxic effects is crucial.16,17 SPIO can release free iron ions while degrading, subsequently altering cell cycle iron metabolism and potentially leading to an iron-catalyzed generation of reactive oxygen species, which increases mitochondrial dysfunction.18,19
So far, the cytotoxic effects of SPIO have been controversially discussed in the literature. Most publications have found no cytotoxic effects of SPIO on human mesenchymal stem cells, murine embryonic stem cells, or neuronal stem cells.11,20–25 In contrast, Soenen et al showed that high intracellular concentrations of SPIO limited the proliferation capacity of murine fibroblasts and neural progenitor cells via impaired actin-mediated signaling of cytoskeletal changes.26,27
Previously, we published data on the promotion of neurite outgrowth using a high concentration of VSOP-R2 in neuron-glia cocultures in contrast to the degeneration of neurons after VSOP exposure in neuronal cell cultures.28 After obtaining this significant information on VSOP interaction using primary cell cultures and primary cell cocultures, we analyzed the particle and cell type-induced effects caused by VSOP treatment within a more complex setup of organotypic hippocampal slice culture (OHSC).
These tissue explants are widely used as a simplified, advantageous in vitro system for studying regeneration and neurodegeneration.29 The neuronal organization of OHSC is simple compared to the neocortex, and the main cell types (eg, granular and pyramidal cells) are easily distinguishable. After explantation, the hippocampal region develops nearly as in vivo, offering the possibility of analyzing neurogenesis, neuronal layering, neuronal specificity, synaptic formation, and neuronal circuits.30 In addition, OHSC are relatively easy to prepare, simple to cultivate and, compared to a variety of in vivo models, allow reproducible long-term studies of their cellular microenvironment.31 Due to their mostly preserved cytoarchitecture, OHSC help fill the gap between primary cell cultures and animal experiments.
As shown in our previous experiments, nanoparticles are phagocytosed by microglia.28,32 Their stimulus-dependent activation with a transformation from a ramified resting form to an amoeboid cell type usually occurs as a consequence of infection, tissue damage, or neurodegenerative disease.33 Chronically activated microglia can harm the surrounding cell population even up to apoptosis and can be detected after long-term nanoparticle exposure.34,35 In such cases, neurotoxic effects are initialized due to microglial secretion of pro-inflammatory and cytotoxic molecules.36–38 However, their trigger-linked activation can also develop into a neuroprotective pathway, which includes the release of neurotropic and anti-inflammatory molecules.39 In any event, the morphology of microglia in combination with neuronal death or survival can give hints as to the interaction of neurons and microglia.
Here, we describe the influence of VSOP (hydrodynamic diameter of 6.1–8.7 nm) on the viability, cytokine secretion, and iron uptake of OHSC. For this purpose, hippocampal slices were short-term or long-term incubated with different nanoparticle concentrations in the presence or absence of internal microglia.
We confirmed VSOP penetration in deep tissue layers and proved a time, but not VSOP-R1-dependent increase in cell death during long-term incubation. Additionally, long-term VSOP-R2 treatment altered neuronal viability exclusively within the hippocampal dentate gyrus (DG) after longer incubation at 19 days in vitro (DIV). Microglia depletion plus VSOP treatment significantly increased cell death throughout the slices during short-term incubation, whereas VSOP-R2 treatment alone only altered the cornu ammonis (CA) 3 region. We were also able to preclude VSOP-R1 and VSOP-R2 from affecting the cytokine homeostasis in our experimental setup by applying a multiple analyte immunoassay. In addition, using magnetic particle spectroscopy (MPS) for iron quantification, we could prove that microglia depletion decreases VSOP accumulation within the tissue. By applying Prussian blue (PB) iron staining and microglia immunofluorescence labeling to VSOP-treated slices, we confirmed nanoparticle phagocytosis by amoeboid-shaped microglia.
Thus, not only is our OHSC technique a useful reproducible approach to screening nanoparticles that potentially alter neuronal viability, but we were also able to uncover the interaction between VSOP, slice cultures, and microglia in detail.
Methods
Animals
Animals were raised and supplied by the Forschungseinrichtung für Experimentelle Medizin of the Charité-Universitätsmedizin Berlin, Germany. All experimental procedures were carried out in accordance with the German Animal Welfare Act and European guidelines (2010/63/EU) for the use of laboratory animals and were approved by the local regulatory authority of Berlin (Landesamt für Gesundheit und Soziales [LaGeSo]; registration number T0095/11). All measures were taken to minimize the degree of suffering and the number of animals sacrificed. Postnatal (P0–P3) C57 B6/J mice of up to 3 days old were used for all experiments.
Nanoparticles
VSOP were produced and provided by the Charité Institute of Radiology. We applied two different citrate-coated VSOP consisted of monocrystalline iron oxide cores of magnetite (Fe3O4) and maghemite (γ-Fe2O3), which have been previously described in detail.28 VSOP-R1 have a Z-average of 30.44 nm (standard deviation [SD] =2.09) measured by dynamic light scattering, a polydispersity index of 0.739, a hydrodynamic diameter of 6.1 nm with 75% of particles within 4.1–7.5 nm, an iron content of 26.4 g/L (0.473 M) as well as a relaxivity (0.94 Tesla) of R1=18.3 and R2=41.9. VSOP-R2 have a Z-average of 36.33 nm (SD =0.9), a polydispersity index of 0.470, a hydrodynamic diameter of 8.7 nm with 75% of particles within 6.5–10.10 nm, an iron content of 27.2 g/L (0.487 M) as well as a relaxivity (0.94 Tesla) of R1=18.9 and R2=56.1. VSOP-R1 were applied in concentrations of 0.5 mM =27.91 mg/L, 1.0 mM =55.82 mg/L, 2.0 mM =111.64 mg/L, and 3.0 mM =167.46 mg/L. VSOP-R2 were applied in concentrations of 0.5 mM =27.93 mg/L, 1.0 mM =55.86 mg/L, 2.0 mM =111.72 mg/L, and 3.0 mM =167.58 mg/L, respectively.
OHSC preparation and incubation
Hippocampal slice cultures with a thickness of 350 nm were prepared from P0 to P3 C57 B6/J mice as described before.31,40 Up to six OHSC were cultivated on a single membrane (Millicell-CM, EMD Millipore, Billerica, MA, USA) in a six-well plate at 37°C in humidified 5% CO2-enriched atmosphere. Each well was filled with 1.2 mL incubation medium that was changed after 1 DIV and every second day thereafter.
SPIO treatment
VSOP short-term incubation: after 7 days of equilibration post preparation (7 DIV) and two more days with or without microglia depletion, VSOP-R1 and VSOP-R2 were added to the medium at a concentration of 3.0 mM from 9 DIV until 11 DIV.
VSOP long-term incubation: VSOP-R1 and VSOP-R2 were added to the co-culture incubation medium after 7 days of equilibration post preparation. From 7 DIV and in any replacement of medium until 19 DIV, concentrations of 0 mM (negative control), 0.5, 1.0, 2.0, and 3.0 mM VSOP-R1 and VSOP-R2 were applied.
Microglia depletion, lipopolysaccharide (LPS) stimulation, and glutamic acid-induced excitotoxicity
VSOP short-term incubation: microglia were depleted using a free dichloromethylenediphosphonic acid disodium salt (DMDP) treatment (Sigma-Aldrich Co., St Louis, MO, USA) for 48 h (7–9 DIV) at a concentration of 0.5 mg/mL. Cytokine secretion was induced using LPS Escherichia coli endotoxin application (Enzo Life Sciences, Inc., Farmingdale, NY, USA) at a concentration of 0.1 μg/mL. Neuronal excitotoxicity was induced by glutamic acid treatment (Sigma-Aldrich) at a concentration of 10 mM. LPS and glutamate stimulation were performed for 48 h (9–11 DIV). VSOP long-term incubation: glutamate treatment (10 mM) was applied from 7 DIV and in any replacement of medium until 12 DIV.
Immunofluorescence staining
OHSC were fixed and permabilized as described before.41 Briefly, nonspecific binding caused by hydrophobic interactions of the secondary goat anti-mouse antibodies with endogenous mouse IgG or other cells was blocked for 30 min using 1% Triton X-100, 1% bovine serum albumin (both from Carl Roth, Karlsruhe, Germany) and 5% normal goat serum (Vector Laboratories, Burlingame, CA, USA) diluted in 0.1 M phosphate-buffered saline (PBS). Afterward OHSC were washed three times for 20 min each in 0.1 M PBS. For every preparation an immunofluorescence staining overnight at 4°C was performed using the following primary antibodies: rabbit anti-mouse neuronal nuclear antigen (NeuN, 1:750, Millipore) and mouse anti-mouse Calbindin D-28k (1:750) or mouse anti-mouse Calretinin (1:750, both from Swant, Marly, Switzerland). To verify intact OHSC cytoarchitecture after microglia depletion, immunofluorescent staining was performed as described before using the additional primary antibodies rabbit anti-mouse ionized calcium binding adapter molecule 1 (Iba1, 1:500, Wako Chemical, Richmond, VA, USA) and mouse anti-mouse glial fibrillary acidic protein (GFAP, 1:1,000, Sigma-Aldrich). Subsequently, sections were washed three times for 10 min with 0.1 M PBS and stained with fluorescent-conjugated secondary antibodies for 4 h at room temperature on a shaker. The following secondary antibodies were used: goat anti-mouse Alexa Fluor 488 (1:500) and goat anti-rabbit Alexa Fluor 568 (1:500, both from Thermo Fisher Scientific, Waltham, MA, USA). After three washes for 10 min with 0.1 M PBS, the slices were immersed for 5 min in DRAQ5 (1:5,000, eBioscience, San Diego, CA, USA) diluted in 0.1 M PBS for nuclei staining. Following three rinsing steps for 10 min each in 0.1 M PBS, the slices were embedded in Immu-Mount (Thermo Fisher Scientific) and coverslipped.
Hematoxylin and eosin (H&E) and PB iron staining of resliced OHSC
After 11 DIV, VSOP short-term incubation samples were fixed with 4% paraformaldehyde as described before. Subsequently, slices were embedded in 4% agarose (Carl Roth) and resliced in 30 μm sections in 0.1 M PBS at 4°C using a HM650V vibratome equipped with a CU65 cooling device, a cooling element for buffer solution (all from Thermo Fisher Scientific), and a KL200 light source (Schott AG, Mainz, Germany). Afterward, hippocampal cytoarchitecture was visualized by a H&E procedure, and SPIO were traced by PB staining as described before.42,43 Resliced OHSC were embedded using Immu-Mount and coverslipped.
Confocal, bright field, and fluorescence microscopy
Confocal microscopy was performed using a Leica TCS SL microscope (Leica Microsystems, Mannheim, Germany) equipped with argon and helium-neon lasers with excitation wavelengths of 488, 543, and 633 nm, respectively. Bright field and immunofluorescence images were photographed using an Olympus BX 51 microscope with narrow band filters (Olympus Corporation, Tokyo, Japan) equipped with a Magnafire digital camera and Magnafire 2.1B software (Intas, Göttingen, Germany). Background correction and adjustment of brightness and contrast were performed using Leica LCS confocal software and ImageJ.
OHSC viability assay
Slice viability was analyzed using propidium iodide (PI, Carl Roth). PI was applied to the culture medium at a concentration of 5 μg/mL. Slices were incubated for 15 min at 37°C in a humidified 5% CO2-enriched atmosphere, followed by a 5 min washing step using fresh preheated culture medium. Thereafter, medium was changed, and long shots of unfixed slices were taken using an inverse Olympus IX 81 microscope equipped with a 1.25 object lens, a 1.6 Bertrand lens, an F-View II digital camera, and cellSens Dimension software (all from Olympus). Identical exposure time and instrument settings were used for PI measurements for all sections. Afterward, slices were incubated until the end of the test as described before. Data collection was carried out using cellSens Dimension software.
VSOP short-term incubation: in total, 106 OHSC were analyzed from one experimental setup (12 OHSC for untreated control, 17 OHSC for DMDP, 18 OHSC for 3.0 mM VSOP-R1, 18 OHSC for 3.0 mM VSOP-R1 + DMDP, 17 OHSC for 3.0 mM VSOP-R2, 18 OHSC for 3.0 mM VSOP-R2 + DMDP, 6 OHSC for glutamate). Using cellSens Dimension software, regions of interest were defined separately for DG, CA1, and CA3 for each slice. Statistical analysis was performed with GraphPad Prism software (GraphPad Software, La Jolla, CA, USA) using two-way analysis of variance (ANOVA) with Dunnett and Sidak as post hoc tests. Data are presented as mean ± SD. *P<0.05, **P<0.01, and ***P<0.001 were considered significant.
VSOP long-term incubation: for VSOP-R1 treatment, a total of 40 OHSC were analyzed from one experimental setup (8 OHSC for untreated control, 9 OHSC for 0.5 mM, 9 OHSC for 1.0 mM, 7 OHSC for 2.0 mM, 7 OHSC for 3.0 mM). For VSOP-R2 treatment, a total of 34 OHSC were analyzed from one experimental setup (7 OHSC for untreated control, 7 OHSC for 0.5 mM, 7 OHSC for 1.0 mM, 6 OHSC for 2.0 mM, 6 OHSC for 3.0 mM). Using cellSens Dimension software, regions of interest were defined separately for DG and CA3 for each slice. Statistical analysis was performed with GraphPad Prism software using two-way ANOVA and Bonferroni post hoc tests. Data are presented as mean ± SD. *P<0.05, **P<0.01, and ***P<0.001 were considered significant.
Cytokine and chemokine evaluation
OHSC supernatants were collected at 11 DIV. The amount of C-X-C motif chemokine (CXCL1)/KC, granulocyte-macrophage colony-stimulating factor (GM-CSF), interleukin (IL)-1α, IL-1β, IL-2, IL-4, IL-5, IL-6, IL-10, IL-12p70, IL-17, IL-18, interferon (IFN-γ), monocyte chemoattractant protein (MCP)-1, and tumor necrosis factor (TNF)-α in OHSC supernatants was determined with a bead-based FlowCytomix multiple analyte immunoassay according to the manufacturer’s instructions (eBioscience). Supernatant analysis was performed using a FACSCanto II flow cytometer equipped with FACSDiva software (both from BD Bioscience) and Flowcytomix software (eBioscience). Statistical analysis was performed with GraphPad Prism software using one-way ANOVA and Tukey test. In total, 32 supernatants obtained from 192 OHSC (six slices per well) were analyzed from two different experimental setups. Measurements were performed using double determinations of every specimen (24 OHSC for untreated control, 24 OHSC for DMDP, 24 OHSC for LPS, 24 OHSC for DMDP + LPS, 24 OHSC for 3.0 mM VSOP-R1, 24 OHSC for 3.0 mM VSOP-R1 + DMDP; 24 OHSC for 3.0 mM VSOP-R2, 24 OHSC for 3.0 mM VSOP-R2 + DMDP). Data are presented as mean ± SD. *P<0.05, **P<0.01, and ***P<0.001 were considered significant.
MPS for iron quantification
At 11 DIV, OHSC were removed without fixation from the Millipore-CM membrane using a cell scraper. Subsequently, slices were washed with 0.1 M PBS and transferred into a polymerase chain reaction (PCR) tube. In total, 150 OHSC were analyzed from one experimental setup (30 OHSC for untreated control, 30 OHSC for 3.0 mM VSOP-R1, 30 OHSC for 3.0 mM VSOP-R1 + DMDP, 30 OHSC for 3.0 mM VSOP-R2, 30 OHSC for 3.0 mM VSOP-R2 + DMDP). Six OHSC of each group were placed in each PCR tube for a single measurement. MPS measurements were performed as described before.44
Statistical analysis was performed with GraphPad Prism software using one-way ANOVA and Tukey post hoc test. Data are presented as mean ± SD. *P<0.05, **P<0.01, and ***P<0.001 were considered significant.
Results
OHSC cytoarchitecture is maintained during incubation
After 11 or 19 DIV, hippocampal cytoarchitecture was visualized by immunofluorescence labeling to ensure preserved cellular tissue organization and a valid cutting angle (Figure 1A–H). Using Calbindin, Calretinin, DRAQ5, and NeuN staining, we clearly distinguished the CA1 from the CA3 and DG regions and assured a maintained hippocampal cytoarchitecture.
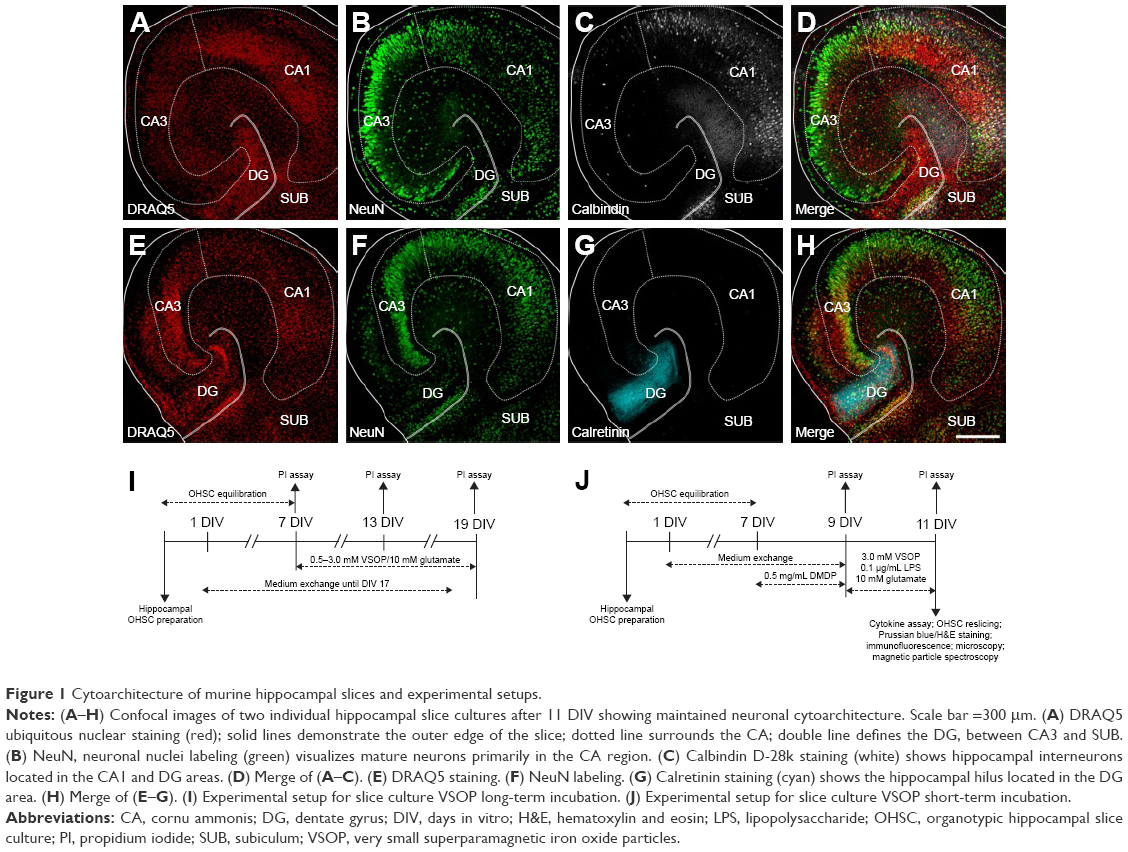 | Figure 1 Cytoarchitecture of murine hippocampal slices and experimental setups. |
VSOP long-term incubation: OHSC viability decreases equally in a time-dependent manner
VSOP-R2 treatment increases cell death within the DG region between 13 DIV and 19 DIV. The influence of VSOP-R1 and VSOP-R2 on murine OHSC viability was tested after 7 days of equilibration post preparation. For this purpose, different SPIO concentrations (0.5–3.0 mM) were used over a 12-day incubation period. PI assay was continuously performed at 7 DIV, 13 DIV, and 19 DIV in order to visualize dying or dead cells that have lost their membrane integrity within the hippocampal CA1 and DG regions. Representative images of OHSC treated with VSOP-R1 are shown in Figure 2A–H and in Figure 2K–R for VSOP-R2. Hippocampal slices without VSOP incubation served as negative controls (Figure 2I and J); 10 mM glutamate treatment to induce cell death served as positive control (Figure 2S and T). Due to glutamate excitotoxicity, we could only analyze these slices until 12 DIV because treated slices detached from the membrane.
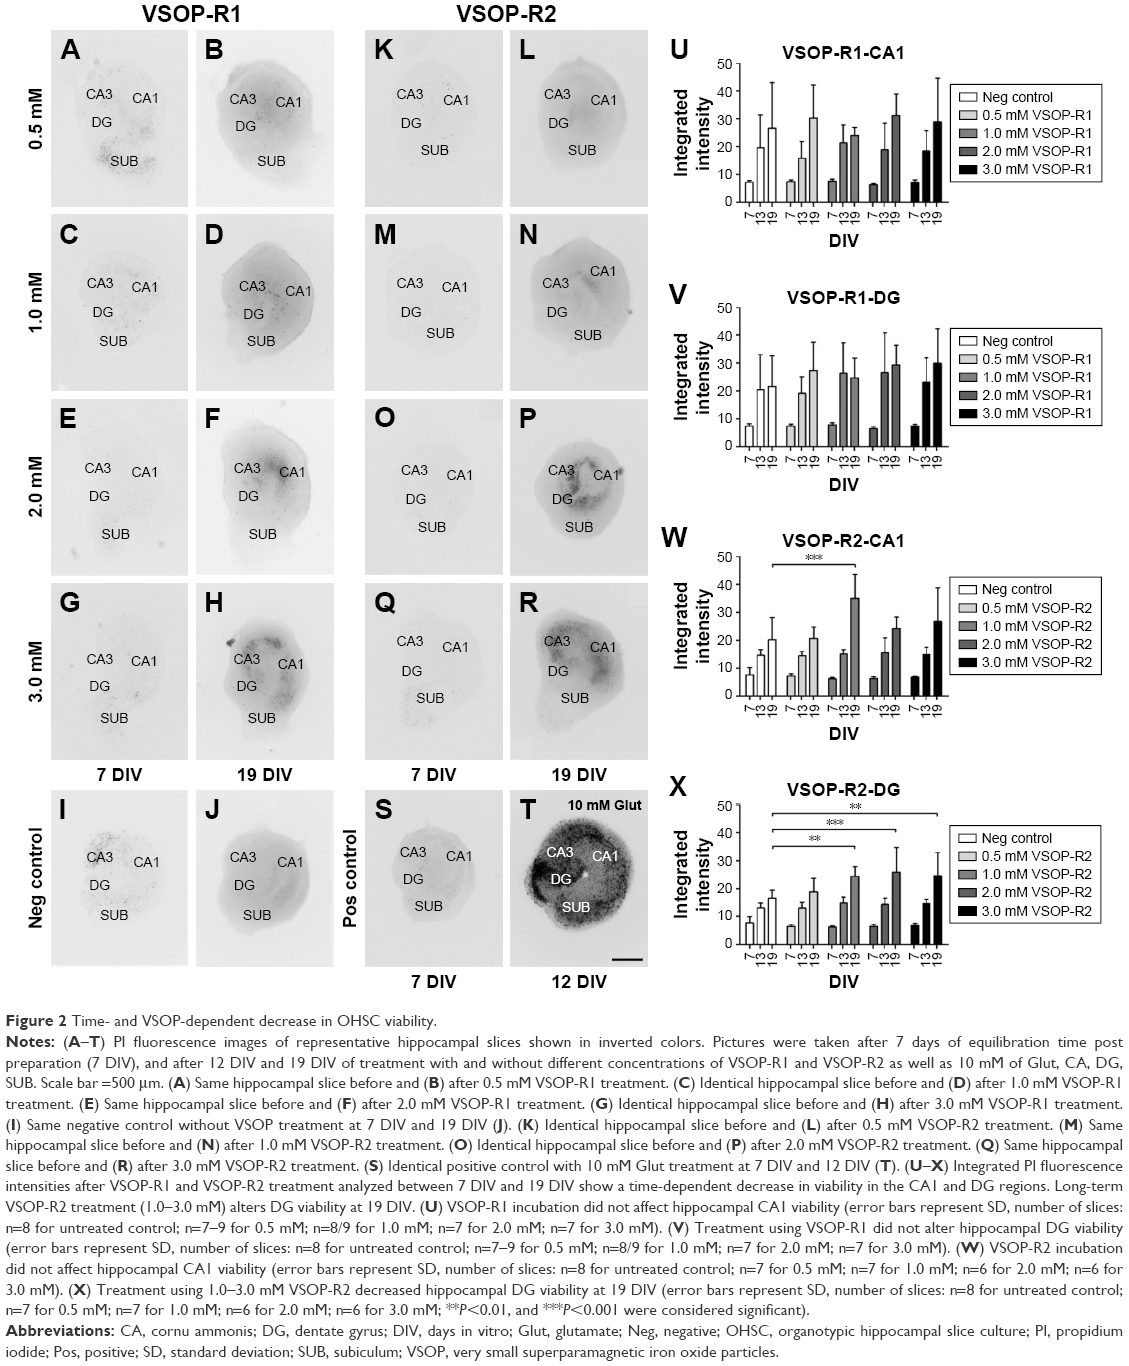 | Figure 2 Time- and VSOP-dependent decrease in OHSC viability. |
Statistical analysis representing the integrated PI fluorescence intensities of the CA1 and DG regions in terms of VSOP treatment are shown in Figure 2U–X. On the one hand, we found an overall decrease in OHSC viability in a time-dependent manner, whereas an equal degree of cell death was already detectable at 7 DIV in all groups. During OHSC incubation, DG and CA1 integrated PI fluorescence intensity roughly doubled in the negative control as well as in VSOP-treated specimens between 7 DIV and 13 DIV. Until 19 DIV, this was followed by an additional reduction of viability within the regions of interest. We found no statistical differences between the control groups and VSOP-R1 treatment either in CA1 (Figure 2U) nor in DG (Figure 2V). Notwithstanding this, it has to be noted that there is an apparent tendency for VSOP-R1 to affect DG neurons. Apart from 1.0 mM VSOP-R2 treatment (Figure 2W), no obvious correlation between increasing concentration and cell death was visible in CA1. In contrast, VSOP-R2 significantly increased cell death within the DG region (Figure 2X) exclusively at 19 DIV in concentrations of 1.0–3.0 mM.
VSOP penetrate deeper layers of OHSC
Hippocampal slices were short-term treated using 3.0 mM VSOP-R1 and VSOP-R2. After 9 days of equilibration post preparation, OHSC were exposed to VSOP until 11 DIV. We used H&E and PB staining to visualize tissue cytoarchitecture and iron deposits, respectively, and confirmed the absence of iron or VSOP in the untreated control (Figure 3A). We proved the presence of iron or VSOP in OHSC treated with VSOP-R1 (Figure 3B) and VSOP-R2 (data not shown). Subsequently, VSOP-treated OHSC were resliced into sections with a thickness of 30 μm each (schematic drawing in Figure 3C). On the one hand, we could confirm cellular VSOP accumulation in successive sections of individual OHSC (Figure 3D–L) and proved VSOP penetration of up to 150 μm deep (section 5 in Figure 3J–L). On the other hand, we found a decline in the quantity of PB-labeled cells with increasing section distance to the membrane. In addition, VSOP-containing cells primarily showed an amoeboid-like shape (Figure 3F), indicating microglial nanoparticle phagocytosis.
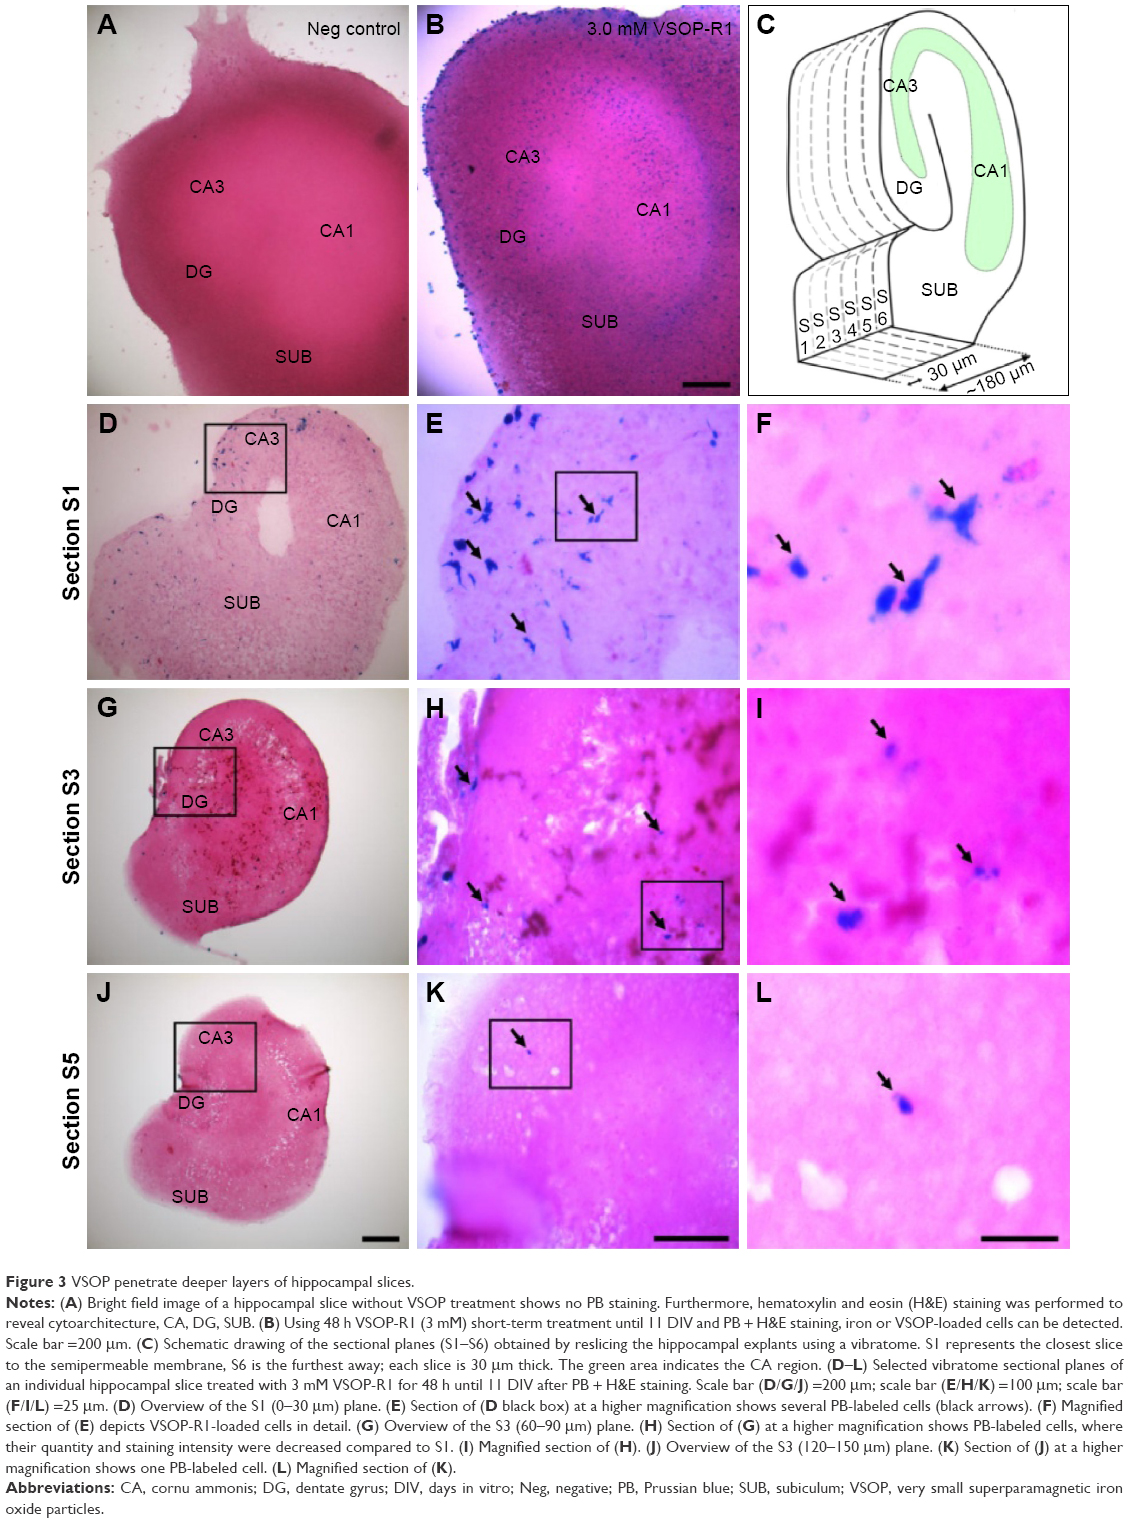 | Figure 3 VSOP penetrate deeper layers of hippocampal slices. |
DMDP treatment decreased the amount of microglia and altered OHSC viability
Compared to controls (Figure 4A), we found an ~90% decrease in the amount of microglia in DMDP-incubated specimens (Figure 4B), whereas astroglia was not affected (Figure 4C and D). Using a PI viability assay, we found that microglia depletion significantly increased cell death of the remaining population (Figure 4O, P, and S–V).
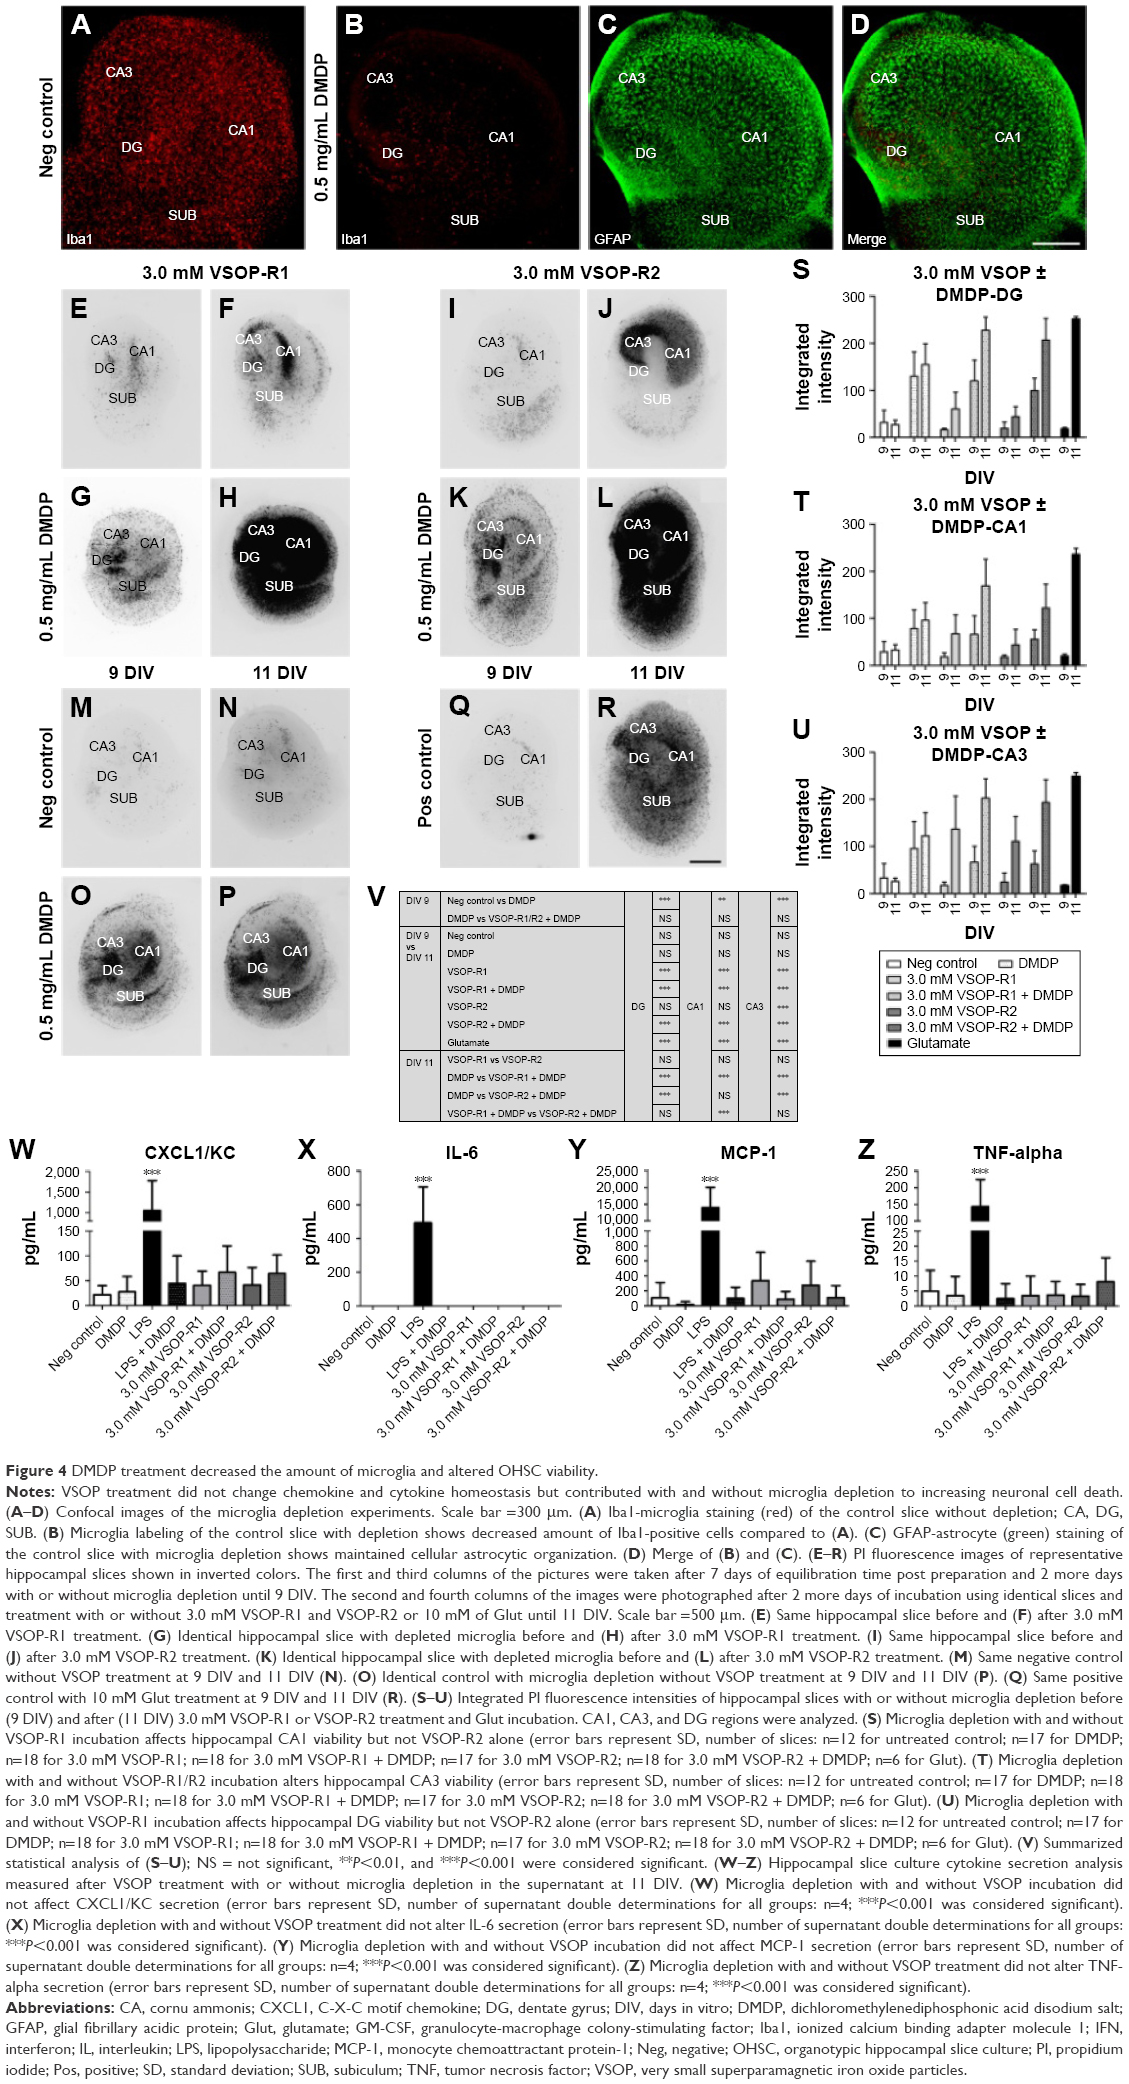 | Figure 4 DMDP treatment decreased the amount of microglia and altered OHSC viability. |
VSOP short-term incubation: high doses of VSOP decreased OHSC viability
Prior microglia depletion increased the impact of VSOP application The influence of high VSOP-R1 and VSOP-R2 doses of 3.0 mM on murine OHSC viability was tested during short-term incubation. PI assay was performed at 9 DIV before VSOP treatment and afterward at 11 DIV. Representative images of OHSC incubated with VSOP-R1 with and without microglia depletion are shown in Figure 4E–L for VSOP-R2. Hippocampal slices without any treatment served as negative controls (Figure 4M and N), 0.5 mg/mL DMDP was used as depletion control (Figure 4O and P), and 10 mM glutamate incubation functioned as positive control (Figure 4Q and R). The fluorescence images clearly show a VSOP-dependent increase in cell death in OHSC, with previous microglia depletion additionally enhancing cytotoxicity (Figure 4E–L). These results are in line with the statistical analysis (two-way ANOVA, Dunnett and Sidak tests), representing the integrated PI fluorescence intensities of the DG, CA1, and CA3 in terms of VSOP treatment (Figure 4S–V). In all areas, we observed a roughly threefold DMDP-induced decrease in OHSC viability compared to the control. In addition, VSOP-R1 treatment without DMDP altered all regions of interest significantly. In contrast, VSOP-R2 treatment exclusively affected the CA3 region but did not change cell viability in DG and CA1. VSOP and DMDP treatment maximized hippocampal cell death in general.
VSOP treatment did not change cytokine homeostasis
We analyzed cytokine secretion in OHSC supernatants after VSOP short-term incubation at 11 DIV. The release of anti- and pro-inflammatory as well as stimulating factors was investigated. We identified secreted CXCL1/KC, IL-6, MCP-1, and TNF-α utilizing our experimental setup (Figure 4W–Z). Statistical analysis (one-way ANOVA and Tukey test) did not confirm any difference between the negative control and VSOP-treated group. Due to a relatively high SD, the tendency that both VSOP-R1 and VSOP-R2 induced higher levels of MCP-1 in the supernatant has to be noted, even though it is not significant. However, LPS stimulus significantly induced the secretion of CXCL1/KC, IL-6, MCP-1, and TNF-α. In comparison, previous DMDP incubation substantially reduced the endotoxin-caused cytokine release. Neither VSOP nor LPS treatment induced the release of GM-CSF, IL-1α, IL-1β, IL-2, IL-4, IL-5, IL-10, IL-12p70, IL-17, IL-18, or IFN-γ (data not shown).
Microglia depletion decreased VSOP uptake
The OHSC iron content was quantified after nanoparticle short-term incubation at 11 DIV. Statistical analysis of MPS confirmed the uptake of VSOP-R1 and VSOP-R2 and, therefore, significantly increased iron levels (Figure 5). No differences in the amounts of iron were detectable between both groups. However, the DMDP and nanoparticle-treated samples showed a significantly reduced iron uptake compared to exclusively VSOP-incubated OHSC. Because of the high sensitivity of the MPS measurement, a low iron content was detected in the untreated controls (data not shown) and subtracted from the other results. We attributed the general iron basis level to tissue handling and sample processing.
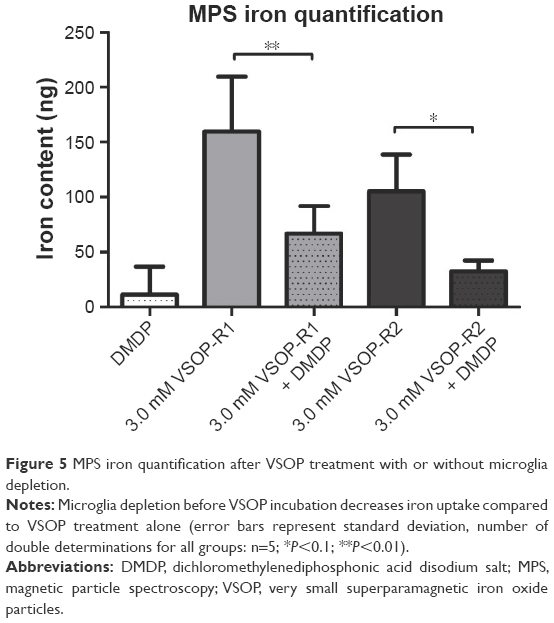 | Figure 5 MPS iron quantification after VSOP treatment with or without microglia depletion. |
Discussion
Before applying SPIO on a large scale in humans, it is important to carefully analyze their interactions concerning cell viability, cytotoxicity, and tissue homoeostasis. So far, VSOP have been tested in vitro and in vivo by means of immortalized or primary cell cultures, animal models, and human probands.2,17,28,44,45 In our view, further studies and assessments using OHSC are imperative. On the one hand, cell culture experiments exclude questions regarding VSOP interactions on the three-dimensional multicellular level. Additionally, cell lines have modified proliferation, an altered intrinsic physiology, and a changed life cycle. On the other hand, in vivo models often require high experimental expenditure and complicate local long-term analysis under constant conditions.
This study extends our previous findings by analyzing the impact of VSOP using hippocampal slice cultures.28 In this context, we focused on the assessment of cell viability, cytokine secretion, iron uptake, and VSOP interactions with cells and tissue.
We carefully calculated the concentration range of SPIO, and we applied based on literature findings. Several publications using in vitro cell culture models of the blood–brain barrier proved that 30%–40% of the applied SPIO can cross this obstacle depending on the magnetic field force or/and surface coating.46–48 In vivo studies using rodents have shown that 17%–30% of injected SPIO overcome the intact blood–brain barrier.49,50
In humans, a dose of 0.075 mM iron/kg bodyweight, as demonstrated for VSOP, leads to a plasma concentration of 90 mg/L iron or ~1.6 mM.16 With regard to the recommended bolus dose of 510 mg Ferumoxytol (Feraheme®), we assumed an amount of 8.5 mg iron/kg bodyweight for a person weighing 60 kg, which could lead to a plasma iron concentration of ~10.0 mM. This is three times higher than the maximal concentration of SPIO used in our experimental approach. But taking into account the 70% SPIO loss due to the blood–brain barrier crossing, a plasma concentration of 10.0 mM equates to ~3.0 mM permeated iron, and 1.6 mM equates to 0.5 mM. Thus, we are confident that we exposed OHSC to SPIO of clinically relevant doses.
So far, publications analyzing the biocompatibility of SPIO are rare and, when compared, inconclusive. Lu et al showed a nonsignificant impact of SPIO on the viability of mesenchymal stem cells after 1 h of exposure.21 Stroh et al applied VSOP to embryonic stem cells for 90 min at a concentration of 1.5 mM without an impact on cell viability.23 Foldager et al showed an influence on the gene expression of chondrocytes but not on their proliferation potential.51 Furthermore, these findings are based on short-term incubation studies and, so far, no long-term trials have been published.
We used immunofluorescence and histochemical staining to ensure preserved cytoarchitecture and consistently confirmed an intact hippocampal formation during incubation (Figure 1A–H). In addition, we were aware of utilizing postnatal animals (P0–P3) and the massive trauma caused by explantation. Cellular development is widely complete at this age, and tissue plasticity and survival in vitro are at their highest.52 Moreover, the intrinsic hippocampal excitation pathway can regenerate even though afferents and efferents were interrupted.30
We excluded preparation-induced cell death artifacts from evaluation by allowing slice regeneration and avoiding any treatments until 7 DIV. Thus, the amount of apoptotic cells was reduced to a basic level (Figure 2). Afterward, we kept the OHSC in culture up to 19 DIV. As described, clinically relevant VSOP concentrations from 0.5 to 3.0 mM were used for nanoparticle treatment.28 Furthermore, VSOP were applied for 48 h at high concentrations in order to imitate a peak effect after SPIO application in vivo with regard to bolus doses as explained above. Simultaneously, VSOP were utilized at 12 DIV in different concentrations in order to imitate long-term in vivo exposure. Recently, the fate of SPIO-labeled neural cell implants was monitored in rats for 87 days using magnetic particle imaging.53
As described, a general time-dependent decrease in OHSC viability was detected during VSOP long-term incubation (Figure 2U–X). We traced the result back to the fact that OHSC passed through several PI staining. As bounded and nonbounded PI staining differ in their fluorescence excitation and emission maximum, we can exclude nonintercalated PI artifacts. However, staining and microscopy are accompanied by OHSC manipulations. It is likely that the repeated interruption of incubation increased cell death. Nonetheless, it is a general phenomenon that does not affect the evaluation. In addition, we found no differences between the untreated control and VSOP-R1-incubated samples in all regions of interest, but we observed an apparent trend of VSOP-R1 to affect DG neurons (Figure 2U and V). Conversely, 1.0 mM VSOP-R2 treatment exclusively altered CA1 viability significantly and increased cell death within the DG region at 19 DIV in concentrations of 1.0–3.0 mM (Figure 2W and X). We consider the impact of 1.0 mM VSOP-R2 on CA1 as a not worthy statistical bias, which is in the end unremarkable because even higher concentrations did not have more adverse effects on cell viability. Additionally, we are aware that the determination of neuronal toxicity using OHSC could lead to a relatively high SD. However, we are convinced of the benefits OHSC offer and deem our methodology as a good and reasonable approach.
These results are in line with our previously published data analyzing the viability of primary hippocampal neurons after SPIO exposure.28 Here, VSOP-R1 application did not change neuronal viability, whereas VSOP-R2 treatment increased the number of degenerated neurons in concentrations of 1.5–3.0 mM. Similarly, the viability of primary microglia decreased in a VSOP-dependent manner. By comparison, neuron-glia co-cultures were not affected by the same concentration range.
The CA is associated with small (CA1) and large (CA3) pyramidal cells while the DG contains a larger number of granule cells. As published before, nanoparticle exposure attenuates granule cell viability in vitro and in vivo, showing the vulnerability of the population.54–56 Based on the result that VSOP-R2 treatment altered DG viability during long-term incubation, we hypothesize that VSOP-R2 caused oxidative stress and induced apoptosis (Figure 2X). Because of the outcome of the aforementioned neuron-glia co-culture experiment, we assume protective effects by microglia in OHSC. These effects prevented cell and tissue degeneration during VSOP-R1 treatment (Figure 2U and V) and in earlier measurements taken at 13 DIV applying VSOP-R2 (Figure 2W and X). At 19 DIV, the microglial ability to defend the surrounding tissue was reduced. Consequently, granule cells were both unprotected and exposed to VSOP-R2 and died.
As presented in Figure 3, we observed ubiquitous VSOP accumulation and a VSOP penetration of deep hippocampal slice layers. Iron-containing cells showed an amoeboid-like shape (Figure 3F) and were less detectable with increasing distance to the membrane. In addition, we can exclude that VSOP are preferentially assimilated in selected slice areas. Acute central nervous system injury (eg, OHSC preparation and in vitro cultivation) activates microglia and leads to their conversion from a static ramified state to a dynamic amoeboid form within several hours. The morphological changes are accompanied by the degradation of ramified branches, the development of dynamic protrusions and their cellular translocation within the slice (up to 118 μm/h).57 In our view, our data (Figure 3) indicate VSOP phagocytosis by dynamic amoeboid microglia following their diffuse migration. The fact that their quantity decreases with increasing distance from section S1 (Figure 3D–L) can be attributed to the higher probability of getting in contact with permeating VSOP next to the membrane.
To further point out the role of microglia, we applied DMDP (DMDP/clodronate) during VSOP short-term treatment, which induces irreversible functional damage and apoptosis in macrophages or macrophage-like cells.58 Although free DMDP is a highly hydrophilic drug that hardly crosses the cellular phospholipid membrane, we successfully decreased the amount of microglia in our setup (Figure 4A and B).59 Compared to the control, DMDP-treated specimens showed increased tissue degeneration at 9 DIV but no further alteration until 11 DIV (Figure 4M–P). At 9 DIV, this is partially a result of DMDP-caused microglial cell death. However, after hippocampal slice preparation, microglia can diminish the amount of trauma-induced dead cells 10-fold within 7 days.60 Thus, the increased PI signal can also be attributed to the absence of microglia and the deficient disposal of decaying cells (7–9 DIV). With regard to the exclusively SPIO-treated samples, VSOP-R1 significantly decreased viability in all regions of interest, whereas VSOP-R2 affected CA3 alone (Figure 4S, T, and V). These results are at first sight contrary to the 3.0 mM nanoparticle long-term exposure (Figure 2U–X). Nonetheless, we are convinced that equal degenerative processes occurred in the long-term study, but due to the extended time frame for data acquisition, microglia engulfed almost all dead cells between 7 DIV and 13 DIV. Consequently, increased cell death was not detectable.
In our recent publication, we found higher microglial degeneration during 24 h of incubation using 3.0 mM VSOP-R1 compared with VSOP-R2.28 This correlation regarding microglia could be an explanation for why VSOP-R2 differed from VSOP-R1 in OHSC. In addition, DMDP plus VSOP treatment caused severe general cell death (Figure 4G, H, K, and L). This reinforces our belief that the loss of microglial protection due to DMDP application consequently exposed the vulnerable slices to the VSOP, which, as a result, led to cell degeneration.
In addition, we investigated cytokine secretion at 11 DIV and were able to prove the existence of pro-inflammatory CXCL1/KC, IL-6, MCP-1, and TNF-α in the OHSC supernatant (Figure 4W–Z). In general, LPS stimulus significantly induced their release, confirming a capable OHSC immune response, whereas previous DMDP treatment decreased the endotoxin-caused effect, significantly proving successful microglial depletion. Nonetheless, VSOP application did not alter cytokine production. Hence, no significant difference was detectable compared to controls or VSOP and DMDP-treated samples, although increased cytokine levels could have been expected due to significant elevated cell death (Figure 4S–V). One could assume that VSOP treatment is tending to alter CXCL1/KC and MCP-1 secretion. However, compared to a LPS stimulus, their impact is comparatively low and accompanied by a relatively high SD.
Using THP-1 monocytic cells, it was previously shown that VSOP do not affect cytokine production.61 Thus, one could assume that VSOP are immunotolerant. Instead, experiments using BV2 microglial cells have proved that Fe2O3 nanoparticle treatment could induce cell proliferation, phagocytosis, and the generation of reactive oxygen species as well as nitric oxide, but did not initiate a significant release of inflammatory cytokines, including IL-6 and TNF-α.62 They also suggest that microglial activation might function as an alarm and defense system in the course of exogenous nanoparticles invading and being stored in the brain. In our view, these results are in line with our findings.
MPS was recently published as a new, highly accurate technique for quantifying VSOP.44 We used MPS and found a significant iron uptake in VSOP-treated specimens (Figure 5). Even though no difference was detectable in the amount of iron between VSOP-R1 and VSOP-R2-incubated samples, DMDP treatment plus SPIO application led to a significantly decreased iron accumulation in OHSC, proving the involvement of microglia. In addition, we attributed the general iron basis level detected in the VSOP-untreated controls to sample processing due to the use of metallic surgical instruments.
Conclusion
This study demonstrates that OHSCs are a suitable model for investigating the safety and biocompatibility of VSOP ex vivo. Our approach is adequate for giving information about alterations caused after VSOP exposure regarding cytoarchitecture, cell viability, cytokine secretion, and iron uptake. We focused on the role of microglia and could prove once again their protective function. Compared to cell lines, primary cell cultures, and in vivo studies, our methodology represents a major advance in investigating VSOP in a complex tissue compound, providing a simple, reproducible option for analyzing the impact of nanoparticle application and initially avoiding in vivo experiments. Even though both citrate-coated SPIO vary only slightly in their diameter, our data demonstrated time- and concentration-dependent differences in biocompatibility using OHSC. We would therefore recommend VSOP-R1 and VSOP-R2 concentrations below 1.0 mM during long-term studies and favor VSOP-R2 if higher SPIO doses are required in short-term trials.
Acknowledgments
The authors thank Oliver Herrmann, Julia Koenig, Ramona Wichert, and Christoph Pohland for their excellent technical assistance as well as Kimberly Mason for editing the manuscript. This work was supported by Deutsche Forschungsgemeinschaft (DFG) grant KFO 213.
Disclosure
The authors report no conflicts of interest in this work.
References
Wang YX, Hussain SM, Krestin GP. Superparamagnetic iron oxide contrast agents: physicochemical characteristics and applications in MR imaging. Eur Radiol. 2001;11(11):2319–2331. | ||
Taupitz M, Schnorr J, Abramjuk C, et al. New generation of monomer-stabilized very small superparamagnetic iron oxide particles (VSOP) as contrast medium for MR angiography: preclinical results in rats and rabbits. J Magn Reson Imaging. 2000;12(6):905–911. | ||
Schaffer BK, Linker C, Papisov M, et al. MION-ASF: biokinetics of an MR receptor agent. 1993;11(3):411–417. | ||
Weissleder R, Reimer P, Lee AS, Wittenberg J, Brady TJ. MR receptor imaging: ultrasmall iron oxide particles targeted to asialoglycoprotein receptors. AJR Am J Roentgenol. 1990;155(6):1161–1167. | ||
Cerdan S, Lotscher HR, Kunnecke B, Seelig J. Monoclonal antibody-coated magnetite particles as contrast agents in magnetic resonance imaging of tumors. Magn Reson Med. 1989;12(2):151–163. | ||
Remsen LG, McCormick CI, Roman-Goldstein S, et al. MR of carcinoma-specific monoclonal antibody conjugated to monocrystalline iron oxide nanoparticles: the potential for noninvasive diagnosis. AJNR Am J Neuroradiol. 1996;17(3):411–418. | ||
Taupitz M, Schmitz S, Hamm B. Superparamagnetische Eisenoxidpartikel: Aktueller Stand und zukünftige Entwicklungen [Superparamagnetic iron oxide particles: current state and future development]. Rofo. 2003;175(6):752–765. German. | ||
Fleige G, Seeberger F, Laux D, et al. In vitro characterization of two different ultrasmall iron oxide particles for magnetic resonance cell tracking. Invest Radiol. 2002;37(9):482–488. | ||
Schulze E, Ferrucci JT Jr, Poss K, Lapointe L, Bogdanova A, Weissleder R. Cellular uptake and trafficking of a prototypical magnetic iron oxide label in vitro. Invest Radiol. 1995;30(10):604–610. | ||
Weissleder R, Cheng HC, Bogdanova A, Bogdanov A Jr. Magnetically labeled cells can be detected by MR imaging. J Magn Reson Imaging. 1997;7(1):258–263. | ||
Bulte JW, Douglas T, Witwer B, et al. Magnetodendrimers allow endosomal magnetic labeling and in vivo tracking of stem cells. Nat Biotechnol. 2001;19(12):1141–1147. | ||
Lewin M, Carlesso N, Tung CH, et al. Tat peptide-derivatized magnetic nanoparticles allow in vivo tracking and recovery of progenitor cells. Nat Biotechnol. 2000;18(4):410–414. | ||
Krieg FM, Andres RY, Winterhalter KH. Superparamagnetically labelled neutrophils as potential abscess-specific contrast agent for MRI. Magn Reson Imaging. 1995;13(3):393–400. | ||
Yeh TC, Zhang W, Ildstad ST, Ho C. Intracellular labeling of T-cells with superparamagnetic contrast agents. Magn Reson Med. 1993;30(5):617–625. | ||
Yeh TC, Zhang W, Ildstad ST, Ho C. In vivo dynamic MRI tracking of rat T-cells labeled with superparamagnetic iron-oxide particles. Magn Reson Med. 1995;33(2):200–208. | ||
Taupitz M, Wagner S, Schnorr J, et al. Phase I clinical evaluation of citrate-coated monocrystalline very small superparamagnetic iron oxide particles as a new contrast medium for magnetic resonance imaging. Invest Radiol. 2004;39(7):394–405. | ||
Wagner M, Wagner S, Schnorr J, et al. Coronary MR angiography using citrate-coated very small superparamagnetic iron oxide particles as blood-pool contrast agent: initial experience in humans. J Magn Reson Imaging. 2011;34(4):816–823. | ||
Hoepken HH, Korten T, Robinson SR, Dringen R. Iron accumulation, iron-mediated toxicity and altered levels of ferritin and transferrin receptor in cultured astrocytes during incubation with ferric ammonium citrate. J Neurochem. 2004;88(5):1194–1202. | ||
Urrutia PJ, Mena NP, Nunez MT. The interplay between iron accumulation, mitochondrial dysfunction, and inflammation during the execution step of neurodegenerative disorders. Front Pharmacol. 2014;5:38. | ||
Hsiao JK, Tai MF, Chu HH, et al. Magnetic nanoparticle labeling of mesenchymal stem cells without transfection agent: cellular behavior and capability of detection with clinical 1.5 T magnetic resonance at the single cell level. Magn Reson Med. 2007;58(4):717–724. | ||
Lu CW, Hung Y, Hsiao JK, et al. Bifunctional magnetic silica nanoparticles for highly efficient human stem cell labeling. Nano Lett. 2007;7(1):149–154. | ||
Arai T, Kofidis T, Bulte JW, et al. Dual in vivo magnetic resonance evaluation of magnetically labeled mouse embryonic stem cells and cardiac function at 1.5 T. Magn Reson Med. 2006;55(1):203–209. | ||
Stroh A, Faber C, Neuberger T, et al. In vivo detection limits of magnetically labeled embryonic stem cells in the rat brain using high-field (17.6 T) magnetic resonance imaging. Neuroimage. 2005;24(3):635–645. | ||
Sykova E, Jendelova P. Magnetic resonance tracking of implanted adult and embryonic stem cells in injured brain and spinal cord. Ann N Y Acad Sci. 2005;1049:146–160. | ||
Guzman R, Uchida N, Bliss TM, et al. Long-term monitoring of transplanted human neural stem cells in developmental and pathological contexts with MRI. Proc Natl Acad Sci U S A. 12 2007;104(24):10211–10216. | ||
Soenen SJ, Illyes E, Vercauteren D, et al. The role of nanoparticle concentration-dependent induction of cellular stress in the internalization of non-toxic cationic magnetoliposomes. Biomaterials. 2009;30(36):6803–6813. | ||
Soenen SJ, Nuytten N, De Meyer SF, De Smedt SC, De Cuyper M. High intracellular iron oxide nanoparticle concentrations affect cellular cytoskeleton and focal adhesion kinase-mediated signaling. Small. 2010;6(7):832–842. | ||
Neubert J, Wagner S, Kiwit J, Brauer AU, Glumm J. New findings about iron oxide nanoparticles and their different effects on murine primary brain cells. Int J Nanomedicine. 2015;10:2033–2049. | ||
Gahwiler BH, Capogna M, Debanne D, McKinney RA, Thompson SM. Organotypic slice cultures: a technique has come of age. Trends Neurosci. 1997;20(10):471–477. | ||
Zimmer J, Gahwiler BH. Cellular and connective organization of slice cultures of the rat hippocampus and fascia dentata. J Comp Neurol. 1984;228(3):432–446. | ||
Stoppini L, Buchs PA, Muller D. A simple method for organotypic cultures of nervous tissue. J Neurosci Methods. 1991;37(2):173–182. | ||
Pinkernelle J, Calatayud P, Goya GF, Fansa H, Keilhoff G. Magnetic nanoparticles in primary neural cell cultures are mainly taken up by microglia. BMC Neurosci. 2012;13:32. | ||
Ransohoff RM, Perry VH. Microglial physiology: unique stimuli, specialized responses. Annu Rev Immunol. 2009;27:119–145. | ||
Minghetti L, Ajmone-Cat MA, De Berardinis MA, De Simone R. Microglial activation in chronic neurodegenerative diseases: roles of apoptotic neurons and chronic stimulation. Brain Res Brain Res Rev. 2005;48(2):251–256. | ||
Block ML, Zecca L, Hong JS. Microglia-mediated neurotoxicity: uncovering the molecular mechanisms. Nat Rev Neurosci. 2007;8(1):57–69. | ||
Suzumura A, Takeuchi H, Zhang G, Kuno R, Mizuno T. Roles of glia-derived cytokines on neuronal degeneration and regeneration. Ann N Y Acad Sci. 2006;1088:219–229. | ||
Hanisch UK. Microglia as a source and target of cytokines. Glia. 2002;40(2):140–155. | ||
Walter L, Neumann H. Role of microglia in neuronal degeneration and regeneration. Semin Immunopathol. 2009;31(4):513–525. | ||
Smith JA, Das A, Ray SK, Banik NL. Role of pro-inflammatory cytokines released from microglia in neurodegenerative diseases. Brain Res Bull. 2012;87(1):10–20. | ||
Frotscher M, Heimrich B. Lamina-specific synaptic connections of hippocampal neurons in vitro. J Neurobiol. 1995;26(3):350–359. | ||
Pohland M, Glumm R, Stoenica L, et al. Studying axonal outgrowth and regeneration of the corticospinal tract in organotypic slice cultures. J Neurotrauma. 2015;32(19):1465–1477. | ||
Tysiak E, Asbach P, Aktas O, et al. Beyond blood brain barrier breakdown – in vivo detection of occult neuroinflammatory foci by magnetic nanoparticles in high field MRI. J Neuroinflammation. 2009;6:20. | ||
Perl DP, Good PF. Comparative techniques for determining cellular iron distribution in brain tissues. Ann Neurol. 1992;32(Suppl):S76–S81. | ||
Poller WC, Lowa N, Wiekhorst F, et al. Magnetic particle spectroscopy reveals dynamic changes in the magnetic behavior of very small superparamagnetic iron oxide nanoparticles during cellular uptake and enables determination of cell-labeling efficacy. J Biomed Nanotechnol. 2016;12(2):337–346. | ||
Focke A, Schwarz S, Foerschler A, et al. Labeling of human neural precursor cells using ferromagnetic nanoparticles. Magn Reson Med. 2008;60(6):1321–1328. | ||
Hoff D, Sheikh L, Bhattacharya S, Nayar S, Webster TJ. Comparison study of ferrofluid and powder iron oxide nanoparticle permeability across the blood-brain barrier. Int J Nanomedicine. 2013;8:703–710. | ||
Sun Z, Worden M, Wroczynskyj Y, et al. Magnetic field enhanced convective diffusion of iron oxide nanoparticles in an osmotically disrupted cell culture model of the blood-brain barrier. Int J Nanomedicine. 2014;9:3013–3026. | ||
Thomsen LB, Linemann T, Pondman KM, et al. Uptake and transport of superparamagnetic iron oxide nanoparticles through human brain capillary endothelial cells. ACS Chem Neurosci. 2013;4(10):1352–1360. | ||
Dan M, Cochran DB, Yokel RA, Dziubla TD. Binding, transcytosis and biodistribution of anti-PECAM-1 iron oxide nanoparticles for brain-targeted delivery. PLoS One. 2013;8(11):e81051. | ||
Kong SD, Lee J, Ramachandran S, et al. Magnetic targeting of nanoparticles across the intact blood-brain barrier. J Control Release. 2012;164(1):49–57. | ||
Foldager CB, Pedersen M, Ringgaard S, Bunger C, Lind M. Chondrocyte gene expression is affected by very small iron oxide particles-labeling in long-term in vitro MRI tracking. J Magn Reson Imaging. 2011;33(3):724–730. | ||
Gahwiler BH. Slice cultures of cerebellar, hippocampal and hypothalamic tissue. Experientia. 1984;40(3):235–243. | ||
Zheng B, Vazin T, Goodwill PW, et al. Magnetic particle imaging tracks the long-term fate of in vivo neural cell implants with high image contrast. Sci Rep. 2015;5:14055. | ||
Yin N, Liu Q, Liu J, et al. Silver nanoparticle exposure attenuates the viability of rat cerebellum granule cells through apoptosis coupled to oxidative stress. Small. 2013;9(9–10):1831–1841. | ||
Bagheri-Abassi F, Alavi H, Mohammadipour A, Motejaded F, Ebrahimzadeh-Bideskan A. The effect of silver nanoparticles on apoptosis and dark neuron production in rat hippocampus. Iran J Basic Med Sci. 2015;18(7):644–648. | ||
Gao X, Yin S, Tang M, et al. Effects of developmental exposure to TiO2 nanoparticles on synaptic plasticity in hippocampal dentate gyrus area: an in vivo study in anesthetized rats. Biol Trace Elem Res. 2011;143(3):1616–1628. | ||
Stence N, Waite M, Dailey ME. Dynamics of microglial activation: a confocal time-lapse analysis in hippocampal slices. Glia. 2001;33(3):256–266. | ||
Monkkonen J, Taskinen M, Auriola SO, Urtti A. Growth inhibition of macrophage-like and other cell types by liposome-encapsulated, calcium-bound, and free bisphosphonates in vitro. J Drug Target. 1994;2(4):299–308. | ||
Russell RGG, Rogers MJ. Bisphosphonates: from the laboratory to the clinic and back again. Bone. 1999;25(1):97–106. | ||
Petersen MA, Dailey ME. Diverse microglial motility behaviors during clearance of dead cells in hippocampal slices. Glia. 2004;46(2):195–206. | ||
Ludwig A, Poller WC, Westphal K, et al. Rapid binding of electrostatically stabilized iron oxide nanoparticles to THP-1 monocytic cells via interaction with glycosaminoglycans. Basic Res Cardiol. 2013;108(2):328. | ||
Wang Y, Wang B, Zhu MT, et al. Microglial activation, recruitment and phagocytosis as linked phenomena in ferric oxide nanoparticle exposure. Toxicol Lett. 2011;205(1):26–37. |
 © 2017 The Author(s). This work is published and licensed by Dove Medical Press Limited. The full terms of this license are available at https://www.dovepress.com/terms.php and incorporate the Creative Commons Attribution - Non Commercial (unported, v3.0) License.
By accessing the work you hereby accept the Terms. Non-commercial uses of the work are permitted without any further permission from Dove Medical Press Limited, provided the work is properly attributed. For permission for commercial use of this work, please see paragraphs 4.2 and 5 of our Terms.
© 2017 The Author(s). This work is published and licensed by Dove Medical Press Limited. The full terms of this license are available at https://www.dovepress.com/terms.php and incorporate the Creative Commons Attribution - Non Commercial (unported, v3.0) License.
By accessing the work you hereby accept the Terms. Non-commercial uses of the work are permitted without any further permission from Dove Medical Press Limited, provided the work is properly attributed. For permission for commercial use of this work, please see paragraphs 4.2 and 5 of our Terms.