")
Back to Journals » Clinical Ophthalmology » Volume 10
Biocompatibility of the vital dye Acid Violet-17 on retinal pigment epithelial cells
Authors Tura A, Alt A, Lüke J, Grisanti S, Haritoglou C, Meyer CH, Nassar K, Lüke M
Received 3 February 2016
Accepted for publication 9 March 2016
Published 29 July 2016 Volume 2016:10 Pages 1435—1445
DOI https://doi.org/10.2147/OPTH.S105695
Checked for plagiarism Yes
Review by Single anonymous peer review
Peer reviewer comments 2
Editor who approved publication: Dr Scott Fraser
Ayşegül Tura,1 Aizhan Alt,1 Julia Lüke,1 Salvatore Grisanti,1 Christos Haritoglou,2 Carsten H Meyer,3 Khaled Nassar,1 Matthias Lüke1
On behalf of the International Chromovitrectomy Collaboration
1Department of Ophthalmology, University of Schleswig-Holstein, Lübeck, Germany; 2Department of Ophthalmology, Ludwig-Maximilians University, Munich, Germany; 3Department of Ophthalmology, Pallas Clinic, Aarau, Switzerland
Purpose: To examine the viability and differentiation of retinal pigment epithelial (RPE) cells after exposure to the vital dye Acid Violet-17 (AV-17).
Methods: Bovine RPE cells were incubated with AV-17 (0.0625–0.5 mg/mL) for 30 seconds or 5 minutes. Viability was determined by live/dead staining, cleaved CASP3 immunostainings, and MTT test. Actin cytoskeleton was visualized by Alexa 488-phalloidin. Immunocytochemistry was performed to determine the levels of ZO-1, CTNNB1, and KRT19.
Results: Exposure to AV-17 at the concentrations of 0.25–0.5 mg/mL resulted in a dose-dependent decrease in viability, the loss of ZO-1 from tight junctions, translocation of CTNNB1 into the cytoplasm and nucleus, disarrangement of the actin cytoskeleton, and a slight increase in KRT19.
Conclusion: AV-17 at a concentration <0.125 mg/mL is likely to be well tolerated by the RPE cells, whereas the concentrations from 0.25 mg/mL onward can reduce viability and induce dedifferentiation particularly after long-term exposure.
Keywords: Acid Violet-17, retinal pigment epithelial cells, biocompatibility, viability, differentiation
Introduction
Vital dyes have significantly improved the success of vitreoretinal surgeries by enabling the visualization of preretinal tissues and membranes.1,2 Currently, the dyes such as Brilliant Blue G (BBG, Brilliant Peel), patent blue V (Blueron), indocyanine green (ICG), and trypan blue (TB) can be applied during pars plana vitrectomy for macular diseases, including macular holes, epiretinal membranes, and tractional (diabetic) macula. However, numerous studies have demonstrated adverse effects, such as toxicity in the retina, alterations in the retinal pigment epithelial (RPE) cells, and a reduced visual acuity especially after the use of ICG or TB,3–6 resulting in an increasing concern regarding the clinical use of these dyes. Therefore, extensive safety testing of new candidate dyes should be performed before their application in humans.
Acid Violet-17 (AV-17/Coomassie violet R200) is a trityl dye, which exhibits similar chemical properties to BBG. To enhance the staining quality, AV-17 should be applied in a special solvent loaded with heavier water (D2O), which leads to a higher density. This dye could stain the anterior capsule of ex vivo porcine eyes and the internal limiting membrane (ILM) satisfactorily, without causing substantial histopathological alterations in the retina.7 We have also recently reported that AV-17 was well tolerated at a concentration of up to 0.125 mg/mL in terms of retinal function, survival in the ganglion cell layer, and glial reactivity in isolated bovine retinas.8 However, the response of RPE cells is a further critical point, since these cells can also be exposed to the dye during macular hole surgery when the dye migrates through the macular hole into the subretinal space.9,10 Indeed, several groups reported complications such as RPE atrophy and reduced visual acuity after macular hole surgery using the dyes TB11 and ICG.12
In a recent study, the viability of the human RPE cell line ARPE-19 after treatment with various dyes including AV-17 was evaluated, and a 3-minute exposure to AV-17 was reported to be well tolerated at a maximal concentration of 0.05 mg/mL.13 Yet, in the case of RPE, the extent of cell differentiation is an equally critical parameter defining the safety of a dye. The RPE tissue comprises a monolayer of highly polarized and differentiated cells, with organelles and cytoskeletal elements localized to distinct subcellular positions.14–16 Formation of this differentiated architecture is promoted by the tight and cell–cell (adherens) junctions between adjacent cells. The tight and adherens junctions are further supported by linkage to the actin cytoskeleton via the linker proteins ZO-1 and CTNNB1, respectively. Accordingly, the loss of junctional integrity triggers the dedifferentiation of RPE cells, which would lead to a functional decline.16–18 Studies on cultured human19 and bovine RPE cells20 demonstrated that the exposure to ICG can alter the bioelectrical properties of these cells and induce premature senescence through oxidative stress. Likewise, the exposure of ARPE-19 cells to ICG resulted in morphological alterations suggestive of cytoskeletal rearrangement and a decrease in viability.21
In this study, we explored the safety profile of AV-17 on differentiated RPE cultures by analyzing cell viability. We also evaluated the extent of differentiation with particular emphasis on the organization of the actin cytoskeleton and the integrity of tight and adherens junctions. Furthermore, the levels of KRT19, an intermediate filament associated with dedifferentiated and migrating RPE cells,22 were determined.
Methods
Chemicals and reagents
Antibodies as well as the major chemicals and reagents used were listed in Table 1. The remaining chemicals were obtained from Sigma-Aldrich Co. (St Louis, MO, USA) or Carl Roth GmbH + Co. KG (Karlsruhe, Germany).
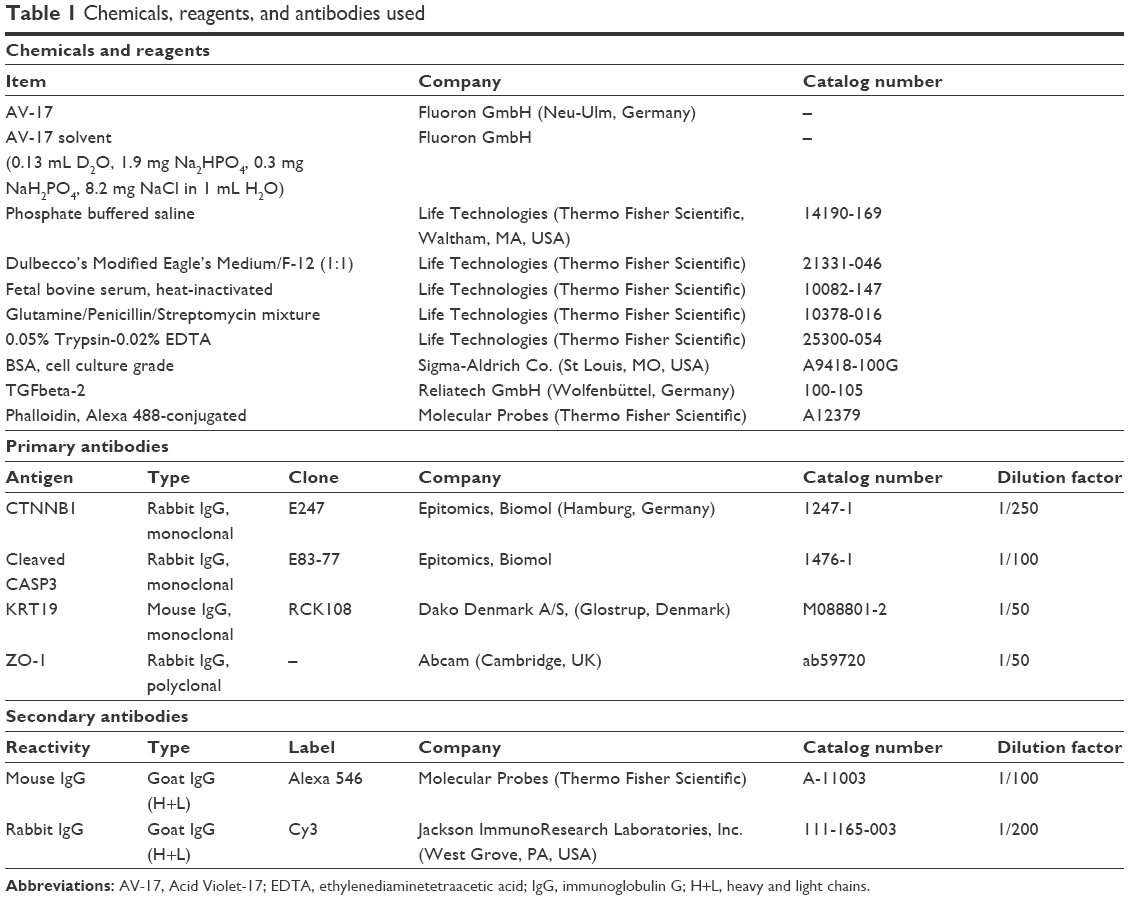 | Table 1 Chemicals, reagents, and antibodies used |
RPE culture
Bovine eyes were obtained from a local slaughterhouse and used within 5 hours post-mortem. RPE cells were isolated as described23,24 with slight modifications. Briefly, the eyes were submerged for 5 minutes in an 11% iodine solution (Betaisodona, Mundipharma GH, Limburg, Germany) followed by rinsing twice with phosphate buffered saline (PBS) for 5 minutes. Eyes were dissected circumferentially 5 mm posterior to the limbus. Afterwards, the anterior segment, vitreous, and retina were discarded. The exposed retinal pigment epithelium was washed three times in PBS to remove the photoreceptor debris. The eyecup was filled with 0.05% trypsin–0.02% ethylenediaminetetraacetic acid solution and incubated for 75 minutes at 37°C. Dissociated RPE cells were collected using a Pasteur pipette avoiding injury to the Bruch’s membrane and pooled from 5 to 6 eyes. Cells were transferred into the culture medium (Dulbecco’s Modified Eagle’s Medium/F12 supplemented with 10% fetal bovine serum, 2 mM L-glutamine, 100 U/mL penicillin, 100 μg/mL streptomycin), centrifuged at 300 ×g for 8 minutes, and resuspended in fresh culture medium. Cells were seeded either into a 75 cm2 culture flask or culture plates (six-well plate, 24-well fluorocarbon plate; Zell-Kontakt GmbH, Nörten-Hardenberg, Germany) and maintained in a humidified 37°C incubator with 5% CO2. After reaching confluence (1–2 weeks), cells in the flasks were subcultured further with trypsin–ethylenediaminetetraacetic acid treatment and seeded into six-, 24-, or 96-well plates.
To achieve an in vitro setting that resembles the normal differentiated cells in situ, we initially optimized the culture conditions of RPE cells. For this purpose, confluent primary and subcultured RPE cells (passages 3–7) in the culture plates were maintained in a low- (2% v/v) serum medium for 8–16 weeks, with the replenishment of culture medium by one half every 2–3 days. The extent of cellular junction formation and differentiation was evaluated by performing immunofluorescence staining for ZO-1, CTNNB1, and KRT19 as described later, and the results are demonstrated in Figure 1.
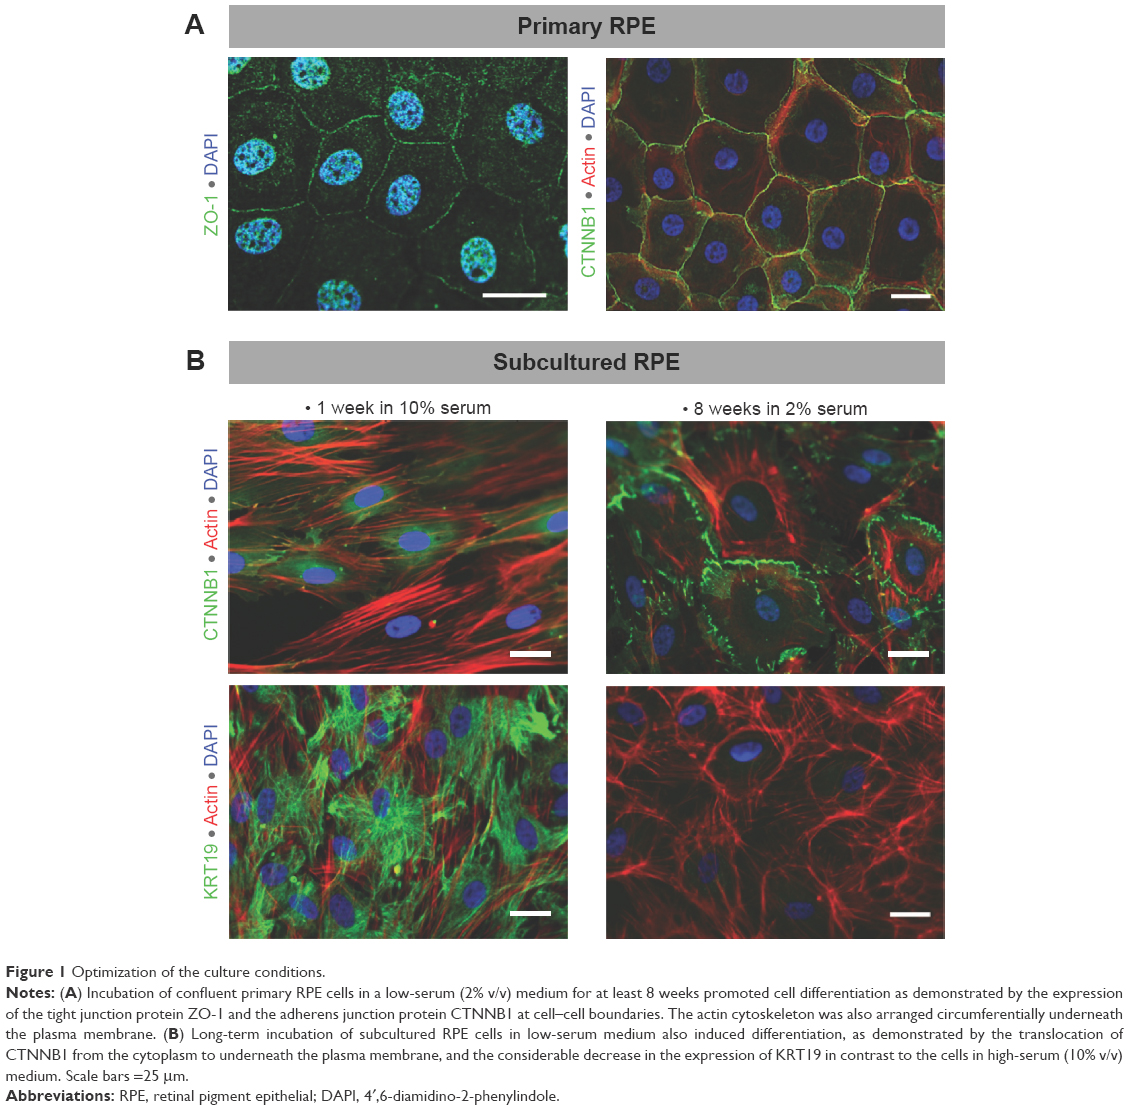 | Figure 1 Optimization of the culture conditions. |
Treatment with AV-17
AV-17 was dissolved at concentrations between 0.0625 and 0.5 mg/mL in the solvent, sterile filtered, and stored at 4°C until use. The culture medium was removed completely from the RPE cells grown in the six-, 24-, or 96-well plates, and the wells were filled immediately with the dye solution or solvent (100 μL/well in the 96-well plates, 250 μL/well in the 24-well plates, and 1 mL/well in the six-well plates). As control, a group of cells were treated with low-serum medium in the same manner. After incubation of 30 seconds or 5 minutes under ambient light, the solutions were discarded, the cells were washed three times for 5 minutes in PBS at the aforementioned volumes, and allowed to recover in low-serum medium overnight at 37°C with 5% CO2 in dark. As additional controls, a group of cells treated with low-serum medium were incubated overnight in medium supplemented with 10 ng/mL TGFbeta-2 to stimulate dedifferentiation or in PBS with 600 μM H2O2 to induce cell injury.
Live/dead staining
Culture medium was aspirated gently, the cells were rinsed briefly with 0.1% glucose–PBS, and incubated for 15 minutes in 2 μM ethidium homodimer-1 and 2 μM calcein-AM (Molecular Probes, Thermo Fisher Scientific, Waltham, MA, USA) diluted in 0.1% glucose–PBS under protection from light. Cells were then fixed, permeabilized, counterstained with 4′,6-diamidino-2-phenylindole (DAPI) (1 μg/mL in PBS), mounted in Mowiol as previously described,25 and analyzed by fluorescence microscopy (Leica Microsystems, Wetzlar, Germany). Images of all the subgroups of a given experiment were acquired on the same day using a monochrome digital camera (DFC 350 FX; Leica Microsystems) attached to the microscope and the Leica Application Software (Advanced Fluorescence 2.3.0, build 5131) under identical settings for exposure time, gain, and intensity. Quantification of the staining intensity was performed using the ImageJ software (National Institutes of Health, Bethesda, MD, USA, http://imagej.nih.gov/ij/, 1997–2014) on the images having an area of 0.04 mm2. The viability index was calculated from the ratio of the intensities of calcein and ethidium homodimer-1 stainings.
MTT test
Bovine RPE cells at passages 3–7 were seeded into the inner wells of 96-well culture plates at a density of 5,000 cells/well, with six wells for each treatment group, and allowed to differentiate for 8–10 weeks. Cells were treated with the test substances and allowed to recover overnight as described. An additional group of cells were left untreated as normal controls. MTT test was performed on the following day as described.25 The absorbance values at 544 nm were read using a spectrophotometric plate reader (FLUOstar, BMG Labtech GmbH, Ortenberg, Germany). The background values of the negative control were subtracted from the absorbance values of all the test groups. For each test group, the average absorbance value was calculated from the readings in the corresponding six wells after background subtraction. Data are presented as the mean ± standard error of mean (SEM) of n=3 independent tests.
Immunofluorescence staining
Cells grown in 24-well fluorocarbon plates with excisable foil-bottoms (Zell-Kontakt GmbH, Nörten-Hardenberg, Germany) were fixed in 2% paraformaldehyde–PBS for 10 minutes followed by 4% paraformaldehyde–PBS for 10 minutes, rinsed three times in PBS, and incubated with the blocking buffer (3% BSA–PBS with 0.3% Triton X-100) for 30 minutes. Primary and secondary antibodies were diluted in the blocking buffer as indicated in Table 1. Cells were incubated with the primary antibodies overnight at 4°C followed by secondary antibodies for 1 hour at room temperature protected from light. Actin filaments were stained with Alexa 488-phalloidin (240 units/mL in blocking buffer) for 30 minutes, and the nuclei were counterstained with DAPI (1 μg/mL in PBS) for 10 minutes, with the cells being washed three times in PBS after each step. The well bottom was excised using a scalpel and placed flatly onto a drop of PBS pipetted onto a microscope slide (25 μL/foil) with the cell-seeded side facing upward. Cells were mounted in Mowiol, stored at 4°C, and examined under a fluorescence microscope (Leica Microsystems). Images were acquired as described in the live/dead staining section.
Quantification of the staining intensity was performed using the ImageJ software on the images with an area of 0.04 mm2 by marking all the cells that lie completely in the field of view. Intensity of junctional ZO-1 and CTNNB1 was determined from the ratio of the intensity at the cell perimeter to the mean cytoplasmic intensity. To better identify the boundaries of cells that exhibit a very weak staining, the intensities of cleaved CASP3 and KRT19 stainings were quantified on the merged images, by using the DAPI and actin filament stainings, respectively, for cell identification and recording the green intensity values from the histograms of marked regions. The mean intensity of negative controls (incubated with the blocking buffer alone without the primary antibody) were subtracted from the intensity of test groups for all the immunostainings.
Statistical analysis
The data were analyzed by two-sided Student’s t-test assuming equal variance among the samples and the P-values <0.05 were considered as significant. Data are presented either as mean ± standard deviation (SD) of a representative set of experiments or mean ± SEM of n=3 independent experiments.
Results
Viability of the primary and subcultured RPE cells in response to AV-17
Viability of the differentiated RPE cells after exposure to AV-17 was evaluated by the live/dead assay, extent of CASP3 cleavage, and the MTT test, which all reflect different parameters. The live/dead assay employs the vital dye calcein, which emits green fluorescence after being processed by esterases in living cells and the red fluorescent nucleic acid dye ethidium homodimer-1, which cannot penetrate intact cell membranes.
In the primary RPE cells, the 30-second exposure to the solvent or AV-17 (0.125 and 0.25 mg/mL) did not result in remarkable toxicity, as demonstrated by the strong cytoplasmic staining with calcein and the negligible ethidium homodimer-1 uptake. Though the cells exposed to 0.5 mg/mL AV-17 exhibited lower calcein staining, there was no significant increase in the uptake of ethidium homodimer-1 (Figure 2A). Following the 5-minute exposure, cells treated with the solvent or 0.125 mg/mL AV-17 also exhibited a high degree of viability. However, the cells exposed to 0.25 and 0.5 mg/mL dye demonstrated lower levels of calcein staining or a gradual increase in the uptake of ethidium homodimer-1, resulting in a significant decrease of 36%–38% in the viability score calculated from the ratio of calcein to ethidium homodimer-1 intensity (P=0.0058 and P=0.0009, respectively compared to the cells treated with medium, mean ± SD of n=4–7 images of 0.04 mm2 from a representative experiment, Figure 2B and C).
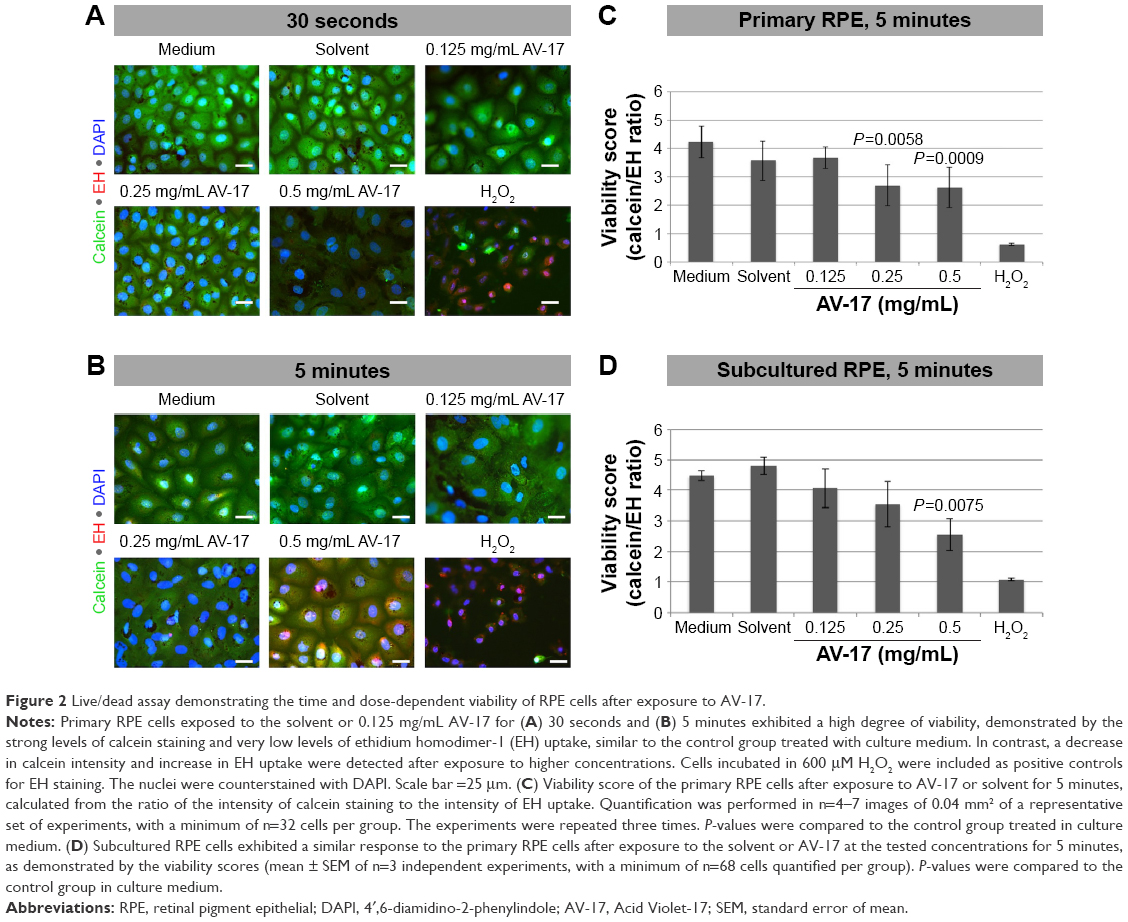 | Figure 2 Live/dead assay demonstrating the time and dose-dependent viability of RPE cells after exposure to AV-17. |
Treatment of subcultured RPE cells with AV-17 yielded similar results as the primary cells. The 5-minute exposure to the solvent or 0.125 mg/mL AV-17 was well tolerated, whereas the cells treated with 0.25 and 0.5 mg/mL AV-17 exhibited gradually lower levels of calcein with a slight, dose-dependent increase in ethidium homodimer-1 uptake. The viability score was reduced by 43% in the subcultured RPE cells treated with 0.5 mg/mL AV-17 (P=0.0075 compared to the cells treated with medium, mean ± SEM of n=3 independent experiments, Figure 2D).
To determine the extent of apoptosis, we performed immunostainings for cleaved CASP3 on the primary and subcultured RPE cells. The former group of cells treated with the solvent or 0.125 mg/mL AV-17 exhibited a very weak staining after both the 30-second and 5-minute exposures. However, a significant increase by ~25% was observed in the levels of cleaved CASP3 in the cells exposed to 0.25 and 0.5 mg/mL AV-17 for 5 minutes (P=0.0032 and P=0.0381, respectively, mean ± SD of n=6–7 images of 0.04 mm2). In the subcultured RPE cells, a significant increase in cleaved CASP3 intensity was detected only in the groups treated with 0.5 mg/mL AV-17 for 5 minutes (P<0.0001 compared to the cells treated with medium, mean ± SD of n=10 images of 0.04 mm2, Figure 3).
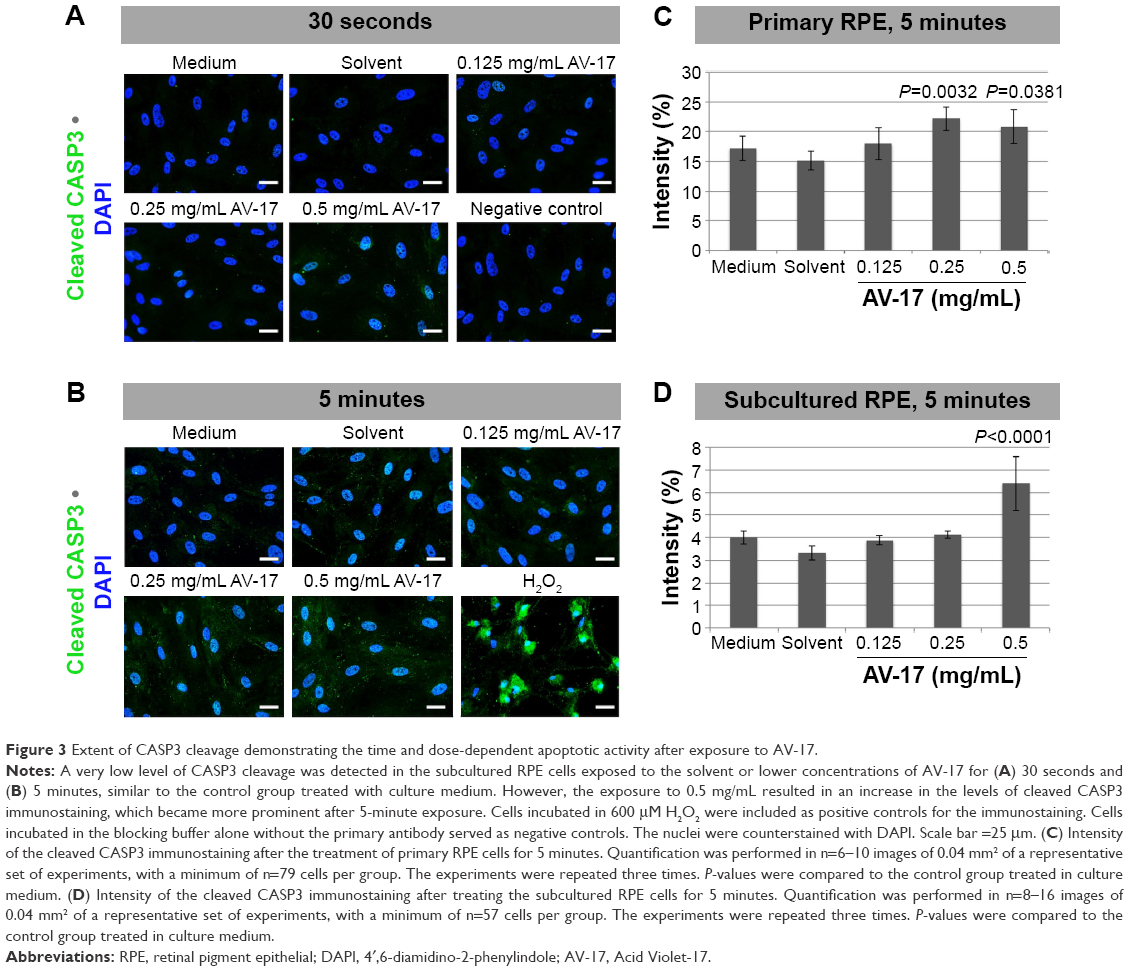 | Figure 3 Extent of CASP3 cleavage demonstrating the time and dose-dependent apoptotic activity after exposure to AV-17. |
We also analyzed viability by performing MTT test on the subcultured and differentiated RPE cells. Interestingly, the 30-second exposure resulted in a slight but insignificant decrease of ~18% in the absorbance values in response to 0.125 and 0.25 mg/mL AV-17 (P=0.1322 and P=0.0769, respectively; mean ± SEM of n=3 independent experiments). A significant reduction of 28% was observed in the absorbance values of cells treated with 0.05 mg/mL AV-17 (P=0.0416; mean ± SEM of n=3 independent experiments). Exposure to 0.0625 mg/mL AV-17 or the solvent alone did not result in a significant difference compared to the medium-treated cells (Figure 4).
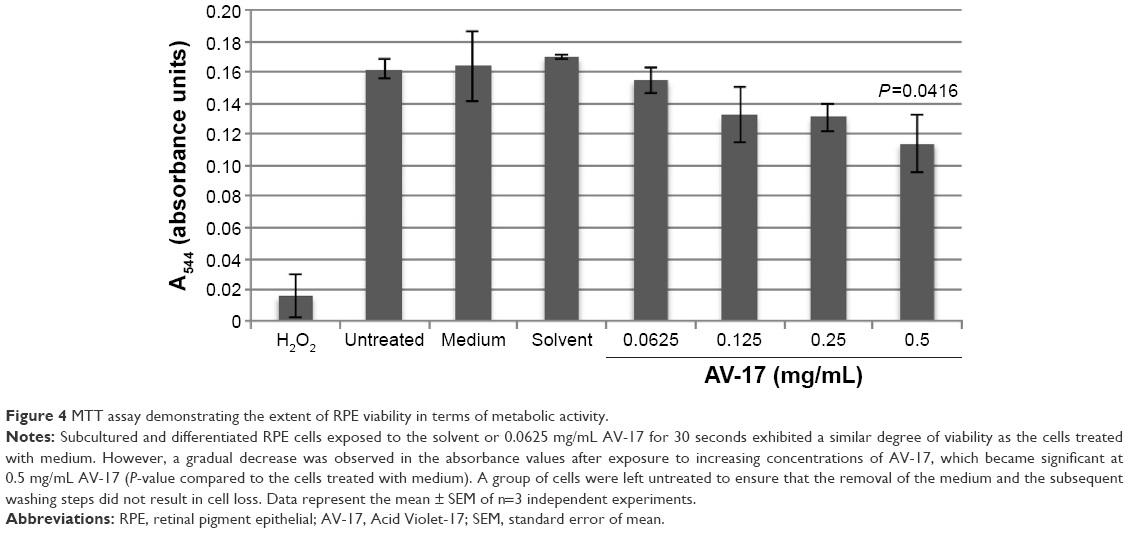 | Figure 4 MTT assay demonstrating the extent of RPE viability in terms of metabolic activity. |
Organization of the actin cytoskeleton after exposure to AV-17
The control group of primary RPE cells treated with low-serum medium exhibited a hexagonal morphology with circumferential actin filaments. In contrast, the dedifferentiated control cells incubated with 10 ng/mL TGFbeta-2 exhibited a morphology dominated by fibroblasts and abundant stress fibers. The 30-second exposure to the solvent or dye did not result in a remarkable difference in cellular morphology or the organization of the actin cytoskeleton that would suggest dedifferentiation. After the 5-minute exposure, the polygonal morphology and the circumferentially arranged actin filaments were maintained in the cells treated with the solvent and 0.125 mg/mL AV-17. However, with increasing concentrations of the dye, the actin filaments became less restricted to the cell–cell borders (Figure 5).
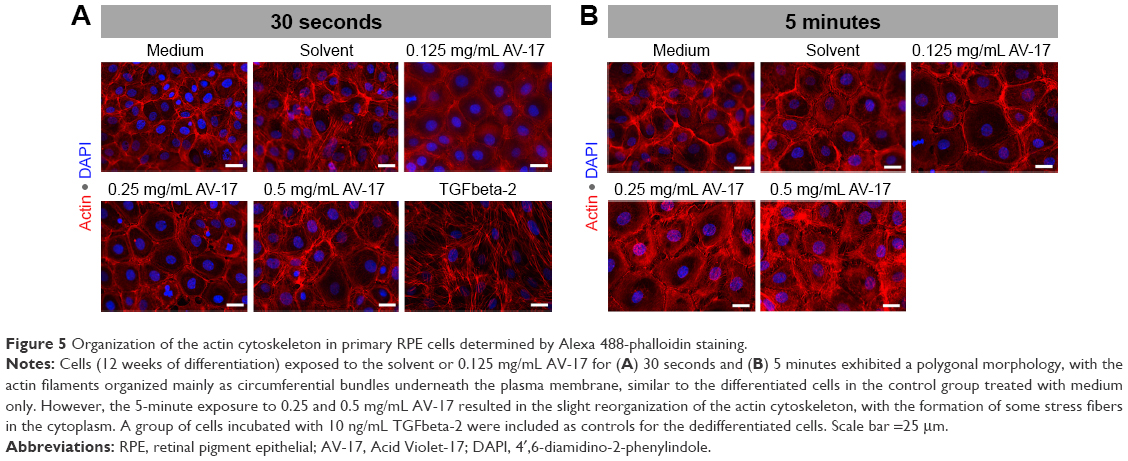 | Figure 5 Organization of the actin cytoskeleton in primary RPE cells determined by Alexa 488-phalloidin staining. |
Extent of differentiation in the RPE cells after exposure to AV-17
The integrity of the tight and adherens junctions was examined by performing immunostainings for ZO-1 and CTNNB1, respectively. After the 5-minute exposure to the solvent or 0.125 mg/mL AV-17, expression of both proteins at the cellular junctions was well preserved in the primary RPE cells. However, the incubation with 0.25 and 0.5 mg/mL AV-17 resulted in an ~15%–25% decrease in the ratio of junctional to cytoplasmic ZO-1 (P<0.0001, mean ± SEM of n=6–12 images) and a 14.5% increase in cytoplasmic CTNNB1, respectively (P=0.0001, mean ± SEM of n=11–18 images of 0.04 mm2, Figure 6).
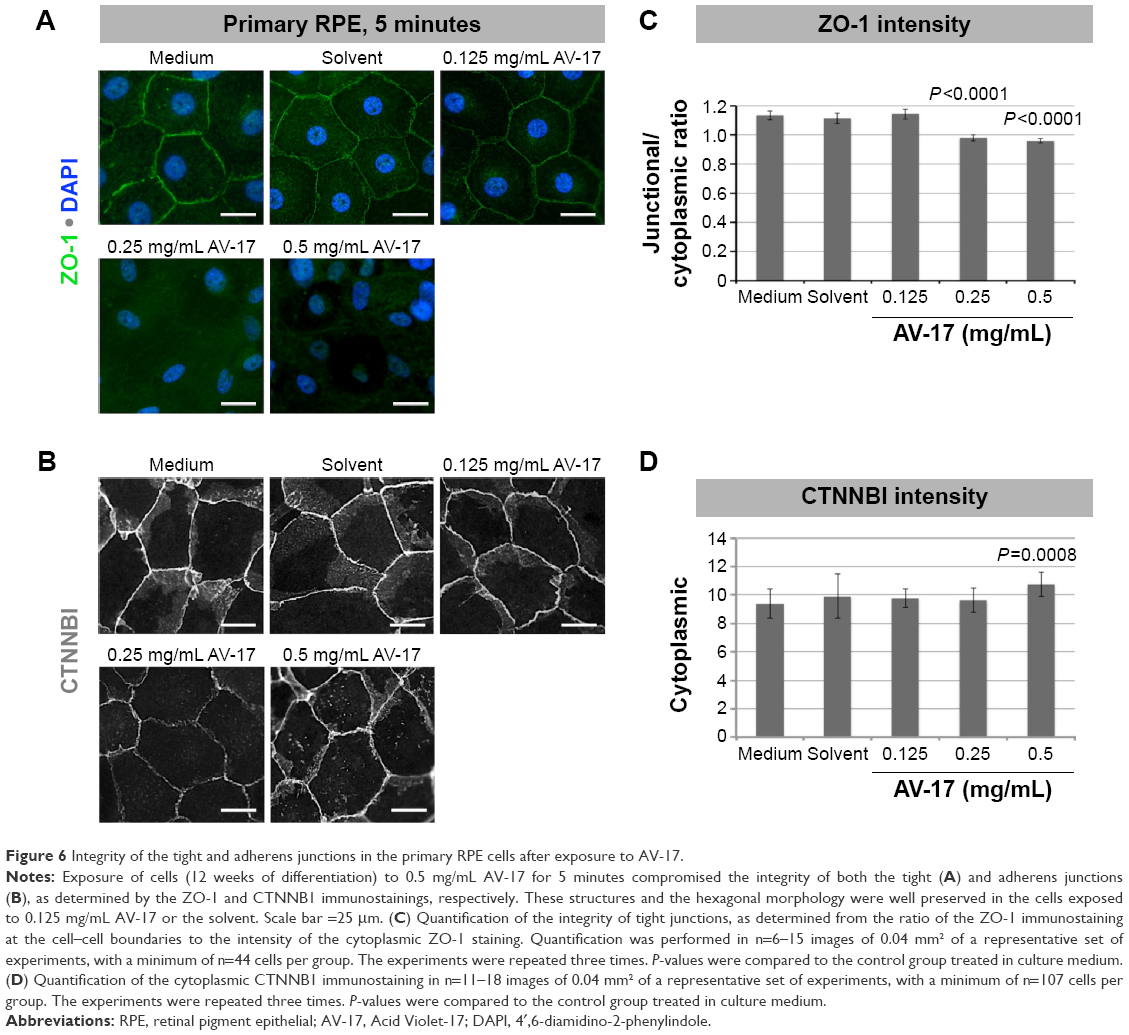 | Figure 6 Integrity of the tight and adherens junctions in the primary RPE cells after exposure to AV-17. |
Likewise, in the subcultured RPE cells treated with the solvent or 0.125 mg/mL AV-17 for 5 minutes, CTNNB1 was primarily localized to the cell–cell junctions with very little cytoplasmic or nuclear staining. However, exposure to 0.25 and 0.5 mg/mL AV-17 resulted in a significant decrease of 25%–33% in the ratios of junctional to cytoplasmic CTNNB1, respectively (P<0.0001, mean ± SD of n=9–12 images of 0.04 mm2, Figure 7A and B).
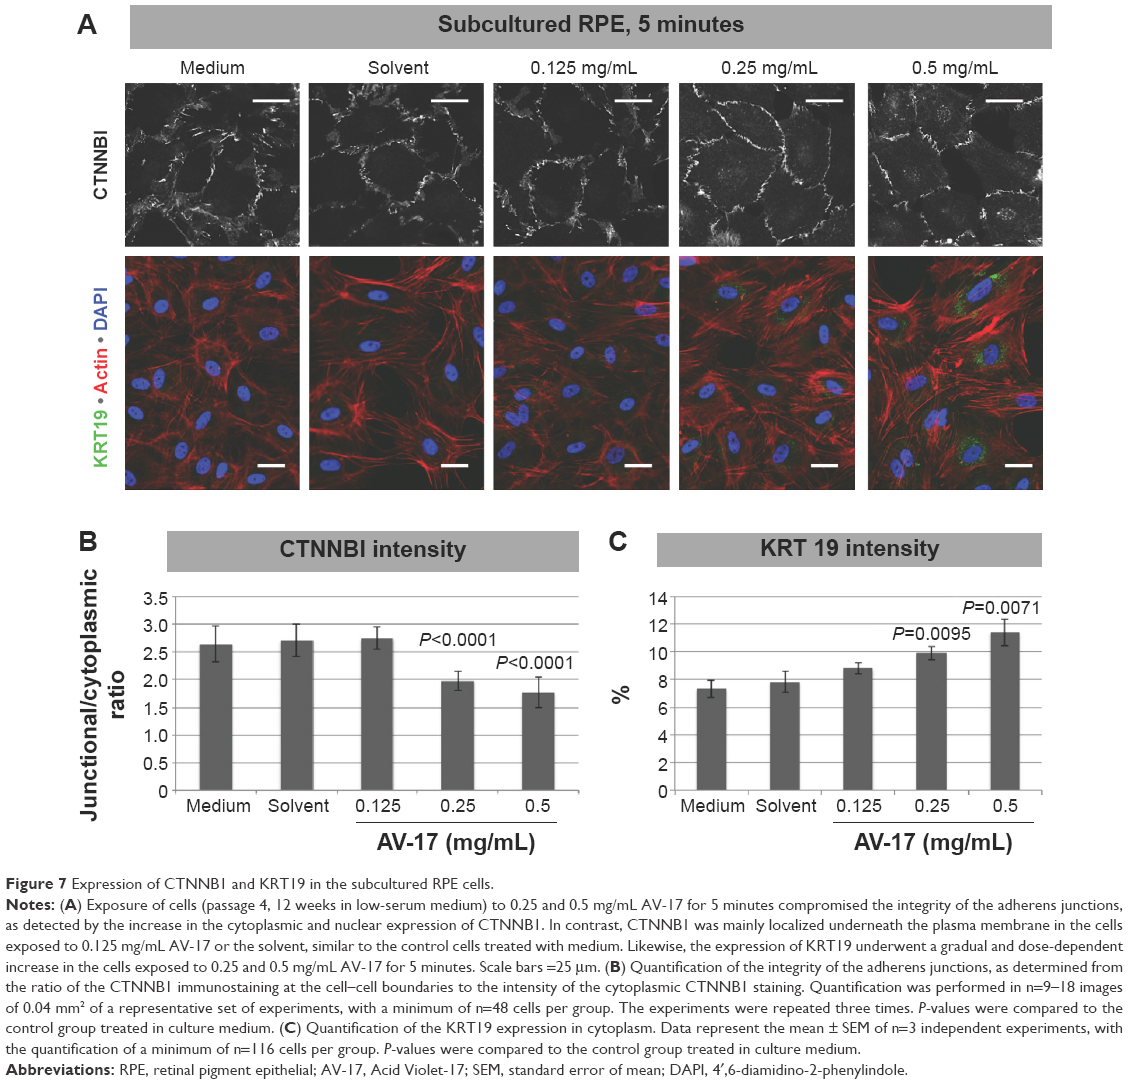 | Figure 7 Expression of CTNNB1 and KRT19 in the subcultured RPE cells. |
In the differentiated primary RPE cells, we did not detect any immunoreactivity for the intermediate filament KRT19 in any of the treatment groups (data not shown). KRT19 was also expressed at very low levels in the subcultured RPE cells treated with the normal medium, solvent or 0.125 mg/mL AV-17 for 5 minutes. However, the cells exposed to 0.25 and 0.5 mg/mL of AV-17 exhibited a gradual and significant increase in KRT19 expression by 35% and 56%, respectively (P=0.0095 and P=0.0071, respectively; mean ± SEM of n=3 independent experiments, Figure 7A and C).
Discussion
In this study, we evaluated the viability and differentiation of bovine RPE cells after exposure to the vital dye AV-17. Cultures of bovine RPE cells were preferred since these cells can be isolated from post-mortem eyes with a high yield and differentiated in vitro. Bovine RPE cells therefore provide an easily available and cost-effective alternative, which does not entail ethical issues, unlike the establishment of human RPE cultures. The differentiated bovine cells are also expected to simulate the in vivo conditions better than the transformed human RPE cell line ARPE-19, which was found to be relatively robust to different treatments.21
To enable differentiation, we initially allowed the bovine RPE cells to reach confluence for the formation of cellular junctions. Afterward, serum concentration was gradually lowered from 10% to 2% to prevent the overgrowth of cells.26 These conditions induced the differentiation of both the primary and the subcultured RPE cells satisfactorily in our study. Both cell types exhibited a similar degree of sensitivity to AV-17 as evaluated by the live/dead assay. The subcultured bovine RPE cells can therefore serve as a flexible alternative to primary RPE cells for viability studies. However, the extent of differentiation was more compromised in the subcultured RPE cells after dye treatment, as determined by the upregulation of KRT19. Expression of the tight junction protein ZO-1 also remained weak in most of the subcultured RPE cells (data not shown), suggesting that the establishment of tight junctions requires a longer period after cell detachment and reattachment, possibly due to the loss of junctional components from the membrane after protease treatment. For evaluating the differentiation state of RPE cells in response to dye exposure, we therefore recommend the use of primary RPE cells to simulate the normal in vivo conditions. However, the subcultured RPE cells may also provide valuable information on the response of already slightly compromised RPE cells in a pathological environment.
In this study, RPE cells were incubated for 30 seconds and 5 minutes with different concentrations of the dye. These time periods were selected to simulate the surgical conditions during which the dye is applied. Our results demonstrated that the exposure to 0.125 mg/mL AV-17 or solvent for 30 seconds and 5 minutes did not result in any signs of toxicity as determined by the live/dead assay and CASP3 cleavage. However, the MTT assay demonstrated a slight decrease of ~18% in mitochondrial activity after a 30-second exposure to 0.125 and 0.25 mg/mL AV-17. This decrease became significant with 0.5 mg/mL of the dye, whereas only the exposure to 0.0625 mg/mL AV-17 or solvent appeared to be well tolerated according to the MTT assay. Our findings were consistent with the results of a former study on ARPE-19 cells, which demonstrated a significant decrease of ~25% in the absorbance values determined by the MTT test after 3-minute exposure to 0.25 and 0.5 mg/mL AV-17. Likewise, the dye at the concentrations of 0.05 and 0.005 mg/mL were well tolerated, with a reduction of <5% in the absorbance values.13 Interestingly, other groups evaluating the biocompatibility of vital dyes also reported more damage with the MTT assay than was seen with light and electron microscopy, suggesting that the dyes may have a greater effect on mitochondrial function.27–29 However, the remnants of the dye could also have interfered with the MTT assay, resulting in a dose-dependent reduction in the absorbance values.
We have previously demonstrated that the 5-minute exposure to 0.125 mg/mL AV-17 or the solvent was well tolerated in bovine retinal cells.8 Here, we report that the exposure to AV-17 at higher concentrations not only reduces viability but also triggers the dedifferentiation of RPE cells by compromising the integrity of cellular junctions and the organization of actin cytoskeleton. Our findings are also mainly in accordance with the results of a previous study on the retinal biocompatibility of AV-17, which was reported to be superior to TB and ICG. However, contrary to our findings, good biocompatibility was stated even for the concentration of 0.5 mg/mL.7 In the former study, the dye was applied into the vitreous humor. The discrepancy between the results might therefore have resulted from the protective effects of the vitreous humor, which was described in detail for the drug triamcinolone.30–32
AV-17 belongs to the same group of substances, the trityl dyes, such as BBG and PB. Therefore, the staining of ILM at the suggested concentrations could be applicable. A recent study demonstrated that 3-minute exposure of vitrectomized cadaveric eyes to 0.05 mg/mL of AV-17 enabled the distinction of ILM from the underlying retina with a high degree of contrast and facilitated the surgical peeling of ILM.13 The efficacy of AV-17 to stain ILM at this low concentration together with our findings therefore underline the potential of AV-17 as a novel alternative for vital dyes in vitreoretinal surgery.
Conclusion
The application of AV-17 at a concentration under 0.125 mg/mL in a D2O-carrying solvent appears safe for intraocular administration and RPE changes or atrophy are unlikely to occur in case AV-17 migrates into the subretinal space. Nevertheless, similar to the intraocular application of BBG, restricting the time the retina is exposed to this dye would be recommended to avoid adverse effects. The in vivo staining characteristics and acceptance of a new formulation of AV-17/D2O in clinical practice also need to be established.
Acknowledgment
This study was supported by Fluoron GMBH (Neu-Ulm, Germany; grant number: KF2335702UL9).
Disclosure
AT and AA received financial support from Fluoron GMBH. The authors report no other conflicts of interest in this work.
References
Rodrigues EB, Maia M, Meyer CH, Penha FM, Dib E, Farah ME. Vital dyes for chromovitrectomy. Curr Opin Ophthalmol. 2007;18(3):179–187. | ||
Al-Halafi AM. Chromovitrectomy: update. Saudi J Ophthalmol. 2013;27(4):271–276. | ||
Cheng SN, Yang TC, Ho JD, Hwang JF, Cheng CK. Ocular toxicity of intravitreal indocyanine green. J Ocul Pharmacol Ther. 2005;21(1):85–93. | ||
Haritoglou C, Gandorfer A, Gass CA, Schaumberger M, Ulbig MW, Kampik A. Indocyanine green-assisted peeling of the internal limiting membrane in macular hole surgery affects visual outcome: a clinicopathologic correlation. Am J Ophthalmol. 2002;134(6):836–841. | ||
Kanda S, Uemura A, Yamashita T, Kita H, Yamakiri K, Sakamoto T. Visual field defects after intravitreous administration of indocyanine green in macular hole surgery. Arch Ophthalmol. 2004;122(10):1447–1451. | ||
Lüke C, Lüke M, Dietlein TS, et al. Retinal tolerance to dyes. Br J Ophthalmol. 2005;89(9):1188–1191. | ||
Cardoso EB, Moraes-Filho M, Rodrigues EB, et al. Investigation of the retinal biocompatibility of acid violet for chromovitrectomy. Graefes Arch Clin Exp Ophthalmol. 2013;251(4):1115–1121. | ||
Tura A, Alt A, Haritoglou C, et al. Testing the effects of the dye acid violet-17 on retinal function for an intraocular application in vitreo-retinal surgery. Graefes Arch Clin Exp Ophthalmol. 2014;252(12):1927–1937. | ||
Saeed MU, Heimann H. Atrophy of the retinal pigment epithelium following vitrectomy with trypan blue. Int Ophthalmol. 2009;29(4):239–241. | ||
Czajka MP, McCuen BW 2nd, Cummings TJ, Nguyen H, Stinnett S, Wong F. Effects of indocyanine green on the retina and retinal pigment epithelium in a porcine model of retinal hole. Retina. 2004;24(2): 275–282. | ||
Jain S, Kishore K, Sharma YR. Progressive atrophy of retinal pigment epithelium after trypan-blue-assisted ILM peeling for macular hole surgery. Indian J Ophthalmol. 2013;61(5):235–237. | ||
Arevalo JF, Garcia RA. Macular hole surgery complicated by accidental massive subretinal indocyanine green, and retinal tear. Graefes Arch Clin Exp Ophthalmol. 2007;245(5):751–753. | ||
Penha FM, Pons M, Costa EF, et al. Retinal pigmented epithelial cells cytotoxicity and apoptosis through activation of the mitochondrial intrinsic pathway: role of indocyanine green, brilliant blue and implications for chromovitrectomy. PLoS One. 2013;8(5):e64094. | ||
Bonilha VL. Retinal pigment epithelium (RPE) cytoskeleton in vivo and in vitro. Exp Eye Res. 2014;126:38–45. | ||
Fuhrmann S, Zou C, Levine EM. Retinal pigment epithelium development, plasticity, and tissue homeostasis. Exp Eye Res. 2014;123:141–150. | ||
Sparrow JR, Hicks D, Hamel CP. The retinal pigment epithelium in health and disease. Curr Mol Med. 2010;10(9):802–823. | ||
Chiba C. The retinal pigment epithelium: an important player of retinal disorders and regeneration. Exp Eye Res. 2014;123:107–114. | ||
Burke JM. Epithelial phenotype and the RPE: is the answer blowing in the Wnt? Prog Retin Eye Res. 2008:27(6):579–595. | ||
Kernt M, Hirneiss C, Wolf A, et al. Indocyanine green increases light-induced oxidative stress, senescence, and matrix metalloproteinases 1 and 3 in human RPE cells. Acta Ophthalmol. 2012;90(6):571–579. | ||
Arndt C, Meunier I, Rebollo O, Martinenq C, Hamel C, Hattenbach LO. Electrophysiological retinal pigment epithelium changes observed with indocyanine green, trypan blue and triamcinolone. Ophthalmic Res. 2010;44(1):17–23. | ||
Takayama K, Sato T, Karasawa Y, Sato S, Ito M, Takeuchi M. Phototoxicity of indocyanine green and Brilliant Blue G under continuous fluorescent illumination on cultured human retinal pigment epithelial cells. Invest Ophthalmol Vis Sci. 2012;53(11):7389–7394. | ||
Casaroli-Marano RP, Pagan R, Vilaró S. Epithelial-mesenchymal transition in proliferative vitreoretinopathy: intermediate filament protein expression in retinal pigment epithelial cells. Invest Ophthalmol Vis Sci. 1999;40(9):2062–2072. | ||
Edwards RB. The isolation and culturing of retinal pigment epithelium of the rat. Vision Res. 1981;21(1):147–150. | ||
Boulton ME, Marshall J, Mellerio J. Human retinal pigment epithelial cells in tissue culture: a means of studying inherited retinal diseases. Birth Defects Orig Artic Ser. 1982;18(6):101–118. | ||
Tura A, Grisanti S, Petermeier K, Henke-Fahle S. The Rho-kinase inhibitor H-1152P suppresses the wound-healing activities of human Tenon’s capsule fibroblasts in vitro. Invest Ophthalmol Vis Sci. 2007;48(5):2152–2161. | ||
Sonoda S, Spee C, Barron E, Ryan SJ, Kannan R, Hinton DR. A protocol for the culture and differentiation of highly polarized human retinal pigment epithelial cells. Nat Protoc. 2009;4(5):662–673. | ||
Jackson TL, Hillenkamp J, Knight BC, et al. Safety testing of indocyanine green and trypan blue using retinal pigment epithelium and glial cell cultures. Invest Ophthalmol Vis Sci. 2004:45(8):2778–2785. | ||
Jackson TL, Vote B, Knight BC, El-Amir A, Stanford MR, Marshall J. Safety testing of infracyanine green using retinal pigment epithelium and glial cell cultures. Invest Ophthalmol Vis Sci. 2004;45(10):3697–3703. | ||
Sippy BD, Engelbrecht NE, Hubbard GB, et al. Indocyanine green effect on cultured human retinal pigment epithelial cells: implications for macular hole surgery. Am J Ophthalmol. 2001;132(3):433–435. | ||
Szurman P, Kaczmarek R, Spitzer MS, et al. Differential toxic effect of dissolved triamcinolone and its crystalline deposits on cultured human retinal pigment epithelium (ARPE19) cells. Exp Eye Res. 2006;83(3):584–592. | ||
Szurman P, Sierra A, Kaczmarek R, et al. Different biocompatibility of crystalline triamcinolone deposits on retinal cells in vitro and in vivo. Exp Eye Res. 2007;85(1):44–53. | ||
Spitzer MS, Mlynczak T, Schultheiss M, et al. Preservative-free triamcinolone acetonide injectable suspension versus “traditional” triamcinolone preparations: impact of aggregate size on retinal biocompatibility. Retina. 2011;31(10):2050–2057. |
 © 2016 The Author(s). This work is published and licensed by Dove Medical Press Limited. The full terms of this license are available at https://www.dovepress.com/terms.php and incorporate the Creative Commons Attribution - Non Commercial (unported, v3.0) License.
By accessing the work you hereby accept the Terms. Non-commercial uses of the work are permitted without any further permission from Dove Medical Press Limited, provided the work is properly attributed. For permission for commercial use of this work, please see paragraphs 4.2 and 5 of our Terms.
© 2016 The Author(s). This work is published and licensed by Dove Medical Press Limited. The full terms of this license are available at https://www.dovepress.com/terms.php and incorporate the Creative Commons Attribution - Non Commercial (unported, v3.0) License.
By accessing the work you hereby accept the Terms. Non-commercial uses of the work are permitted without any further permission from Dove Medical Press Limited, provided the work is properly attributed. For permission for commercial use of this work, please see paragraphs 4.2 and 5 of our Terms.