")
Back to Journals » Diabetes, Metabolic Syndrome and Obesity » Volume 14
Biochanin A Regulates Cholesterol Metabolism Further Delays the Progression of Nonalcoholic Fatty Liver Disease
Authors Fan Y, Yan LT, Yao Z, Xiong GY
Received 12 April 2021
Accepted for publication 23 June 2021
Published 9 July 2021 Volume 2021:14 Pages 3161—3172
DOI https://doi.org/10.2147/DMSO.S315471
Checked for plagiarism Yes
Review by Single anonymous peer review
Peer reviewer comments 2
Editor who approved publication: Professor Ming-Hui Zou
Yan Fan,1,* Long-Teng Yan,2,* Zheng Yao,2 Guang-Yi Xiong2
1Department of Anatomy, Histology, and Embryology, School of Basic Medical Science, Kunming Medical University, Kunming, Yunnan, 650500, People’s Republic of China; 2Key Laboratory of Microcosmic Syndrome Differentiation, School of Basic Medicine, Yunnan University of Chinese Medicine, Kunming, Yunnan, 650500, People’s Republic of China
*These authors contributed equally to this work
Correspondence: Zheng Yao; Guang-Yi Xiong
Key Laboratory of Microcosmic Syndrome Differentiation, School of Basic Medicine, Yunnan University of Chinese Medicine, No. 1076, Yuhua Road, Chenggong District, Kunming, Yunnan, 650500, People’s Republic of China
Tel/Fax +86 189 0871 9365
Email [email protected]; [email protected]
Purpose: To discover the possible target of biochanin A (BCA) in the lipid metabolism pathway and further explore its mechanism to nonalcoholic fatty liver disease (NAFLD).
Methods: We adopted a high-fat and high-glucose diet for 12 weeks to build the NAFLD rat model, which was then treated with different proportions of BCA for 4 weeks. General condition, body weight, Lee index, and liver index were then evaluated. Furthermore, blood lipid level and insulin resistance (IR) were detected. Moreover, hematoxylin and eosin and oil red O staining were used to observe the pathological changes in the liver. Finally, Western blotting was used to detect the protein expression levels of CYP7A1, HMGCR, LDLR, PPAR-α, PPAR-γ, and SREBP-1c in the liver.
Results: The vital signs of rats in each group were stable. The treatment with BCA effectively reduced Lee index and liver index (F = 104.781, P < 0.05); however, the weight was not effected in each group. Additionally, BCA effectively reduced the related lipid metabolism indexes of NAFLD, such as total cholesterol (TC), triglyceride (TG), low-density lipoprotein (LDL), blood glucose, insulin, IR (F =12.463 (TC), 6.909 [TG], and 15.3 effected 75 [LDL], P < 0.05), and increased HDL (F = 11.580, P < 0.05). We observed that BCA could significantly improve steatosis and inflammatory cell infiltration in liver slices. Furthermore, BCA significantly increased the CYP7A1, LDLR, and PPAR-α protein expression in the liver and downregulated the HMGCR, SREBP-1c, and PPAR-γ protein expression.
Conclusion: BCA could delay the liver damage of NAFLD induced by a high-fat diet, regulate the blood lipid level, and improve the expression of lipid metabolism-related genes in rats.
Keywords: biochanin A, nonalcoholic fatty liver disease, NAFLD, cholesterol metabolism
Introduction
At present, the incidence of nonalcoholic fatty liver disease (NAFLD) is increasing annually.1 According to literature, the incidence of NAFLD increased to 30% in Europe and 20%–30% in Asia.2,3 This disease refers to a clinical-pathologic syndrome characterized by liver steatosis in addition to alcohol and other definite liver damage factors. Its disease spectrum includes nonalcoholic steatohepatitis, liver fibrosis, liver cirrhosis, and hepatocellular carcinoma.4 Therefore, the prompt treatment of NAFLD is warranted. A patient is prone to serious consequences, such as abnormal glucose, lipid metabolism, liver fibrosis, and loss of liver cell function, if the NAFLD is not well controlled.5 However, thus far, no specific drugs that treat this disease in clinical practice are available. Therefore, it is necessary to focus on the mechanism of NAFLD and further develop corresponding medicines.
The “second hit” doctrine is the classical hypothesis of the pathogenesis of NAFLD,6 wherein insulin resistance (IR) can cause lipid accumulation in the liver, which is “the first hit,” whereas oxidative stress and lipid peroxidation further trigger a second blow to the liver, which is “the second hit.” The theory of the “second hit” was gradually replaced with the proposal of “multiple strikes.”7 However, lipid metabolism disorder is key in both “second hit” and “multiple hit,” and cholesterol metabolism is vital in lipid metabolism disorder.8 Therefore, a comprehensive study of cholesterol synthesis, absorption, and excretion is necessary. For cholesterol synthesis, the primary regulatory proteins are sterol regulating element-binding protein (SREBP) and 3-Hydroxy-3-methylglutaryl-coenzyme A reductase (HMGCR).9 For cholesterol absorption, it is primarily achieved through the endocytosis of exogenous cholesterol by low-density lipoprotein receptor (LDLR) and peroxisome proliferator-activated receptor (PPAR).10 The excretion of cholesterol is primarily through the bile acid pathway, which is regulated by cholesterol 7α-hydroxylase (CYP7A1).11 If medicine can regulate the expression of the aforementioned proteins, it can effectively reduce the liver fat content. Biochanin A (BCA) is an ox methylated isoflavone compound (Figure 1 shows the structure of BCA).12 It is widely presented in some edible plants, such as soybeans, red clover, alfalfa, peanuts, chickpeas, etc.13 The molecule structure of BCA is similar to that of animal estrogen; therefore, it can competitively bind to estrogen receptors to play an estrogen-like effect.14 In addition, it is an important phytoestrogen and has several beneficial effects on human and animal health.15 It can be used for bone quality and the prevention or treatment of diseases, such as porosity and menopausal syndrome.16 In addition, it has antitumor, anti-inflammatory, antibacterial, hypoglycemic, antioxidant, neuroprotective, and other pharmacological effects.17 Studies have found that BCA has a significant effect on lowering blood lipids and is particularly closely related to isoflavones.18 However, those studies did not elaborate on its effect on cholesterol and its regulation mechanism.
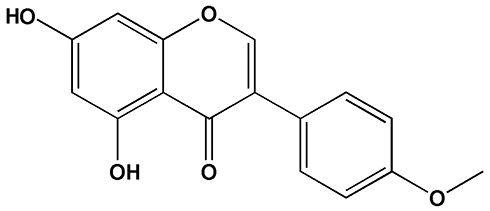 |
Figure 1 The structure of biochanin A. |
Therefore, our study aimed to construct a NAFLD rat model and use BCA to intervene. Moreover, it aimed to further clarify whether BCA has a therapeutic effect on this disease. Furthermore, this study aimed to observe the three pathways of cholesterol synthesis, absorption, and excretion related to the enzyme protein expression characteristics of CYP7A1, HMGCR, LDLR, PPAR-α, PPAR-γ, and SREBP-1c.
Materials and Methods
Experimental Materials
BCA was purchased from the Shaanxi Yongyuan Biotechnology Co., Ltd. (CAS: 491–80-5, Xi’an, China). The following are the characteristics of the experimental animals: 68 male clean Sprague Dawley rats, weighing 150–170 g, purchased from the SPF Animal Laboratory Center of Kunming Medical University (animal certificate number SCXK [Dian]-2015-0002). Animals were also managed in SPF experimental requirements. The following were the feeding conditions: 12/12 hours light–dark cycle, 22°C–25°C temperature, 50% ± 10% humidity, and free food and water intake. Ordinary feed fat, protein, and carbohydrate calories accounted for 10%, 14.1%, and 75.9%, respectively, whereas high-fat feed fat, protein, and carbohydrate calories accounted for 45%, 14.1%, and 40.9%, respectively. The feed was purchased from the Nantong Trofe Feed Technology Co., Ltd (Nantong, China).
Animals and Grouping
After purchasing the rats, they were fed with ordinary feed and adaptively reared for 1 week. The rats were then randomly divided into five groups: normal diet group (ND, n = 16), high-fat diet group (HFD, n = 16), high-fat diet + BCA 10 mg/kg group (HFD + 10 mg/kg BCA, n = 12), high-fat diet + BCA 20 mg/kg group (HFD + 20 mg/kg BCA, n = 12), and high-fat diet + BCA group (HFD + 40 mg/kg BCA, n = 12). The following was the criteria for successful modeling, which was implemented at 10 am every day: after a 12-week high-fat feed, four rats in the ND and HFD groups were randomly selected and sacrificed; their liver oil red O staining showed several fatty vacuoles, and liver function was abnormal. After implementing the criteria, each intervention group was treated by intragastric administration. The rats in the ND and HFD groups were administered with the same amount of normal saline in other intervention groups by gavage. The treatment time was 4 weeks. After 4 weeks, all rats in each group were sacrificed for follow-up experiments. All animal experimentation procedures were performed according to the Chinese Guidelines for Animal Care (Published by Chinese Society of Laboratory Animals), which comply with the internationally accepted uses of experimental animals, and the protocols were reviewed and approved by the Animal Experiment Ethics Committee of the Yunnan University of Chinese Medicine.
Animal Growth Indicators
General Indicators for Monitoring Animals
The feed was weighed daily and the amount of drinking water was recorded. Furthermore, the hair, activity, fecal volume, and death of rats in each experimental group were observed.
Animal Weight Change and Lee Index
The weight of the rats was regularly measured every week for each experimental group, and the weight change data were recorded. When the rats were sacrificed, the body length of the rats was measured and recorded, and the Lee index of the experimental rats was calculated according to the formula: Lee index = ∛(weight × 1000)/body length (cm).
Liver Index
When the rats were sacrificed, they were anesthetized with sodium pentobarbital, and the liver was subsequently weighed. The following formula was used to calculate the rat liver index: liver index = liver weight/body weight.
Liver Function and Blood Lipids
The day before the death, blood was collected from the abdominal vena cava and stored at room temperature for 2 hours. After the blood coagulated, it was centrifuged at 4°C and 3000 r/min for 20 min. Then, the upper serum was collected, aliquoted, and frozen in a refrigerator at 20°C. Enzyme-linked immunosorbent assay kit was used to detect the levels of aspartate aminotransferase (AST; ml059334, Shanghai Enzyme Link Biotechnology Co., Ltd., Shanghai, China), alanine aminotransferase (ALT; ml059335, Shanghai Enzyme Link Biotechnology Co., Ltd.), total cholesterol (TC; A111-2-1, Nanjing Jiancheng Institute of Biological Engineering, Nanjing, China), triglycerides (TG; A110-2-1, Nanjing Jiancheng Institute of Biological Engineering), high-density lipoprotein (HDL; ml037095, Shanghai Enzyme Link Biotechnology Co., Ltd.), and low-density lipoprotein (LDL; ml037144, Shanghai Enzyme-Linked Biotechnology Co., Ltd.) of the rats.
Detection of Blood Glucose and IR Levels in Rats
Rat Abdominal Glucose Tolerance Test
The rats were made to fast without water for 24 hours. First, blood was collected from the tail vein using a Roche blood glucose meter to detect the fasting blood glucose level of the rats. A 50% glucose solution was then intraperitoneally injected into the rat at a dose of 2 g/kg. The blood from the tail vein of the rat was extracted at 0, 1, 2, 3, and 4 hours, and the blood glucose levels were rapidly detected using a Sannuo blood glucose meter (GA3, Sannuo Biosensor Co., Ltd., Changsha, China).
Rat Serum Insulin Test
We used enzyme-linked immunosorbent assay kit operating instructions to detect serum insulin levels in rats.
Homeostatic Model Assessment (HOMA)-IR
We assessed the level of IR according to the results of blood glucose experiments using the formula to calculate the homeostatic model assessment of IR: (insulin [m IU/L] × fasting blood glucose [mmol/L] ÷ 22.5).
Pathological Examination (Hematoxylin and Eosin [HE] and Oil Red Staining)
A small piece of liver tissue was sliced, soaked in 4% neutral formalin buffer for 24 hours, washed with purified water, and then dehydrated. After processing and embedding with paraffin, the tissue was cut to a thickness of 5 μm and stained with conventional HE.
Oil red O staining was used to observe the accumulation of triglycerides in the liver. The images were collected using an ordinary optical microscope (Olympus, Tokyo, Japan), and four different fields of view were selected for each image.
Detection of Protein Expression
Proteins were extracted from liver tissues by using a solution of PMSF and RIPA buffer. A bicinchoninic acid protein quantification kit (Thermo Scientific, Waltham, Massachusetts, USA) was used to measure the protein concentration. Western blotting was performed as previously described. The primary antibodies included antibodies SREBP-1c (sc-366, Santa Cruz Biotechnology, Dallas, Texas, USA), CYP7A1 (sc-25536, Santa Cruz Biotechnology), HMGCR (sc-271595, Santa Cruz Biotechnology), LDLR (sc-18823, Santa Cruz Biotechnology), PPAR-α (sc-1985, Santa Cruz Biotechnology), PPAR-γ (sc-7196, Santa Cruz Biotechnology), and glyceraldehyde-3-phosphate dehydrogenase (sc-59540, Santa Cruz Biotechnology). Goat antirabbit IgG (HRP) (ZB2301, Beijing Zhongshan Golden Bridge Biotechnology Co., Ltd., Beijing, China) was used as the secondary antibody. The membranes were scanned with an enhanced chemiluminescence system (Protein Simple, Santa Clara, CA, USA).
Statistical Analysis
Data obtained are expressed as means ± standard deviations ( ± SD). SPSS 22.0 software (SAS Institute Inc., Cary, North Carolina, USA) was used according to the type of data. Data were analyzed using repeated-measures analysis of variance. A P value of < 0.05 was considered statistically significant.
Results
Living Conditions of Rats
Throughout the experiment, the vital signs of the rats in each group were stable The rats in the HFD group had yellowish, dim, and decreased mobility. The rats in other groups had smooth coat color and normal mobility. The dietary intake in each group was approximately 20–30 g/day, and no significant difference in water intake was noted. During the breeding period, no accidental deaths were observed.
After feeding with an HFD for 12 weeks, the oil red staining of liver slices revealed that the livers in the ND group had no fat infiltration, whereas those of the HFD group were diffused with a large amount of fat. In addition, the HFD group showed a significantly higher liver function (AST and ALT) than the ND group, indicating that the NAFLD model was successfully constructed. The results are shown in Figure 2.
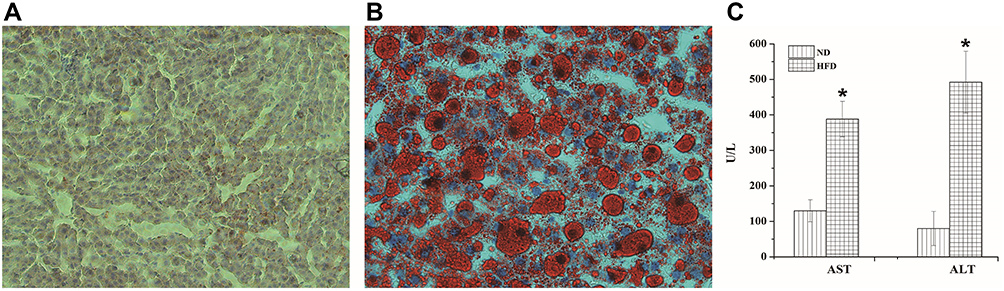 |
Figure 2 Evaluation of the HFD-induced NAFLD mice. (A) Histological sections of liver tissues of the ND group. (B) Histological sections of liver tissues of the HFD group (stained with oil red O and ×400). (C) The liver function indexes (AST and ALT); *P < 0.05 for the comparison between the ND and HFD groups. |
Results of Rat’s Body Weight, Lee Index, and Liver Index
The initial weight of the rats was approximately 160–170 g, and no significant difference was noted. Under different intervention conditions, the weight of the rats significantly changed; the weight of the rats in the HFD group increased by ~400 g, whereas in the ND group, it increased by ~300 g, which is the most significant (F = 6.659, P < 0.05). Although the three treatment groups had a certain degree of reduction, no significant difference with the rats in the HFD group was observed. The results are shown in Figure 3A.
After 4 weeks of intervention in each group, the Lee index was calculated according to the weight and length of the rats. The results showed that the Lee index was the highest in the HFD group and the lowest in the ND group. The three dose groups of HFD + BCA were significantly lower in the HFD group, and the difference was statistically significant (F = 104.781, P < 0.05). The results are shown in Figure 3B.
The liver index results showed significant differences between the HFD and the ND groups (P = 0.013, P < 0.05). In addition, the three BCA intervention groups were significantly lower in the HFD group (F = 10.232, P < 0.05). The results are shown in Figure 3C.
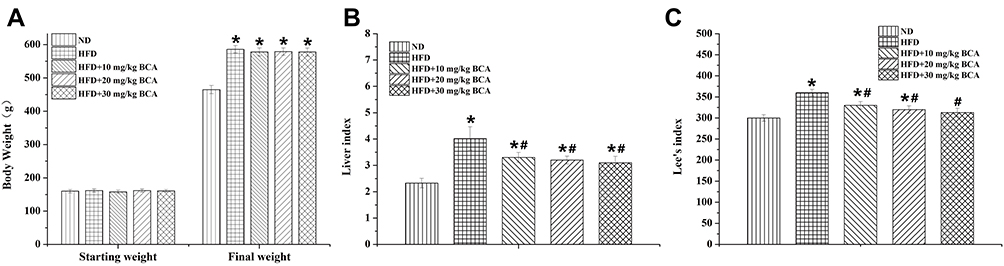 |
Figure 3 Results of rat’s body weight, Lee index, and liver index. Results of the rat’s (A) body weight, (B) liver index, and (C) Lee index. *P < 0.05 for the comparison between the ND and HFD groups; #P < 0.05 for the comparison between the treatment and HFD groups. |
The Rat Liver Functions and Blood Lipid Test Results
After the 4-week treatment, the AST, ALT, TC, TG, LDL, and HDL levels were evaluated. The results are shown in Figure 4. Among them, the AST, ALT, TC, TG, and LDL levels in the HFD group were significantly higher than those in the ND group (P = 0.003 [AST], 0.005 [ALT], 0.013 [TC], 0.010 [TG], and 0.008 [LDL], P < 0.05), whereas the HDL level was significantly reduced (P = 0.042, P < 0.05). After treatment, the AST, ALT, TC, TG, and LDL levels were significantly lowered to varying degrees (F = 17.287 [AST], 29.862 [ALT], 12.463 [TC], 6.909 [TG], and 15.375 [LDL], P < 0.05), whereas the HDL level was increased (F = 11.580, P < 0.05). The HFD + 40 mg/kg BCA group had the most significant effect.
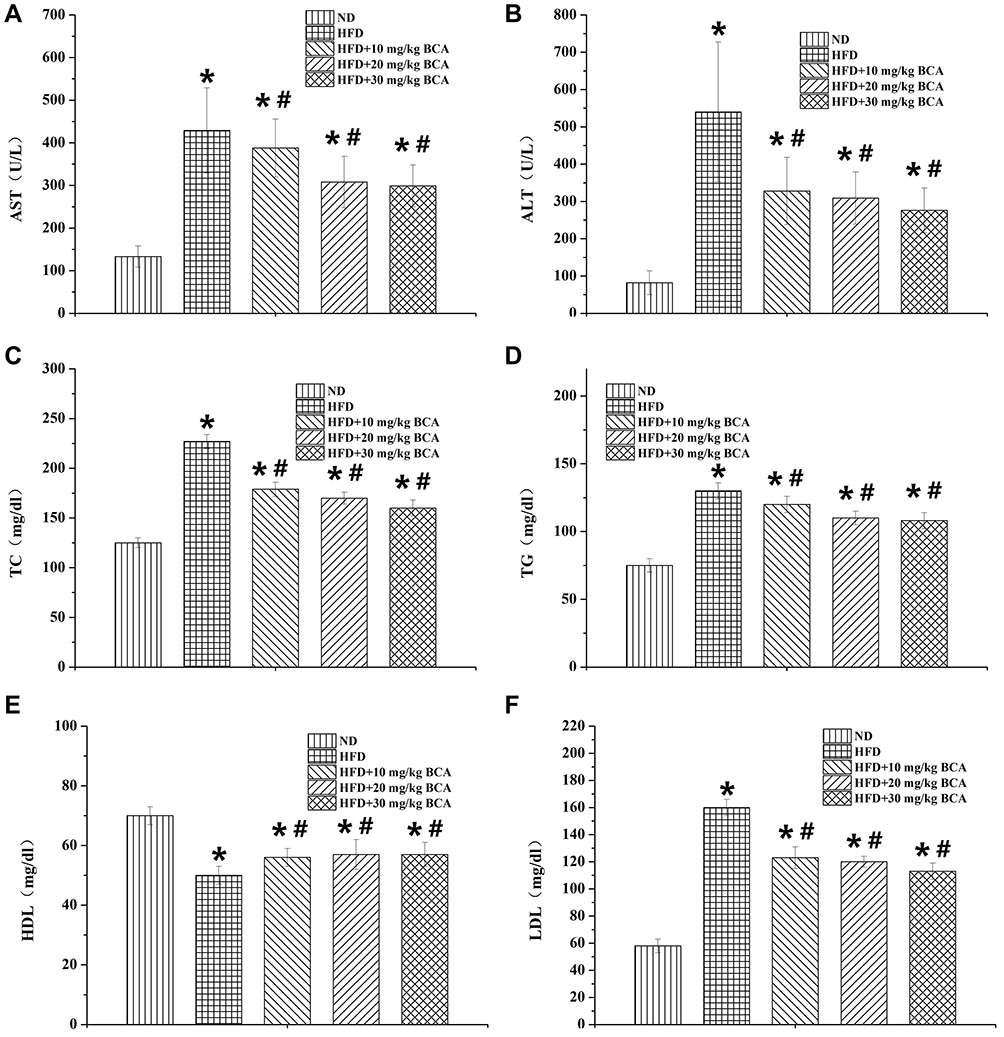 |
Figure 4 The rat liver functions and blood lipid test results. (A) The AST, (B) ALT, (C) TC, (D) TG, (E) HDL, and (F) LDL of the rats. *P < 0.05 for the comparison between the NC and HFD groups; #P < 0.05 for the comparison between the treatment and HFD groups. |
The Rat Blood Glucose and IR
The rats in the HFD group had a significantly increased fasting blood glucose level compared with those in the ND group (P = 0.032, P < 0.05), whereas those in the ND group had a significantly lower fasting blood glucose than those in the HFD group (F = 47.334, P < 0.05). The results are shown in Figure 5A.
The glucose tolerance experiment of the rats in each group is shown in Figure 5B. In the observation period of 0–4 hours, the HFD group had a significantly higher glucose tolerance than the ND group (P = 0.006, P < 0.05), whereas the BCA group had a significantly lower glucose tolerance than the HFD group (F = 52.104, P < 0.05).
Figure 5C and D show that the HFD group has a significantly higher insulin and IR index than the ND group (P = 0.012 [insulin] and 0.008 [IR index], P < 0.05), whereas BCA could be significantly reduced (F = 42.000 [insulin] and 38.313 [IR index], P < 0.05).
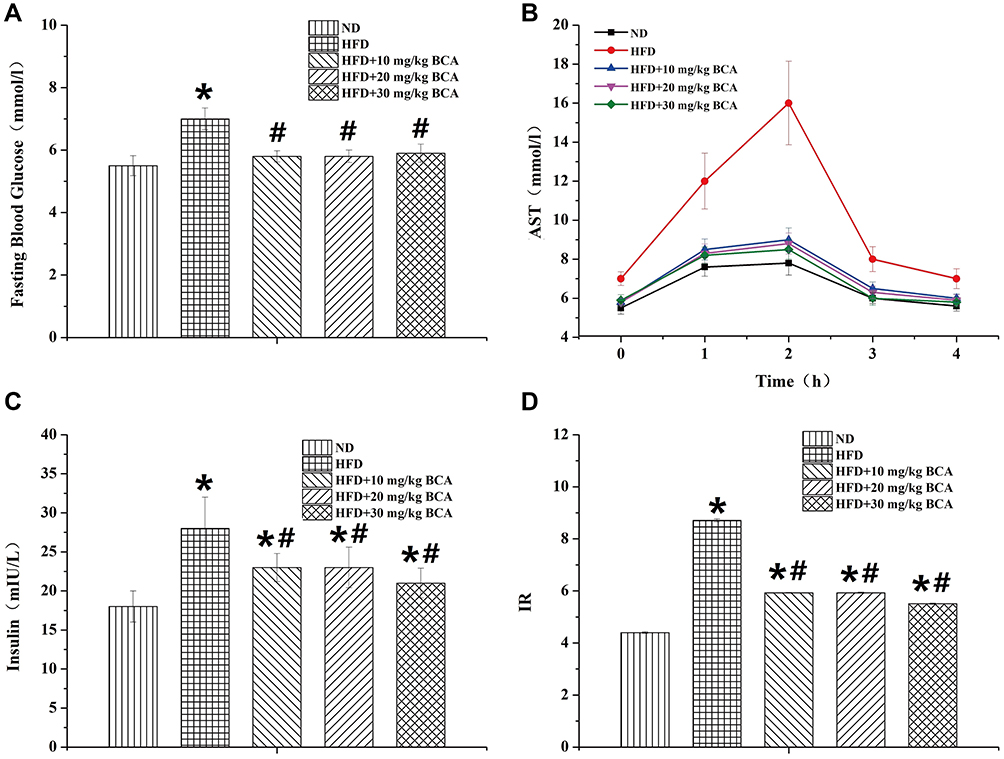 |
Figure 5 Rat blood glucose and insulin resistance. (A) The fasting blood glucose, (B) AST, (C) insulin, and (D) IR of the rats. *P < 0.05 for the comparison between the ND and HFD groups; #P < 0.05 for the comparison between the treatment and HFD groups. |
The Results of HE and Oil Red O Staining
Liver cells and lobules of the rats in the ND group (Figure 6A) were found to have a clear and complete structure, with no lipid infiltration. However, the rats in the HFD group (Figure 6B) showed obvious steatosis, severe lipid infiltration, fatty vacuoles, disappearance of the liver lobule structure, and inflammatory cell infiltration. BCA could reduce lipid and inflammatory cell infiltration (Figure 6C–E). The HFD + 20 mg/kg BCA (Figure 6D) and HFD + 40 mg/kg BCA groups (Figure 6E) recovered a part of the liver lobule structure, of which the HFD + 40 mg/kg BCA group had the best improvement effect.
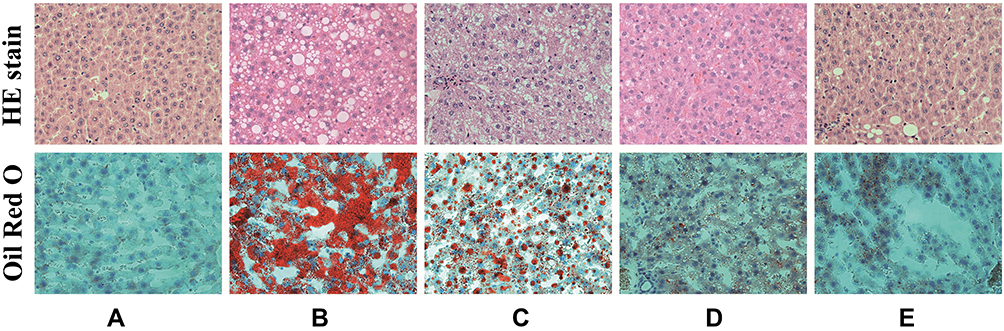 |
Figure 6 The liver HE and oil red O staining (×400). (A–E) correspond to the ND, HFD, HFD + 10 mg/kg BCA, HFD + 20 mg/kg BCA, and HFD + 40 mg/kg BCA groups, respectively. |
The Changes of Lipid Metabolism-Related Proteins
The expression of HMGCR and SREBP-1C proteins in the model group was significantly increased compared with that of the ND group, whereas the three dose groups of BCA significantly reduced their expression, as shown in Figure 7A and 7B. The expression of LDLR in the model group was significantly increased compared with that of the ND group. Moreover, the expression of LDLR in the BCA group was further increased compared with that of the model group, as shown in Figure 7C.
The expression of PPAR-α in the HFD group was significantly reduced compared with that of the ND group, whereas in the BCA intervention groups, the expression of PPAR-α increased compared with that of the HFD group, as shown in Figure 7D.
In addition, the expression of PPAR-γ protein in the liver of the rats in the HFD group was significantly increased compared with that of the NC group; moreover, the BCA intervention group decreased the expression of PPAR-γ, as shown in Figure 7E.
The expression of CYP7A1 in the liver of the rats in the HFD group was significantly reduced compared with that of the ND group; the BCA group had different degrees of increase, as shown in Figure 7F.
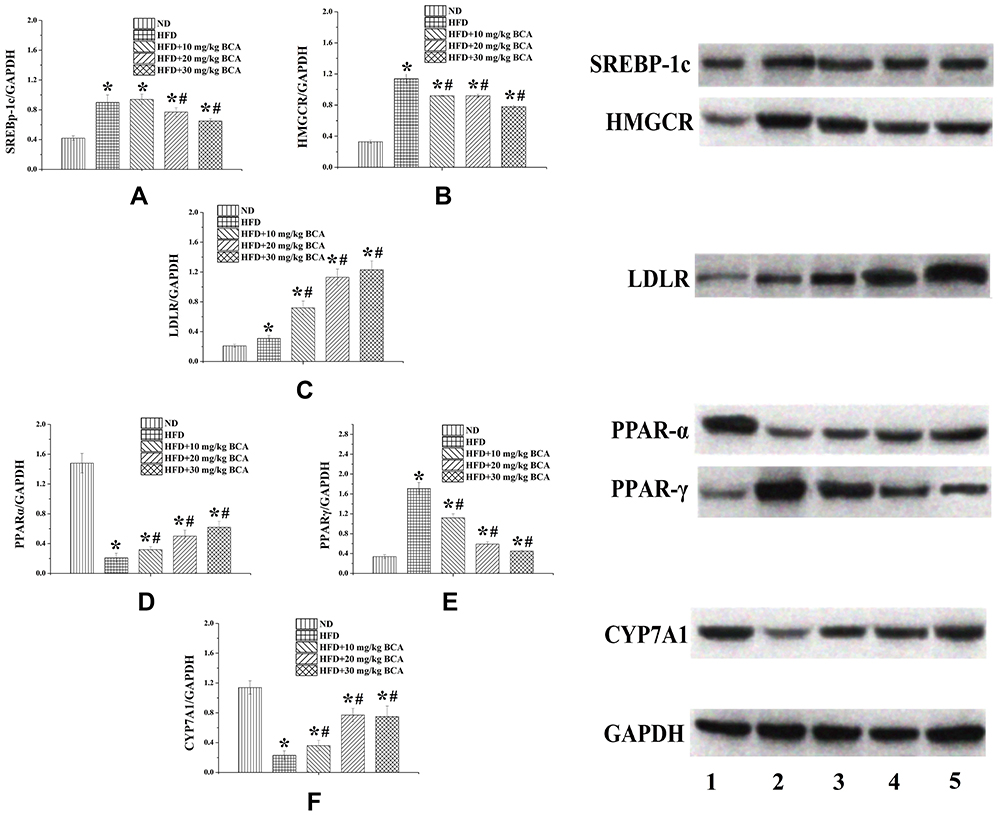 |
Figure 7 Protein expression levels of SREBP-1c, HMGCR, LDLR, PPAR-α, PPAR-γ, and CYP7A1 in the livers of the rats. Protein expression levels of (A) SREBP-1c, (B) HMGCR, (C) LDLR, (D) PPAR-α, (E) PPAR-γ, and (F) CYP7A1 in the livers of the rats. *P < 0.05 for the comparison between the ND and HFD groups; #P < 0.05 for the comparison between the treatment and HFD groups. |
Discussion
At present, the following are the three most common methods for building the NAFLD model:19 the HFD construction method, the feed-feeding type that lacks methionine and choline, and the genetically modified rat or mouse model. The feed-feeding type lacks methionine and choline and the genetically modified rat or mouse model type are suitable for observing specific drugs or signal pathways;20 however, they are expensive, and thus not widely promoted. NAFLD rats induced by HFD are cheap and effective in basic research. In general, this method is fanatical to better replicate the disease spectrum of human NAFLD.21 Hence, we adopted a HFD for 12 consecutive weeks. It can be seen from liver oil red staining, AST, and ALT that this study successfully established the NAFLD rat model, which ensures the reliability of subsequent drug observations.
Lee index, body weight, and liver/body ratio are one type of core indicator for evaluating drugs that can improve lipid metabolism in rats.22,23 Lee index and liver index are similar to the human body mass index.24 At present, they are used to evaluate obesity and visceral properties. Results revealed that HFD significantly increased the body weight, liver weight, and Lee index in rats. This suggests that HFD can cause obesity in the body while acting on the liver to make lipids in the body, which accumulates and causes visceral obesity. BCA can effectively improve the degree of obesity in the body and internal organs of rats. However, the results found that the weight did not significantly change; the specific reasons still need to be further explored. However, results that BCA may become a novel way to improve NAFLD can be evaluated.
Abnormal liver function and blood lipids are the primary features of NAFLD, and the elevation of AST and ALT levels can directly reflect the signs of liver damage.25 In this study, it can be noted from the NAFLD rats induced by HFD that the serum liver function indicators, such as AST and ALT, as well as blood lipids, such as TC, TG, and LDL levels, were significantly higher than those in the NC group, whereas the blood lipid HDL levels were significantly lower than those in the NC group. By applying the BCA intervention to the NAFLD rats, the blood lipid levels were reduced and the liver function was improved. Furthermore, there are several studies on the ability of BCA to improve liver function and blood lipids. For example, H Park and colleagues26 used a HFD to construct an obese mouse model and found that after intervention with BCA, hepatic steatosis and IR were improved by regulating the hepatic lipid and glucose metabolic pathways. In addition, Z Xue and colleagues27 used a HFD to construct an obese mouse model. After intervention with BCA, it was found that BCA could improve hepatic inflammation by regulating the hepatic lipid metabolic pathways. All these confirm that BCA has an obvious protective effect on NAFLD.
IR is also one type of the core mechanisms of NAFLD.28 Hyperlipidemia and lipid metabolism disorders can reduce insulin sensitivity and enhance the body’s IR.29 IR also acts on lipid metabolism, further aggravating lipid metabolism disorders.30 Hence, this study observed the effect of BCA on NAFLD. The result showed that compared with the rats of the ND group, the blood glucose, serum insulin levels, and IR of the rats in the HFD group significantly increased, which further confirmed that HFD-induced NAFLD rat models have a serious IR. BCA can improve IR. This may be achieved by BCA increasing the sensitivity of insulin.
The primary pathology of NAFLD is the destruction of lipid metabolism homeostasis in the body.31 Among them, cholesterol metabolism disorder is the most common.32 Large amounts of unmetabolized cholesterol cause lipid deposition in the liver and further induce fatty degeneration and inflammation in liver cells.33 The steady state of cholesterol metabolism depends on its synthesis, absorption, and excretion pathways.34,35 Cholesterol synthesis is regulated by SREBP and HMGCR. As the rate-limiting enzyme for cholesterol synthesis, HMGCR primarily regulates the production of cholesterol by catalyzing the synthesis of mevalonate from HMG-Co A at the post-transcriptional level.36 In addition, several lipid-lowering drugs improve the level of lipid metabolism by regulating the activity of HMGCR. SREBP can promote the transcription of genes, such as HMGCR, thereby promoting the production of cholesterol.37 In our experiment, we found that a long-term HFD has a certain promotion effect on the expression of HMGCR in the liver. It may be due to the accumulation of a large number of lipids caused by a long-term, which increases the synthesis of cholesterol in the liver, thereby upregulating the expression of HMGCR and allowing excess lipids to be converted into cholesterol to promote lipid metabolism. Furthermore, HFD promotes the expression of SREBP-1c in the liver, which is directly proportional to the expression of HMGCR. It may be that SREBP-1c promotes the expression of HMGCR, thereby enhancing the synthesis of cholesterol. Compared with the HFD group, BCA intervention reduced the expression of HMGCR and inhibited the production of SREBP-1c. It shows that BCA can improve NAFLD by downregulating the expression of HMGCR and inhibiting the production of SREBP-1c, thereby reducing the synthesis of cholesterol.
Cholesterol absorption is achieved through PPAR family proteins and LDLR.38,39 PPAR can regulate the expression of several target genes involved in lipid metabolism inside and outside the cell. Among them, PPAR-α primarily regulates the uptake of lipids and the β-oxidation of peroxisomes,40 whereas PPAR -γ is primarily involved in the formation of fat.41,42 Studies have found that by promoting the expression of PPAR-α, the β oxidation of lipids and the excretion of bile acids can be accelerated, thereby promoting lipid metabolism,10,43 and by inhibiting the expression of PPAR-γ, the outflow of cholesterol in the cell is reduced and also plays a role in regulating lipid metabolism. The primary function of LDLR is to enter the cell through the uptake of cholesterol for cell proliferation and the synthesis of sterol hormones and bile salts.44 Therefore, PPAR and LDLR have become one of the main targets of several lipid-lowering drugs.45 We analyzed the expression of PPAR-α, PPAR-γ, and LDLR proteins in the liver of each group of rats and found that the expression of PPAR-α in the HFD group was significantly lower than that in the normal group, whereas PPAR-γ was significantly increased. It is due to the hyperlipidemia state of the body, which causes the body to reduce the intake of exogenous fat, while inhibiting the outflow of intracellular cholesterol, promoting the conversion of endogenous lipids that the body cannot metabolize, and depositing in the liver. BCA can both upregulate PPAR-α and downregulate the expression of PPAR-γ, which may be due to the promotion of liver cholesterol to bile acid metabolism and the reduction of cholesterol outflow from liver cells. In addition, the LDLR and HFD groups were compared with the ND group; they increased further after BCA treatment. This suggests that the increase in cholesterol in the liver can cause an increase in LDLR, which further promotes the absorption of cholesterol. This may be the body’s self-protection effect. After BCA treatment, the expression of LDLR further increased, which suggests that BCA can increase the expression of LDLR and promote cholesterol absorption and metabolism.
Cholesterol excretion is achieved through CYP7A1. Cholesterol is converted into bile acid in the liver and excreted from the intestine, which is the primary pathway for cholesterol in the body.46 CYP7A1 is the rate-limiting enzyme of bile acid synthesis and plays an important role in regulating the conversion of cholesterol into bile acid metabolism. Studies have found that promoting the expression of CYP7A1 can accelerate the body’s cholesterol metabolism, convert it into bile acid, and then excrete it from the body.47 We also evaluated the expression of CYP7A1 in the liver and found that the expression of CYP7A in the HFD group increased compared with the ND group. This result suggests that HFD increases cholesterol in the body, promotes the expression of CYP7A1, and accelerates the process of conversion and excretion from cholesterol to bile acids. BCA upregulates the expression of CYP7A1 in the liver, which may be due to the promotion of bile acid production and the acceleration of cholesterol excretion in feces. This suggests that BCA can improve NAFLD by upregulating the expression of CYP7A1 and promoting the excretion of cholesterol.
This study was based on basic application research to observe the possible therapeutic targets of BCA in the treatment of NAFLD. Focusing on cholesterol metabolism, we clarified its specific mechanism of action and provided some references for clinical medication. The following is believed to be the specific mechanism: upregulating the expression of CYP7A1 and LDLR in the liver, inhibiting the production of SREBP-1c, and promoting cholesterol absorption and excretion. In addition, downregulating the HMGCR protein in the liver reduces cholesterol synthesis. Moreover, promoting the expression of PPAR-α in the liver, inhibiting the expression of PPAR-γ, and promoting cholesterol metabolism can be another mechanism, thereby regulating the expression of blood lipid metabolism and improving IR. However, there are still some limitations to this study, such as the lack of cell experiments for further verification, the lack of clinical implementation cases, and others. We need to further expand the scope of the study and make further validation tests.
Conclusion
BCA can improve the NAFLD induced by HFD by regulating the blood lipid level and the expression of lipid metabolism-related genes in rats. The following may be the specific mechanism: upregulating the expression of CYP7A1 and LDLR in the liver, inhibiting the production of SREBP-1c, and promoting cholesterol absorption and excretion as well as downregulating the expression of HMGCR in the liver to reduce cholesterol synthesis. At the same time, BCA promotes the expression of PPAR-α in the liver, inhibits the expression of PPAR-γ, promotes cholesterol metabolism, and reduces its outflow. Therefore, BCA plays a role in regulating the level of blood lipid metabolism in rats, improving the state of IR, and reducing the release of liver inflammatory factors and intestinal endotoxins. Altogether, these results indicate that the BCA intervention in the NAFLD rats has an improved effect, which may be directly or indirectly related to these targets; however, lipid metabolism in the body is a complex process with multiple factors, links, and targets. Therefore, the specific mechanism by which BCA improves NAFLD warrants further research.
Acknowledgment
This investigation was supported by the National Natural Science Foundation of China (No. 81860812).
Disclosure
The authors report no conflicts of interest in this work.
References
1. Sivell C. Nonalcoholic Fatty Liver Disease: a Silent Epidemic. Gastroenterol Nurs. 2019;42(5):428–434. doi:10.1097/SGA.0000000000000443
2. Fan JG, Kim SU, Wong VW. New trends on obesity and NAFLD in Asia. J Hepatol. 2017;67(4):862–873. doi:10.1016/j.jhep.2017.06.003
3. Pimpin L, Cortez-Pinto H, Negro F, et al. Burden of liver disease in Europe: epidemiology and analysis of risk factors to identify prevention policies. J Hepatol. 2018;69(3):718–735. doi:10.1016/j.jhep.2018.05.011
4. Byrne CD, Targher G. NAFLD: a multisystem disease. J Hepatol. 2015;62(1 Suppl):S47–S64. doi:10.1016/j.jhep.2014.12.012
5. Younossi ZM. Non-alcoholic fatty liver disease - A global public health perspective. J Hepatol. 2019;70(3):531–544. doi:10.1016/j.jhep.2018.10.033
6. Altinbas A, Sowa JP, Hasenberg T, Canbay A. The diagnosis and treatment of non-alcoholic fatty liver disease. Minerva Gastroenterol Dietol. 2015;61(3):159–169.
7. Buzzetti E, Pinzani M, Tsochatzis EA. The multiple-hit pathogenesis of non-alcoholic fatty liver disease (NAFLD). Metabolism. 2016;65(8):1038–1048. doi:10.1016/j.metabol.2015.12.012
8. Ma ZZ, Lu LG. Cholesterol metabolism and non-alcoholic steatohepatitis. Zhonghua Gan Zang Bing Za Zhi. 2016;24(8):623–627. doi:10.3760/cma.j.issn.1007-3418.2016.08.014
9. Chen L, Ma MY, Sun M, et al. Endogenous sterol intermediates of the mevalonate pathway regulate HMGCR degradation and SREBP-2 processing. J Lipid Res. 2019;60(10):1765–1775. doi:10.1194/jlr.RA119000201
10. Yang Z, Liu G, Wang Y, et al. Fucoidan A2 from the Brown Seaweed Ascophyllum nodosum Lowers Lipid by Improving Reverse Cholesterol Transport in C57BL/6J Mice Fed a High-Fat Diet. J Agric Food Chem. 2019;67(20):5782–5791. doi:10.1021/acs.jafc.9b01321
11. Rizzolo D, Buckley K, Kong B, et al. Bile Acid Homeostasis in a Cholesterol 7α-Hydroxylase and Sterol 27-Hydroxylase Double Knockout Mouse Model. Hepatology. 2019;70(1):389–402. doi:10.1002/hep.30612
12. Wang Y, Li JJ, Chen YM. Biochanin A extirpates the epithelial-mesenchymal transition in a human lung cancer. Exp Ther Med. 2018;15(3):2830–2836. doi:10.3892/etm.2018.5731
13. Sarfraz A, Javeed M, Shah MA, et al. Biochanin A: a novel bioactive multifunctional compound from nature. Sci Total Environ. 2020;722:137907. doi:10.1016/j.scitotenv.2020.137907
14. Křížová L, Dadáková K, Kašparovská J. Isoflavones. Molecules. 2019;24(6):1076. doi:10.3390/molecules24061076
15. Howes J, Waring M, Huang L, Howes LG. Long-term pharmacokinetics of an extract of isoflavones from red clover (Trifolium pratense). J Altern Complement Med. 2002;8(2):135–142. doi:10.1089/107555302317371424
16. Mohamed AA, Ahmed MM, Gomaa M, Ebraheim LLM. Bone health consequence of adjuvant Anastrozole in monotherapy or associated with biochanin-A in ovariectomized rat model. Life Sci. 2018;212:159–167. doi:10.1016/j.lfs.2018.09.059
17. Yu C, Zhang P, Lou L, Wang Y. Perspectives Regarding the Role of Biochanin A in Humans. Front Pharmacol. 2019;10:793. doi:10.3389/fphar.2019.00793
18. Xue Z, Zhang Q, Yu W, et al. Potential Lipid-Lowering Mechanisms of Biochanin A. J Agric Food Chem. 2017;65(19):3842–3850. doi:10.1021/acs.jafc.7b00967
19. Jahn D, Kircher S, Hermanns HM, Geier A. Animal models of NAFLD from a hepatologist’s point of view. Biochim Biophys Acta Mol Basis Dis. 2019;1865(5):943–953. doi:10.1016/j.bbadis.2018.06.023
20. Tryndyak V, de Conti A, Kobets T, et al. Interstrain differences in the severity of liver injury induced by a choline- and folate-deficient diet in mice are associated with dysregulation of genes involved in lipid metabolism. FASEB J. 2012;26(11):4592–4602. doi:10.1096/fj.12-209569
21. Asgharpour A, Cazanave SC, Pacana T, et al. A diet-induced animal model of non-alcoholic fatty liver disease and hepatocellular cancer. J Hepatol. 2016;65(3):579–588. doi:10.1016/j.jhep.2016.05.005
22. Wu W, Liang KL, Chen B, Su J, Chen SH, Lyu GY. Effects of Mori Folium extract on diet-induced obesity mechanism in rats. Zhongguo Zhong Yao Za Zhi. 2017;42(9):1757–1761. doi:10.19540/j.cnki.cjcmm.2017.0069
23. Luo JD, Wu D, Lyu HJ, et al. Effects of dihydromyricetin on high fat diet induced obesity in mice and its mechanism. Zhongguo Ying Yong Sheng Li Xue Za Zhi. 2020;36(1):6–11. doi:10.12047/j.cjap.5851.2020.002
24. Fouda YB, Ngo Lemba Tom E, Atsamo AD, Bonabe C, Dimo T. Effects of stem bark aqueous extract of Fagara tessmannii Engl (Rutaceae) on cardiovascular risks related to monosodium glutamate-induced obesity in rat: in vivo and in vitro assessments. J Ethnopharmacol. 2020;260:112972. doi:10.1016/j.jep.2020.112972
25. Papatheodoridi M, Cholongitas E. Diagnosis of Non-alcoholic Fatty Liver Disease (NAFLD): current Concepts. Curr Pharm Des. 2018;24(38):4574–4586. doi:10.2174/1381612825666190117102111
26. Park HS, Hur HJ, Kim SH, et al. Biochanin A improves hepatic steatosis and insulin resistance by regulating the hepatic lipid and glucose metabolic pathways in diet-induced obese mice. Mol Nutr Food Res. 2016;60(9):1944–1955. doi:10.1002/mnfr.201500689
27. Xue Z, Wang R, Wen H, et al. Biochanin A and CPe-III Peptide Improved Hepatic Infl ammation by Regulating the Hepatic Lipid Metabolic Pathways in Diet-Induced Obese Mice. Transactions Tianjin Univ. 2018;24(03):234–243. doi:10.1007/s12209-018-0117-y
28. Khan RS, Bril F, Cusi K, Newsome PN. Modulation of Insulin Resistance in Nonalcoholic Fatty Liver Disease. Hepatology. 2019;70(2):711–724. doi:10.1002/hep.30429
29. Milić S, Lulić D, Štimac D. Non-alcoholic fatty liver disease and obesity: biochemical, metabolic and clinical presentations. World J Gastroenterol. 2014;20(28):9330–9337. doi:10.3748/wjg.v20.i28.9330
30. Bai L, Li H. Innate immune regulatory networks in hepatic lipid metabolism. J Mol Med. 2019;97(5):593–604. doi:10.1007/s00109-019-01765-1
31. Ipsen DH, Lykkesfeldt J, Tveden-Nyborg P. Molecular mechanisms of hepatic lipid accumulation in non-alcoholic fatty liver disease. Cell Mol Life Sci. 2018;75(18):3313–3327. doi:10.1007/s00018-018-2860-6
32. Rana R, Shearer AM, Fletcher EK, et al. PAR2 controls cholesterol homeostasis and lipid metabolism in nonalcoholic fatty liver disease. Mol Metab. 2019;29:99–113. doi:10.1016/j.molmet.2019.08.019
33. Ma M, Duan R, Zhong H, Liang T, Guo L. The Crosstalk between Fat Homeostasis and Liver Regional Immunity in NAFLD. J Immunol Res. 2019;2019:3954890. doi:10.1155/2019/3954890
34. Quintão E, Grundy SM, Ahrens EH. Effects of dietary cholesterol on the regulation of total body cholesterol in man. J Lipid Res. 1971;12(2):233–247. doi:10.1016/S0022-2275(20)39534-1
35. Alphonse PA, Jones PJ. Revisiting Human Cholesterol Synthesis and Absorption: the Reciprocity Paradigm and its Key Regulators. Lipids. 2016;51(5):519–536. doi:10.1007/s11745-015-4096-7
36. Mutungi G, Torres-Gonzalez M, McGrane MM, Volek JS, Fernandez ML. Carbohydrate restriction and dietary cholesterol modulate the expression of HMG-CoA reductase and the LDL receptor in mononuclear cells from adult men. Lipids Health Dis. 2007;6(1):34. doi:10.1186/1476-511X-6-34
37. Brown MS, Radhakrishnan A, Goldstein JL. Retrospective on Cholesterol Homeostasis: the Central Role of Scap. Annu Rev Biochem. 2018;87:783–807. doi:10.1146/annurev-biochem-062917-011852
38. Huang Z, Zhou X, Nicholson AC, Gotto AM, Hajjar DP, Han J. Activation of peroxisome proliferator-activated receptor-alpha in mice induces expression of the hepatic low-density lipoprotein receptor. Br J Pharmacol. 2008;155(4):596–605. doi:10.1038/bjp.2008.331
39. Lamichane S, Dahal lamichane B, Kwon SM. Pivotal Roles of Peroxisome Proliferator-Activated Receptors (PPARs) and Their Signal Cascade for Cellular and Whole-Body Energy Homeostasis. Int J Mol Sci. 2018;19(4):949. doi:10.3390/ijms19040949
40. Han L, Shen WJ, Bittner S, Kraemer FB, Azhar S. PPARs: regulators of metabolism and as therapeutic targets in cardiovascular disease. Part I: PPAR-α. Future Cardiol. 2017;13(3):259–278. doi:10.2217/fca-2016-0059
41. Han L, Shen WJ, Bittner S, Kraemer FB, Azhar S. PPARs: regulators of metabolism and as therapeutic targets in cardiovascular disease. Part II: PPAR-β/δ and PPAR-γ. Future Cardiol. 2017;13(3):279–296. doi:10.2217/fca-2017-0019
42. Marion-Letellier R, Savoye G, Ghosh S. Fatty acids, eicosanoids and PPAR gamma. Eur J Pharmacol. 2016;785:44–49. doi:10.1016/j.ejphar.2015.11.004
43. Pawlak M, Lefebvre P, Staels B. Molecular mechanism of PPARα action and its impact on lipid metabolism, inflammation and fibrosis in non-alcoholic fatty liver disease. J Hepatol. 2015;62(3):720–733. doi:10.1016/j.jhep.2014.10.039
44. Yang HX, Zhang M, Long SY, et al. Cholesterol in LDL receptor recycling and degradation. Clin Chim Acta. 2020;500:81–86. doi:10.1016/j.cca.2019.09.022
45. Zhao Y, Peng L, Yang LC, et al. Wedelolactone Regulates Lipid Metabolism and Improves Hepatic Steatosis Partly by AMPK Activation and Up-Regulation of Expression of PPARα/LPL and LDLR. PLoS One. 2015;10(7):e0132720. doi:10.1371/journal.pone.0132720
46. Lan X, Yan J, Ren J, et al. A novel long noncoding RNA Lnc-HC binds hnRNPA2B1 to regulate expressions of Cyp7a1 and Abca1 in hepatocytic cholesterol metabolism. Hepatology. 2016;64(1):58–72. doi:10.1002/hep.28391
47. Russell DW. The enzymes, regulation, and genetics of bile acid synthesis. Annu Rev Biochem. 2003;72:137–174. doi:10.1146/annurev.biochem.72.121801.161712
 © 2021 The Author(s). This work is published and licensed by Dove Medical Press Limited. The full terms of this license are available at https://www.dovepress.com/terms.php and incorporate the Creative Commons Attribution - Non Commercial (unported, v3.0) License.
By accessing the work you hereby accept the Terms. Non-commercial uses of the work are permitted without any further permission from Dove Medical Press Limited, provided the work is properly attributed. For permission for commercial use of this work, please see paragraphs 4.2 and 5 of our Terms.
© 2021 The Author(s). This work is published and licensed by Dove Medical Press Limited. The full terms of this license are available at https://www.dovepress.com/terms.php and incorporate the Creative Commons Attribution - Non Commercial (unported, v3.0) License.
By accessing the work you hereby accept the Terms. Non-commercial uses of the work are permitted without any further permission from Dove Medical Press Limited, provided the work is properly attributed. For permission for commercial use of this work, please see paragraphs 4.2 and 5 of our Terms.