")
Back to Journals » Cancer Management and Research » Volume 12
BGN and COL11A1 Regulatory Network Analysis in Colorectal Cancer (CRC) Reveals That BGN Influences CRC Cell Biological Functions and Interacts with miR-6828-5p
Authors Chen D, Qin Y , Dai M, Li L, Liu H, Zhou Y, Qiu C , Chen Y, Jiang Y
Received 21 August 2020
Accepted for publication 19 November 2020
Published 22 December 2020 Volume 2020:12 Pages 13051—13069
DOI https://doi.org/10.2147/CMAR.S277261
Checked for plagiarism Yes
Review by Single anonymous peer review
Peer reviewer comments 4
Editor who approved publication: Professor Yong Teng
Danqi Chen,1 Ying Qin,2 Mengmeng Dai,1 Lulu Li,1 Hongpeng Liu,2 Yaoyao Zhou,3 Cheng Qiu,3 Yan Chen,1 Yuyang Jiang1,4
1State Key Laboratory of Chemical Oncogenomics, Key Laboratory of Chemical Biology, Tsinghua Shenzhen International Graduate School, Shenzhen, Guangdong, People’s Republic of China; 2Department of Gastrointestinal Surgery, Shenzhen Second People’s Hospital, Shenzhen, Guangdong, People’s Republic of China; 3National & Local United Engineering Laboratory for Personalized Anti-Tumor Drugs, Shenzhen Kivita Innovative Drug Discovery Institute, Tsinghua Shenzhen International Graduate School, Shenzhen, Guangdong, People’s Republic of China; 4School of Pharmaceutical Sciences, Tsinghua University, Beijing 100084, People’s Republic of China
Correspondence: Yan Chen; Yuyang Jiang Tel/Fax +86-755-26036017
Email [email protected]; [email protected]
Purpose: We explored specific expression profiles of BGN and COL11A1 genes and studied their biological functions in CRC using bioinformatics tools.
Patients and Methods: A total of 68 pairs of cancer and non-cancerous tissues from CRC patients were enrolled in this study. Methods we used in this articles including: qRT-PCR, Western blot analysis, ELISA, GO and KEGG regulatory network analysis, tumor infiltration, luciferase reporter-based protein and etc.
Results: According to The Cancer Genome Atlas (TCGA) data, BGN and COL11A1 expression levels were significantly higher in CRC patient samples than in samples from healthy controls. Moreover, levels were much higher in late-stage CRC than in early-stage disease, warranting evaluation of these genes as CRC prognostic biomarkers. Subsequently, qRT-PCR, Western blot analysis, and ELISA results obtained from analyses of CRC cells, tissues, and patient sera aligned with TCGA results. GO and KEGG regulatory network analysis revealed BGN- and COL11A1-associated genes that were functionally related to extracellular matrix (ECM) receptor pathway activation, with transcription factor genes RELA and NFKB1 positively associated with BGN expression and CEBPZ and SIRT1 with COL11A1 expression. Meanwhile, BGN and COL11A1 expression were separately and significantly correlated to tumor infiltration by six immune cell types. Additionally, kinase genes PLK1 and LYN appeared to be downstream targets of differentially expressed BGN and COL11A1, respectively. In addition, the expression of PLK1 mRNA was down-regulated while BGN was down-regulated. Finally, BGN effects on CRC cell proliferation, cycle, apoptosis, invasion, and migration were studied using molecular biological methods, including luciferase reporter-based protein analysis, qRT-PCR, and Western blot results, which revealed that miR-6828-5p may regulate BGN expression.
Conclusion: We speculate that the use of BGN and COL11A1 as CRC biomarkers would improve CRC staging, while also providing several novel targets for use in the development of more effective CRC treatments.
Keywords: colorectal cancer, COL11A1, BGN, PLK-1, miR-6828-5p
Introduction
Colorectal cancer (CRC) is a common malignant tumor-based disease that ranks third in morbidity and mortality worldwide.1 According to Global Cancer Statistics, numbers of new CRC cases and deaths in 2018 approached 2 million and 900,000, respectively. The 5-year survival rate for CRC patients with early-stage disease (stages I and II), as determined based on TNM (tumor-node-metastasis) criteria, is nearly 90%; conversely, the survival rate is only 5% for late-stage (stages III and IV) CRC patients.2 Due to the fact that clinical staging is critical for disease course prediction and diagnosis and that tailoring of treatment to CRC stage can positively impact CRC patient outcomes, clinicians recommend use of TNM staging to guide patient treatment.3
High-throughput omics analysis technologies, such as genome sequencing and other omics-based methods, have greatly enhanced our understanding of molecular mechanisms underlying complex diseases such as cancer.4 Over the past 20 years of high-throughput omics technical development, numerous researchers have used bioinformatics screening tools to discover gene candidates with cancer-specific expression for use as cancer biomarkers.5–9 Subsequently, genomic biomarkers have been identified and used for disease screening, cancer subtyping, and prediction of drug responses.4 With regard to CRC, identification of several genes (CEA, KRAS, EGFR, NRAS, and BRAF) has led to their use as treatment targets, but such genes lack reliability when used as biomarkers for CRC staging.10–14 Thus, the search for suitable biomarker genes for CRC staging must continue.
Expression of BGN (Biglycan), the gene as proteoglycan-I, was first detected in bone tissue, as reported by Fisher et al in 1989.14,15 BGN is a member of the SLRPs (small leucine-rich proteoglycans) gene family and encodes a protein core that is modified to form a glycoprotein containing two glycosaminoglycan side chains. It has been reported that SLRPs may influence cell behaviors through their involvement in extracellular matrix (ECM) assembly.16 Mechanistically, proteoglycans have been shown to promote cell proliferation, influence migration, and attenuate cell adhesion by interacting with proteins both within the cell and within the extracellular matrix.17 Meanwhile, BGN has been shown to be highly expressed in tumors, such as pancreatic cancer, colorectal cancer, ovarian cancer, intrahepatic cholangiocarcinoma, and gastric cancer. In fact, Hu et al have reported that gastric cancer invasion is enhanced when BGN activates the focal adhesion kinase (FAK) signaling pathway, while Sun Hengzi et al have shown that BGN expression enhanced the ability of endometrial cancer cells to migrate and invade tissues.18,19 Moreover, Liu Bin et al observed promotion of CRC chemotherapeutic resistance upon activation of NF-KB signal transduction by BGN, while Huang Hsiang-Chi et al demonstrated that epigenetic silencing of immunosuppressive Siglec ligand activity in CRC cells was mediated by the BGN/TLR4/NF-KB pathway.20,21 According to recent research, BGN activity influences CRC progression via its participation in other pathways.
COL11A1 (collagen type XI alpha 1 chain) encodes one of two alpha chains that comprise type XI collagen (secondary fiber collagen). Through covalent cross-linking, mature collagen molecules self-assemble into fibrils on the cell surface and within the extracellular matrix.22,23 Type XI collagen involvement has been reported in human diseases whereby type XI collagen is highly expressed in cancers but is almost always absent in non-cancerous tissues.24 Notably, even in an early stage of cancer, collagen XI protein is expressed at high levels and has been shown to stimulate the stromal proliferative response of tumor-associated fibroblasts and to promote tumor cell metastasis.25,26 Therefore, COL11A1 expression should be investigated for effects on CRC initiation and progression and evaluated for its suitability as a CRC biomarker.
In this study, we explored specific expression profiles of BGN and COL11A1 genes and studied their biological functions in CRC using bioinformatics tools. BGN functional effects on CRC cells were verified by noting changes in cell morphology, proliferation, apoptosis, cell cycle progression, migration, and invasion after experimental knockdown of BRN expression. Notably, the results of this work demonstrated that miR-6828-5p exerted a regulatory effect on BGN expression. Therefore, our results here have revealed BGN and COL11A1 functions that greatly enhance our understanding of CRC biology and highlight potential uses of these genes as biomarkers for CRC diagnosis, staging, treatment monitoring, and prognosis.
Patients and Methods
DEGs (Differentially Expressed Genes) Expression Analysis in the GEO Databases
The microarray datasets GSE32323, GSE33113, GSE37892 were all downloaded from GEO (Gene Expression Omnibus, GEO, http://www.ncbi.nlm.nih.gov/geo/). GSE32323 used 17 pairs of cancer and non-cancerous tissues from CRC patients. GSE33113 used primary tumor resection in 90 patients with AJCC stage II CRC and matched normal colon tissue from 6 of these patients. GSE37892 retained a series of 130 colon cancer samples, including 73 patients from stage II and 57 patients in stage III.
Data Processing
All microarray datasets were standardized by four R language packages including “ggplot2”, “Affy”, “limma”, and “Venn Diagram”. Following the standard |log fold change (FC)| ≥1 and adjusted p-value<0.05, the DEGs whose expression levels were up-regulated or down-regulated in three chips were analyzed. The DEGs may have important correlations with the stage of CRC with the value of diagnostic and prognostic.
DEGs Expression Level of TCGA CRC Dataset
Using the samples of 286 CRC patients and 41 normal people obtained from the TCGA database, the expression of DEGs was analyzed. And based on the clinical stages of the CRC patients, the expression of DEGs was compared in early-stage and late-stage of 286 patients.
DEGs Function Enrichment Analysis by GO Terms and KEGG Pathways
To analyze the functional differences and biological processes of DEGs in CRC, David (David, https://david.ncifcrf.gov/), an online database containing functions with the following ontology sources: KEGG (Kyoto Encyclopedia of Genes and Genomes) Pathway, GO (Gene Ontology) Biological Processes, Reactome Gene Sets, Canonical Pathways, and CORUM was used to analyze the biological processes and pathway enrichment of DEGs. We collected terms with factor > 1.5, p < 0.05 and counts > 2. Group terms into clusters based on similarities between valid members.
PPI (Protein–Protein Interaction) Enrichment Analysis of DEGs
To get the interactive relationships of DEGs, Search Tool for the Retrieval of Interacting Genes database (STRING, http://string-db.org) with protein prediction function was used for PPI network enrichment analysis. As a result, a score of ≥0.4 was considered to make sense. The PPI network enrichment analysis of DEGs was constructed and visualized by Cytoscape software (Cytoscape, http://www.cytoscape.org/).
LinkedOmics Analysis
The LinkedOmics database (LinkedOmics, http://www.linkedomics.org/login.php) involves multi-omics data and clinical data for 32 types of cancer from TCGA project.27 The LinkFinder module of LinkedOmics was particularly useful in analyzing the differentially expressed genes related to BGN or COL11A1 in the TCGA COADREAD cohort (n=379) and created statistical plots for individual genes. Pearson correlation coefficient was used to analyze the results and all the results are graphically displayed on the volcano plots, heat maps, or scatter maps. Data from LinkFinder results were signed and sorted, and then GSEA was used for GO (CC, BP, and MF), KEGG pathway analysis, kinase target enrichment.
GeneMANIA Analysis
GeneMANIA, standing for http://www.genemania.org, is a multifunctional and user-friendly Web interface, which enables users to construct protein–protein interaction (PPI) networks and gene-gene functional interaction networks from gene lists.28 The web edge has detailed information including the publications or plentiful data sources of the interactive sources. The website, which fully utilizing more than 1800 online databases of GeneMANIA, contains more than 500 million interaction sources about eight organisms and has a variety of bioinformatics methods (such as prediction, interactions, co-expression, co-location, and enrichment analysis of genes). Given a query gene, the gene prediction function of GeneMANIA can identify other related genes that may share their functions according to their interaction. GeneMANIA was also used to make the gene network visible and predict the function of CRC-rich genes recognized by GSEA: kinases PLK1and kinases LYN.
TRRUST
TRRUST (Transcriptional Regulatory Relationships Unraveled by Sentence-based Text mining, https://www.grnpedia.org/trrust/), a database of 8444 transcription factor (TF)-target regulatory relationships containing 800 human TFs and providing information on how to regulate these interactions, is a reliable and intuitive tool for transcriptional regulatory networks in humans and mice.29 In our study, BGN, AEBP1, MXRA8, COL1A1, and CCDC8 or COL11A1, THBS2, COL1A2, COL10A1, and NTM were put into TRRUST to get the transcription factors for gene interaction.
Immune Infiltration Analysis
TIMER (Tumor Immune Estimation Resource, https://cistrome.shinyapps.io/timer/) is a reliable and intuitive tool for systematic assessment of different immune cell infiltration and its clinical impact.30 In our study, the gene module was used to evaluate the correlation between BGN or COL11A1 and immune cells infiltration.
Patients and Tissue Samples
A total of 68 pairs of cancer and non-cancerous tissues from CRC patients were enrolled in this study. Tissue samples were collected from the primary CRC patients (Table 3) who underwent surgery in the Shenzhen Second People’s Hospital (Shenzhen, Guangdong, China). This study was approved by the Clinical Research Ethics Committee of the Tsinghua Shenzhen International Graduate School and carried out with written informed consent from all subjects. All subjects gave written informed consent in accordance with the Declaration of Helsinki before their inclusion in the study. All the patients were diagnosed with histopathological analysis using the surgically resected tumors. Histopathological classification of resected tumors was carried out, and tumor stages were determined according to (TNM) system of lymph node metastasis. Before specimen collection, no patient received chemotherapy or radiation therapy. All fresh tissue samples were stored in RNAlater™ stabilization solution (Thermo Fisher Scientific, Waltham, MA, USA) and were stored at −80°C for future study. This was conducted in accordance with the Declaration of Helsinki.
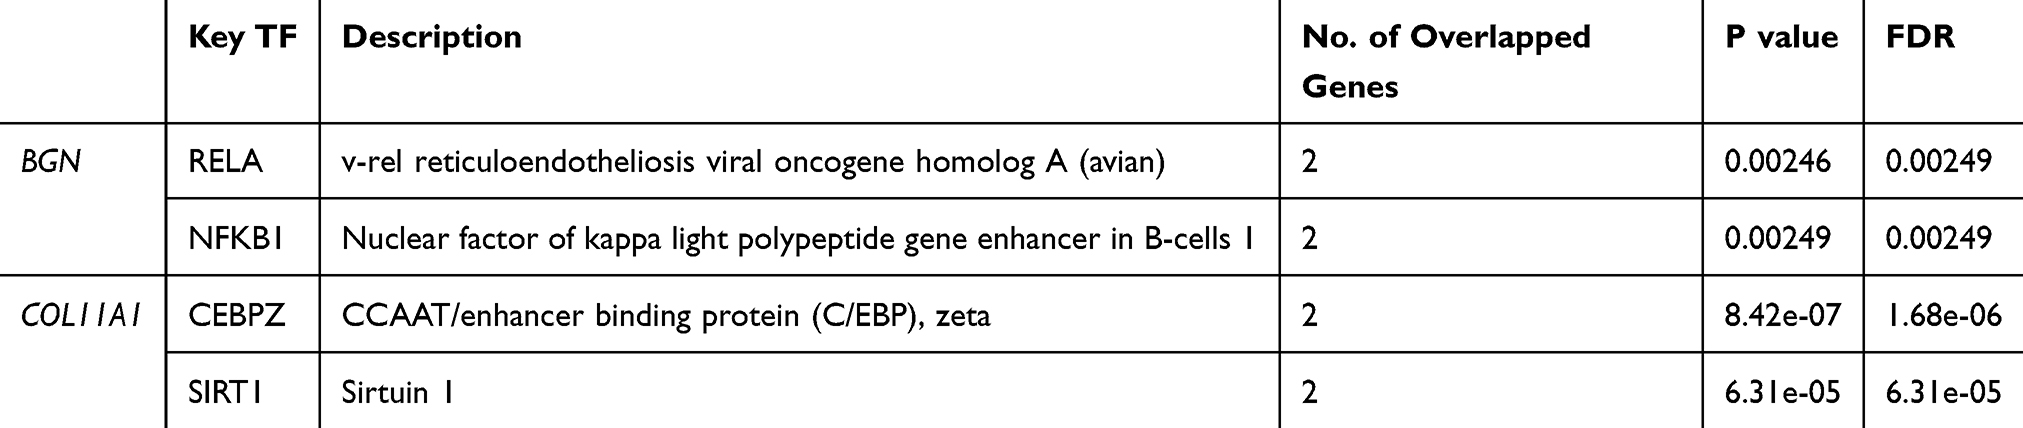 |
Table 1 Key Regulated Factor of BGN or COL11A1 in CRC (TRRUST) |
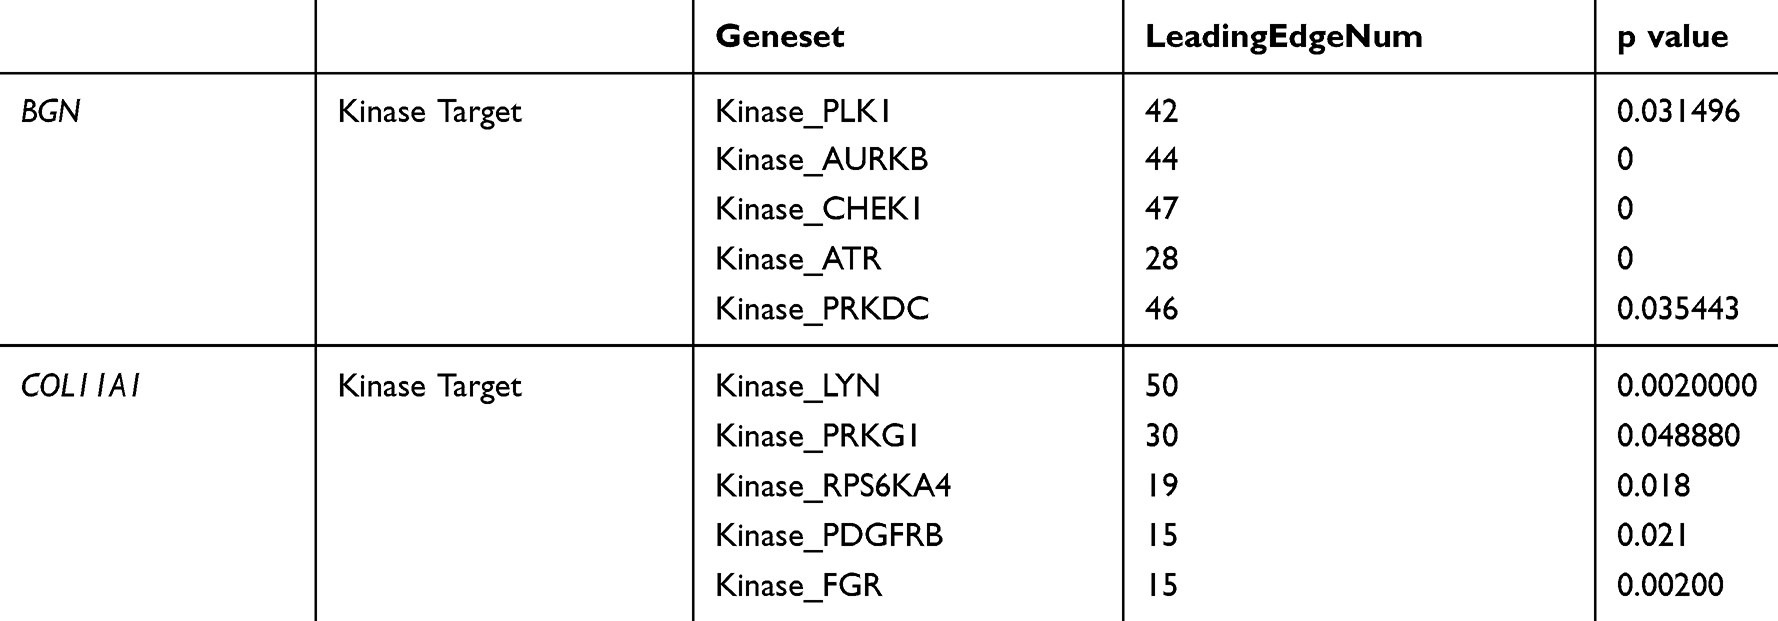 |
Table 2 The Kinase Regulatory Network of BGN or COL11A1 in CRC (LinkedOmics) |
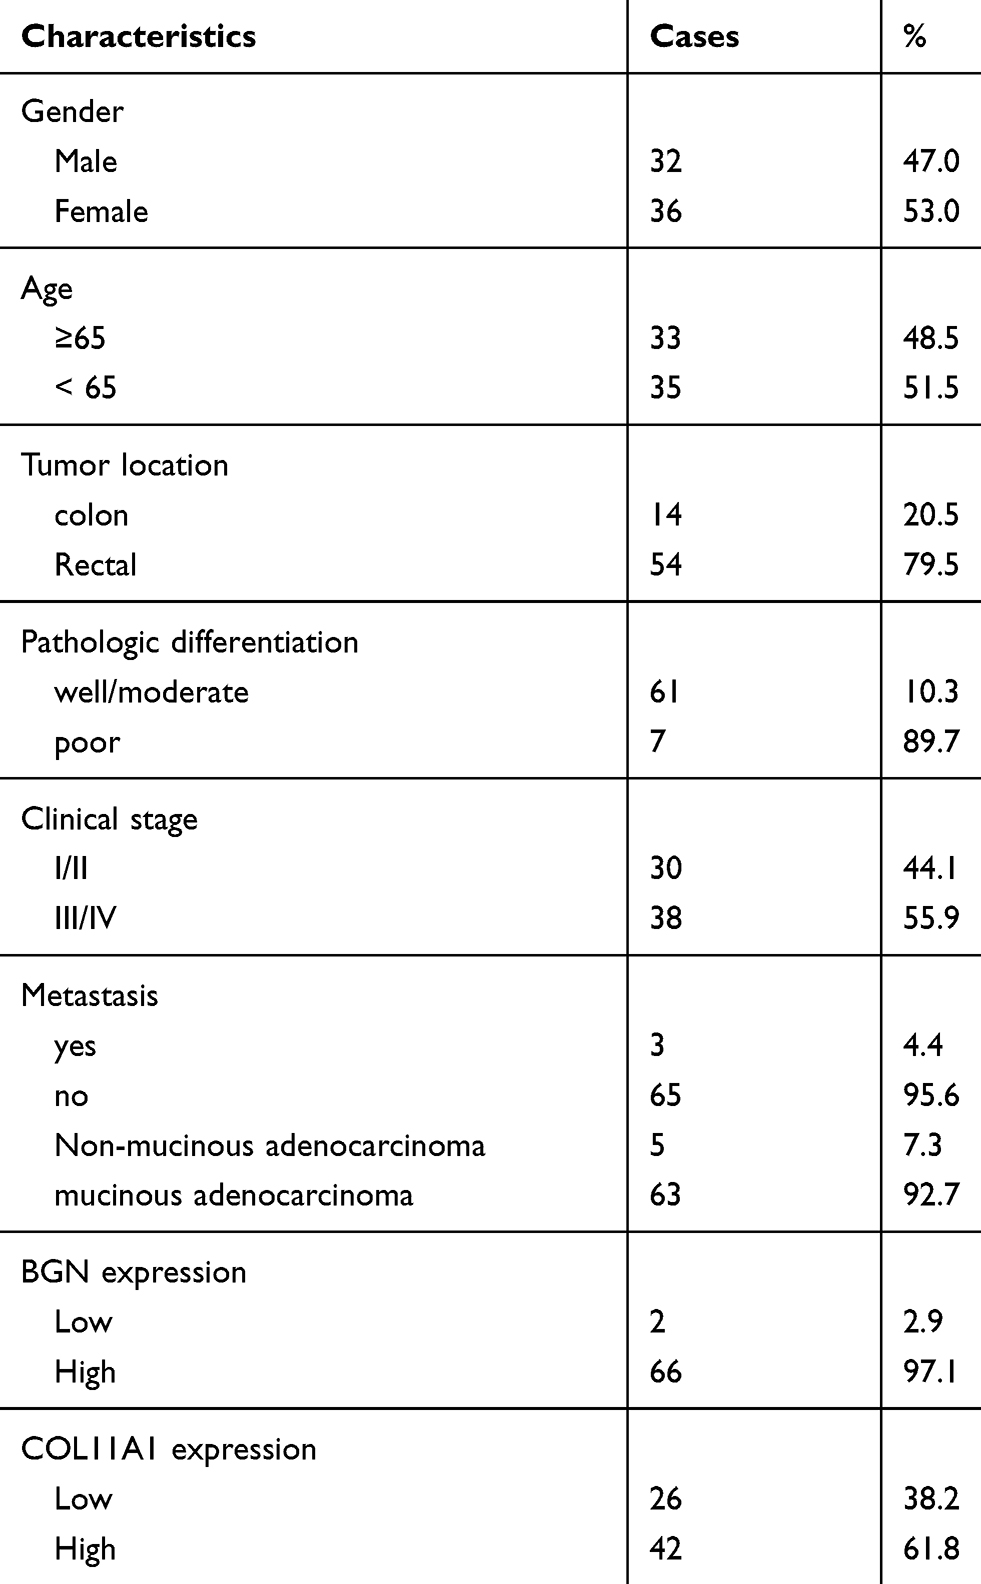 |
Table 3 Clinicopathological Characteristics and BGN and COL11A1 Expression (n = 68) |
Cell Culture
Human colon normal epithelial FHC cells and human colorectal carcinoma HCT116 cells were purchased from the ATCC (Manassas, VA, USA). DLD-1, Lovo, and HT29 cells were kindly provided by Cell Bank, China Academy of Sciences (Shanghai, China). HCT116 cells, FHC cells, and DLD-1 cells were cultured in RPMI-1640 medium (Gibco, Thermo Fisher Scientific) containing 10% (v/v) fetal bovine serum, Lovo cells were cultured in Ham’s F-12 medium (Gibco, Thermo Fisher Scientific) containing 10% (v/v) fetal bovine serum, HT-29 cells were cultured in McCoy’s 5A medium (Gibco, Thermo Fisher Scientific) containing 10% (v/v) fetal bovine serum. All cells were cultured in an incubator containing 5% CO2.
Cell Transfection
HCT116 or DLD-1 cells were cultured in 96-well or 6-well plates overnight. According to the manufacturer’s instructions, Lipofectamine 3000 (Invitrogen, USA) was used to transfect the siRNA or negative controls (GenePharma, shanghai) into the cells. All primes used are shown in Table 4.
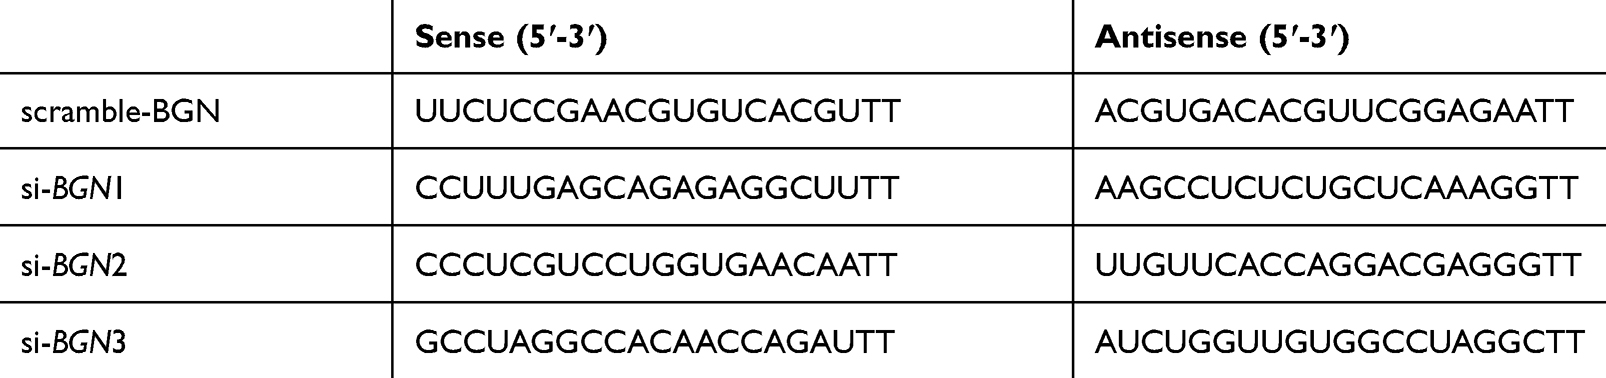 |
Table 4 Scramble-BGN and si-BGN Sequences |
Cells and Tissues RNA Extraction and Real-Time Quantitative PCR
The tissues were stored in a refrigerator at −80°C before use. Cells and tissues total RNA were extracted by Trizol reagent (Thermo Fisher Scientific, USA). Reverse transcription of 1 µg of RNA using the BeyoRT™ II thesis kit with gDNA Eraser (Beyotime Bio Inc, China). By using a 7500 PCR system (Thermo Fisher Scientific, USA), mRNA expression was detected. The Real-time quantitative PCR conditions were as follows: 95°C, 5 min; 95°C, 10 s, and at 65°C, 35 s were cycled 40 times. To verify the specificity of the PCR products, a melting curve was performed at the end of the amplification cycle. The result was analyzed by using 2−ΔΔCt methods. All primes used are shown in Table 5. The expression of BGN, COL11A1, and PLK1 was normalized by the housekeeping gene GAPHD.
 |
Table 5 Primer Sequences Used for Real-Time PCR |
Survival Analysis Using TCGA Database
Based on TCGA database data, we made preliminary analysis of the relationship between the survival of CRC patients and DEGs. Two hundred and eighty-six CRC patients from TGCA database were used. Kaplan–Meier survival curve was made by using the R language package “survival”. The Log-rank p-value was calculated at the same time.
Detection of BGN and COL11A1 Expression in Serum by ELISA
ELISA is used to detect the expression of BGN and COL11A1 in CRC patients and normal human serum. The detection range is 1.0–800 pg/mL. Briefly, equal amounts of serum were loaded into the human Biglycan (BGN) ELISA plate and type XI collagen αα1 chain (COL11A1) ELISA plate (MEI MIAN, China) with HRP-labeled BGN and COL11A1 antibody. After incubation and washing, the substrate TMB developed color after being catalyzed by peroxidase. The intensity of the color was measured using a spectrophotometer at 450 nm, and then the concentrations of BGN and COL11A1 in the sample were determined by comparing the O.D. Standard curve of the sample.
Western Blot
Clinical tissue sample and cells were analyzed with the RIPA buffer (Beyotime, Shanghai, China) with freshly added PMSF (Beyotime, Shanghai, China) on ice. The concentration of sample protein was quantified by using Bradford reagent (Tiangen, Shanghai, China) and separated on a 12% sodium dodecyl sulfate (SDS)-polyacrylamide gel, which was then transferred to onto polyvinylidene fluoride (PVDF) membranes (Bio-Rad, Hercules, CA, USA) and blocked with 5% non-fat milk Tris-buffered saline. Thereafter, the PVDF membranes were incubated overnight at 4°C in primary anti-Biglycan antibody (ab231297, 1:1000 dilution, Abcam) and anti-beta Actin antibody (Beyotime, Shanghai, China) followed by room temperature for 1 h in horseradish peroxidase-conjugated secondary antibodies (Beyotime, Shanghai, China). An enhanced chemiluminescent substrate kit was used to display the immunoreactive protein bands on the PVDF membranes, with glyceraldehyde-3-phosphate dehydrogenase as the internal reference.
Cell Proliferation Assay
For proliferation assays, transfected HCT116 or DLD-1 cells were seeded in 96-well plates at a density of 3×10³ cells per well and cultivate with RPMI-1640 medium containing 10% FBS. The Cell Counting Kit 8 (Beyotime, Shanghai, China) was added to each well at 24, 48, and 72 h. Absorbance at 450 nm was measured.
Cell Cycle and Apoptosis Analysis
The DNA content during the cell cycle phases was evaluated by flow cytometry. Cells were seeded into 6-wells plates and then incubated for 48 h. And then the cells were harvested and fixed in 70% ethanol overnight at 4°C. Next, the cells were washed 3 times and resuspended in cold PBS, followed by treatment with 50 μg/mL propidium iodide for 60 min in the dark at room temperature. Cells were analyzed immediately by flow cytometry (Beckman, USA) and calculated with ModFit software (Verity, USA). In apoptosis assay, we used a FITC AnnexinV Apoptosis Detection Kit (Beyotime, Shanghai, China) under the instructions of the manufacturer.
Wound Healing Assay
Transfected cells were seeded into 6-well plates then cultured to confluence. Next, the adherent cell layer was scratched by removing a strip of cells across the well using a pipette tip. Scratched monolayers were further washed twice with phosphate buffer solution to remove nonadherent cells. Images were obtained for each well under a microscope at 0 h, 24 h, and 48 h after scratching of cells.
Brief Description of the Transwell Assay
For the transwell assay, 1 × 10⁵ transfected cells in serum-free RPMI-1640 medium were dispensed into a previously coated upper transwell chamber (coated with Matrigel, BD, USA) then RPMI-1640 medium containing 10% fetal bovine serum was added into the lower chamber. After 16 h, each transwell chamber was washed with PBS buffer and non-invasive cells were gently removed using cotton swabs. The remaining invasive cells were fixed in 100% methanol and stained with 0.25% crystal violet for at least 10 min at room temperature. Triplicate readings for each sample were taken at five random sites within each image. After lysing cells with 33% acetic acid, the absorbance at 570 nm was measured.
Colony Formation Assay
Transfected cells were seeded into six-well plates at a concentration of 2000 cells/well and cultured in RPMI-1640 containing 20% FBS for 9 days. Cells were then fixed with methanol and stained with 0.1% crystal violet.
Luciferase Reporter Assay
HCT116 cells were cultured in 96-well plates overnight. After that, the cells were co-transfected with miRNA mimics or negative controls (GenePharma, Shanghai) with each luciferase plasmid. The 3′UTR of BGN was cloned into the pmiRGLO UTR luciferase reporter plasmid to produce the pmiRGLO-BGN-3ʹUTR. Thoroughly, Lipofectamine 3000 (Invitrogen, USA) was used to transfect miR-6828-5p mimics simulated or negative controls, while Lipofectamine 3000 was used to transfect pmiRGLO plasmids containing wild-type or BGN 3ʹUTR mutations according to the provided manual. After incubation for 6 h, the cell culture medium was changed to fresh RPMI-1640 containing 10%FBS. Twenty-four hours later, according to the manufacturer’s instructions, a dual-luciferase reporter gene analysis was performed using Dual-Luciferase Reporter Assay System kit (Promega, USA). Luciferase activity was detected under the control of Tecan Infinite M200 (TECAN, Sweden). In order to normalize the luciferase activity, the luminous intensity of Renilla luciferase was used as the internal control of the transfected cells.
Statistical Analysis
SPSS22.0 and Graphpad prism6 software were used to perform statistical analysis of all results. Then, the difference between the two groups was determined by using Student’s t-tests. The Kaplan–Meier and Log rank test were used for the calculation of survival rate and detection of comparisons. P < 0.05 was the standard of Statistical significance.
Result
Identification of DEGs
One thousand four hundred and ten differentially expressed genes (DEGs) were detected in the microarray dataset GSE32323, of which 696 genes were down-regulated and 714 genes were up-regulated in CRC tumors. One thousand two hundred and thirty-four differentially expressed genes were found in GSE33113, of which 740 genes were down-regulated and 494 genes were up-regulated in tumors. Two hundred and nineteen differential genes were found in microarray dataset GSE37892, of which 69 genes were down-regulated and 150 genes were up-regulated in stage III compared with stage II CRC. Transcriptional expression levels of all genes in the three datasets were visualized using volcano plots, with red dots representing up-regulated genes and green dots representing down-regulated genes (Figure 1A). Next, we used Venn analysis to screen for consistently up-regulated and down-regulated genes in the three gene data sets (Figure 1B). Then, data from the three microarrays were analyzed and verified, 13 genes were found to exhibit CRC-specific expression. After expression profiles were compared between early-stage and late-stage cancers, expression levels of COL1A2, KLK10, BGN, SPP1, COL10A1, INHBA, and COL11A1 were shown to be higher in late-stage cancer, while SLC26A3, FABP1, PIGR, PDCD4, and TMEM56 expression levels were higher in early-stage cancer.
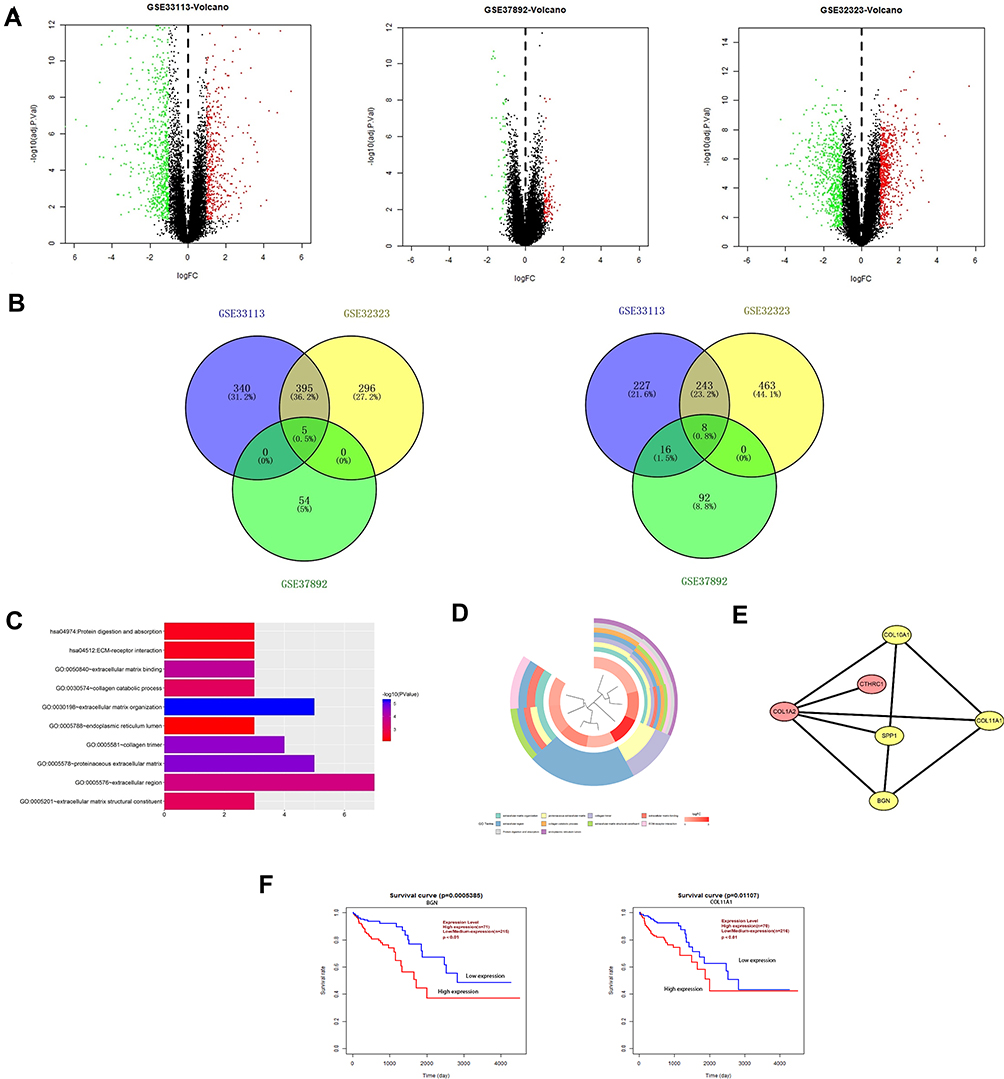 |
Figure 1 Identification of overlapping DEGs, DEGs function enrichment analysis and survival value of CRC-specific markers. (A) Volcano plots of DEGs in GSE33113 dataset, GSE37892 dataset and GSE32323 dataset. (B) Venn plots of down-regulated overlapping DEGs and upregulated overlapping DEGs. (C) Histogram of enriched terms across input gene lists. (D) Pie chart of enriched terms. (E) PPI network of DEGs were construct and visualize by Cytoscape software. (F) The survival value of CRC-specific markers was analyzed by clinical parameters and survival data of 286 patients from TCGA data. Survival curve and calculate the Log-rank p-value were made by R language package “survival”, BGN and COL11A1 expression was correlated with survival. |
GO Terms and KEGG Pathways Analysis of DEGs
Using the Database for Annotation, Visualization, and Integrated Discovery (David database), GO and KEGG enrichment analyses were conducted to assign biological roles to the 13 candidate DEGs while also assessing their functional differences. Next, we constructed a histogram of the top 10 identified functional and pathway assignments based on the significance threshold p < 0.05 (Figure 1C). Enriched biological process terms obtained from analysis were as follows: protein digestion and absorption, ECM–receptor interaction, extracellular matrix binding, collagen catabolic process, extracellular matrix organization, endoplasmic reticulum lumen, collagen trimer, proteinaceous extracellular matrix, extracellular region, and extracellular matrix structural constituent. Highly enriched genes were clustered according to related functional pathways and established networks (Figure 1D).
Protein–Protein Interaction (PPI) Network Analysis of DEGs
The STRING database (http://string-db.org) and Cytoscape (http://www.cytoscape.org/) were used to apply protein–protein interaction (PPI) network analysis to determine interactive relationships among DEG protein products. Next, we used the MCODE plug-in of Cytoscape to screen for network hub genes that were identified as BGN, COL11A1, COL10A1, and SPP1 (Figure 1E, shown in yellow). Since the mechanisms whereby BGN and COL11A1 participate in CRC were not yet clear, these DEGs were selected for subsequent verification.
Survival Analysis of Hub Genes
In this study, we used data from 286 CRC patients deposited in TCGA to analyze the relationship between CRC patient survival and DEGs. Kaplan–Meier survival curves were plotted using the R language package “survival” with Log-rank p-values calculated at the same time. We found that expression levels of BGN and COL11A1 were prognostically significant and informative such that overexpression of BGN and COL11A1 was negatively associated with patient survival (Figure 1F). Therefore, our results suggest that BGN and COL11A1 might have prognostic value when used as CRC biomarkers.
Expression of BGN and COL11A1 mRNAs in Tissues, Cells, and Serum
Expression levels of BGN and COL11A1 mRNAs were verified in tissues and cells using qRT-PCR, with results showing that BGN and COL11A1 were up-regulated in tumor tissues compared to non-tumor tissues from CRC patients (Figure 2B). In addition, these results indicated that expression levels of BGN and COL11A1 were closely correlated to CRC stage (Figure 2B), with both genes expressed at higher levels in late-stage than in early-stage CRC tumors. Moreover, these results aligned with results obtained using TCGA data (Figure 2A) and also agreed with serum ELISA results (Figure 2C). Thus, these results collectively suggest that BGN and COL11A1 expression levels were closely tied to CRC stage. Finally, as compared to results for human colon normal epithelial cell line FHC, expression levels of BGN and COL11A1 mRNA were higher in CRC cell lines DLD-1, Lovo, HT29, and HCT116 (Figure 2D) and were consistent with results of tissue experiments and serum results.
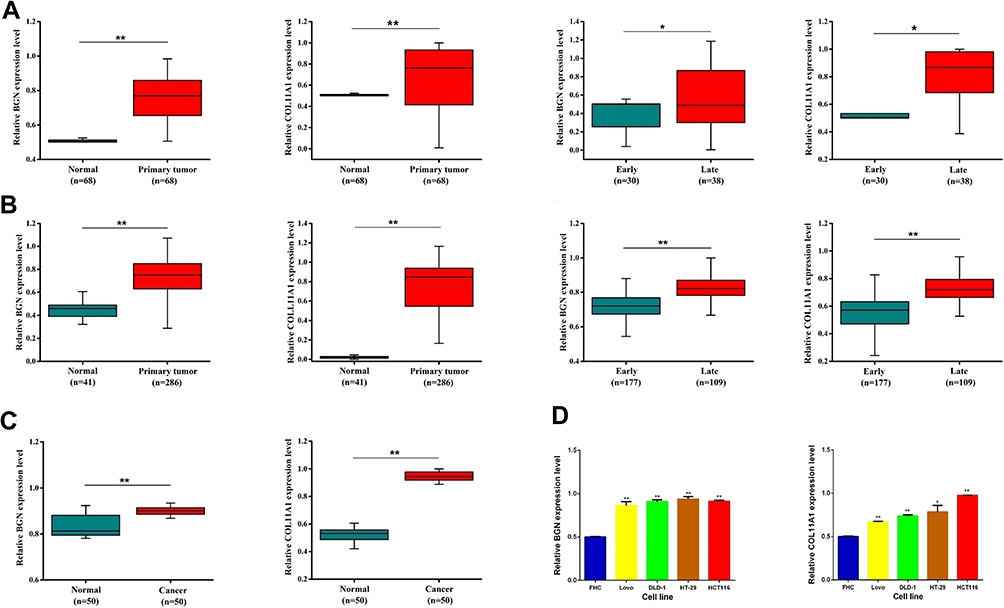 |
Figure 2 BGN and COL11A1 expression in TCGA samples, tissue samples and serum. (A) Clinical tissue quantitative real-time PCR results. (B) TGCA database analysis results. (C) Serum samples verify results. (D) The expression of BGN and COL11A1 in HCT116 and DLD-1 cells was tested by qRT-PCR. Data are presented as means ±S.D. of three independent experiments. *p < 0.05, **p < 0.01 compared with control. |
Analysis of Biological Functions of BGN and COL11A1 in CRC
Next, the LinkedOmics function module was used to analyze mRNA sequence data of 379 CRC patients deposited in the TCGA CRC database. As shown in the volcano graph (Figure 3A), 6135 genes (dark red dots) were significantly positively correlated with BGN expression, while 3321 genes (dark green dots) were significantly negatively correlated with BGN expression (FDR < 0.01). Analysis of genomic DNA sequences indicated the top 50 genomic DNA sequences most significantly positively (Figure 3B) and negatively (Figure 3C) associated with BGN expression, as shown in the heat map. Meanwhile, 3067 genes (dark red dots) were significantly positively correlated with COL11A1 and 5990 genes (dark green dots) were significantly negatively correlated with COL11A1 (FDR < 0.01) (Figure 3D). The top 50 genomic DNA sequences most significantly positively (Figure 3E) and negatively (Figure 3F) associated with COL11A1 expression are shown in the heat map.
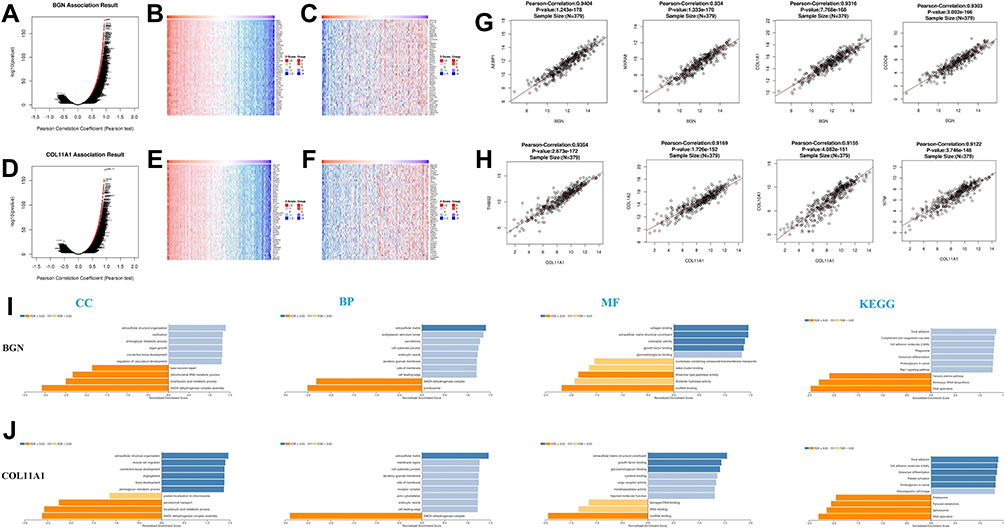 |
Figure 3 The genes correlated with BGN and COL11A1 in CRC by LinkedOmics, GO term and KEGG analysis by GSEA were conducted to clarify the biological function of BGN and COL11A1 correlated genes. The volcano plot showing the genes correlated with BGN (A) and COL11A1 (D) in CRC. The heatmap showing the top 50 genes positively (B) or negatively (C) correlated with BGN. The heatmap showing the top 50 genes positively (E) or negatively (F) correlated with COL11A1. Gene expression correlation analysis for BGN, AEBP1, MXRA8, COL1A1 and CCDC8 (G). Gene expression correlation analysis for COL11A1, THBS2, COL1A2, COL10A1 and NTM (H). GO term and KEGG analysis by GSEA were conducted to clarify the biological function of BGN (I) and COL11A1 (J) correlated genes. The column represents the Normalized Enrichment Score (NES), and the color of the column represents the FDR. |
Statistical scatter diagrams of individual genes are shown in Figure 3G and H, respectively. Significant positive correlations were observed between BGN expression and expression of the top four genes (ranked from 1 for greatest to 4 for least correlation) of AEBP1 (Pearson correlation = 0.94, p = 1.24e − 178), MXRA8 (Pearson correlation = 0.93, p = 1.33e − 170), COL1A1 (Pearson correlation = 0.93, p = 7.77e − 168), and CCDC8 (Pearson correlation = 0.93, p = 3.00e − 166). Positive correlations were also observed between COL11A1 expression and expression of the top four genes ranked from 1 to 4 as above for THBS2 (Pearson correlation coefficient = 0.93, p = 2.67e - 172), COL1A2 (Pearson correlation coefficient = 0.93, p = 1.73e − 172), COL10A1 (Pearson correlation coefficient = 0.93, p = 4.08e − 151), and NTM (Pearson correlation coefficient = 0.93, p=3.75e − 148). BGN and COL11A1 and the top four correlated genes for each were input into TRRUST, revealing that transcription factor genes RELA and NFKB1 were associated with regulation of BGN and related genes, while transcription factor genes CEBPZ and SIRT1 were associated with regulation of COL11A1 and related genes (Table 1).
In addition, functions of cell-matrix junction and extracellular matrix molecules located within the cell membrane, which act as structural components of the extracellular matrix by participating in extracellular structural organization, angiogenesis, and cell matrix adhesion, were shown via GO analysis to be significantly associated with BGN and COL11A1 gene functions. Meanwhile, KEGG analysis showed that these gene functions participate in processes involving cell adhesion molecules (CAMs), with roles in focal adhesion and DNA replication (Figure 3I and J). Therefore, these results suggest that the biological interaction network of BGN and COL11A1 is a component of the ECM receptor activation pathway.
BGN and COL11A1 Networks Involving Kinases in CRC
In order to further explore BGN and COL11A1 targets in CRC, we analyzed kinase target networks of positively related gene sets generated via gene set enrichment analysis (GSEA) (Supplementary Table 1 and Supplementary Table 2). The five most important target networks associated with BGN were identified as kinase target networks related to polo-like kinase 1 (PLK1); Aurora kinase B (AURKB); checkpoint kinase 1 (CHEK1); ataxia telangiectasia and Rd3-related (ATR) kinase; and protein kinase, DNA activated catalytic subunit (PRKDC). The five most important target networks associated with COL11A1 were kinase target networks mainly related to the LYN proto-oncogene, Src family tyrosine kinase (LYN); protein kinase cGMP-dependent 1 (PRKG1); ribosomal protein S6 kinase A4 (RPS6KA4); platelet-derived growth factor receptor beta (PDGFRB); and FGR proto-oncogene, Src family tyrosine kinase (FGR) (Table 2).
The protein–protein interaction network constructed using GeneMANIA revealed correlations among kinase genes PLK1 and LYN genes. The gene set enriched for kinase PLK1 (Figure 4A) and is mainly responsible for regulating DNA replication, DNA repair, and cell cycle checkpoints. Meanwhile, the gene set enriched for LYN (Figure 4B) is mainly responsible for immune response regulation of cell surface receptor signaling pathways, and Fc receptor signaling pathways.
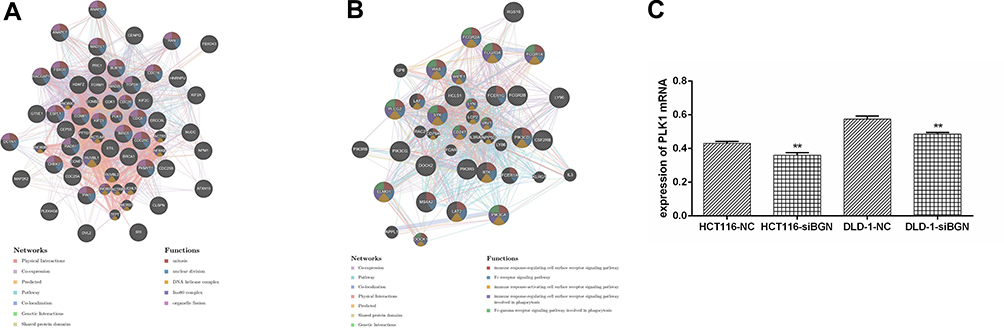 |
Figure 4 Protein-protein interaction (PPI) network and functional analysis indicating the gene set that was enriched in the target network of kinases by GeneMANIA. Protein-protein interaction network of kinase_PLK1-target (A) and kinase_LYN-target (B) networks. The different colors for the network nodes indicate the biological functions of the set of enrichment genes. (C). The expression of PLK1 was significantly down-regulated in HCT116 and DLD-1 cells transfected with siBGN compared with cells transfected with control.**p < 0.01 compared with NC. |
Down-Regulation of BGN is Accompanied by Down-Regulation of PLK1 mRNA and in vitro Studies on the Growth and Metastasis of CRC Cells
It was found that the expression of PLK1 mRNA was down-regulation while BGN mRNA was down-regulation (Figure 4C). We further confirmed the expression of BGN protein in tissues (Figure 6A) and cells (Figure 6B) using Western blot analysis. In order to study the role of BGN in CRC cell biology, the expression of BGN was down-regulated via cell transfection with siBGN. The results of qRT-PCR and Western blot analysis showed that BGN expression was significantly down-regulated in HCT116 and DLD-1 cells transfected with siBGN2 as compared with expression in NC-transfected cells (Figure 5C and D). In order to study the effect of BGN down-regulation on cell growth, we conducted rough assessments of cell proliferation along with apoptosis and cell-cycle assays, colony formation assays, and transwell assays.
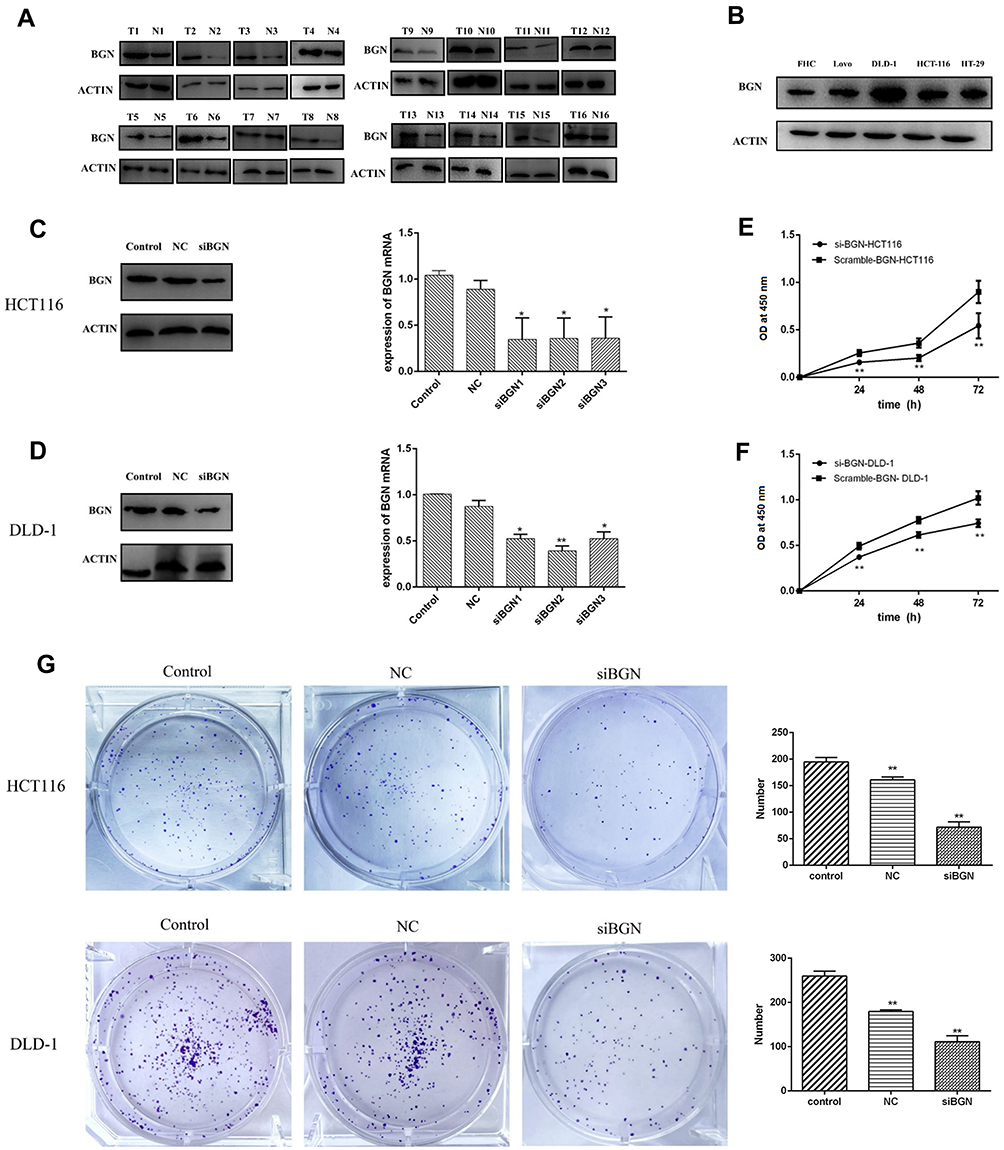 |
Figure 5 The expression of BGN and COL11A1 in cells and the effect of BGN knock-down on CRC cell proliferation. (A) The expression of BGN protein was tested by Western blot analysis. (B) The expression of BGN in cells was tested by Western blot analysis. (C and E) The expression of BGN was significantly down-regulated in HCT116 and DLD-1 cells transfected with siBGN2 compared with cells transfected with NC. (D and F) Cell viability of HCT116 and DLD-1 cells was measured by CCK-8 assay. (G) The colony formation assay and statistical results in HCT116 and DLD-1. Data are represent as the mean ± SD, The significance between control and NC group and between NC and siBGN group were shown. *p < 0.05,**p < 0.01. |
Compared with results for control and NC groups, BGN gene knockdown led to reduced proliferation of HCT116 and DLD-1 cells (Figure 5E and F). In addition, colony-level numbers of BGN knockout cells in the siBGN group were significantly reduced (Figure 5G). Moreover, flow cytometric monitoring of cell cycle progression and apoptosis of HCT116 and DLD-1 cells demonstrated a significantly higher apoptosis rate for cells with BGN knockdown than observed in control and NC group cells (Figure 6A), while cell cycle analysis indicated that BGN knockdown led to significant blockage of G0/G1 phase progression (Figure 6B). Thus, these results showed that BGN gene knockdown could inhibit cell cycle progression and promote apoptosis of HCT116 and DLD-1 cells. According to the results of transwell invasion experiments and wound healing assays, invasive cell number (Figure 7A) and wound healing area (Figure 7B) in the siBGN group were both significantly reduced. Therefore, down-regulation of BGN can reduce invasion and migration activities of HCT116 and DLD-1 cells.
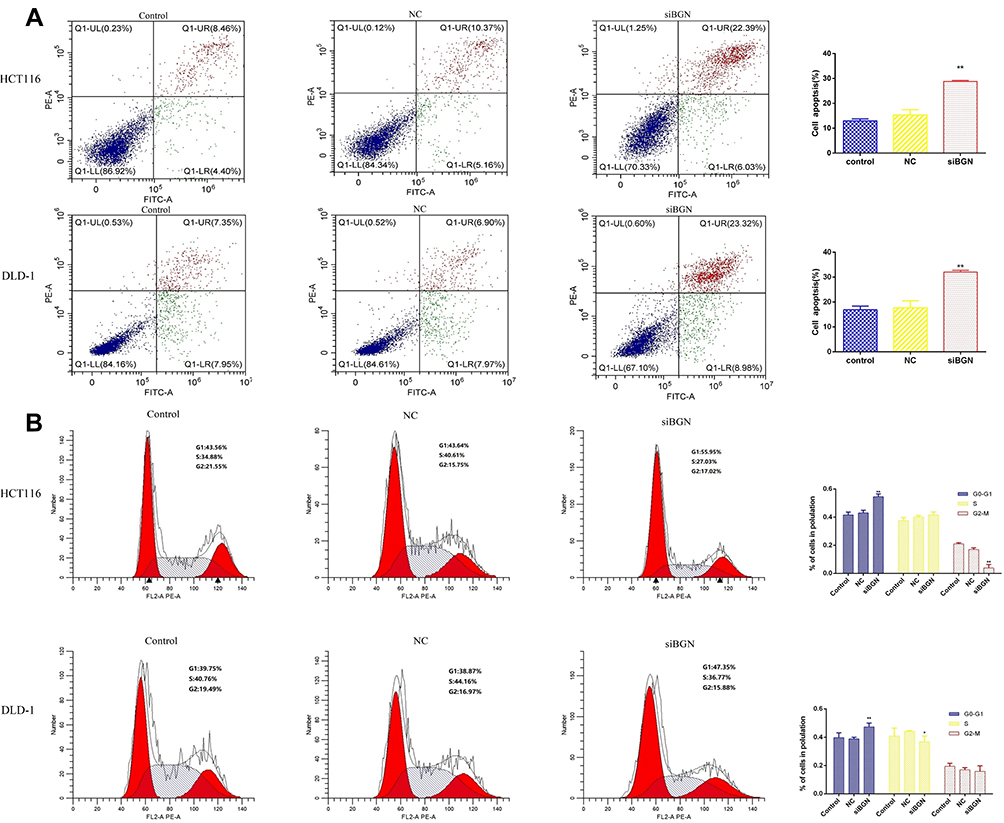 |
Figure 6 The effect of BGN down-regulation on CRC cell apoptosis and cell cycle. (A) Apoptosis cell proportion of HCT116 and DLD-1 cells was detected by flow cytometry. (B) Cell cycle of HCT116 and DLD-1 cells was also measured by flow cytometry. Data are represent as the mean ± SD, *p < 0.05, **p < 0.01 compared to NC group. |
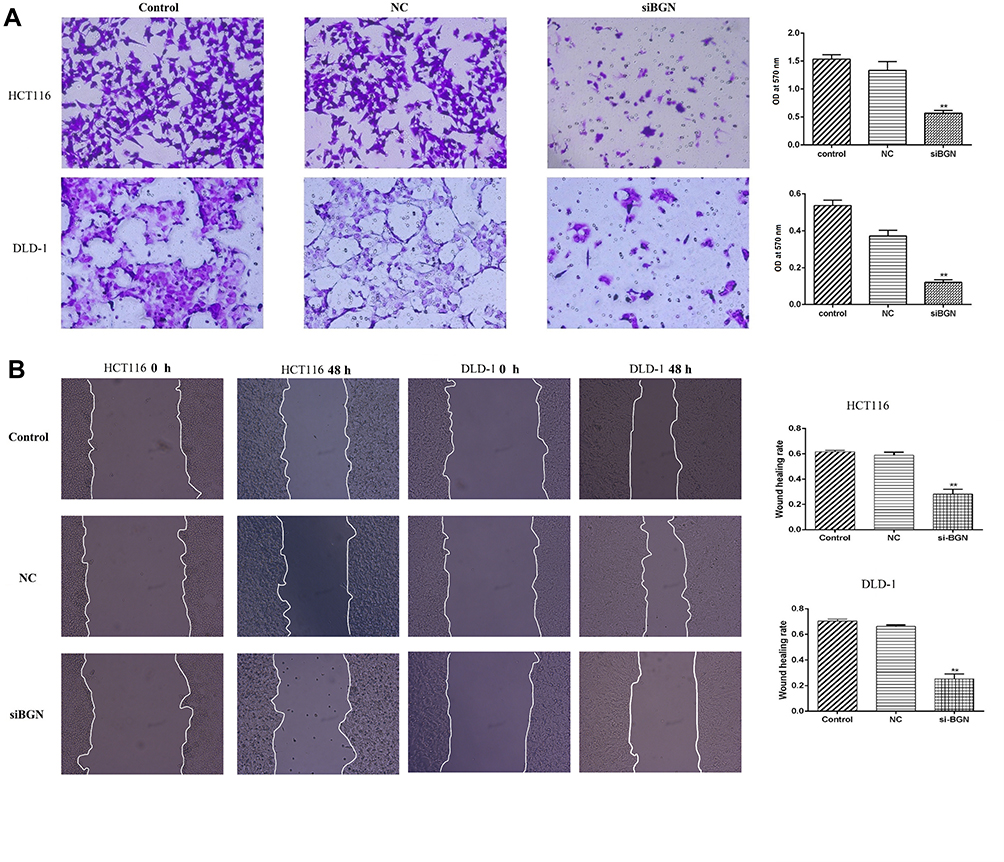 |
Figure 7 The effect of BGN down-regulation on cell invasion, migration. (A) Cell invasion of HCT116 and DLD-1 cells. (B) Cell migration of HCT116 and DLD-1 cells. Data are represent as the mean ± SD, **p < 0.01 compared to NC group. |
Immune Cell Infiltration of BGN and COL11A1
BGN and COL11A1 genes in CRC patients participate in the inflammatory response and in immune cell infiltration, thus affecting clinical CRC patient treatment outcomes. We used the TIMER database to comprehensively study the correlation between differentially expressed BGN or COL11A1 and immune cell infiltration. Expression levels of BGN or COL11A1 were negatively correlated with B cell infiltration but positively correlated with infiltration of CD4+ T cells, CD8+ T cells, neutrophils, macrophages, and dendritic cells (Figure 8). The correlation between BGN or COL11A1 and B cell infiltration or CD8+ T cells R-value is lower, B cell R-value = −0.19 and −0.233, both CD8+ T cells R-value =0.189. The correlation between BGN or COL11A1 and dendritic cells infiltration R-value is higher, dendritic cells R-value=0.599 and 0.556.
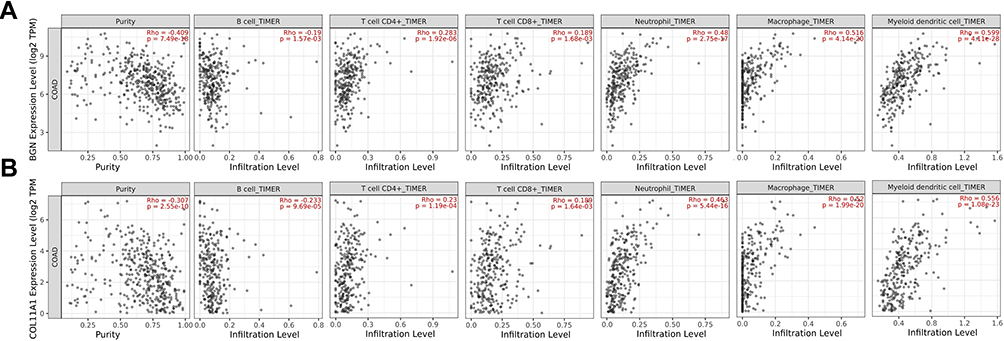 |
Figure 8 The correlation between BGN (A) and COL11A1 (B) and immune cell infiltration by TIMER. |
Identification of the BGN Binding Site for miR-6828-5p
TargetScan, miRTarBase, and miRWalk databases predicted a miR-6828-5p binding site within BGN at base position 666–672 within the BGN mRNA 3ʹ-UTR (Figure 9A). The binding sequence of miR-6828-5p on BGN mRNA 3ʹ-UTR was mutated from GUUCCCU to CAAGGGA, and the luciferase activity was calculated after transferring into miR-6828-5p mimic and negative control (Figure 9B). Luciferase reporter assay results showed that addition of miR-6828-5p mimic led to decreased luciferase activity in HCT116 cells transfected with BGN mRNA wild-type 3ʹ-UTR (P < 0.05), with luciferase activity unchanged after addition of the negative control (Figure 9C). In addition, BGN mRNA and protein levels after transfection of HCT116 cells with miR-6828-5p mimic or negative control were assessed and demonstrated that increased miR-6828-5p level led to decreased BGN expression in HCT116 cells (Figure 9D). Collectively, these results suggest that miR-6828-5p regulated BGN expression through direct and specific binding to the 3ʹ-UTR of BGN mRNA in HCT116 cells.
 |
Figure 9 miR-6828-5p regulated the expression of BGN. (A) Venn diagrams of miRNAs regulating BGN found in three databases. (B) The binding or mutation (red) sites of BGN with miR-6828-5p. (C) HCT116 cells were transfected with control miR-6828-5p mimics, pmirGLO-BGN-3ʹUTR and pmirGLOBGN-3ʹUTR mut for 24 h. Luciferase activity was measured. (D) HCT116 cells were transfected with control and miR-6828-5p mimic for 24 h, the mRNA or protein expression of BGN was measured. Data are represent as the mean ± SD, **p < 0.01 compared to NC group. |
Discussion
Researchers had previously observed that BGN and COL11A1 were highly expressed in various tumors and that expression levels were closely correlated with both tumor incidence and prognosis. Therefore, we used gene chip technology to determine expression profiles of CRC-associated genes BGN and COL11A1 during initiation and progression of CRC. We then interpreted the results using bioinformatics tools to determine functions of BGN and COL11A1 that might reveal additional potential prognostic biomarkers and CRC treatment targets for evaluation in future studies.
Effective patient screening to detect and treat early-stage CRC is not yet clinically possible but is critical in order to improve patient outcomes. Therefore, reliable early-stage markers of CRC are urgently needed. Using the TCGA database, significantly higher expression levels of BGN and COL11A1 were found in 286 patients versus levels in 41 healthy controls, with expression of BGN and COL11A1 in late-stage CRC significantly higher than in early-stage CRC. Here we also studied clinical and paracancerous tissues that had been omitted from previous studies and verified cell and serum results obtained here via qRT-PCR and ELISA. Notably, all results aligned with TCGA results, with expression levels of BGN and COL11A1 in tumors, CRC cells, and CRC patient sera all higher than in corresponding healthy control samples. In addition, it was also found that BGN and COL11A1 levels were closely associated with CRC patient prognosis, highlighting the potential value of BGN and COL11A1 as biomarkers for CRC staging and for disease prognosis.
To discover genes functionally related to BGN and COL11A1, GO and KEGG analysis were conducted and demonstrated that the BGN and COL11A1 biological interaction network participated in ECM-receptor pathway activation. Importantly, this result aligned with the results of previous reports showing that various genes influenced cancer cell biological properties by modulating the ECM-receptor interaction pathway.31–33 Among genes whose expression profiles were positively correlated to BGN and COL11A1 expression, the top four genes associated with each of BGN and COL11A1 were studied further. Genes associated with BGN expression included AEBP1, MXRA8, COL1A1, and CCDC8, while genes associated with COL11A1 expression included THBS2, COL1A2, COL10A1, and NTM. Functional relationships were found between these eight genes in 379 CRC patients, of which AEBP1, COL1A1, CCDC8, THBS2, COL1A2, COL10A1, and NTM had been shown previously to be closely related to cancer incidence or CRC cell biological behavior.34–42 Using the TRRUST database to reveal key regulatory factors associated with BGN and COL11A1 expression and the top four related genes for each, we found that two transcription factors, RELA and NFKB1, were associated with expression of BGN and its four related genes, while transcription factors CEBPZ and SIRT1 were associated with expression of COL11A1 and its four related genes. Interestingly, RELA phosphorylation is known to be involved in disease progression through regulation of NF-KB signal transduction pathways known to be important for controlling inflammatory diseases and cancer.43 Moreover, RELA has been implicated in oncogene-dependent progression of precancerous lesions, while NFKB1 has been shown to inhibit abnormal NF-KB signal pathway activation, cancer occurrence, and development of various cancers.44,45 Furthermore, the BGN/TLR4/NF-KB pathway has been shown to mediate epigenetic silencing of an immunosuppressive siglec ligand in CRC cells, while CEBPZ acts as a DNA-binding transcriptional activator, regulates heat shock protein 70 (HSP70) promoter activity in a CCAAT-dependent manner, participates in cell growth and differentiation (especially hematopoietic differentiation), and contributes to leukemia occurrence when its expression is disordered.46 In addition, the gene Sirtuin-1 (SIRT1) encodes member of the type III histone deacetylase (HDAC) family, the members of which are widely involved in gene regulation, maintenance of genomic stability, apoptosis, autophagy, senescence, proliferation, senescence, and tumorigenesis.47 From these results, we speculate that an in-depth study of the relationship between these genes and BGN and COL11A1 would help reveal roles of BGN and COL11A1 in CRC.
From a functional standpoint, interactions between COL11A1 and its related kinase mainly reflect this gene’s roles in regulating cell surface receptor signaling pathways and exerting DNA binding-dependent sequence-specific effects to influence RNA polymerase II transcription that ultimately modulates the immune response. Meanwhile, the interrelationship between these genes further indicates that COL11A1 expression could be used to monitor CRC patient immune status and that high expression of COL11A1 in CRC influences transcription-based processes. By contrast, BGN pathways mainly alter processes of DNA replication, cell cycle progression, and cell proliferation. Nevertheless, we found that kinases PLK1 and LYN are possible targets of differential expression of BGN and COL11A1, respectively. In humans, polo-like kinase 1 (PLK1) controls cell cycling and cell division and is thus closely associated with cell proliferation.54 Notably, PLK1 expression levels in CRC patients exceed levels in paired normal mucosa of the same patients, with poorer prognosis associated with a greater degree of PLK1 overexpression.55 In addition, the down-regulation of BGN is accompanied by changes in the expression of PLK1 mRNA, which further proves that the possible associated expression of BGN and PLK1 promotes the occurrence and development of CRC. Indeed, BGN may regulate cell proliferation, cell division, and cell cycle progression by regulating PLK1 kinase activity to ultimately affect CRC course. Meanwhile, LYN kinase activity has been shown to be associated with metastatic and other biological behaviors of advanced-stage CRC cells (proliferation, migration, invasion, and apoptosis) and closely related to various immune cell activities; these observations are consistent with functions of abovementioned pathways mainly associated with COL11A1 expression.56,57
Our study showed that increases in BGN and COL11A1 expression levels play vital roles in CRC development, with analysis of BGN effects on biological behavior of CRC cells revealing that BGN expression promotes cell proliferation, invasion, and migration. After knocking out BGN expression, the apoptosis rate increased, while cell cycle G0-G1 progression was significantly blocked. These results are consistent with functional BGN associations with kinase transcription factors networks predicted using bioinformatics tools. Furthermore, we found that miRNA-6828-5p could regulate BGN expression and this relationship will be a research focus of future studies.
CD4+ cells, CD8+ cells, macrophages, and neutrophils play important roles in processes known to inhibit cancers.48–51 Indeed, an increasing body of evidence suggests that immune cell infiltration can affect tumor progression and recurrence as an important determinant of immunotherapeutic response and clinical outcome.52,53 At present, we routinely monitor levels of immune molecules to predict patient prognosis, but such testing usually requires sophisticated instruments and incurs high costs, highlighting the need for easy-to-operate test platforms. In our research herein, we observed a significant correlation between expression of BGN or COL11A1 and tumor infiltration by six types of immune cells (B cells, CD8+ T cells, CD4+ T cells, macrophages, neutrophils, and dendritic cells). Therefore, in addition to their use as prognostic indicators, BGN and COL11A1 expression levels could also serve as biomarkers for low-cost rapid testing to determine patient immune status. Nevertheless, analysis of transcriptional levels only reveals some but not all aspects of immune status, warranting the need for additional independent cohort studies and in vitro or in vivo studies to verify our results.
Nevertheless, our work still has certain limitations. For example, the function of BGN is only verified in vitro, the molecular mechanism of COL11A1 or BGN and tumor-related has not been studied, the regulation between PLK1 and BGN and between miR-6828-5p and BGN Mechanism and so on, we will continue to study in-depth in the future.
In summary, we speculate that use of BGN and COL11A1 as CRC biomarkers would improve CRC staging, while also providing several novel targets for use in the development of more effective CRC treatments. Moreover, we sincerely hope that our results will provide novel insights to guide design of new immunotherapeutic drugs for treating CRC and will provide biomarkers to facilitate earlier CRC diagnosis, earlier treatment initiation, better monitoring of treatment progress, and more accurate prognostic prediction of CRC patient survival.
Conclusion
We speculate that use of BGN and COL11A1 as CRC biomarkers would improve CRC staging, while also providing several novel targets for use in the development of more effective CRC treatments.
Abbreviations
CRC, colorectal cancer; BGN, biglycan gene; COL11A1, collagen type XI alpha 1 chain gene; DEGs, differentially expressed genes; qRT-PCR, quantitative real-time PCR; GEO, Gene Expression Omnibus; TCGA, The Cancer Genome Atlas; GO, Gene Ontology; PPI, protein–protein interaction; KEGG, Kyoto Encyclopedia of Genes and Genomes; TRRUST, Transcriptional Regulatory Relationships Unraveled by Sentence-based Text mining; TIMER, Tumor Immune Estimation Resource.
Acknowledgment
We appreciate the financial supports from Shenzhen Progression and Reform Committee (No. 20151961 and No.2019156), Shenzhen Foundation of Science and Technology (No. JCYJ20170817172116272) and Department of Science and Technology of Guangdong Province (No. 2017B030314083).
Author Contributions
DQ C is the principal investigator. DQ C, YC and YY J conceived the idea for the paper. YQ and HP L collected the clinical specimens. DQ C and YC conducted data management and bioinformatics analysis. LL L conducted statistical analysis. CQ and YY Z cultured the cells for the experiment. DQ C and MM D performed the qRT-PCR. DQ C was a major contributor in writing the manuscript. YC and YY J revised the manuscript critically. All authors read and approved the final manuscript. All authors read and approved the final manuscript. All authors contributed to data analysis, drafting or revising the article, have agreed on the journal to which the article will be submitted, gave final approval of the version to be published, and agree to be accountable for all aspects of the work.
Disclosure
The authors report no conflicts of interest in this work.
References
1. Yueh TC, Wu CN, Hung YW, et al. The contribution of mmp-7 genotypes to colorectal cancer susceptibility in Taiwan. Cancer Genomics Proteomics. 2018;15(3):207–212. doi:10.21873/cgp.20099
2. Siegel RL, Miller KD, Jemal A. Cancer statistics, 2018. CA Cancer J Clin. 2018;68(1):7–30.
3. Yan Y, Liu H, Mao K, et al. Novel nomograms to predict lymph node metastasis and liver metastasis in patients with early colon carcinoma. J Transl Med. 2019;17(1):193. doi:10.1186/s12967-019-1940-1
4. Liu C, Jiang J, Gu J, Yu Z, Wang T, Lu H. High-dimensional omics data analysis using a variable screening protocol with prior knowledge integration (SKI). BMC Syst Biol. 2016;10(Suppl 4):118. doi:10.1186/s12918-016-0358-0
5. Liang J, Wu X, Sun S, et al. Circular RNA expression profile analysis of severe acne by RNA-Seq and bioinformatics. J Eur Acad Dermatol Venereol. 2018;32(11):1986–1992. doi:10.1111/jdv.14948
6. Ni S, Ren F, Xu M, et al. CTHRC1 overexpression predicts poor survival and enhances epithelial‐mesenchymal transition in colorectal cancer. Cancer Med. 2018;7.
7. Li YP, Pang J, Gao S, et al. Role of CXCR4 and SDF1 as prognostic factors for survival and the association with clinicopathology in colorectal cancer: A systematic meta-analysis. Tumour Biol. 2017;39(6):1010428317706206.
8. Wu Y, Xu Y. Integrated bioinformatics analysis of expression and gene regulation network of COL12A1 in colorectal cancer. Cancer Med. 2020;9(13):4743–4755. doi:10.1002/cam4.2899
9. Wyss J, Dislich B, Koelzer VH, et al. Stromal PD-1/PD-L1 expression predicts outcome in colon cancer patients. Clin Colorectal Cancer. 2018;18.
10. Qiu P, Wang S, Liu M, et al. Norcantharidin Inhibits cell growth by suppressing the expression and phosphorylation of both EGFR and c-Met in human colon cancer cells. Bmc Cancer. 2017;17(1):55.
11. Tanaka T, Kobunai T, Yamamoto Y, et al. Colitic cancer develops through mutational alteration distinct from that in sporadic colorectal cancer: a comparative analysis of mutational rates at each step. Cancer Genomics Proteomics. 2017;14(5):341–348.
12. Payandeh M, Sadeghi M, Sadeghi E. The report of KRAS mutation and NRAS wild type in a patient with thyroid metastasis from colon cancer: a rare case report. Iran J Pathol. 2016;11(1):71–75.
13. Roth AD, Tejpar S, Delorenzi M, et al. Prognostic role of KRAS and BRAF in stage II and III resected colon cancer: results of the translational study on the PETACC-3, EORTC 40993, SAKK 60-00 trial. J Clin Oncol. 2010;28(3):466–474. doi:10.1200/JCO.2009.23.3452
14. Polito R, Nigro E, Fei L, et al. Adiponectin is inversely associated with tumour grade in colorectal cancer patients. Anticancer Res. 2020;40(7):3751–3757. doi:10.21873/anticanres.14364
15. Gallagher JT. The extended family of proteoglycans: social residents of the pericellular zone. Curr Opin Cell Biol. 1989;1(6):1201–1218. doi:10.1016/S0955-0674(89)80072-9
16. Vuillermoz B, Khoruzhenko A, D’Onofrio MF, et al. The small leucine-rich proteoglycan lumican inhibits melanoma progression. Exp Cell Res. 2004;296(2):294–306.
17. C-S G. Large and small proteoglycans of osteoarthritic and rheumatoid articular cartilage. Arthritis Rheumatol. 2010;38(5):660–668.
18. Hu L, Duan YT, Li JF, et al. Biglycan enhances gastric cancer invasion by activating FAK signaling pathway. Oncotarget. 2014;5(7):1885–1896. doi:10.18632/oncotarget.1871
19. Sun H, Wang X, Zhang Y, et al. Biglycan enhances the ability of migration and invasion in endometrial cancer. Arch Gynecol Obstet. 2016;293(2):429–438. doi:10.1007/s00404-015-3844-5
20. Liu B, Xu T, Xu X, Cui Y, Xing X. Biglycan promotes the chemotherapy resistance of colon cancer by activating NF-κB signal transduction. Mol Cell Biochem. 2018;449(1–2):285–294. doi:10.1007/s11010-018-3365-1
21. Huang HC, Cai BH, Suen CS, et al. BGN/TLR4/NF-B mediates epigenetic silencing of immunosuppressive siglec ligands in colon cancer cells. Cells. 2020;9:2. doi:10.3390/cells9020397
22. Vazquez-Villa F, Garcia-Ocana M, Galvan JA, et al. COL11A1/(pro) collagen 11A1 expression is a remarkable biomarker of human invasive carcinoma-associated stromal cells and carcinoma progression. Tumour Biol. 2015;36(4):2213–2222. doi:10.1007/s13277-015-3295-4
23. Su C, Zhao J, Hong X, Yang S, Jiang Y, Hou J. Microarray-based analysis of COL11A1 and TWIST1 as important differentially expressed pathogenic genes between left and rightsided colon cancer. Mol Med Rep. 2019;20(5):4202–4214.
24. Karaglani M, Toumpoulis I, Goutas N, et al. Development of novel real-time PCR methodology for quantification of COL11A1 mRNA variants and evaluation in breast cancer tissue specimens. BMC Cancer. 2015;15:694. doi:10.1186/s12885-015-1725-8
25. Di Y, Chen D, Yu W, Yan L. Bladder cancer stage-associated hub genes revealed by WGCNA co-expression network analysis. Hereditas. 2019;156:7. doi:10.1186/s41065-019-0083-y
26. Shen L, Yang M, Lin Q, Zhang Z, Zhu B, Miao C. COL11A1 is overexpressed in recurrent non-small cell lung cancer and promotes cell proliferation, migration, invasion and drug resistance. Oncol Rep. 2016;36(2):877–885. doi:10.3892/or.2016.4869
27. Vasaikar SV, Straub P, Wang J, Zhang B. LinkedOmics: analyzing multi-omics data within and across 32 cancer types. Nucleic Acids Res. 2018;46(D1):D956–d963. doi:10.1093/nar/gkx1090
28. Warde-Farley D, Donaldson SL, Comes O, et al. The GeneMANIA prediction server: biological network integration for gene prioritization and predicting gene function. Nucleic Acids Res. 2010;38(suppl_2):W214–W220. doi:10.1093/nar/gkq537
29. Han H, Cho J-W, Lee S, et al. TRRUST v2: an expanded reference database of human and mouse transcriptional regulatory interactions. Nucleic Acids Res. 2017;46(D1):D380–D386. doi:10.1093/nar/gkx1013
30. Li T, Fan J, Wang B, et al. TIMER: A web server for comprehensive analysis of tumor-infiltrating immune cells. Cancer Res. 2017;77(21):. doi:10.1158/0008-5472.CAN-17-0307
31. Zhang HJ, Tao J, Sheng L, et al. Twist2 promotes kidney cancer cell proliferation and invasion by regulating ITGA6 and CD44 expression in the ECM-receptor interaction pathway. Onco Targets Ther. 2016;9:1801–1812.
32. Furuta S, Bissell MJ. Pathways involved in formation of mammary organoid architecture have keys to understanding drug resistance and to discovery of druggable targets. In: Stewart D, Stillman B, editors. Targeting Cancer. Vol. 81. Plainview: Cold Spring Harbor Laboratory Press; 2016:207–217.
33. Schaefer L, Reinhardt DP. Special issue: extracellular matrix: therapeutic tools and targets in cancer treatment. Adv Drug Deliv Rev. 2016;97:1–3. doi:10.1016/j.addr.2016.01.001
34. Liu JY, Jiang L, Liu JJ, et al. AEBP1 promotes epithelial-mesenchymal transition of gastric cancer cells by activating the NF-κB pathway and predicts poor outcome of the patients. Sci Rep. 2018;8(1):11955. doi:10.1038/s41598-018-29878-6
35. Xing Y, Zhang Z, Chi F, et al. AEBP1, a prognostic indicator, promotes colon adenocarcinoma cell growth and metastasis through the NF-κB pathway. Mol Carcinog. 2019;58(10):1795–1808. doi:10.1002/mc.23066
36. Liu J, Shen JX, Wu HT, et al. Collagen 1A1 (COL1A1) promotes metastasis of breast cancer and is a potential therapeutic target. Discov Med. 2018;25(139):211–223.
37. Li J, Ding Y, Li A. Identification of COL1A1 and COL1A2 as candidate prognostic factors in gastric cancer. World J Surg Oncol. 2016;14(1):297. doi:10.1186/s12957-016-1056-5
38. Pangeni RP, Channathodiyil P, Huen DS, et al. The GALNT9, BNC1 and CCDC8 genes are frequently epigenetically dysregulated in breast tumours that metastasise to the brain. Clin Epigenetics. 2015;7(1):57. doi:10.1186/s13148-015-0089-x
39. Ao R, Guan L, Wang Y, Wang JN. Silencing of COL1A2, COL6A3, and THBS2 inhibits gastric cancer cell proliferation, migration, and invasion while promoting apoptosis through the PI3k-Akt signaling pathway. J Cell Biochem. 2018;119(6):4420–4434. doi:10.1002/jcb.26524
40. Wang X, Zhang L, Li H, Sun W, Zhang H, Lai M. THBS2 is a potential prognostic biomarker in colorectal cancer. Sci Rep. 2016;6:33366. doi:10.1038/srep33366
41. Li T, Huang H, Shi G, et al. TGF-β1-SOX9 axis-inducible COL10A1 promotes invasion and metastasis in gastric cancer via epithelial-to-mesenchymal transition. Cell Death Dis. 2018;9(9):849. doi:10.1038/s41419-018-0877-2
42. Hao W, Lei C, Li D, et al. Microarray analysis of lung long non-coding RNAs in cigarette smoke-exposed mouse model. Oncotarget. 2017;8(70):115647–115656.
43. Lu X, Yarbrough WG. Negative regulation of RelA phosphorylation: emerging players and their roles in cancer. Cytokine Growth Factor Rev. 2015;26(1):7–13. doi:10.1016/j.cytogfr.2014.09.003
44. Lesina M, Wörmann SM, Morton J, et al. RelA regulates CXCL1/CXCR2-dependent oncogene-induced senescence in murine Kras-driven pancreatic carcinogenesis. J Clin Invest. 2016;126(8):2919–2932. doi:10.1172/JCI86477
45. Cartwright T, Perkins ND. NFKB1: a suppressor of inflammation, ageing and cancer. FEBS J. 2016;283(10):1812–1822. doi:10.1111/febs.13627
46. Musialik E, Bujko M, Kober P, et al. Comparison of promoter DNA methylation and expression levels of genes encoding CCAAT/enhancer binding proteins in AML patients. Leuk Res. 2014;38(7):850–856. doi:10.1016/j.leukres.2014.04.013
47. Xu Y, Qin Q, Chen R, Wei C, Mo Q. SIRT1 promotes proliferation, migration, and invasion of breast cancer cell line MCF-7 by upregulating DNA polymerase delta1 (POLD1). Biochem Biophys Res Commun. 2018;502(3):351–357. doi:10.1016/j.bbrc.2018.05.164
48. Borst J, Ahrends T, Bąbała N, Melief CJM, Kastenmüller W. CD4(+) T cell help in cancer immunology and immunotherapy. Nat Rev Immunol. 2018;18(10):635–647. doi:10.1038/s41577-018-0044-0
49. Molodtsov A, Turk MJ. Tissue resident cd8 memory t cell responses in cancer and autoimmunity. Front Immunol. 2018;9:2810. doi:10.3389/fimmu.2018.02810
50. Cassetta L, Pollard JW. Targeting macrophages: therapeutic approaches in cancer. Nat Rev Drug Discov. 2018;17(12):887–904.
51. Shaul ME, Fridlender ZG. Tumour-associated neutrophils in patients with cancer. Nat Rev Clin Oncol. 2019;16(10):601–620.
52. Gunnarsson U, Strigård K, Edin S, et al. Association between local immune cell infiltration, mismatch repair status and systemic inflammatory response in colorectal cancer. J Transl Med. 2020;18(1):178. doi:10.1186/s12967-020-02336-6
53. Li B, Severson E, Pignon JC, et al. Comprehensive analyses of tumor immunity: implications for cancer immunotherapy. Genome Biol. 2016;17(1):174.
54. Song R, Hou G, Yang J, et al. Effects of PLK1 on proliferation, invasion and metastasis of gastric cancer cells through epithelial-mesenchymal transition. Oncol Lett. 2018;16(5):5739–5744.
55. Liu Z, Sun Q, Wang X. PLK1, A potential target for cancer therapy. Transl Oncol. 2017;10(1):22–32. doi:10.1016/j.tranon.2016.10.003
56. Meng L, Chen Z, Jiang Z, et al. MiR-122-5p suppresses the proliferation, migration, and invasion of gastric cancer cells by targeting LYN. Acta Biochim Biophys Sin. 2020;52(1):49–57. doi:10.1093/abbs/gmz141
57. Zhang Q, Meng X, Qin G, Xue X, Dang N. Lyn kinase promotes the proliferation of malignant melanoma cells through inhibition of apoptosis and autophagy via the pi3k/akt signaling pathway. J Cancer. 2019;10(5):1197–1208. doi:10.7150/jca.28908
 © 2020 The Author(s). This work is published and licensed by Dove Medical Press Limited. The full terms of this license are available at https://www.dovepress.com/terms.php and incorporate the Creative Commons Attribution - Non Commercial (unported, v3.0) License.
By accessing the work you hereby accept the Terms. Non-commercial uses of the work are permitted without any further permission from Dove Medical Press Limited, provided the work is properly attributed. For permission for commercial use of this work, please see paragraphs 4.2 and 5 of our Terms.
© 2020 The Author(s). This work is published and licensed by Dove Medical Press Limited. The full terms of this license are available at https://www.dovepress.com/terms.php and incorporate the Creative Commons Attribution - Non Commercial (unported, v3.0) License.
By accessing the work you hereby accept the Terms. Non-commercial uses of the work are permitted without any further permission from Dove Medical Press Limited, provided the work is properly attributed. For permission for commercial use of this work, please see paragraphs 4.2 and 5 of our Terms.