")
Back to Journals » Cancer Management and Research » Volume 11
Beyond The T/C Ratio: Old And New Anticancer Activity Scores In Vivo
Authors Ubezio P
Received 15 May 2019
Accepted for publication 14 August 2019
Published 19 September 2019 Volume 2019:11 Pages 8529—8538
DOI https://doi.org/10.2147/CMAR.S215729
Checked for plagiarism Yes
Review by Single anonymous peer review
Peer reviewer comments 2
Editor who approved publication: Dr Antonella D'Anneo
Paolo Ubezio
Biophysics Unit, Department of Oncology, Istituto di Ricerche Farmacologiche Mario Negri IRCCS, Milan, Italy
Correspondence: Paolo Ubezio
Istituto di Ricerche Farmacologiche Mario Negri – IRCCS, Via Mario Negri 2, Milan 20156, Italy
Tel +39-02-3901 4438
Fax +39-02-354 6277
Email [email protected]
Abstract: Assessing the efficacy of anticancer agents in animal models remains a necessary step in the development of new treatment options and plays an important role in their optimization and comparison. Often, however, interpretation of the results is flawed by excessive trust in scores traditionally handed down, but whose origin and limitations have been lost. Here I examine the theories and assumptions underlying the most common rating scales, suggesting improvements to the old scores and proposing the adoption of multi-parameter analysis and interpretation of the results, considering different time-windows. I examined case examples of different scenarios of antiproliferative effects induced by treatment, demonstrating that common scores fail to distinguish between completely different responses to treatment or, in other circumstances, indicate a different outcome when the response is the same. I found that a combination of parameters, including the percent tumor growth between the start and end of treatment, the relative tumor burden at nadir and the absolute growth delay, may distinguish among the different cases and support a correct interpretation of the antitumor response. All these parameters can be derived from individual tumor growth curves in a simple way, without any change to common experimental procedures.
Keywords: tumor growth curves, T/C ratio, treatment evaluation, anticancer activity, preclinical testing, cell proliferation, cell killing, tumor growth delay
Plain Language Summary
In preclinical studies, the anticancer drug effects are studied by measuring the growth curve of a tumor during and after treatment and judging the efficacy with scores whose actual significance and limitations are nowadays poorly perceived. In most cases, drugs are judged suitable to undertake clinical development or rejected at the preclinical stage on the basis of measures of the ratio between the tumor volume in the treated group and in the untreated control group (“T/C ratio”) of animals transplanted with suitable tumor models. Here we present a critical appraisal of T/C ratio and other common rating scales, making explicit the underlying assumptions and challenging the scores with case examples of tumor growth curves, experimental or expected in simple scenarios of cytostatic and cytotoxic drug effects. The examples disclose several interpretation pitfalls, demonstrating that common scores fail to distinguish between completely different responses to treatment or, in other circumstances, indicate a different outcome when the response is the same. We propose the use of a combination of parameters, simply derived from the growth curves in different time windows, in order to reach a correct interpretation of the results. This criterion represents a methodological change respect to the evaluation of efficacy with the T/C ratio.
Introduction
The state–of–the-art of preclinical anticancer drug testing focuses on the evaluation of molecular effects, from inhibition of target molecules to extensive “omics” approaches, but the antiproliferative effect still remains the final proof of efficacy of any treatment. Beside the importance for the design of new drugs of targeting specific molecular pathways modified in the tumor, the final aim of treatment is obviously tumor eradication or control, or at least delay of the expansion of tumor cell populations. In preclinical studies, the antiproliferative effects are studied by measuring the growth curve of a tumor during and after treatment and judging the efficacy with scores, like T/C, which have not been changed for decades1–4 and whose actual significance and limitations are nowadays poorly perceived.
Without entering into the debate of whether or to what extent tumor models growing in mice are representative of the disease in humans, a correct interpretation of the mouse experiments is certainly crucial and misuse or misinterpretation of activity scores based on tumor growth curves may at least partly account for a lack of efficacy in the subsequent clinical phases. As the response to treatment is a complex mix of cytostatic (i.e. hampering cell cycling) and cytotoxic (i.e. causing cell killing) effects5,6 evolving in time during/after the drug exposure, scores for the different situations are needed. In contrast, the prevailing tendency is to use a single “number” to rate the anticancer activity of a drug. This is probably unavoidable in a first massive screening, to exclude totally inactive drugs, but in our opinion it is detrimental when used to compare different treatments, particularly when comparing “classical” cytotoxic with prevalently cytostatic drugs, like many new targeted agents. Retrieving the full information conveyed by the experimental data, and acknowledging the meaning and limitations of the single measures, would serve the aim of supporting the passage to the clinic and first steps in human trials much better than looking for a single number or “signature” (irrespective of the quantity it measures, with what precision and metrics) and trying to demonstrate its power to “predict” ̶ in some unclear statistical sense – the outcome in humans.
Moving in this direction, we examined the current widely used scores, starting from those based on the T/C ratio, and suggest simple modifications of the existing rating procedures.
Methods And Results
The T/C Ratio
Figure 1 shows a typical example of tumor growth curves in untreated (“control”, C) and treated (T) mice, taken from records of our laboratory of a previously reported experiment7 with a model of patient-derived ovarian cancer. Procedures involving animals and their care were conducted in conformity with institutional guidelines that comply with national (DLgs. 26/2014) and international (EEC Council Directive 2010/63) laws and policies. Animals studies were approved by the Mario Negri Institute Animal Care and Use Committee and the Italian Ministry of Health. The ordinate in Figure 1 refers to a measure of the tumor cellular mass, usually the tumor volume, and is shown relative to the measure at a suitable starting point, which we will take as the time when treatment begins. The ratio between treated and control is calculated at all times while the growth curve of control exists (Figure 1A), and the minimum value, at whatever time it is reached, is the “best T/C ratio”, or simply “T/C”, taken as representative of treatment efficacy and used to compare different treatments. T/C is often perceived as the fraction of surviving cells, but this is true only in a very specific situation: when the treatment eliminates a fraction of the cells, these dead cells are no longer detectable (i.e. contributing to the measured volume) at the time when T/C is computed and all survivors are not affected at all by treatment, continuing to grow like untreated cells (S, dashed line in Figure 1A). In practice, i) the treatment usually covers a certain period of time (exposure to a drug can be days/weeks when several doses are given, or hours/days for a single dose); ii) killing is not instantaneous (even after short drug exposure the killing may take days); and eventually iii) killed cells do not instantly disappear (e.g. swept out by lymphatic drainage or eliminated by macrophages or other host cells) and can be expected to contribute for days to the actual measure of the tumor mass T(t). For this reason it would be appropriate to measure the T/C after a long enough time for the contribution of killed cells to the measure to be negligible, that is several days after the end of treatment. But at this time the measure of controls may be questionable, either because the tumor is growing slowly due to spatial or nutrient limitations, or even because control mice have already been euthanized. In addition, even if a suitable time is found, when both T and C can be measured, one more condition is required for a correct measure of the fraction of surviving cells, namely that they were totally unaffected by treatment, assuming that they were never delayed, even during the treatment. In practice any dose that kills cells (cytotoxic) is also expected to be at least partly cytostatic. Usually fairly low (poorly effective) doses induce only cytostatic effects and cytotoxic effects come into play at higher doses.8–12 Moreover, both cytostatic and cytotoxic effects are generally not limited to the exposure time: they may last days after treatment discontinuation and involve subsequent generations of cells, the offspring of those directly exposed to the drug.13–15 Furthermore, at least in some cases the treatment may have an effect on the tumor environment, changing the growth rate of surviving cells. All those phenomena make the interpretation of a T/C score very problematic. The following examples illustrate some of the pitfalls and misinterpretations with uncritical trust in T/C scores.
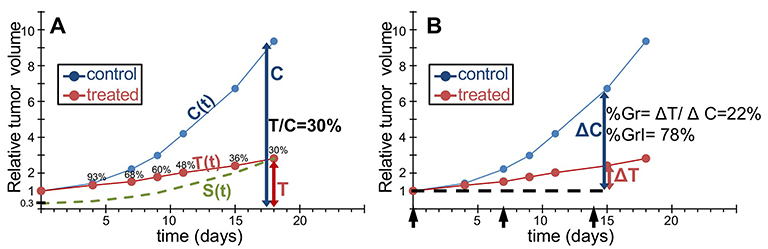 |
Figure 1 T/C and percent tumor growth. Experimental example to illustrate the concepts of T/C (A) and %Gr (%GrI) (B). Tumor growth curves of untreated control ((C(t), blue) or treated tumors (T(t), red) are shown as tumor volume (or mass) relative to the volume (mass) at the start of treatment, over time, in days from the treatment start. Black arrows indicate treatment days. (A) The T/C ratio is calculated at all measurement times (93% on day 4, 68% on day 7, etc.). The lowest value (“best T/C” or simply “T/C”) is perceived as a measure of the percentage of cells surviving the treatment. This implicitly assumes that i) the effects of treatment are exhausted at the time of the best T/C; ii) only survivors contribute to the tumor volume at that time; and iii) survivors expand unaffected by treatment, with the same growth law as controls (S(t) = S C(t), where S is the fraction of survivors). The dashed line represents the putative growth curve of surviving cells. (B) %Gr (%GrI) is calculated from the ratio of the volume increments in treated and control samples between the start (day 0) and end (day 15) of treatment. %Gr is indicative of the growth rate reduction during treatment, ranging from 100% (no effect) to 0% (complete arrest). A different formula may be used in case of tumor regression (negative %Gr, see text). The dashed line represents the tumor volume at the start of treatment. |
Figure 2 compares different hypothetical treatment scenarios all giving the same T/C as the experimental data shown in panel 2A, with the same control curve. Figure 2B exemplifies the case of a purely cytotoxic effect: a fraction of cells is eliminated by the treatment and the minimum T/C is reached on day 4, at a different time from the other examples. The classical procedure to calculate T/C on the day when this ratio is minimum implies that T/C may be computed at a different time in each group in an experiment comparing several groups, running the risk of comparing numbers with different units of measure or related to different quantities.
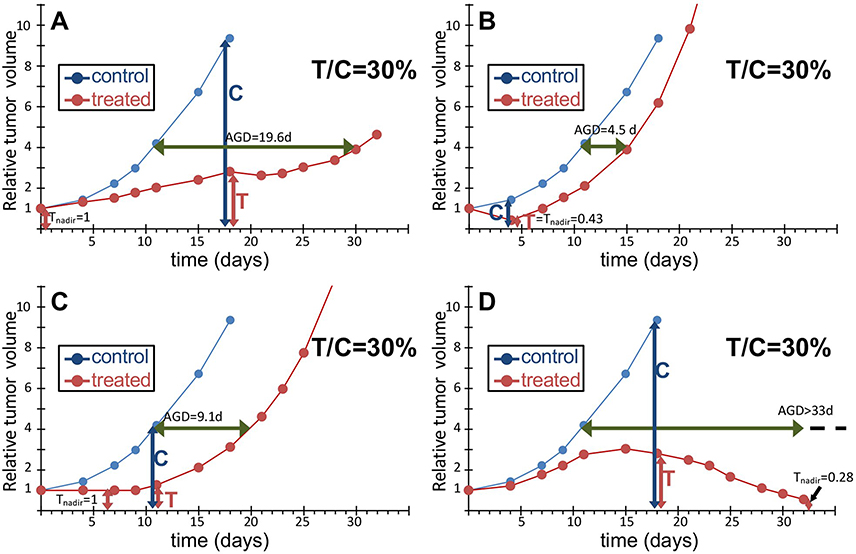 |
Figure 2 Different responses to treatment with the same T/C score. An example of tumor growth curve of a human xenograft growing in mice and treated (q7dx3) with an anticancer drug active on this tumor (A), with T/C 30% (see Figure 1), and three hypothetical examples giving the same T/C: a single dose with a purely cytotoxic drug where a fraction of cells is killed but survivors’ growth is unperturbed (B); a purely cytostatic drug repeatedly given to arrest proliferation until treatment is discontinued (C); a very active drug causing tumor regression (D). All treatment examples (red) share the same untreated control (blue). Abbreviation: AGD, Absolute growth delay. |
The situation where there is a reduction of the tumor mass, would be interpreted better by a simple measure of the nadir (the minimum) of the growth curve of a treated tumor relative to the tumor volume at the start of treatment (Tnadir), without dividing by the tumor volume reached at the same time in the control group, which is totally unrelated to the treatment effect. A relative Tnadir lower than 1 formally demonstrates the presence of a cytotoxic effect and gives an estimate of the fraction of surviving cells that is less biased than T/C. Of course the absence of tumor shrinkage is not sufficient to exclude a cytotoxic effect, which might have slow time-dependence and be masked by cell proliferation.
On the other side of the spectrum of treatment effects, the growth curve in Figure 2C is representative of a drug with pure cytostatic effects, with the tumor size remaining unchanged during treatment (“stable disease”). In this situation growth is simply delayed by treatment and a measure of this delay would be more representative of the effect. This is a 90° change in perspective compared to the T/C: while T/C is measured on the ordinate at a specific time, the growth delay is measured on the abscissa (the time) at a specific tumor size. Clearly the metrics are completely different. A common score of this kind is the absolute growth delay (see below).
Figure 2D shows a scenario where the tumor shrinks when untreated mice are no longer alive: because T/C is assessed at the last time on the control growth curve (day 18), it strongly underestimates the real efficacy of the treatment which leads to “complete remission” and might even be curative. To account for this kind of response without giving up the “T/C” score, one might imagine a variant of the method, where the control growth curve is extrapolated for a few days beyond the control measures, to cover an interval more appropriate for the treated outline; but a similar correction has never been considered, to our knowledge.
Even worse misuse of T/C is when one compares T/Cs from different experiments, with different control growth curves. Figure 3 shows the case of a cytostatic drug that simply halts proliferation and is given for several days, assuming that at the end of treatment proliferation is restored as before. The same effect is shown in a fast (Figure 3A) and in a slow (Figure 3B) tumor model. During treatment the growth curves of treated tumors are flat (complete absence of growth) and do not decrease (no cell killing), equally in the fast (panel A) and slow (panel B) models. After discontinuation of treatment, tumors start growing again, with the different basal growth rate, unrelated to the treatment effect. In an uncritical view one might deduce that the tumor shown in Figure 3A is sensitive (T/C 15%) while the one shown in Figure 3B is resistant (T/C 60%) to the drug, whereas the effect of the drug is exactly the same and the difference between the measured T/Cs is due to “C” (the control) as the denominator of the score. The example shows how misleading the T/C is when used to compare the efficacy of a drug in different tumor models. This practice, in our opinion, should not be accepted, except in the particular case when the control growth curves of the different tumor models are superimposable.
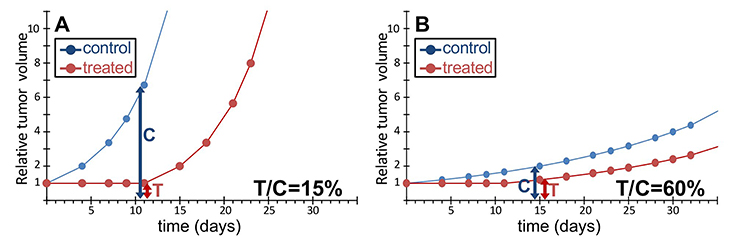 |
Figure 3 The same response to treatment with different T/C scores. Hypothetical examples of a simple cytostatic treatment in a fast (A) or slow (B) growing tumor model. Blue circles, untreated control; red circles, treatment. We assume that the treatment causes total growth arrest for 11 days in both cases, then tumors re-grow as if untreated. The difference in T/C values depends solely on the different denominator (“C”) and not the treatment. |
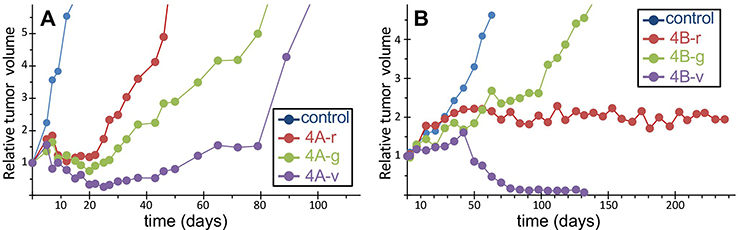 |
Figure 4 Two example experiments. Time courses of tumor size in untreated control (blue line, average of six mice) and in individual mice treated with different drugs and doses (red, green and violet lines). (A) data from an experiment comparing different schedules of a cytotoxic drug in an ovarian cancer model; (B) data from an experiment comparing a new drug (red line) with two dosages of another drug (green and violet lines) in a myxoid liposarcoma model. See Table 2 for the values of the scores T/C, %Gr, Tnadir and AGD. |
In the next sections we consider alternative scores used for evaluating treatment efficacy. Their values in the examples shown in Figure 2 and Figure 3 are reported in Table 1.
Percent Tumor Growth (%Gr) And Growth inhibition (%GrI)
Seeking a score that is more representative of the drug effect and less of the growth characteristics of untreated controls, researchers considered the change of tumor size between two time points, e.g. the start (time zero) and end of treatment,16,17 to measure the “percent growth” (%Gr) or the complementary “percent growth inhibition” (%GrI = 100 - %Gr). Sometime the two terms are used as synonyms, which can be a source of misunderstanding. Here we define %Gr as: %Gr = 100 x (ΔT/ΔC), where ΔT (=T-T0) and ΔC (=C-C0) are the increments of tumor size between the two time points in treated and control animals. In this way %Gr gives the percentage unaffected by treatment and %GrI gives the percent affected or “inhibited” (Figure 1B).
These scores are equivalent to those adopted in vitro, for instance in the NCI-60 drug screening program.18 There (https://dtp.cancer.gov/discovery_development/nci-60/methodology.htm) the percent growth is calculated with two distinct formulae:
(1A) (1B)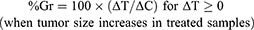
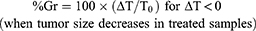
Ideally, Equation 1A measures a cytostatic affect, assuming absence of cell killing; conversely Equation 1B measures a cytotoxic effect, assuming absence of any reduction in the growth rate and giving a negative score corresponding to the percentage of lost (killed) cells. The second equation is applied when a cytotoxic effect (lethal for cells) is proved (T< T0); otherwise a pure cytostatic effect (without cell killing) cannot be excluded and this justifies the use of Equation 1A. With this definition, %Gr varies from 100% (no change compared to control) to 0% (completely arrested growth) and to −100% (all cells killed).
%Gr or %GrI scores are also used in in vivo studies, although only Equation 1A (or the corresponding %GrI) is applied, also in the negative range. This is conceptually nonsense, because it would normalize a size reduction in a treated tumor with a measure of the growth rate of controls (i.e. two completely different phenomena), and should be avoided. Instead Equation 1A with 1B, even with the limitations indicated, could be useful in vivo, improving the performance compared to the T/C score. In the examples reported in Figure 2, the %Gr can distinguish three out of four different scenarios: %Gr=22% (2A), −57% (2B), 0% (2C), 22% (2D) and would correctly give the same value (%Gr =0, stationary tumor) in the two examples in Figure 3. It provides no information, however, on the late effects of treatment: 2A (slow regrowth after treatment) gives the same score as (2D) (tumor regression and possibly cure).
LCK And Cell Surviving Fraction
Log cell kill (LCK) is defined as the logarithm of the reciprocal of the fraction of cells surviving treatment (“surviving fraction”, S): LCK≡ log10(1/S). For instance, if a drug kills 90% of the cells S= 0.1 and LCK=1; if it kills 99% of the cells S=0.01 and LCK=2; if it kills 99.9% of the cells S=0.001 and LCK=3 etc. LCK is usually estimated with the following formula:

where tT and tC are the mean time (days) required for the treated and control tumors respectively to reach a suitable size, and Dt is the mean doubling time of control tumors. The formula follows from a number of implicit assumptions: a) tumor growth of the control is exponential between t0 (the start of treatment) and tC, with doubling time Dt; b) surviving cells in the treated tumor were totally unaffected by the treatment (thus their population continues to expand from t0 to tT with the same Dt as untreated cells); c) the size of a tumor is directly proportional, with the same constant, to the number of malignant cells in control and surviving malignant cells in treated tumors, when the measures are taken (i.e. around tT and tC). Assumption (c) imposes a precise limit on the choice of the target size: the size should be measured when definitive tumor regrowth is observed and it is not affected by the presence of dead/dying cells. This may occur several days after the end of an effective treatment.
With the above assumptions it follows that for a target cell number (or volume) Ñ, Ñ= N0 2tC/Dt = S N0 2tT/Dt where N0 is the cell number (or volume) at the start of treatment, and thus: 1/S = 2(tT- tC)/Dt, from which the LCK formula readily follows.
In order to weaken assumptions (a) and (b) two variants of the LCK formula can be suggested:
- Using a direct measure of the doubling time in the re-growth phase of the treated tumor (Dtregrowth) to estimate the growth rate of surviving cells. This LCK calculated on the regrowth phase will be defined as: RLCK = log10(2) × (tT/Dtregrowth - tC/Dt).
- Assuming a cytostatic effect on surviving cells during treatment; in this way a net LCK is calculated including the duration of treatment: NLCK = log10(2) × (tT-tC – duration of treatment)/Dt
However, even with the latter corrections, these considerations suggest that LCK would measure the extent of cell killing properly only in certain specific situations.
Absolute Growth Delay (AGD)
AGD measures in days the difference between treated and control tumors in the time to reach a given target size. No clear consensus exists on the criteria for choosing the target size: some adopt as target 2x the size at the start of treatment (one doubling) others 3x or 4x (two doublings). However AGD is very sensitive to the length of treatment, so setting a general rule may not be advisable. In our opinion any target size can be selected, provided that i) it is smaller than the size where the growth rate in controls is significantly reduced (approaching the maximum size, or “carrying capacity”) and ii) the time to reach the target size can be accurately measured (i.e. not by interpolation of two measures taken between very distant time points), at least in the control group. Moreover, the target size should be high enough to be reached in treated samples only in the final regrowth phase and not associated with a temporary volume increase that may be observed during or immediately after treatment. For instance in the case shown in Figure 2A, a 2x target size is intercepted at day 11 of the treated tumor (AGD = 4.6d), catching a short-time increase, not representative of the true efficacy of the treatment. In this case a target size of 4x was reached on day 30 (AGD 19.6d) during the definitive regrowth of the tumor and would be a suitable choice. This is further explained by case 2D, where a 2x target size would give AGD 1.9 d, that is almost no effect, while the mouse was in fact cured. In this case, the 4x target was never reached during the observation period, meaning that the time to reach it was longer than the last experimental time. Of course a longer follow up would have given a more accurate estimate, but the information of the lower limit of AGD still provides a correct indication of the outcome. Thus a measure of AGD would distinguish between 2A and 2D scenarios, providing there is a long enough follow up.
From the above analyses follows that no single score is completely satisfactory, at best providing a partial view of the response to treatment. Considering %Gr, Tnadir and AGD together could serve to distinguish and interpret the different responses to treatment (Table 1). %Gr indicates a partial response (22%) during treatment in cases 2A and 2D, stable disease (0%) in 2C and a strong cytotoxic effect (−57%) in 2B, confirmed by the Tnadir of 0.43. However, in 2B regrowth was rapid, leading to a short AGD (4.5 days), while the AGD in 2C (9.1 days) was similar to the duration of treatment, suggesting that the strong cytostatic effect was released immediately after treatment discontinuation, and the long AGD (19.6 days) in 2A indicates the presence of delayed and lasting effects. In 2D the low Tnadir was reached only after 30 days and indicates a delayed cytotoxic effect which the very long ADG confirms as persistent. Correctly then, %Gr, Tnadir and AGD give similar values in scenarios 3A and 3B, built with the same responses to treatment.
Representative Experiments
Figure 4 and Table 2 demonstrate the use of %Gr, Tnadir and AGD to analyze the response to treatment in two representative experiments, taken from the historical records of the projects of our laboratory.
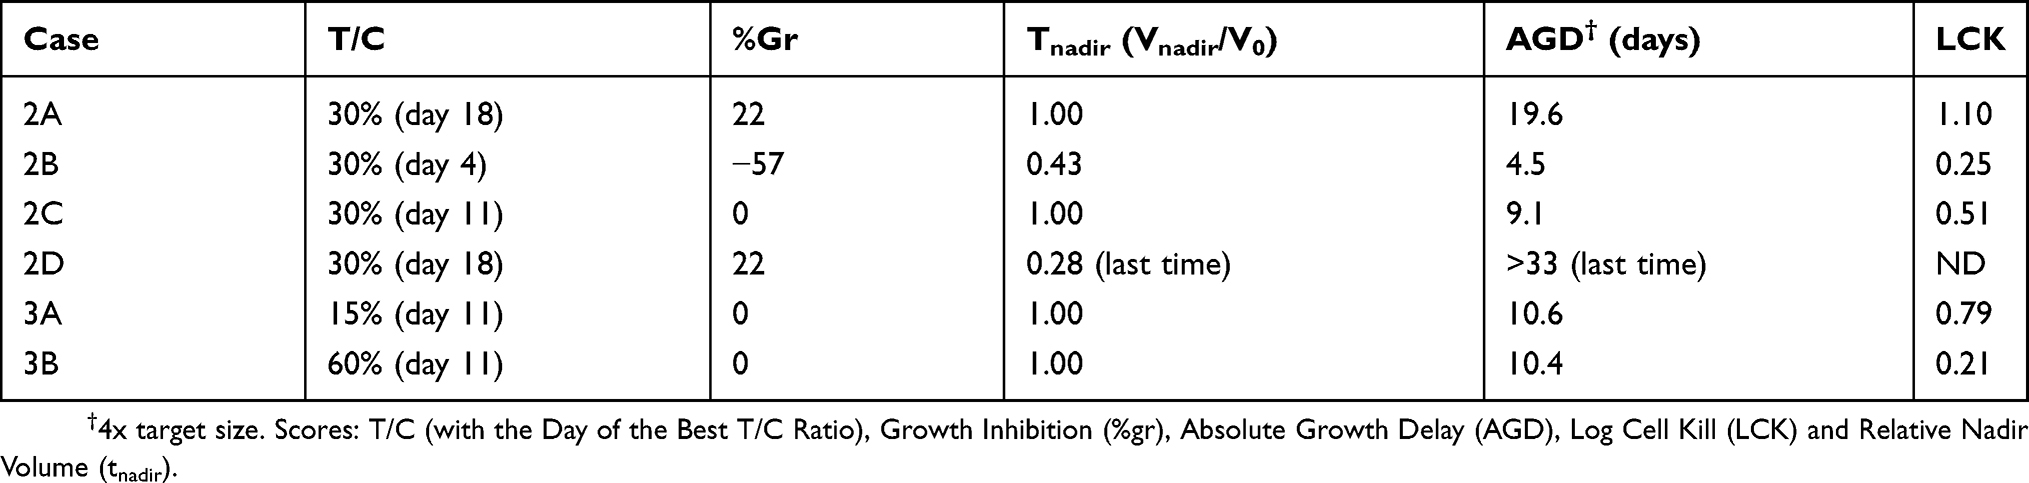 |
Table 1 Main Scores In The Case Examples Shown In Figures 2 and 3 |
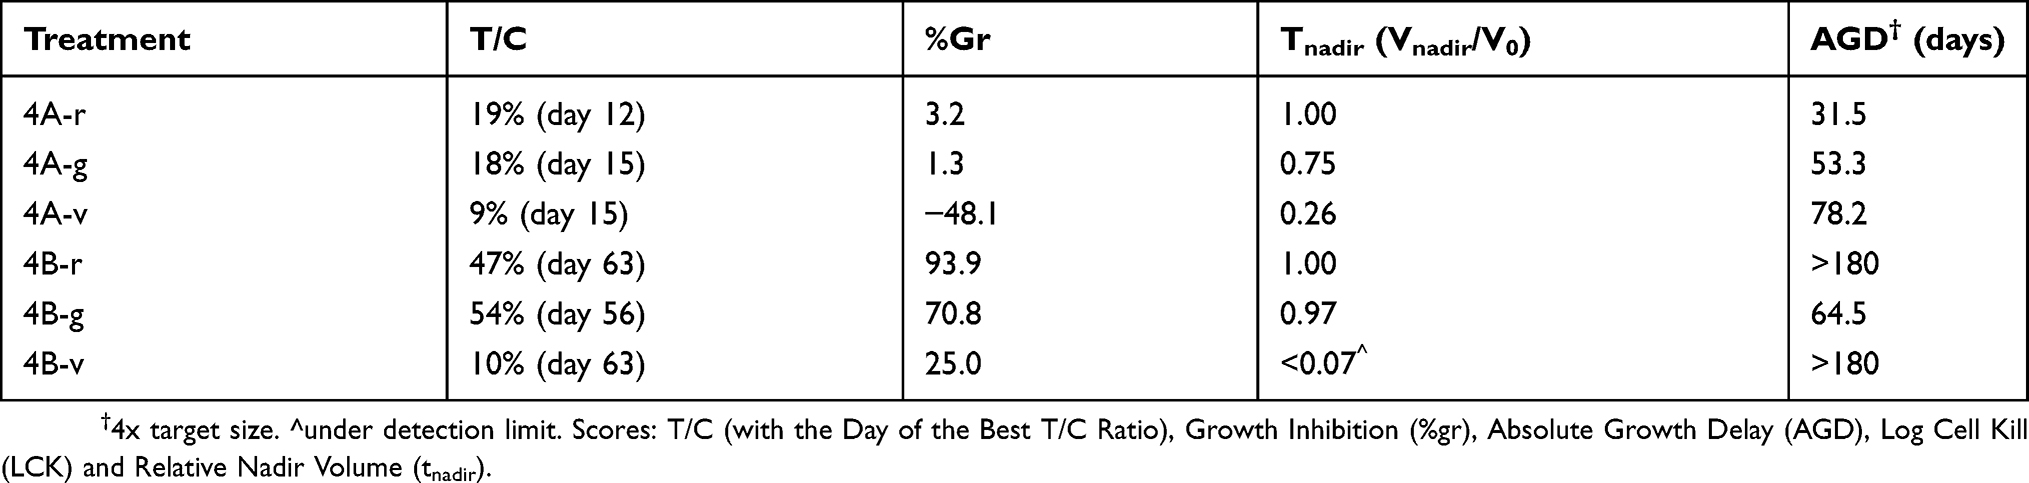 |
Table 2 Main Scores In The Representative Experiments Shown In Figure 4 |
The experiment shown in Figure 4A compared three schedules (here named 4A-r, 4A-g and 4A-v) of a cytotoxic drug in mice bearing an ovarian cancer patient-derived xenograft model. In all cases the tumor size decreased after about one week from the start of treatments, reached a nadir, then tumors regrew after a varying time. Due to the fast growth of the tumor, untreated animals were sacrificed shortly after the end of treatment, at day 15, and T/C could be calculated only up to that time, well before the maximum shrinkage was reached in the treated tumors. As a consequence, the T/C scores were sufficient to indicate that all treatments were active, but failed to estimate the differences among them (Table 2). In this respect %Gr, which also provided an evaluation of the response at day 15, enabled a more informative interpretation of the results, indicating almost zero-growth (respect to T0) for the 4A-r and 4A-g schedules and 48% shrinkage for the 4A-v schedule at that time. However tumor shrinkage continued after the end of the treatment, out of the reach of the T/C and %Gr scores, and its maximum was caught by Tnadir. Tnadir well discriminated the three treatments: 4A-r (Tnadir =1) was not able to reduce the tumor size below the starting point, 4A-g (Tnadir =0.75) caused (at least) 25% kill of tumor cells, 4A-v (Tnadir =0.26) induced the highest tumor regression, with (at least) 74% kill of tumor cells. Then the scenario of the response to treatment was completed by measuring the delay before tumor regrowth with the AGD score. AGD proved that unfortunately all tumors eventually regrew, but the treatments enabled a valuable gain of time before tumor progression, reaching 78 days (about 15 times the doubling time of this tumor) in the 4A-v schedule.
The experiment shown in Figure 4B compared the antitumor activity of one drug (4B-r), given for 28 days, with two dosages of a second drug (4B-g: lower dose; 4B-v: higher dose) in mice bearing a patient-derived myxoid liposarcoma xenograft model. Due to the slow growth of this tumor, untreated mice were sacrificed one month after the end of treatment, enabling to measure T/C up to day 63. For all treatments the best T/C was found at the end of this period, suggesting a similar efficacy for 4B-r and 4B-g and a higher activity for 4B-v. However again T/C gave only an incomplete and partially misleading view of the response to the treatments, which was correctly interpreted by the joint consideration of %Gr, Tnadir and AGD. First %Gr, measured at the end of treatment (day 28) indicated that 4B-r was completely ineffective to control tumor growth in this period, 4B-g induced only a modest inhibition of growth, while 4B-v enabled to slow down, but not reverse, tumor growth. The Tnadir under the detection limit indicated that a strong tumor shrinkage eventually occurred with 4B-v, while no tumor reduction was achieved with the other treatments. Then AGD provided here the key information: only in 4B-g the target size was reached while with 4B-r and 4B-v tumor size was still below that target after 6 months at the end of the experiment, indicating that not only 4B-v but also 4B-r successful stopped tumor growth. Thus 4B-r completely arrested tumor growth (AGD >180 days) but after the end of treatment (%Gr near 100% during treatment) without producing tumor shrinkage (Tnadir =1), while 4B-v apparently eradicated the tumor, which remained undetectable at six months. The response to 4B-r is indicative of a drug that induces differentiation, without cytotoxicity, while the second drug delayed tumor growth at a low dose (4B-g) and became cytotoxic at higher doses (4b-v).
Dealing With Replicates
Often the growth curves for control and treatment are represented as means or medians of the respective groups and the scores are calculated in these average curves, instead of being measured in individual mice. In our opinion the spread of this practice is unfortunate and tends to lead to wrong conclusions. First, because the information on the variability within the groups is lost, providing a single score for each treatment group and making any statistical comparison impossible. Second, because the “average” growth curve does not necessarily represent a real trend, particularly in the treatment group: for instance, if half of treated replicated tumors grow and half shrink, the average may be zero growth – quite different from the responses in individual mice. Finally, the average growth curve is flawed by the progressive loss of mice, as they are euthanized, making quite frequently the sudden (false) appearance of a volume decrease simply due to the death of a mouse with a big tumor, included in the calculation at an earlier time and excluded later. Usually researchers continue to calculate the average volume until a given number of mice are lost, with varying criteria.
The average growth curve may provide an accurate picture of the trend in a group only when all replicated tumor growth curves are similar over the whole observation period and differences within a group are mainly explained as measuring errors. Otherwise, when differences are due to biological variability in the shape of the curves, the “average” trend may be completely different from that in any tumor and may give misleading scores.
To overcome these limitations, it would be enough only to set a convenient “reference” for each score, considered as a simple “unit of measurement”, which could be obtained from control, such as “the average volume in the control group” or “the average time to reach a target volume in the control group”. One could then analyze individual growth curves (control or treated), calculating the scores relative to the reference, and apply standard statistical procedures.
Discussion
This analysis looks at several neglected limitations of the common scores for antiproliferative activity used in preclinical studies.16,19–21 In particular, T/C does not distinguish among very different responses, such as those in Figure 2, and indicates a non-existing difference between the responses shown in Figure 3. Another relatively popular score, LCK, relies on a number of implicit assumptions and we recommend great caution in its use and interpretation. LCK is useful to distinguish among treatments causing extensive cell killing (e.g. 99% vs 99.9% killed cells) but should definitely not be used to rate a treatment with a prevalent cytostatic effect.
The response to an active treatment is complex, including cytostatic and cytotoxic effects with their time- and dose-dependence, and these effects often do not run out when treatment is discontinued.9–11,22,23 In addition, when treated cells succeed in dividing, similar cytostatic and cytotoxic effects may be observed in their descendants as well.9,14,15 These phenomena – acting at the cellular level – are intertwined and act on the tumor growth curve with some delay, reducing the tumor mass or causing stable disease or, at least, slowing the growth rate. These “macroscopic” perturbations of the growth curve may emerge in time windows not known in advance and last an unpredictable time. It is not uncommon to observe a detectable change in the tumor volume not immediately after treatment starts, but after one or more weeks. Moreover, at the end of an entire treatment course with an active compound no regrowth may be detected for an additional period and eventually, when/if it occurs, the rate of regrowth may differ from the growth rate in untreated tumors. For all these reasons a single score, which photographs the situation at a specific instant, may be useful in some circumstances but misleading in others. We previously reported the feasibility of decoding the whole tumor growth curve with computational tools to reconstruct the dynamics of the underlying cytotoxic and cytostatic effects.24 However, this approach is not readily applicable for routine studies. In our opinion a simpler way to improve current practice would be to use several scores together, providing complementary information in different time windows covering the whole tumor growth history. The percent tumor growth between the start and end of treatment may be suitable for measuring the response in the initial time window. For instance, %Gr can distinguish between scenarios 2A, 2B and 2C (Figure 2). However, quite often tumor shrinkage occurs well after the end of treatment and regrowth is not observed until weeks later. Thus situations like those shown in Figure 2A and D would not be shown up by the %Gr score alone and a complementary evaluation of the existence and extent of tumor shrinkage will be necessary. This could be provided by the relative Tnadir, which is equal to one if the tumor mass does not decrease (Figure 2A), and equal to the fraction of residual mass, compared to that at the start of treatment, when shrinkage occurs at any time (Figure 2D). Tnadir also catches a mid-term post-treatment effect. Eventually, even when the tumor volume shrinks below the detection limit, regrowth may occur after a short or long time. To measure this response, AGD may be a significant long-term parameter, catching the duration of the effect. AGD may range from a few days, when there is a weak temporary cytostatic effect, to months in the case of long lasting effects, like persisting growth arrest or a persisting undetectable tumor. A cured or not regrowing tumor (Figure 2D) is also indicated well by the AGD: from the follow-up time, which can be extended at will, a lower limit can be obtained which may be conservatively assumed for the actual AGD when comparing treatment options.
Thus, while a single score provides only a partial view of the effect, a more robust interpretation of different types of response to treatment can be achieved considering, for example, %Gr, AGD and Tnadir together. When necessary, the regrowth rate (scored for instance by a “regrowth doubling time”- Dtregrowth) would provide additional information: if it differs from the growth rate of untreated tumors, this would prove the existence of a modification of the tumor itself or of its microenvironment. An example of the analysis of tumor growth in different time-windows was recently reported, for comparing different treatment schemes in ovarian cancer models.25
In conclusion, we believe that a considerable amount of information derivable from growth curves of treated tumors is lost in current practice, and we endorse the adoption of multi-parameter analysis and interpretation of the results. For this purpose, the combined use of %Gr, Tnadir, AGD and Dtregrowth, all easily obtainable from individual tumor growth curves, is a simple option, feasible in any research laboratory, with minimal or no change of the experimental procedures.
Acknowledgments
The generous contribution of the Italian Association for Cancer Research and the Nerina and Mario Mattioli Foundation is gratefully acknowledged. I thank Judith Baggott for editing the manuscript.
Disclosure
The author reports no conflicts of interest in this work.
References
1. Bissery MC, Guénard D, Guéritte-Voegelein F, et al. Experimental antitumor activity of taxotere (RP 56976, NSC 628503), a taxol analogue. Cancer Res. 1991;51:4845–4852.
2. Schabel FM, Griswold DP, Laster WR, et al. Quantitative evaluation of anticancer agent activity in experimental animals. Pharmacol Ther Part Chemother Toxicol Metab Inhib. 1977;1:411–435.
3. Skipper HE, Schmidt LH. A manual on quantitative drug evaluation in experimental tumor systems. I. Background, description of criteria, and presentation of quantitative therapeutic data on various classes of drugs obtained in diverse experimental tumor systems. Cancer Chemother Rep. 1962;17:1–143.
4. Wilcox WS, Griswold DP, Laster WR, et al. Experimental evaluation of potenital anticancer agents. XVII. Kinetics of growth and regression after treatment of certain solid tumors. Cancer Chemother Rep. 1965;47:27–39.
5. Dethlefsen LA, ed. Cell Cycle Effects of Drugs. Oxford: Pergamon Press; 1986.
6. Mauro F, Spanò M, Teodori L, et al. Cell cycle and effect of antineoplastic drugs: facts and pitfalls. Prog Clin Biol Res. 1983;132C:199–209.
7. Romano M, Frapolli R, Zangarini M, et al. Comparison of in vitro and in vivo biological effects of trabectedin, lurbinectedin (PM01183) and Zalypsis® (PM00104). Int J Cancer. 2013;133:2024–2033. doi:10.1002/ijc.28213
8. Lupi M, Matera G, Natoli C, Colombo V, Ubezio P. The contribution of p53 in the dynamics of cell cycle response to DNA damage interpreted by a mathematical model. Cell Cycle 2007;6:943–950. doi:10.4161/cc.6.8.4103
9. Ubezio P, Lupi M, Branduardi D, et al. Quantitative assessment of the complex dynamics of G1, S, and G2-M checkpoint activities. Cancer Res. 2009;69:5234–5240. doi:10.1158/0008-5472.CAN-08-3660
10. Lupi M, Cappella P, Matera G, Natoli C, Ubezio P. Interpreting cell cycle effects of drugs: the case of melphalan. Cancer Chemother Pharmacol. 2006;57:443–457. doi:10.1007/s00280-005-0044-1
11. Lupi M, Matera G, Branduardi D, et al. Cytostatic and cytotoxic effects of topotecan decoded by a novel mathematical simulation approach. Cancer Res. 2004;64:2825–2832. doi:10.1158/0008-5472.CAN-03-3810
12. Ubezio P, Falcetta F, Carrassa L, Lupi M. Integrated experimental and simulation study of the response to sequential treatment with erlotinib and gemcitabine in pancreatic cancer. Oncotarget. 2016;7:15492–15506. doi:10.18632/oncotarget.v7i13
13. Falcetta F, Lupi M, Colombo V, Ubezio P, Tucker-Kellogg G. Dynamic rendering of the heterogeneous cell response to anticancer treatments. PLoS Comput Biol. 2013;9:e1003293. doi:10.1371/journal.pcbi.1003293
14. Forrester HB, Albright N, Ling CC, Dewey WC. Computerized video time-lapse analysis of apoptosis of REC:myc cells X-irradiated in different phases of the cell cycle. Radiat Res. 2000;154:625–639. doi:10.1667/0033-7587(2000)154[0625:CVTLAO]2.0.CO;2
15. Forrester HB, Vidair CA, Albright N, et al. Using computerized video time lapse for quantifying cell death of X-irradiated rat embryo cells transfected with c-myc or c-Ha-ras. Cancer Res. 1999;59:931–939.
16. Lee F, Weinmann R. Animal cancer models in anticancer drug discovery and development. In: Azmi A, Mohammad RM, editors. Mouse Models of Human Blood Cancers. New York: Springer; 2008:245–258.
17. Zhao Y-Z, Lu C-T, Zhou Z-C, et al. Enhancing chemotherapeutic drug inhibition on tumor growth by ultrasound: an in vivo experiment. J Drug Target. 2011;19:154–160. doi:10.3109/10611861003801834
18. Shoemaker RH. The NCI60 human tumour cell line anticancer drug screen. Nat Rev Cancer. 2006;6:813–823. doi:10.1038/nrc1951
19. Wong H, Choo EF, Alicke B, et al. Antitumor activity of targeted and cytotoxic agents in murine subcutaneous tumor models correlates with clinical response. Clin Cancer Res. 2012;18:3846–3855. doi:10.1158/1078-0432.CCR-12-0738
20. Wong H, Vernillet L, Peterson A, et al. Bridging the gap between preclinical and clinical studies using pharmacokinetic-pharmacodynamic modeling: an analysis of GDC-0973, a MEK inhibitor. Clin Cancer Res. 2012;18:3090–3099. doi:10.1158/1078-0432.CCR-12-0445
21. Houghton PJ, Morton CL, Tucker C, et al. The pediatric preclinical testing program: description of models and early testing results. Pediatr Blood Cancer. 2007;49:928–940. doi:10.1002/pbc.21078
22. Cohen AA, Geva-Zatorsky N, Eden E, Page DC. Dynamic proteomics of individual cancer cells in response to a drug. Science. 2008;322:1511–1516. doi:10.1126/science.1166340
23. Toettcher JE, Loewer A, Ostheimer GJ, Yaffe MB, Tidor B, Lahav G. Distinct mechanisms act in concert to mediate cell cycle arrest. Proc Natl Acad Sci U S A. 2009;106:785–790. doi:10.1073/pnas.0806196106
24. Falcetta F, Bizzaro F, D’Agostini E, Bani MR, Giavazzi R, Ubezio P. Modeling cytostatic and cytotoxic responses to new treatment regimens for ovarian cancer. Cancer Res. 2017;77:6759–6769. doi:10.1158/0008-5472.CAN-17-1099
25. Bizzaro F, Falcetta F, D’Agostini E, et al. Tumor progression and metastatic dissemination in ovarian cancer after dose-dense or conventional paclitaxel and cisplatin plus bevacizumab. Int J Cancer. 2018;143(9):2187–2199. doi:10.1002/ijc.31596
 © 2019 The Author(s). This work is published and licensed by Dove Medical Press Limited. The full terms of this license are available at https://www.dovepress.com/terms.php and incorporate the Creative Commons Attribution - Non Commercial (unported, v3.0) License.
By accessing the work you hereby accept the Terms. Non-commercial uses of the work are permitted without any further permission from Dove Medical Press Limited, provided the work is properly attributed. For permission for commercial use of this work, please see paragraphs 4.2 and 5 of our Terms.
© 2019 The Author(s). This work is published and licensed by Dove Medical Press Limited. The full terms of this license are available at https://www.dovepress.com/terms.php and incorporate the Creative Commons Attribution - Non Commercial (unported, v3.0) License.
By accessing the work you hereby accept the Terms. Non-commercial uses of the work are permitted without any further permission from Dove Medical Press Limited, provided the work is properly attributed. For permission for commercial use of this work, please see paragraphs 4.2 and 5 of our Terms.