")
Back to Journals » Diabetes, Metabolic Syndrome and Obesity » Volume 13
Berberine Down-Regulated Myostatin Expression and Facilitated Metabolism via Smad Pathway in Insulin Resistant Mice
Received 3 August 2020
Accepted for publication 30 October 2020
Published 23 November 2020 Volume 2020:13 Pages 4561—4569
DOI https://doi.org/10.2147/DMSO.S275301
Checked for plagiarism Yes
Review by Single anonymous peer review
Peer reviewer comments 2
Editor who approved publication: Professor Ming-Hui Zou
Lingyan Chen,1,* Xiaojuan Su,2,* Yu Hu1
1Geriatric Department, Zhongshan Hospital, Fudan University, Shanghai 200032, People’s Republic of China; 2Geriatric Department, Xiamen Branch, Zhongshan Hospital, Fudan University, Xiamen 361015, People’s Republic of China
*These authors contributed equally to this work
Correspondence: Yu Hu
Geriatric Department, Zhongshan Hospital, Fudan University, No. 180 Fenglin Road, Shanghai 200032, People’s Republic of China
Tel/Fax +86 21-64041990
Email [email protected]
Objective: To explore the effect of berberine (BBR) on skeletal muscle mass and metabolism and the possible mechanism.
Methods: Eight-week-old male C57BL/6 mice were fed with a high-fat diet (HFD) for 8 weeks to establish the insulin resistance obesity model. Then, mice were randomly divided into two groups (normal chow diet (NCD) and HFD), while NCD and HFD were further classified into two groups respectively, which were NCD+CS (Carmellose Sodium), NCD+BBR, HFD+CS and HFD+BBR. After the BBR intervention, insulin tolerance test (ITT) and glucose tolerance test (GTT) were carried out. Metabolic parameters and inflammatory biomarkers were detected. Various parts of adipose tissue and gastrocnemius were separated and measured. The gastrocnemius muscle was selected for tissue staining. The mRNA expression of myostatin (Mstn) was tested by quantitative real-time PCR (RT-PCR). Western blotting was performed to detect the expression of Mstn, phosphatidylinositol 3-kinase (PI3K), protein kinase B (Akt), small ribonucleoprotein particle protein 2 (Smd2), small ribonucleoprotein particle protein 3 (Smd3), and small ribonucleoprotein particle protein 4 (Smd4).
Results: Both body weights (P< 0.01) and various parts of fat mass (P< 0.001) were decreased significantly, while muscle mass was increased in the HFD group after being treated with BBR. Meanwhile, the glucose and lipid metabolic disorders as well as inflammation status were improved. RT-PCR and Western blotting analysis showed that, after being fed with HFD the expression of Mstn mRNA and Mstn were significantly increased, and decreased after being treated with BBR. Western blotting analysis also showed that, compared with the NCD group, the expressions of Smad2, Smad3, and Smad4 were all increased in the HFD group, but after being treated with BBR, the expressions of Smad3 and Smad4 were decreased.
Conclusion: Our study revealed that BBR could improve metabolic disorders and inflammation status, decrease Mstn expression, and increase skeletal muscle mass, which was associated with the Smad pathway.
Keywords: skeletal muscle, myostatin, berberine, Smad pathway
Introduction
Sarcopenia, which is a syndrome characterized by age-related progressive decline of skeletal muscle mass and function,1 has increasing adverse clinical consequences for the development of frailty, disability, falls, even death.2–4 As skeletal muscle is an important target of insulin and responsible for the majority of the body’s glucose disposal, loss of skeletal muscle may produce insulin resistance which will result in substantial whole-body inflammation and metabolic disturbances. So far there are several studies that have demonstrated the relationship between sarcopenia and insulin resistance and metabolic disorders.5–7 Mstn (myostatin), which is one of the TGF-β (transforming growth factor β) superfamily members, is an important inhibitor of skeletal muscle growth and plays a critical role in the development of sarcopenia.8,9 A few studies have reported that Mstn can regulate body metabolism as well.11,12
BBR (Berberine) is the principal bioactive ingredient of Rhizoma coptidis, a common traditional Chinese medicinal herb. In recent years, more and more studies have shown that BBR can improve insulin sensitivity and metabolic disorders.13,14 A few studies reported BBR could up-regulate Glucose transporter 4 (Glut4) expression, increase glucose uptake of skeletal muscle, improved insulin resistance and inflammatory status in skeletal muscle, and increased skeletal muscle fiber quantity,15,16 which was just the opposite effect of Mstn.12 BBR regulates the metabolism in the skeletal muscle by multiple pathways. A study by Yu et al17 showed that BBR could reduce MAPK (Mitogen-activated protein kinase) activity and increase ATP (adenosine triphosphate) production in skeletal muscle cells by increasing the expression of AMPK (Adenosine 5ʹ-monophosphate (AMP)-activated protein kinase) phosphorylation, SIRT1 (silent information regulator 1), and PCG-1α (Peroxisome proliferator-activated receptorγcoactivator-1α). Another study showed BBR improved skeletal muscle insulin resistance by down-regulating the TLR4/IKK β/NF-κB, and PPARα (peroxisome proliferators-activated receptor α) signaling pathways.18
Both Mstn and BBR were associated with metabolism, however, whether BBR can increase muscle mass or there is a link between Mstn and BBR is still unclear. The aim of this study was to explore the interaction between BBR and Mstn, and the possible mechanism of their influence on metabolism and skeletal muscle mass in an insulin resistant mice model.
Materials and Methods
Animals
Eight-week-old male C57BL/6 mice (20–25 g) were purchased from the laboratory animal center of Nantong University and the protocol was authorized by the IACUC (Institutional Animal Care and Use Committee) of Nantong University. In total, 24 mice were used, and there were six mice of each group. The study was conducted in accordance with the Guide for Care and Use of Laboratory Animals as adopted and promulgated by the United National Institutes of Health. All experimental protocols were approved by the Review Committee for the Use of Human or Animal Subjects of Zhongshan Hospital of Fudan University (No. 2020–058). Mice were kept in an environmentally controlled room (22–25°C, 40–70% humidity, and 12/12 circadian rhythm), with water, and diets were provided ad libitum. After 1-week acclimation, mice were fed with NCD (normal chow diet: carbohydrate 78%, fat 4%, protein 18%, Slaccas, Shanghai, China) or HFD (high-fat-diet: carbohydrate 35%, fat 45%, protein 20%, Research Diet, Mediscience Ltd, USA) for 12 weeks. Then mice were randomly divided into two groups and gavaged daily with either 0.5% CS (Carmellose Sodium) or BBR in CS suspension (Sigma, 200 mg/kg) for another 8 weeks (NCD and HFD) using flexible catheter implantation tubing attached to a cut 22-G needle tip. Then NCD and HFD were further classified into four groups, which were NCD+CS, NCD+BBR, HFD+CS, and HFD+BBR. Body weight and food intake were measured weekly. There were 24 mice in total, and six mice per each sub-group.
Measurement of Plasma Glucose, Lipid and Insulin Levels, and Inflammatory Biomarkers
Six mice in each group were fasted overnight and then were anesthetized. Mice were anesthetized (30 mg/kg of pentobarbital by intraperitoneal injection). Blood (3 mL) was collected through the abdominal aorta, and serum was centrifuged and stored at −80°C for further use. BG (Blood glucose), insulin (Ins), TG (triacylglycerol), TC (total cholesterol), LDL-C (low density lipoprotein cholesterol), and HDL-C (high density lipoprotein cholesterol), FFA (free fatty acid), were measured with an automatic biochemical analyzer. ELISA examination was carried out to detect serum TNF-α (tumor necrosis factor alpha) (MTA00B; R&D Systems, Minneapolis, MN), CRP (C-reactive protein) (MCRP00, R&D Systems, Minneapolis, MN), and Insulin (EZRMI-13K, Millipore, Billerica, MA) based on the instruction of the manufacturer.
Glucose Tolerance Test (GTT) and Insulin Tolerance Test (ITT)
All mice were deprived of food overnight (22:00 to 8:00) before being adopted in the glucose tolerance test. After injecting intraperitoneally with D(+)-glucose (Sigma, 2 g/kg body weight). Blood glucose concentrations were tested at 0, 15, 30, 60, 90, and 120 minutes after glucose injection. For the insulin tolerance test (ITT), all mice were deprived of food from 9:00 to 15:00 h and injected with 0.75 U/kg insulin (Novo Nordisk Pharmaceutical industries, Malov, Denmark) per 1 kg body weight.19 The blood of the mice were collected via lateral tail vein blood. The Breeze 2 Blood Glucose Meter (Bayer HealthCare LLC, Mishawaka, IN) was used for blood glucose concentration measurement.
Histology of Skeletal Muscle and Adipose Tissue
Histological analysis of skeletal muscle and adipose tissue obtained from the mice post-mortem was performed according to standard laboratory protocols. The weight of inguinal fat as subcutaneous adipose tissue (SAT) was measured. Epididymal fat, mesenteric fat, omentum fat, and perirenal fat were weighed as visceral adipose tissue (VAT). The fat in the shoulder blade area was separated as brown adipose tissue (BAT). Gastrocnemius muscle were separated as skeletal muscle mass (SMM), dried with filter paper, and weighed. A little gastrocnemius muscle tissue was fixed with 4% paraformaldehyde and embedded in paraffin. Sections of 5 μm were sectioned with a Leica microtome (RM2155, Wetzlar, Germany). Routine hematoxylin and eosin were carried out to stain the sections according to standard procedures. Pictures were collected by microscopy (DP71, Olympus, Japan) and processed with Image J (NIH, 64 bit).
Quantitative RT-PCR
High quality total RNA from the gastrocnemius muscle was isolated by RNAiso plus (9108, TaKaRa, Tokyo, Japan). Primary cDNA was synthesized by the HiScript II Q RT SuperMix with gDNA wiper kit (R223-01, Vazyme, Nanjing, China). Quantitative RT-PCR was performed with the AceQ qPCR SYBR Green Master Mix kit (Q141-02, Vazyme, Nanjing, China) in the sequence detector (ABI7700, Applied Biosystems, Foster City, CA, USA). The primers used for Mstn (KY441464) and 36b4 were as follows: Mstn, 5ʹ-AGAAGATGGGCTGAATCCCT-3ʹ (forward), 5ʹ-GAGTGCTCATCGCAGTCAAG-3ʹ (reverse); 36b4, 5ʹ-GAAACTGCTGCCTCACATCCG-3ʹ (forward), 5ʹ-GCTGGCACAGTGACCTCACACG-3ʹ (reverse). The data were analyzed using the ΔΔCT method of analysis and expressed as arbitrary units after normalization to the levels of expression of 36b4 for each sample.
Western Blotting
Total protein extracts from the gastrocnemius muscle were homogenized in RIPA-based lysis buffer (30 mM HEPES at pH 7.6, 100 mM NaCl, 0.5% Nonidet P-40, protease inhibitor cocktail from Roche, 1 mM Sodium orthovanadate (Na3VO4) and 20 mM Sodium fluoride (NaF)) and incubated on ice for 10 minutes. The whole mixture was followed by centrifugation at 12,000 g for 15 minutes at 4°C, and then was denatured for 10 minutes in a boiled water bath. The concentrations of samples were detected by Enhanced BCA Protein Assay Kit (P0009, Beyotime Biotechnology, Nantong, China). Protein fractions were subsequently separated by different concentrations of SDS-PAGE according to target proteins. After the electrophoresis, proteins were blotted onto the PVDF membranes and incubated with certain antibodies which were diluted with an appropriate ratio overnight. The blots were detected by ECL development after being conjugated with the secondary antibodies. Image J software was used for quantification of labeled Western blots. The gray scale data were collected and quantified by normalizing to GAPDH (ab8245, Abcam). The other primary antibodies were all obtained from Abcam company: Anti-Smad2 (ab40855), Anti-Smad3 (ab40854), Anti-Smad4 (ab40759), Anti-Myostatin (ab71808), and Anti-pan-AKT (ab8805).
Statistical Analysis
Data were shown as means±SEM. Statistical differences were determined by one-way and two-way ANOVA with Tukey’s multiple comparisons test using SPSS 23.0 to assess statistical differences across multiple conditions. The Student-Newman-Keuls post-hoc test was used to compare the means among specific groups. Statistical significance was set as P<0.05.
Results
BBR Reduced Body Weight and Fat Mass, but Increased SMM
After being fed with a HFD, significant increases were noted in the body weights (P<0.001), muscle mass (P<0.01), and fat mass, including VAT, SAT, and BAT (all P<0.001), when compared with their normal fed controls. After being treated with BBR for 8 weeks, both body weight (P<0.01) and various parts of fat mass (P<0.001) were decreased significantly, while gastrocnemius muscle mass was increased (P<0.05) (Figure 1). HE stain showed that after being fed with a HFD, the number of skeletal muscle fibers decreased, while in those treated with BBR, the number of skeletal muscle fibers increased, which was significant in the NCD group (Figure 2).
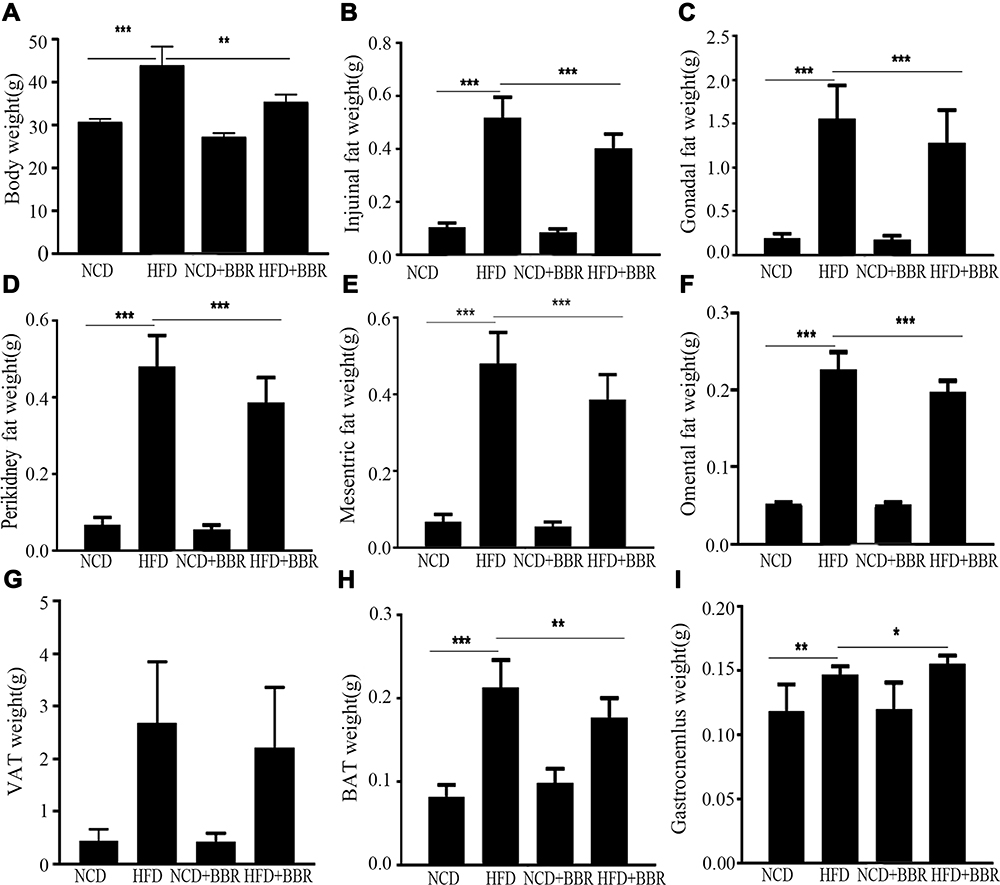 |
Figure 1 The changes of body weight (A), inguinal fat weight (B), gonadal fat weight (C), peri-kidney fat weight (D), mesenteric fat weight (E), omental fat weight (F), VAT weight (G), SAT weight (H), and gastrocnemius weight (I) among the NCD, HFD, NCD+BBR, and FHD+BBR groups. *P<0.05; **P<0.01; ***P<0.001. |
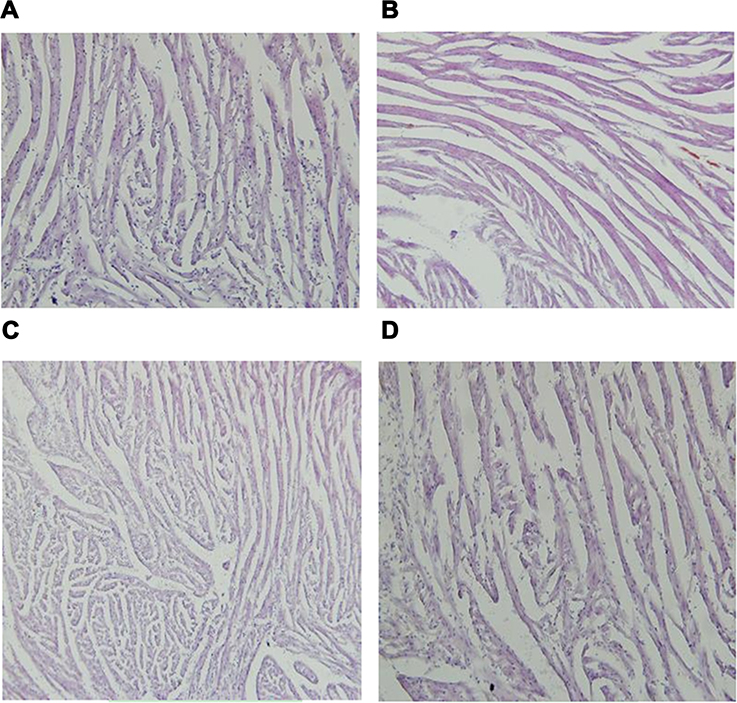 |
Figure 2 The changes of HE stain of gastrocnemius muscle in NCD (A), HFD (B), NCD+BBR (C), and FHD+BBR (D) groups. |
BBR Improved Metabolic Disorders and Inflammation Status
When compared with the NCD group, there was remarkable elevation of circulating levels of glucose and lipids in the HFD group, including (FBG, TC, TG, HDL-C, LDL-C, FFA, and insulin as well as inflammatory biomarkers CRP and TNF-α) (all P<0.001). After beingtreated with BBR, both the glucose and lipid metabolism as well as inflammation status were improved. But all of the above values were still higher than the NCD group, which indicated BBR could only partially improve metabolic disorders and inflammation (Figure 3). Moreover, GTT and ITT indicated that BBR treated mice had an increased glucose clearance rate and improved insulin sensitivity in the HFD group (Figure 4).
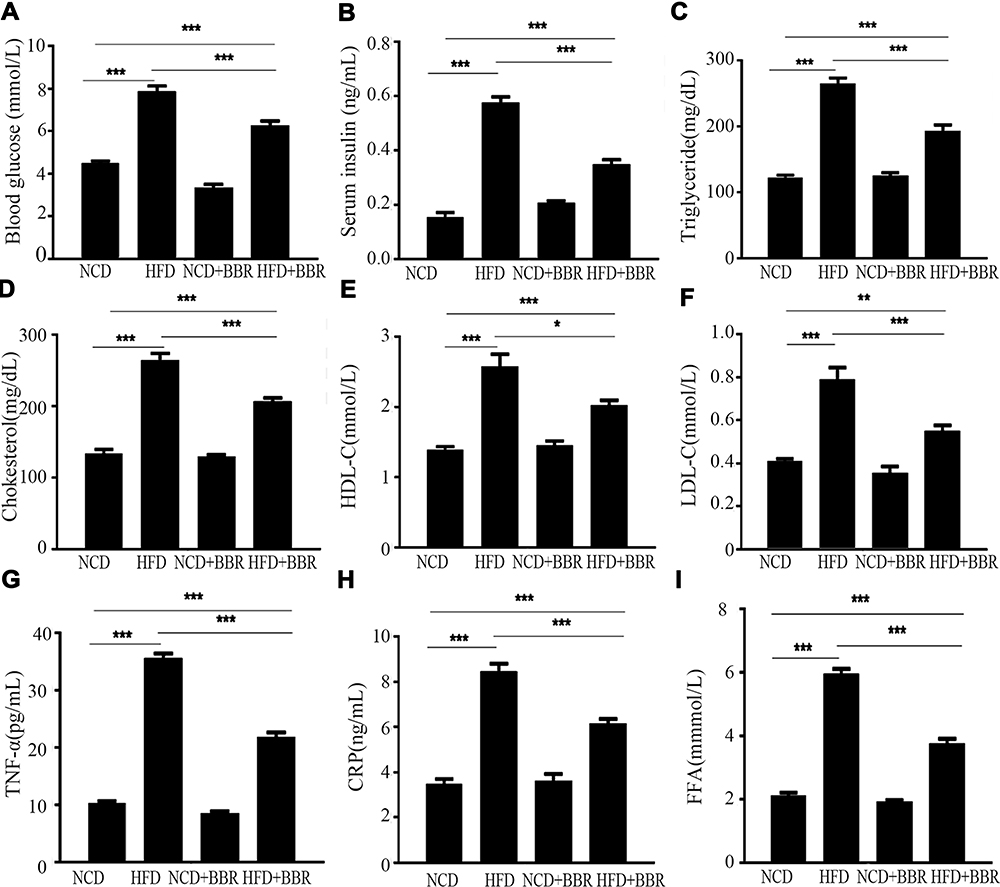 |
Figure 3 The changes of blood glucose (A), serum insulin (B), triglyceride (C), cholesterol (D), HDL-C (E), LDL-C (F), TNF-α (G), CRP (H), and FFA (I) among the NCD, HFD, NCD+BBR, and FHD+BBR groups. *P<0.05; **P<0.01; ***P<0.001. |
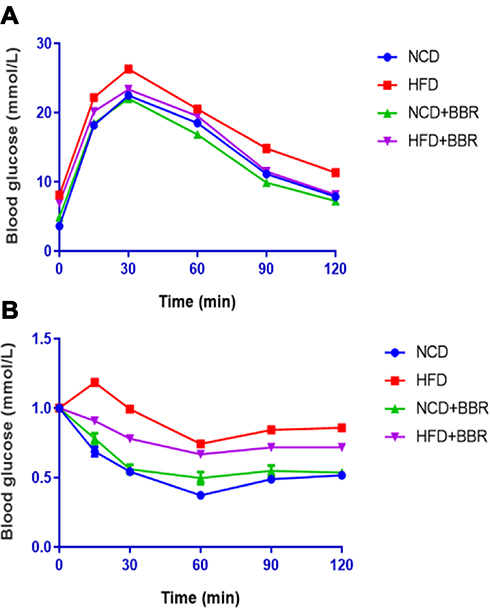 |
Figure 4 GTT (A) and ITT (B) results of NCD, HFD, NCD+BBR, and FHD+BBR groups at different times. |
BBR Down-Regulated Mstn Expression
When compared with the NCD group, the results showed that both the expression of Mstn mRNA and Mstn protein were increased dramatically (P<0.01) after being fed with a HFD. After being treated with BBR, the Mstn expression was decreased dramatically, which was presented as Mstn mRNA expression decreased by 48% (P<0.01) and Mstn protein decreased by 32% by fold change (P<0.01). However, no significant changes were noted in NCD mice (Figure 5).
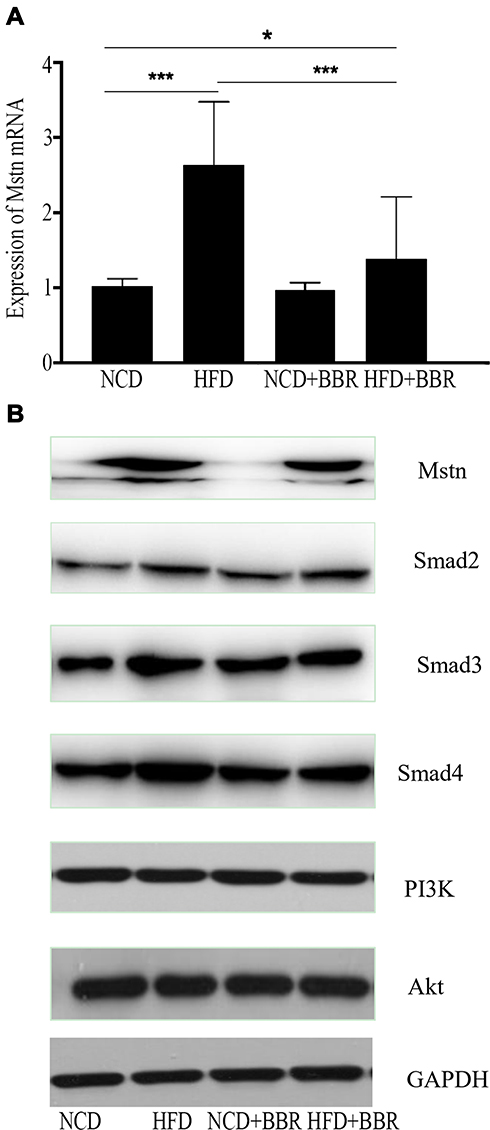 |
Figure 5 The changes of expression of Mstn mRNA among NCD, HFD, NCD+BBR, and FHD+BBR groups (A). The Western blot results of Mstn, Smad pathway, and PI3K/Akt pathway NCD, HFD, NCD+BBR, and FHD+BBR groups (B). *P<0.05; ***P<0.001. |
Smad Pathway Was Inhibited During the Effects of BBR
When fed with HFD, the expression of Smad2, Smad3, and Smad4 were all increased when compared to the NCD group, but no changes of PI3K or Akt were observed. After being treated with BBR, the expression of Smad3 and Smad4 were decreased in the HFD group, and still showed no significant difference of PI3K and Akt, which prompted that the Smad pathway was activated by HFD, and BBR could inhibit it. These results indicated that the Smad pathway was related with BBR, Mstn, and metabolism in skeletal muscle.
Discussion
This study presented that HFD-induced insulin resistance was associated with metabolism homeostasis dysfunction and increased Mstn expression. BBR could down-regulate the expression of Mstn, increase SMM, and facilitate metabolic disorders and inflammation status, which was associated with the Smad pathway. Mstn is a critical inhibitor of skeletal muscle growth and development. Beyond the confines of its traditional role, Mstn has recently been shown to play an important role in the regulation of metabolism.11,12 Several studies showed elevated levels of Mstn in muscle have been associated with obesity and insulin resistance.11,12,20 Mstn(-/-) mice and treatment of Mstn antagonist exhibited reduced fat accumulation, peripheral insulin resistance, and enhanced glucose disposal,21,22 and these were consistent with our results that Mstn increased with adiposity as well as glucose and lipids metabolic disorders in HFD mice, while BBR induced reduction of Mstn was associated with improvement of metabolic disorders and reduced fat accumulation in adipose tissue. A study by Zhu et al23 showed ectopic fat deposition including accumulation of peri-muscular adipose tissue could accelerate age- and obesity-induced muscle atrophy. The gastrocnemius muscle weight increase with ascending Mstn in the HFD group might be due to the ectopic fat deposition in muscle, which can be examined in our further research. Prolonged high caloric intake leads to metabolic overload and insulin resistance, resulting in macrophage accumulation and leading to an increased inflammatory response.24,25 The overproduced pro-inflammatory cytokines, such as TNF-α and other inflammatory molecules including FFA, and CRP, resulted in further requirement of macrophages and impaired fat oxidation and synthesis of glycogen and protein.25,26 The above is also one of the pathogenesis related with sarcopenia.27 Therefore, the treatment of BBR could improve inflammation which partly contributed to facilitating metabolic dysfunction and increased muscle mass. When compared with the NCD group, there was remarkable elevation of circulating levels of glucose and lipids in the HFD group, including FBG, TC, TG, HDL-C, LDL-C, and FFA. However, the results of HDL-C were controversial, as it should be inversely proportional to other lipid profile biomarkers. It should be that TG, TC, and LDL-C were increased, but HDL-C was decreased. This needed to be further evaluated.
Mstn, one of the TGFβ superfamily members, can activate several signal pathways, but the Smad pathway is considered to be the most significant. Mstn binds ActRIIB (activin type IIB receptor) to activate downstream signals, ultimately resulting in Smad2/3 phosphorylation and translocation to the nucleus to modulate the transcription of numerous genes together with the co-mediator Smad4.27,28 The present study showed that the expression of Smad3 and Smad4 increased with Mstn when fed with HFD, while treatment with BBR down-regulated the expression of Smad3 and Smad4 with Mstn expression decreasing, which was similar to the studies by Watts et al28, and Fuentes et al.29, and Fuentes et al.FuentesFuentes As the PI3K/AKT pathway is importantly involved in insulin‐stimulated glucose uptake, we further tested whether Mstn modulated metabolism interacted with the insulin pathway. The result presented no significant difference of the expression of PI3K and AKT between groups, which was inconsistent with previous studies.30 However, the study by Liu et al12 used C2C12 cells to explore perturbations in insulin induced intracellular signaling of insulin action, and the study by Retamales et al30 investigated crosstalk between the IGF-1 and MSTN signaling pathways were different. Both these two studies applied interventions directly involved in insulin pathway, and did not used BBR for intervention, so there is no comparability between them. The results indicated that up-regulated Smad signaling accounted for at least a proportion of adiposity and Mstn related metabolic disorders, and BBR can facilitate muscle metabolism and increased muscle mass at least partly by the Smad pathway, which was insulin independent.
Our study first discovered the relationship between BBR and Mstn, put forward the possible mechanism, and provided a new direction for the treatment of sarcopenia and metabolic disorders. Further study should be carried out to examine the role of Smad pathway in the relationship between BBR and metabolism as well as Mstn. Whilst it is unlikely that Mstn alone are implicated in the atrophic effects on skeletal muscle, subsequent myogenic factors such as MyoD and myogenin attributed to myogenesis should also be considered. Since many other molecules such as AMPK are critical in insulin action and metabolism, further experiments need to be performed to examine whether BBR and Mstn may regulate the metabolism by other pathways involved in the insulin effect.
Conclusion
Our findings indicated that high caloric intake induced metabolic disorders was associated with Mstn over-expression, and the treatment with BBR could improve metabolic disorders, down-regulate Mstn expression, and increase skeletal muscle mass, which was associated with inhibiting the Smad signaling pathway.
Funding
This work was supported by youth fund of Zhongshan Hospital, Fudan University (2017ZSQN37).
Disclosure
The authors report no conflicts of interest in this work.
References
1. Jheng JR, Chen YS, Ao UI, et al. The double-edged sword of endoplasmic reticulum stress in uremic sarcopenia through myogenesis perturbation: ER stress in uremic sarcopenia. J Cachexia Sarcopenia Muscle. 2018;9(3):570–584. doi:10.1002/jcsm.12288
2. Bischoff-Ferrari HA, Orav JE, Kanis JA, et al. Comparative performance of current definitions of sarcopenia against the prospective incidence of falls among community-dwelling seniors age 65 and older. Osteoporos Int. 2015;26(12):2793–2802. doi:10.1007/s00198-015-3194-y
3. Beaudart C, Biver E, Reginster JY, et al. Validation of the SarQoL(R), a specific health-related quality of life questionnaire for Sarcopenia. J Cachexia Sarcopenia Muscle. 2017;8(2):238–244. doi:10.1002/jcsm.12149
4. De Buyser SL, Petrovic M, Taes YE, et al. Validation of the FNIH sarcopenia criteria and SOF frailty index as predictors of long-term mortality in ambulatory older men. Age Ageing. 2016;45:602–608. doi:10.1093/ageing/afw071
5. Kim TN, Park MS, Lim KI, et al. Relationships between sarcopenic obesity and insulin resistance,inflammation, and vitamin D status: the Korean Sarcopenic Obesity Study. Clin Endocrinol (Oxf). 2013;78:525–532. doi:10.1111/j.1365-2265.2012.04433.x
6. Petta S, Ciminnisi S, Di Marco V, et al. Sarcopenia is associated with severe liver fibrosis in patients with non‐alcoholic fatty liver disease. Aliment Pharmacol Ther. 2017;45:510–518. doi:10.1111/apt.13889
7. Han E, Lee YH, Kim G, et al. Sarcopenia is associated with albuminuria independently of hypertension and diabetes: KNHANES 2008–2011. Metabolism. 2016;65(10):1531–1540. doi:10.1016/j.metabol.2016.07.003
8. Patel HP, Al-Shanti N, Davies LC, et al. Lean mass, muscle strength and gene expression in community dwelling older men: findings from the Hertfordshire Sarcopenia Study (HSS). Calcif Tissue Int. 2014;95(4):308–316. doi:10.1007/s00223-014-9894-z
9. Arounleut P, Bialek P, Liang LF, et al. A myostatin inhibitor (propeptide-Fc) increases muscle mass and muscle fiber size in aged mice but does not increase bone density or bone strength. Exp Gerontol. 2013;48:898–904.
10. Xin XB, Yang SP, Li X, et al. Proteomics insights into the effects of MSTN on muscle glucose and lipid metabolism in genetically edited cattle. Gen Comp Endocrinol. 2020;291:113237. doi:10.1016/j.ygcen.2019.113237
11. Liu XH, Bauman WA, Cardozo CP. Myostatin inhibits glucose uptake via suppression of insulin-dependent and independent signaling pathways in myoblasts. Physiol Rep. 2018;17:e13837.
12. Hu X, Zhang Y, Xue Y, Zhang Z, Wang J. Berberine is a potential therapeutic agent for metabolic syndrome via brown adipose tissue activation and metabolism regulation. Am J Transl Res. 2018;10:3322–3329.
13. Pirillo A, Catapano AL. Berberine, a plant alkaloid with lipid- and glucose-lowering properties: from in vitro evidence to clinical studies. Atherosclerosis. 2015;243:449–461. doi:10.1016/j.atherosclerosis.2015.09.032
14. Yu Y, Zhao Y, Teng F, et al. Berberine improves cognitive deficiency and muscular dysfunction via activation of the AMPK/SIRT1/PGC-1a pathway in skeletal muscle from naturally aging rats. J Nutr Health Aging. 2018;22(6):710–717. doi:10.1007/s12603-018-1015-7
15. Wu YY, Zha Y, Liu J, et al. Effect of berberine on the ratio of high-molecular weight adiponectin to total adiponectin and adiponectin receptors expressions in high-fat diet fed rats. Chin J Integr Med. 2016. doi:10.1007/s11655-016-2518-x
16. Zhang DS, Bai XH, Yao YJ, Mu DZ, Chen J. Effect of berberine on the insulin resistance and TLR4/IKKbeta/NF-kappaB signaling pathways in skeletal muscle of obese rats with insulin resistance. Sichuan Da Xue Xue Bao Yi Xue Ban. 2015;46:827–831.
17. Zhang Q, Xiao X, Feng K, et al. Berberine moderates glucose and lipid metabolism through multipathway mechanism. Evid Based Complement Alternat Med. 2011;2011:1–10. doi:10.1155/2011/924851
18. Hittel DS, Axelson M, Sarna N, Shearer J, Huffman KM, Kraus WE. Myostatin decreases with aerobic exercise and associates with insulin resistance. Med Sci Sports Exerc. 2010;42:2023–2029.
19. Nagy C, Einwallner E. Study of in vivo glucose metabolism in high-fat diet-fed mice using Oral Glucose Tolerance Test (OGTT) and Insulin Tolerance Test (ITT). J Vis Exp. 2018;131:56672.
20. Zhang C, McFarlane C, Lokireddy S, et al. Myostatin-deficient mice exhibit reduced insulin resistance through activating the AMP-activated protein kinase signalling pathway. Diabetologia. 2011;54(6):1491–1501. doi:10.1007/s00125-011-2079-7
21. Cleasby ME, Jarmin S, Eilers W, et al. Local overexpression of the myostatin propeptide increases glucose transporter expression and enhances skeletal muscle glucose disposal. Am J Physiol Endocrinol Metab. 2014;306(7):E814–E823. doi:10.1152/ajpendo.00586.2013
22. Zhu S, Tian Z, Torigoe D, et al. Aging- and obesity-related peri-muscular adipose tissue accelerates muscle atrophy. PLoS One. 2019;14(8):e0221366. doi:10.1371/journal.pone.0221366
23. Xu H, Barnes GT, Yang Q, et al. Chronic inflammation in fat plays a crucial role in the development of obesity-related insulin resistance. J Clin Invest. 2003;112:1821–1830.
24. Qatanani M, Lazar MA. Mechanisms of obesity-associated insulin resistance: many choices on the menu. Genes Dev. 2007;21(12):1443–1455. doi:10.1101/gad.1550907
25. Bastard JP, Maachi M, Lagathu C, et al. Recent advances in the relationship between obesity, inflammation, and insulin resistance. Eur Cytokine Netw. 2006;17:4–12.
26. Kalinkovich A, Livshits G. Sarcopenic obesity or obese sarcopenia: a cross talk between age-associated adipose tissue and skeletal muscle inflammation as a main mechanism of the pathogenesis. Ageing Res Rev. 2017;35:200–221. doi:10.1016/j.arr.2016.09.008
27. Watts R, McAinch AJ, Dixon JB, O’Brien PE, Cameron-Smith D. Increased Smad signaling and reduced MRF expression in skeletal muscle from obese subjects. Obesity (Silver Spring). 2013;21(3):525–528. doi:10.1002/oby.20070
28. Fuentes EN, Pino K, Navarro C, Delgado I, Valdés JA, Molina A. Transient inactivation of myostatin induces muscle hypertrophy and overcompensatory growth in zebrafish via inactivation of the SMAD signaling pathway. J Biotechnol. 2013;168(4):295–302. doi:10.1016/j.jbiotec.2013.10.028
29. Retamales A, Zuloaga R, Valenzuela CA, Gallardo-Escarate C, Molina A, Valdés JA. Insulin-like growth factor-1 suppresses the Myostatin signaling pathway during myogenic differentiation. Biochem Biophys Res Commun. 2015;464(2):596–602. doi:10.1016/j.bbrc.2015.07.018
30. Liu XH, Bauman WA, Cardozo CP. Myostatin inhibits glucose uptake via suppression of insulin-dependent and -independent signaling pathways in myoblasts. Physiol Rep. 2018;6:e13837.
 © 2020 The Author(s). This work is published and licensed by Dove Medical Press Limited. The full terms of this license are available at https://www.dovepress.com/terms.php and incorporate the Creative Commons Attribution - Non Commercial (unported, v3.0) License.
By accessing the work you hereby accept the Terms. Non-commercial uses of the work are permitted without any further permission from Dove Medical Press Limited, provided the work is properly attributed. For permission for commercial use of this work, please see paragraphs 4.2 and 5 of our Terms.
© 2020 The Author(s). This work is published and licensed by Dove Medical Press Limited. The full terms of this license are available at https://www.dovepress.com/terms.php and incorporate the Creative Commons Attribution - Non Commercial (unported, v3.0) License.
By accessing the work you hereby accept the Terms. Non-commercial uses of the work are permitted without any further permission from Dove Medical Press Limited, provided the work is properly attributed. For permission for commercial use of this work, please see paragraphs 4.2 and 5 of our Terms.