")
Back to Journals » Patient Preference and Adherence » Volume 9
Behavioral economics survey of patients with type 1 and type 2 diabetes
Authors Emoto N , Okajima F , Sugihara H, Goto R
Received 1 February 2015
Accepted for publication 31 March 2015
Published 11 May 2015 Volume 2015:9 Pages 649—658
DOI https://doi.org/10.2147/PPA.S82022
Checked for plagiarism Yes
Review by Single anonymous peer review
Peer reviewer comments 3
Editor who approved publication: Dr Johnny Chen
Naoya Emoto,1 Fumitaka Okajima,1 Hitoshi Sugihara,2 Rei Goto3,4
1Division of Endocrinology, Department of Medicine, Nippon Medical School Chiba Hokusoh Hospital, Chiba, 2Department of Endocrinology, Diabetes and Metabolism, Graduate School of Medicine, Nippon Medical School, Tokyo, 3Hakubi Center of Advanced Research, Kyoto University, Kyoto, 4Graduate School of Economics, Kyoto University, Kyoto, Japan
Background: Adherence to treatment and the metabolic control of diabetes are challenging in many patients with diabetes. The theory of neuroeconomics can provide important clues for understanding unreasonable human behavior concerning decisions between outcomes occurring at different time points.
Objective: We investigated patients with type 1 and type 2 diabetes to determine whether patients who are at a risk of developing complications are less risk averse. We also examined whether patients with type 1 and type 2 diabetes have different behavioral traits in decision making under risk.
Methods: We conducted a behavioral economics survey of 219 outpatients, 66 with type 1 diabetes and 153 with type 2 diabetes. All patients had been referred by general practitioners or other departments in the hospital. At the time of the survey, levels of hemoglobin A1c were not significantly different between patients with type 1 and type 2 diabetes.
Results: Patients with type 2 diabetes showed a lower response rate to the survey compared with patients with type 1 diabetes (71.9% vs 87.9%, P<0.01). Logistic regression analysis indicated that diabetic retinopathy was negatively associated with risk averse in pricing of hypothetical lotteries, myopic time preference, willingness to pay for preventive medicine, and levels of satisfaction with life. Diabetic nephropathy was also negatively associated with risk averse in pricing of hypothetical lotteries. Detailed analysis revealed that a lower proportion of patients with type 2 diabetes (22.7%) were categorized as risk averse compared with patients with type 1 diabetes (43.1%, P<0.05) in hypothetical lottery risk estimation.
Conclusion: This is the first report that investigated patients with diabetes in a clinical setting using a method based on behavioral economics. The results suggest that the attitude of patients toward risk plays an important role in the progress of the complications of diabetes. Different educational and psychological approaches may be necessary to assess patients with diabetes based on whether they have traits such as risk seeking or risk averse.
Keywords: neuroeconomics, hypothetical lottery, risk averse
Introduction
There are two types of diabetes mellitus. Type 1 diabetes is caused by the lack of insulin secretion resulting from an autoimmune destruction of insulin-secreting pancreatic β cells.1 Management of type 1 diabetes is mainly by exogenous insulin replacement, including insulin analogs depending on each patient’s severity of insulin deficiency. Type 2 diabetes is initially caused by insulin resistance, which is closely related to the accumulation of abdominal fat resulting from overeating, the lack of exercise, relative insulin deficiency, first phase insulin defect, and incretin deficiency.2 The standard treatment for type 2 diabetes is dietary therapy and appropriate exercise, followed by sequential addition of oral antihyperglycemic agents, GLP-1 receptor agonists, or insulin injection (basal and/or mealtime).3 Large prospective clinical studies show a strong relationship between glycemia and diabetic microvascular complications in both type 1 and type 2 diabetes.4,5 However, modification of lifestyle habits, as well as adherence to pharmacological treatment, proves to be challenging in many patients.6–8 It remains unclear why many patients with diabetes cannot make the necessary lifestyle changes and cannot adhere to pharmacological treatment, both of which are obviously beneficial for their future health.
The theory of neuroeconomics, an emerging field of study dealing with anomalies of the classical economics rationale, can provide important clues for understanding unreasonable human behavior concerning decisions between outcomes occurring at different time points.9 Neuroeconomics studies have demonstrated that humans and animals prefer rewards with short-term availability over rewards with long-term availability.8,9 A recent report by economists investigating rational models of addiction indicated that those who emphasize future rewards and those who give more importance to rewards that are certain were significantly more likely to continue to abstain from smoking.10 Using an analogy, investigating personal attitude toward risks may provide important information for the treatment of patients with diabetes, especially for difficult-to-treat patients. However, to date, there has been no study analyzing behavior in patients with diabetes from a neuroeconomics perspective. In the present study, we conducted the first behavioral economics survey of patients with type 1 and type 2 diabetes to determine whether patients who are at a risk of developing complications are less risk averse. On the other hand, in our preliminary study, we found that patients with type 2 diabetes with poor glycemic control tended to avoid answering questions dealing with decision making in hypothetical situations. Therefore, we also examined whether patients with type 1 and type 2 diabetes have different behavioral traits in terms of decision making under risk.
Patients and methods
All the patients (487 patients) with diabetes treated by an endocrinologist at the outpatient clinic of endocrinology at Nippon Medical School Chiba Hokusoh Hospital from November 2012 to April 2013 were included in this study. The hospital is one of three local base hospitals in a rural area of Japan with a population of 700,000. The clinic provides care to patients with diabetes who have been referred by general practitioners or other departments in the hospital because of poor metabolic control or unstable complications. Of the 487 patients, 268 were excluded because of psychiatric disease, mental retardation, dementia, active malignant disease, unstable endocrine disease, or refusal to participate in the survey. Therefore, 219 outpatients were eligible for the behavioral economics survey, 66 with type 1 diabetes and 153 with type 2 diabetes. Patients with type 1 diabetes were defined as those with acute onset of insulin-dependent diabetes or positive anti-glutamic acid decarboxylase or anti-islet antigen-2 antibodies. All other patients were defined as having type 2 diabetes. The survey and an explanation sheet that included a consent form were handed out at the outpatient clinic. Participants also received a book coupon worth 500 yen (JPY 500= USD 5) as a token remuneration. The completed survey forms were returned by mail. The survey questionnaire used in this study is shown in Table 1. The first nine questions were modified from the Japan Household Survey on Consumer Preferences and Satisfaction (QA–QI),11,12 and the others were developed specifically for the present study (QJ–QQ). The HbA1c levels were determined by high-performance liquid chromatography using HLC723G8 (Tosoh, Co., Tokyo, Japan) and presented as the equivalent National Glycohemoglobin Standardization Program values. To evaluate retinopathy, ophthalmologists performed fundoscopy after pupillary dilatation, based on the Davis classification:13 no diabetic retinopathy, simple diabetic retinopathy, preproliferative diabetic retinopathy, and proliferative diabetic retinopathy, including panretinal photocoagulation. Nephropathy was defined as urinary albumin excretion ≥30 mg/g creatinine or estimated glomerular filtration rate <30 mL/min/1.73 m2. The survey results and patient data were compared and analyzed. The study protocol, including the consent form with a confidentiality clause, was approved by the Internal Review Board of the Nippon Medical School Chiba-Hokusoh Hospital Ethics Committee.
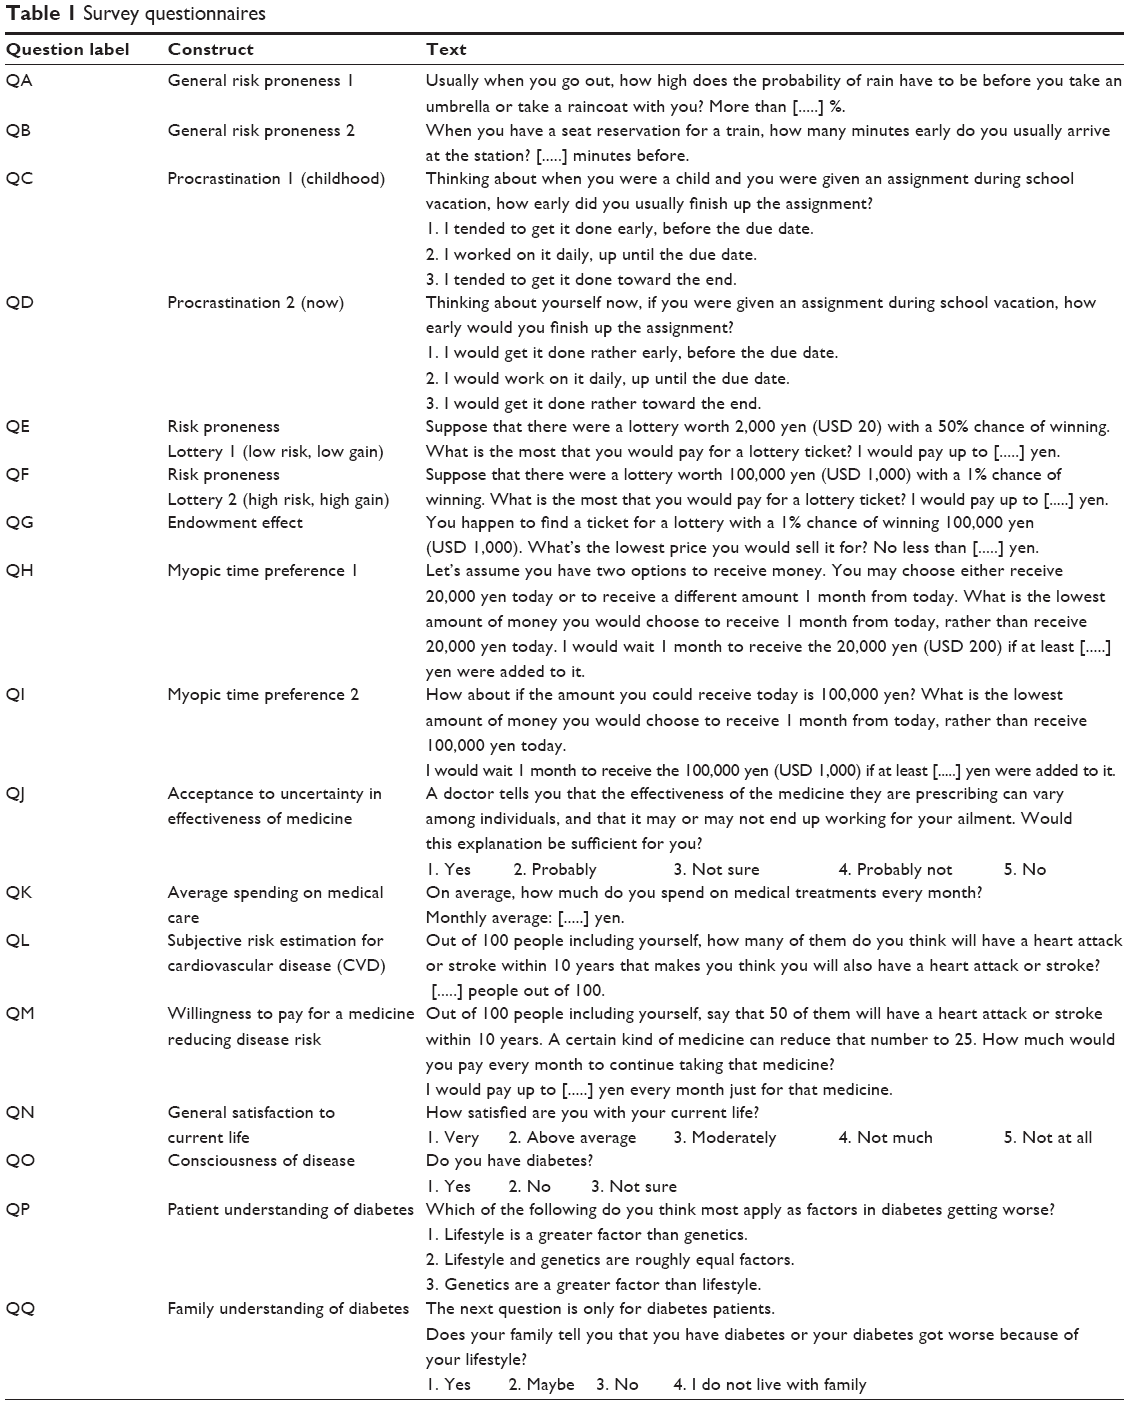 | Table 1 Survey questionnaires |
Statistical analyses
Statistical analyses were performed using JMP® 11 (SAS Institute Inc., Cary, NC, USA). Continuous variables were compared using the Student’s t-test, Welch’s t-test, or Mann–Whitney U-test. Stratified comparisons were performed using the Mantel–Haenszel procedure. Frequency analysis was performed using the Fisher’s exact probability test and the McNemar’s chi-square test. The relationship between continuous variables was investigated using Spearman’s rank correlation coefficient. Multiple logistic regression analysis was used to select answers significantly associated with diabetic complications.
Results
Patient characteristics
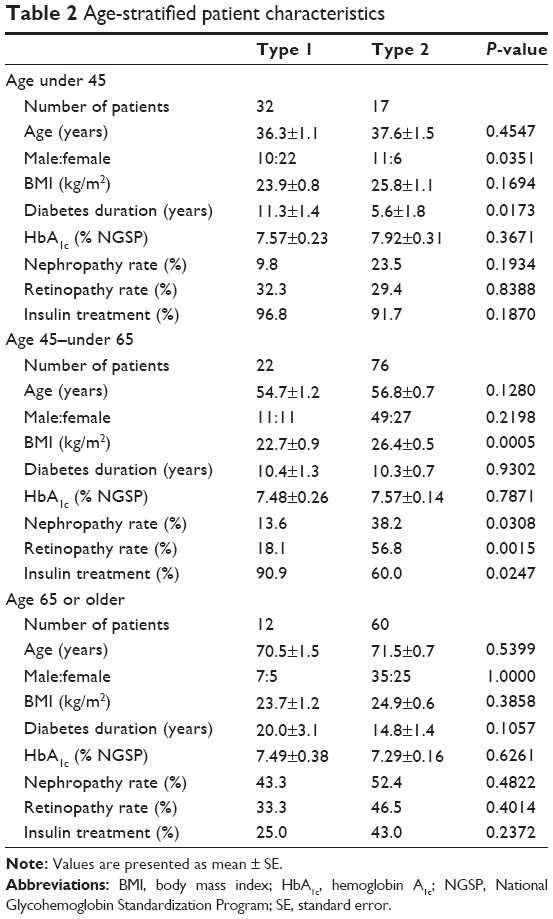
Age-stratified characteristics of patients investigated in this study are shown in Table 2. Levels of HbA1c were not significantly different between patients with type 1 and type 2 diabetes in any age category. Diabetes duration was significantly shorter in young (under 45 years of age) patients with type 2 diabetes. Body mass index (BMI) and prevalence of nephropathy and retinopathy were significantly higher in middle-aged (45–under 65 years of age) patients with type 2 diabetes. Furthermore, in young patients, the sex ratio differed between patients with type 1 and type 2 diabetes, with more females than males in the type 1 diabetes group. Therefore, we performed stratified analysis according to age and sex, when necessary.
 | Table 2 Age-stratified patient characteristics |
Survey response rate
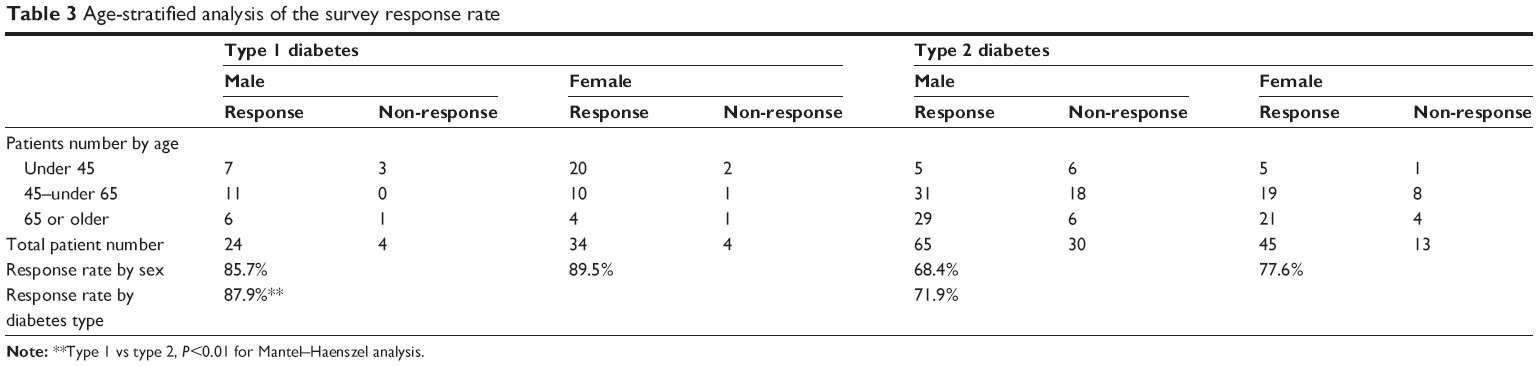
The survey response rate in patients with type 2 diabetes was significantly lower than that in patients with type 1 diabetes (71.9% vs 87.9%, Table 3). Age-stratified analysis using the Mantel–Haenszel test confirmed that the response rate in patients with type 2 diabetes was significantly lower than that in patients with type 1 diabetes (P<0.01).
 | Table 3 Age-stratified analysis of the survey response rate |
Logistic regression analysis of factors associated with complications
Before logistic regression analysis, we examined statistical correlation between responses to the questionnaires. QE (lottery 1 low risk, low gain) and QF (lottery 2 high risk, high gain) were significantly correlated (P<0.01). QH (myopic time preference 1) was also significantly correlated with QI (myopic time preference 2) (P<0.01). Therefore, we eliminated QF and QI from the logistic regression analysis in order to avoid multicollinearity. We also removed QD (procrastination 2) because of apparent correlation with QC (procrastination 1).
Table 4 shows the results of logistic regression analysis of factors associated with retinopathy. The model produced a good fit for the data given the statistical significance of the likelihood-ratio chi-square test (P<0.0001). In the standard logit results (Wald test), the parameters of diabetes type, diabetes duration, levels of HbA1c, hypothetical lottery risk estimation (low risk, low gain) (QE), myopic time preference (QH), willingness to pay for medicine (QM), and levels of satisfaction with life (QN) showed statistical significance. According to the estimate, type 1, myopic time preference, and willingness to pay for a medicine reducing disease risk were negatively associated with progression of retinopathy. On the other hand, diabetes duration, HbA1c, and risk seeking (pricing higher) in hypothetical lottery (QE) were positively associated with retinopathy. Patients who selected very in QE (general satisfaction to current life) had no retinopathy or only simple diabetic retinopathy.
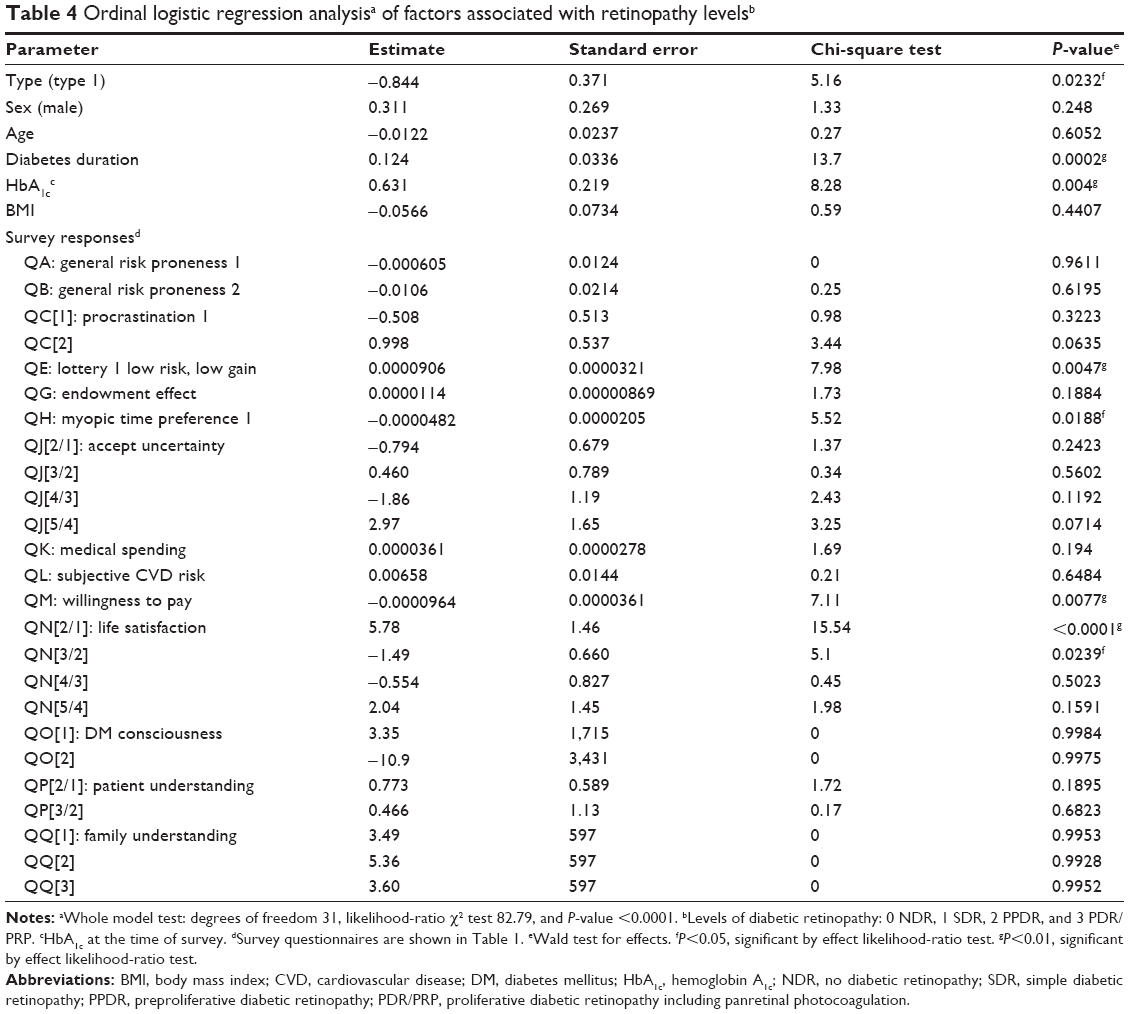 | Table 4 Ordinal logistic regression analysisa of factors associated with retinopathy levelsb |
Table 5 shows the results of logistic regression analysis of factors associated with nephropathy. Nephropathy was significantly associated with age, BMI, and risk seeking in hypothetical lottery (QE), but not with diabetes type, diabetes duration, or levels of HbA1c at the time of the survey.
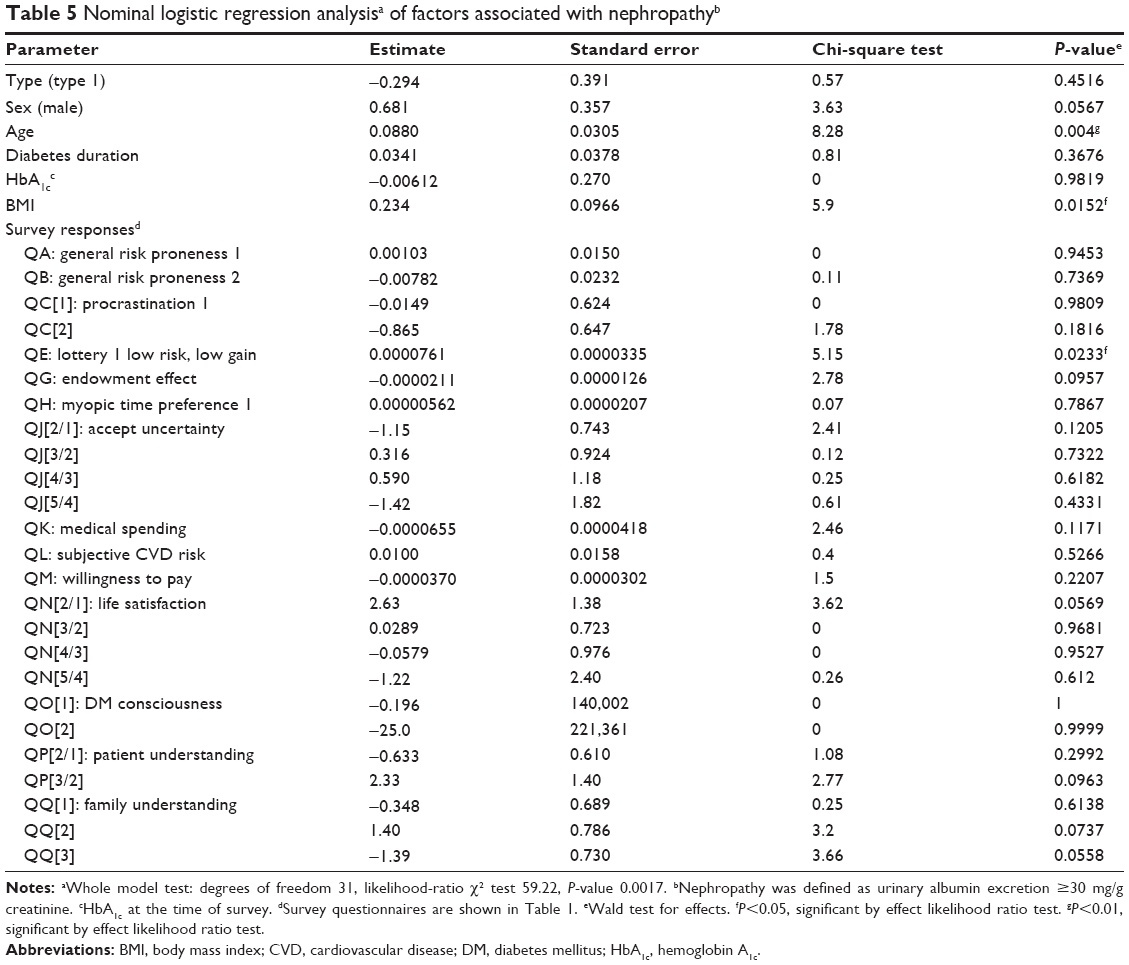 | Table 5 Nominal logistic regression analysisa of factors associated with nephropathyb |
Attitude toward hypothetical lottery risk and type of diabetes
Question QE, which was associated with both retinopathy and nephropathy, is a standard question that asks patients about certainty equivalents for uncertain benefits.14,15 Questions QE (lottery 1 low risk, low gain) and QF (lottery 2 high risk, high gain) evaluate the ability to accurately understand the question and the ability to estimate the risk quantitatively (mathematical literacy) and are designed to assess attitudes toward risk. Mathematical expectation in both situations is 1,000 yen (USD 10). The responses to these questions ranged widely from 0 yen to 100,000 yen (USD 1,000) in patients with type 1 diabetes and from 0 yen to 50,000 yen (USD 500) in patients with type 2 diabetes (Figure 1). The mean values of patients’ pricing were not significantly different between patients with type 1 and type 2 diabetes, but the variances were not the same. Therefore, we performed detailed analysis of the responses to questions QE and QF comparing type 1 with type 2 diabetes. Patients who responded ≤1,000 yen (USD 10) to both QE and QF were categorized as risk averse. Patients who responded >1,000 yen, do not know, or provided no answer were categorized as risk seeking or no answer. We also categorized the answer zero as risk seeking or no answer, because the answer zero is similar to do not know or no answer rather than reflecting strong risk aversion.14 The results are shown in Table 6. Frequency analysis using Fisher’s exact test revealed that a significantly higher proportion of patients with type 1 diabetes were categorized as risk averse compared with patients with type 2 diabetes (P<0.05).
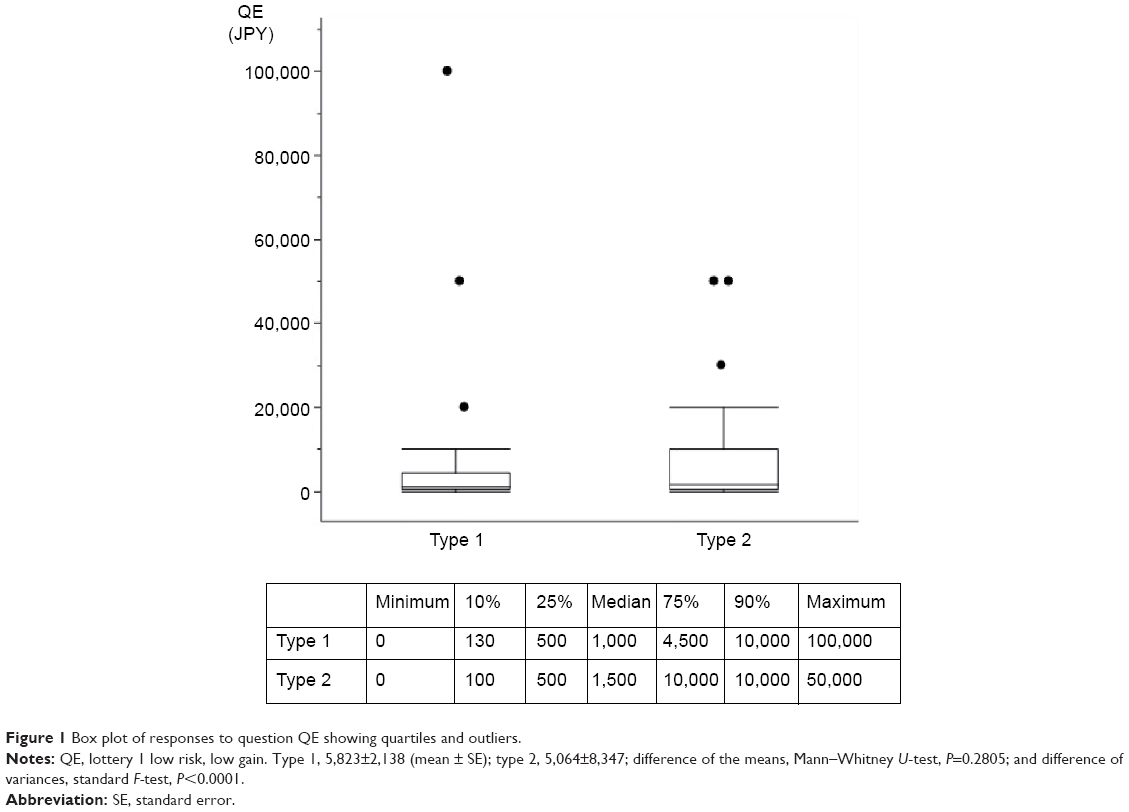 | Figure 1 Box plot of responses to question QE showing quartiles and outliers. |
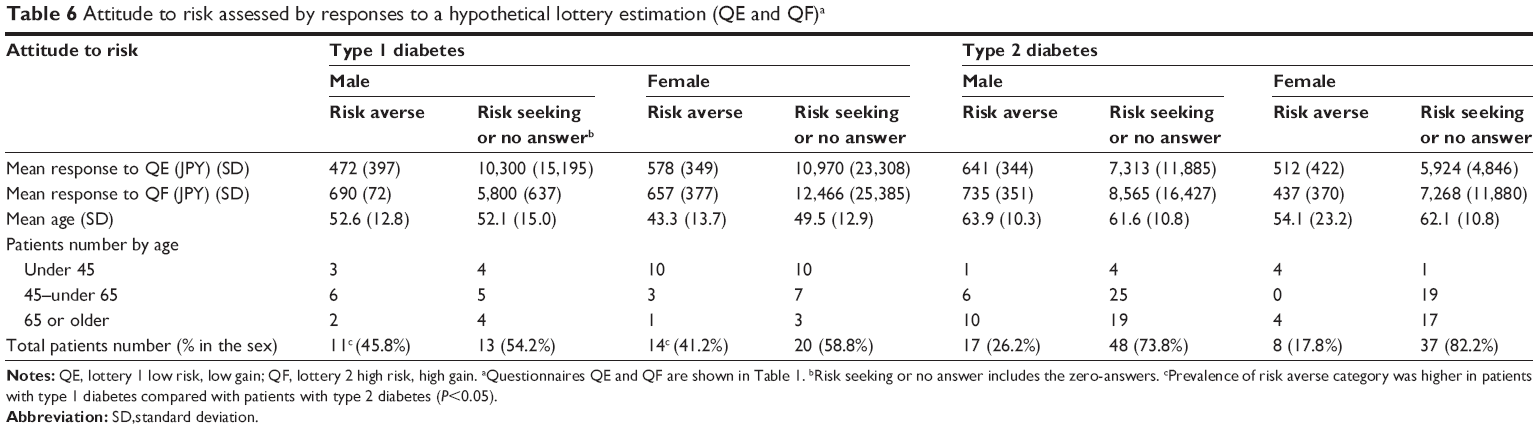 | Table 6 Attitude to risk assessed by responses to a hypothetical lottery estimation (QE and QF)a |
Discussion
Over the past two decades, great advances have been made in the spectrum of pharmacologic agents and monitoring technology available for the treatment of diabetes.16 However, the metabolic control of diabetes is still difficult in some patients; as a result, these patients are at a risk of developing end-stage complications. Hinata et al reported that metabolic control in male prisoners with type 2 diabetes improved during imprisonment in Japan.17 Although this finding demonstrates that intensive lifestyle interventions are highly effective for the control of diabetes, it also suggests that maintaining a well-regulated lifestyle is difficult in an unrestricted person. The behavioral economics approach has recently attracted much attention as a possible method to improve public health. This approach could be applied to the treatment of patients with diabetes. However, some investigators are critical of the approach because it has not been scientifically supported by solid evidence.18 Although there are some reports investigating time preference and health behavior in patients with diabetes,19,20 analysis of more detailed clinical data is necessary to clarify the trait of health behavior in patients with diabetes. This is the first report that investigated patients with diabetes in a clinical setting using a method based on behavioral economics.
Our survey of patients with diabetes suggests that the attitude of patients toward risk is a significant factor in the progression of diabetic complications. We found that hypothetical lottery risk estimation (QE), myopic time preference (QH), willingness to pay for preventive medicine (QM), and levels of satisfaction with life (QN) showed statistically significant associations with diabetic retinopathy. QN is a supplemental question, and it appears reasonable that patients with diabetes having complications are not satisfied with their life. The results of myopic time preference (QH) appear to indicate that patients without retinopathy prefer an immediate reward (answering high price to QH). However, it is possible that patients considered the question as a choice between sure (immediate) gain and uncertain (future) gain, not as a temporal discounting.9 The question may not be suitable for eliciting information on myopic preference, and further studies will be necessary. Willingness to pay for medicine appears to be an important factor. One of the new findings of this study is that patients with diabetes who are willing to pay less for preventive medicine tend to develop retinopathy. QC and QD are questions developed by Ikeda et al11,12 and are designed to estimate inclination toward procrastination, which indicates hyperbolic discounting for future payoffs and is reported to be associated with BMI. In the present study, we did not find any association between BMI and QC or QD. This discrepancy may reflect the difference between the general population and patients with diabetes; however, further studies are necessary.
Logistic regression analysis indicated that patients who were risk seeking in the estimation of hypothetical lotteries (QE) were prone to develop complications. There are several methods to induce risk preference using lotteries, including binary lotteries or computerized risk tasks.21–23 Although these methods are useful for analysis of risk preference, they have typically been used to investigate students or traders who have a high level of literacy proficiency. Our preliminary study revealed that patients with type 2 diabetes found it difficult to understand these methods. Therefore, we used a simple pricing method. Because of the free answer method, there was, unexpectedly, a wide range of responses to the hypothetical lottery question (Figure 1). Some patients suggested that they would pay more for a ticket than they could win. Therefore, our results are limited by the fact that we could not differentiate patients who were risk seeking from those with lower quantitative literacy proficiency. On the other hand, recent experimental studies suggest that people with low cognitive ability are more likely to engage in risky behavior, such as committing crimes and smoking, and are more likely to be involved in out-of-wedlock births.10,24 Therefore, these two factors may be closely related.
As shown in Table 4, type of diabetes (type 1) and risk averse in lottery risk estimation (answering low price to QE) is negatively associated with retinopathy. Detailed analysis of responses to questions QE and QF showed differences between patients with type 1 and type 2 diabetes. A lower proportion of patients with type 2 diabetes were categorized as risk averse compared with patients with type 1 diabetes. Patients categorized as risk seeking or no answer included both those who had a preference for risk seeking and those with lower literacy proficiency, as described in the results (attitude toward hypothetical lottery risk and type of diabetes). It was suggested that high plasma glucose may affect cognitive function in both type 1 and type 2 diabetes.25,26 Although Cavanaugh et al reported that poor numeracy skills were common in patients with diabetes,27 they could not compare patients with type 1 and type 2 diabetes because of poorer glycemic control in patients with type 1 diabetes. In the present study, all patients were referred because they were difficult to treat, and glycemic control was not significantly different between patients with type 1 and type 2 diabetes at the time of the survey. Therefore, we could compare patients with type 1 and type 2 diabetes.
The results suggest the concept that prototypes of type 1 and type 2 diabetes may be different diseases from the perspective of neuroeconomics. Some patients with type 1 diabetes may have characteristics of neuroeconomics type 2 or some type 2 patients may be miscategorized as neuroeconomics type 1 by the simplified criteria used in this study. Lower quantitative literacy proficiency among patients with type 2 diabetes may not be a result of high glucose but a reflection of the essential pathophysiology of neuroeconomics type 2 diabetes, for example, insulin resistance. The lower response rate among patients with type 2 diabetes may be compatible with this hypothesis. Some patients may have difficulty in estimating risk mathematically because of low literacy proficiency, and it could be that they disregarded the survey. Further studies are necessary to investigate this hypothesis.
In conclusion, we conducted a behavioral economics survey of difficult-to-treat patients with type 1 and type 2 diabetes. This is the first study to apply a survey used in the field of economics to patients with diabetes in a clinical setting. Our survey of patients with diabetes suggests that the attitude of patients toward risk could be a factor in the progression of diabetic complications. We also identified significant differences between patients with type 1 and type 2 diabetes from the perspective of neuroeconomics. Different educational and psychological approaches may be necessary in patients with diabetes based on whether they are risk seeking or risk averse. On the other hand, the present study also highlighted methodological difficulties in behavioral economic surveys of patients with diabetes because of low literacy proficiency in some patients. We could not differentiate patients who were risk seeking from those with low literacy proficiency, although these two factors may be closely related. Furthermore, our results demonstrate that selection bias is inevitable in almost all surveys of patients with diabetes, because those who refuse to participate are excluded and not investigated further. Willingness to participate in a survey is an important personal trait, and selection bias is inevitable in surveys dealing with matters related to personal traits. Further studies are necessary to establish the most suitable form of the survey for estimation of risk preference in patients with diabetes.
Acknowledgment
This study was supported by Grants-in-Aid for Scientific Research from the Japan Society for the Promotion of Science (KAKENHI) for Research Project 23653070 (FY 2011–2013) and 26670256 (FY 2014–2016).
Disclosure
The authors declare that they have no conflicts of interest.
References
Daneman D. Type 1 diabetes. Lancet. 2006;367(9513):847–858. | ||
Stumvoll M, Goldstein BJ, van Haeften TW. Type 2 diabetes: principles of pathogenesis and therapy. Lancet. 2005;365(9467):1333–1346. | ||
Inzucchi SE, Bergenstal RM, Buse JB, et al. Management of hyperglycaemia in type 2 diabetes, 2015: a patient-centered approach. Update to a Position Statement of the American Diabetes Association and the European Association for the Study of Diabetes. Diabetologia. 2015;58(3):429–442. | ||
Shamoon H, Duffy H, Fleischer N, et al; The Diabetes Control and Complications Trial Research Group. The effect of intensive treatment of diabetes on the development and progression of long-term complications in insulin-dependent diabetes mellitus. N Engl J Med. 1993;329(14):977–986. | ||
UK Prospective Diabetes Study (UKPDS) Group. Intensive blood-glucose control with sulphonylureas or insulin compared with conventional treatment and risk of complications in patients with type 2 diabetes (UKPDS 33). Lancet. 1998;352(9131):837–853. | ||
Zhao G, Ford ES, Li C, Mokdad AH. Compliance with physical activity recommendations in US adults with diabetes. Diabet Med. 2008;25(2):221–227. | ||
Nelson KM, Reiber G, Boyko EJ. Diet and exercise among adults with type 2 diabetes: findings from the third national health and nutrition examination survey (NHANES III). Diabetes Care. 2002;25(10):1722–1728. | ||
Reach G. Is there an impatience genotype leading to non-adherence to long-term therapies? Diabetologia. 2010;53(8):1562–1567. | ||
Kalenscher T, Pennartz CM. Is a bird in the hand worth two in the future? The neuroeconomics of intertemporal decision-making. Prog Neurobiol. 2008;84(3):284–315. | ||
Goto R, Takahashi Y, Nishimura S, Ida T. A cohort study to examine whether time and risk preference is related to smoking cessation success. Addiction. 2009;104(6):1018–1024. | ||
Kang MI, Ikeda S. Time discounting and smoking behavior: evidence from a panel survey. Health Econ. 2014;23(12):1443–1464. | ||
Ikeda S, Kang MI, Ohtake F. Hyperbolic discounting, the sign effect, and the body mass index. J Health Econ. 2010;29(2):268–284. | ||
Davis M, Kern T, LI R. Diabetic retinopathy. In: Alberti K, Zimmet P, DeFronzo R, editors. International Textbook of Diabetes Mellitus. 2nd ed. Chichester: Wiley; 1997:1413–1446. | ||
Hartog J, Ferrer-i-Carbonell A, Jonker N. Linking measured risk aversion to individual characteristics. Kyklos. 2002;55(1):3–26. | ||
Donkers B, Melenberg B, Van Soest A. Estimating risk attitudes using lotteries: a large sample approach. J Risk Uncertain. 2001;22(2):165–195. | ||
Madan S. Changes in diabetes-related complications in the United States. N Engl J Med. 2014;371(3):285–286. | ||
Hinata M, Ono M, Midorikawa S, Nakanishi K. Metabolic improvement of male prisoners with type 2 diabetes in Fukushima Prison, Japan. Diabetes Res Clin Pract. 2007;77(2):327–332. | ||
Loewenstein G, Asch DA, Friedman JY, Melichar LA, Volpp KG. Can behavioural economics make us healthier? BMJ. 2012;344:e3482. | ||
Ayyagari P, Grossman D, Sloan F. Education and health: evidence on adults with diabetes. Int J Health Care Finance Econ. 2011;11(1):35–54. | ||
Sloan FA, Padron NA, Platt AC. Preferences, beliefs, and self-management of diabetes. Health Serv Res. 2009;44(3):1068–1087. | ||
Kandasamy N, Hardy B, Page L, et al. Cortisol shifts financial risk preferences. Proc Natl Acad Sci U S A. 2014;111(9):3608–3613. | ||
Berg JE, Rietz TA, Dickhaut JW. Chapter 115 on the performance of the lottery procedure for controlling risk preferences. In: Plott CR, Smith VL, editors. Handbook of Experimental Economics Results. Elsevier, Amsterdam; 2008: 1087–1097. | ||
Sapienza P, Zingales L, Maestripieri D. Gender differences in financial risk aversion and career choices are affected by testosterone. Proc Natl Acad Sci U S A. 2009;106(36):15268–15273. | ||
Frisell T, Pawitan Y, Langstrom N. Is the association between general cognitive ability and violent crime caused by family-level confounders? PLoS One. 2012;7(7):e41783. | ||
Kodl CT, Seaquist ER. Cognitive dysfunction and diabetes mellitus. Endocr Rev. 2008;29(4):494–511. | ||
Biessels GJ, Staekenborg S, Brunner E, Brayne C, Scheltens P. Risk of dementia in diabetes mellitus: a systematic review. Lancet Neurol. 2006;5(1):64–74. | ||
Cavanaugh K, Huizinga MM, Wallston KA, et al. Association of numeracy and diabetes control. Ann Intern Med. 2008;148(10):737–746. |
 © 2015 The Author(s). This work is published and licensed by Dove Medical Press Limited. The full terms of this license are available at https://www.dovepress.com/terms.php and incorporate the Creative Commons Attribution - Non Commercial (unported, v3.0) License.
By accessing the work you hereby accept the Terms. Non-commercial uses of the work are permitted without any further permission from Dove Medical Press Limited, provided the work is properly attributed. For permission for commercial use of this work, please see paragraphs 4.2 and 5 of our Terms.
© 2015 The Author(s). This work is published and licensed by Dove Medical Press Limited. The full terms of this license are available at https://www.dovepress.com/terms.php and incorporate the Creative Commons Attribution - Non Commercial (unported, v3.0) License.
By accessing the work you hereby accept the Terms. Non-commercial uses of the work are permitted without any further permission from Dove Medical Press Limited, provided the work is properly attributed. For permission for commercial use of this work, please see paragraphs 4.2 and 5 of our Terms.