")
Back to Journals » Cancer Management and Research » Volume 13
Bead-Based Isolation of Circulating Tumor DNA from Pancreatic Cancer Patients Enables High Fidelity Next Generation Sequencing
Authors Balendran-Braun S, Kieler M , Liebmann-Reindl S, Unseld M , Bianconi D, Prager GW, Streubel B
Received 4 March 2021
Accepted for publication 7 June 2021
Published 7 August 2021 Volume 2021:13 Pages 6249—6261
DOI https://doi.org/10.2147/CMAR.S308029
Checked for plagiarism Yes
Review by Single anonymous peer review
Peer reviewer comments 2
Editor who approved publication: Dr Antonella D'Anneo
Sukirthini Balendran-Braun,1,* Markus Kieler,2,* Sandra Liebmann-Reindl,3 Matthias Unseld,2 Daniela Bianconi,2 Gerald W Prager,2 Berthold Streubel1,3
1Department of Pathology, Medical University of Vienna, Vienna, Austria; 2Department of Medicine I, Division of Oncology, Comprehensive Cancer Center, Medical University, Vienna, Austria; 3Core Facility Genomics, Medical University of Vienna, Vienna, Austria
*These authors contributed equally to this work
Correspondence: Berthold Streubel; Gerald W. Prager Email [email protected]; [email protected]
Introduction: Pancreatic ductal adenocarcinoma (PDAC) is one of the most aggressive cancers and poses a challenge to the treating clinician. With the emergence of genomic profiling technologies, circulating tumor DNA (ctDNA) is increasingly recognized as a versatile biomarker for risk stratification and disease monitoring. We aimed to compare two commercially available NGS panels in a cohort of patients with advanced PDAC undergoing palliative chemotherapy.
Methods: CtDNA was isolated with a magnetic bead-based protocol from two consecutive blood samples before and during chemotherapy in 21 patients with PDAC. Mutations were assessed by using a panel covering 15 (GP15) or 50 (GP50) cancer-associated genes. Results were compared to tumor tissue (GP15), if available.
Results: Isolation of ctDNA resulted in a high mean value of 1.9 ng/μL (total volume of ∼ 40 μL). Although the same number of patients were positive for at least one mutation (76%), the most commonly mutated oncogene in PDAC, KRAS, was detectable in an additional 25% of all patients with the GP15 panel due to a higher coverage. The genomic concordance rate between tissue DNA and ctDNA analyses was 65.22%.
Discussion: Our study demonstrates the feasibility of an NGS-based approach for ctDNA analysis and underlines the importance of using a disease-specific panel with a sufficiently high coverage.
Keywords: pancreatic ductal adenocarcinoma, PDAC, liquid biopsy, circulating tumor DNA, ctDNA, next generation sequencing, NGS, KRAS, TP53
Introduction
Pancreatic ductal adenocarcinoma (PDAC) ranks among the top leading causes of cancer deaths in the Western world and, in contrast to other tumor entities of the gastrointestinal tract like colorectal cancer, its incidence is rising.1,2 The dismal prognosis of this cancer type is caused by late diagnosis mostly in advanced stages with no chance for curative resection, a very high relapse rate and resistance to most of the tested therapies and targeted drugs.3–5 Current cancer statistics show a five year survival rate of only 5-10 % with no meaningful improvements during the last 20 years.6
Integrated analysis of the genomic landscape has identified four commonly mutated genes, namely KRAS, TP53, SMAD4, and CDKN2A.7–9 Given the aforementioned late detection rate, lack of reliable biomarkers and aggressive biology of PDAC, there is a strong need for finding new biomarkers to guide decision-making in the clinical management of patients affected by this type of cancer. One non-invasive and promising tool for early detection, predicting tumor recurrence and monitoring treatment responses as well as resistance is the analysis of circulating tumor DNA (ctDNA). CtDNA is a relatively small and highly variable fraction of circulating cell-free DNA (cfDNA), which is primarily composed of germline DNA that originates from normal cells.10,11 Assessment of ctDNA derived from the primary tumor and metastatic sites, which can be isolated from the peripheral blood provides a real-time picture of the tumor burden and treatment escape mechanism.12,13 Several studies have shown that ctDNA can be used to analyze somatic sequence alterations in various cancers through Next-Generation Sequencing (NGS).14–19 In the case of PDAC, a majority of studies report a very high overlap (>50%) of detected mutations between bulk tumor and ctDNA.20–26 However, the detection rate for the most frequently mutated gene KRAS largely varies in recently published reports ranging from 21.1% to almost 100%.20–36 It is clear that patient selection and related factors such as disease stage as well as the methods, which were used to isolate and analyze the ctDNA are crucial factors for the practical applicability of liquid biopsy in this disease. To date, liquid biopsy for PDAC is not routinely used in the clinic but potential applications range from using it as a prognostic biomarker for survival to monitoring treatment responses and disease recurrence as well as identifying molecular targets for personalized therapy.37 Therefore our aim was to assess the clinical applicability of two commercially available NGS gene panels to detect the most frequent mutations in ctDNA from two consecutive blood samples in patients with non-resectable locally advanced or metastatic PDAC who underwent systemic treatment.
Experimental Section
Patients
This is a single-center, prospective, observational study including patients with histologically proven non-resectable PDAC, which was either locally advanced or metastasized and who underwent a systemic treatment at the Medical University of Vienna between 05/2016 and 05/2018. The electronic medical history was queried for patient demographics, performance status, date of diagnosis, date of advanced disease, diagnosis and carbohydrate antigen 19–9 (CA19–9) level at baseline, treatment details and survival data. ECOG (Eastern Cooperative Oncology Group) performance status was derived, if not stated explicitly, from the medical history including comorbidities and overall assessment of the treating physician. Recurrent PDAC after resection of curative intent was stated as stage IV disease. The here presented data analysis received prior approval by the ethical committee of the Medical University of Vienna (EK 274/2011) and was performed according to Helsinki criteria of good scientific practice. Written consent of the study participants was obtained after they were informed about the study purpose and prior to study commencement.
Isolation and Quantification of Cell-Free DNA from Blood Samples
Peripheral blood from patients was collected in cell-free DNA collection tubes (Roche) at day one of the first administration of the systemic chemotherapy regimen as well as 4–6 weeks after the first blood sample. Blood samples were proceeded within 12 hours of collection via a 2-step centrifugation protocol. First, plasma was separated from the other blood components by centrifugation at 2000 x g for 20 minutes. After transferring the upper plasma layer to a new conical tube, it was respun at 3200 x g for 30 minutes to remove cell debris. Subsequently the resulting plasma supernatant was stored at −20 °C in 10 mL cryotubes (VWR) until DNA isolation. Circulating DNA isolation from 5–10 mL plasma was performed on the Chemagic 360 Instrument (Perkin Elmer) with the isolation kit CMG-1111 (chemagic cfDNA 10k Kit special H12) according to manufacturer’s instruction. Cell-free DNA was eluted in ~40 µL elution buffer. DNA quantification was performed with Qubit® dsDNA HS Assay Kit (Invitrogen) according to the instructions provided by the manufacturer and purity was determined by Agilent 2200 TapeStation System. Cell-free DNA was stored at −20 °C until further analysis.
Isolation and Quantification of Genomic DNA
Genomic DNA was isolated from formalin fixed, paraffin embedded (FFPE) tissue sections using GeneRead DNA FFPE Kit (Qiagen) according to the user manual. DNA quantification was performed with Qubit® dsDNA HS Assay Kit (Invitrogen) according to the instructions provided by the manufacturer and purity was determined by Agilent 2200 TapeStation System. Genomic DNA was stored at −20 °C until further analysis.
Analyses of Cell-Free DNA and Sequencing Panels
TruSight Tumor 15 (GP15)
Library preparation was conducted using the Illumina TruSight Tumor 15 covering 15 genes, which are frequently mutated in solid tumors. Subsequent sequencing of pooled libraries was performed in several runs on the MiniSeq Illumina platform using MiniSeq High Output Reagent Kit (300-cycles). Data analysis was conducted using on-instrument Local Run Manager (LRM) Software with TruSight Tumor 15 analysis module. Passed-filter reads were aligned to human reference genome UCSC hg19 using banded Smith Waterman algorithm. Variants were called using Somatic Variant Caller developed by Illumina. All vcf-datasets were annotated using the Illumina VariantStudio 3.0 Software. Across all samples, several hotspot codons were manually evaluated using the Integrative Genomics Viewer (IGV) for potential low-abundance variants (0.1> VAF <2.0%). Annotated plasma variants had to have allele frequencies above a background threshold of the mean of our control samples (three different non-PDAC cfDNA samples).
AmpliSeqTM Cancer HotSpot Panel for Illumina (GP50)
Library preparation was conducted using AmpliSeq™ Library PLUS with AmpliSeq™ Cancer HotSpot Panel v2 for Illumina®. This panel is designed to amplify 207 amplicons covering hotspot regions of 50 genes with known association to cancer. Final libraries were sequenced together using MiniSeq High Output Reagent Kit (300-cycles). Data analysis was conducted using DNA Amplicon workflow via Basespace Sequence Hub. The NGS data alignment was performed with Burrows-Wheeler Aligner (BWA) and subsequently Somatic Variant Caller was used. Variant annotation was performed with Illumina VariantStudio 3.0 Software. Across all samples, several hotspot codons were manually evaluated using the Integrative Genomics Viewer (IGV) for potential low-abundance variants (0.1> VAF <2.0%). Annotated plasma variants had to have allele frequencies above a background threshold of the mean of our control samples (HD701 and HD729 Reference Standards (Horizon)).
Statistics
Descriptive statistics were calculated as mean, median or percentages as appropriate. Correlation between variant allele frequencies (VAF) between the two panels was calculated with Spearman correlation coefficient. The threshold for statistical significance was set at a p-value of less than 0.05.
Results
Patient Characteristics
A total of 21 patients with histologically proven PDAC were included in this study. Table 1 lists patient and tumor characteristics. There were 12 female (57.1%) and nine male (42.9%) patients. The median age at time of diagnosis of advanced disease was 64.3 years (interquartile range (IQR) 57.9–68.9 years). Three patients (14.3%) presented with locally advanced (unresectable) disease and 18 patients (85.7%) had metastasis at time of study inclusion. There were eight patients (38.1%) with a prior surgical resection. The median CA 19–9 levels were 481.5 kU/l (IQR 59.4–3355.0 kU/l). Levels of CA 19–9 were within the normal range in three patients (14.3%) and above in 18 patients (85.7%). The primary site of metastatic disease was liver (n = 11; 52.4%) followed by peritoneum (n = 5; 23.8%) and lung (n = 4; 19%). There were three patients (14.3%) with locally advanced disease, while 14 patients (66.7%) had one organ affected by metastatic spread and four patients (19%) had two or over two metastatic sites. The ECOG performance status was zero in 17 patients (81%) and one in four patients (19%).
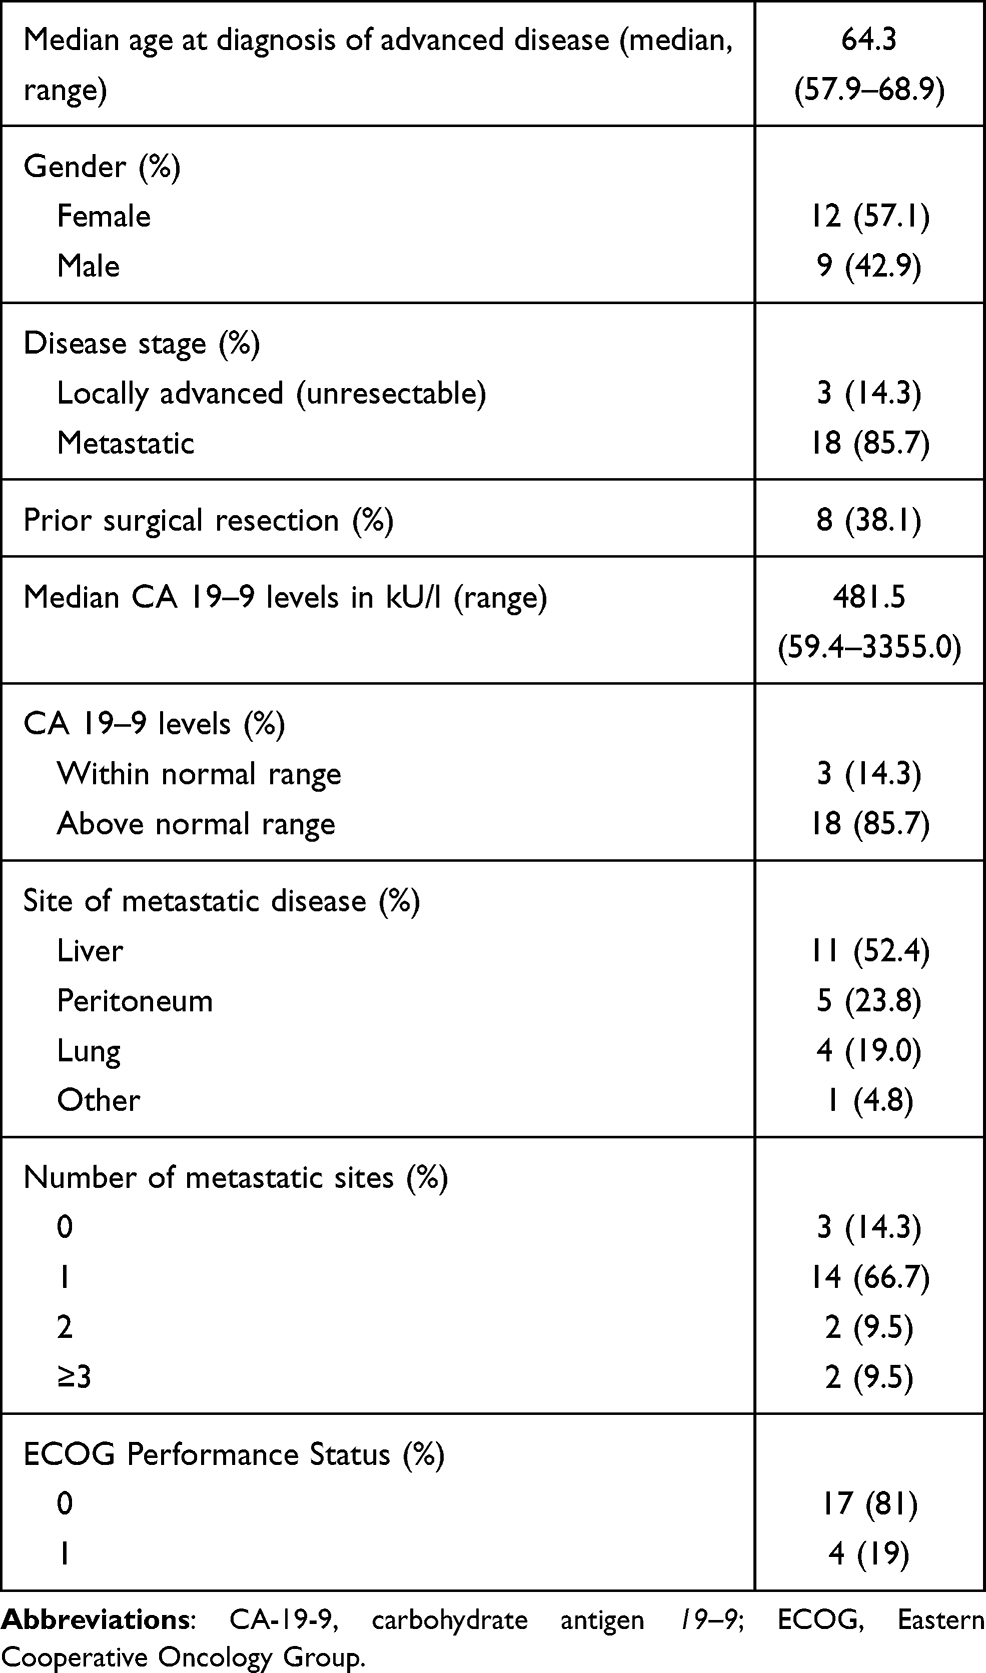 |
Table 1 Characteristics of Patients and Tumors |
cfDNA Efficiency
In general, the amount of cfDNA, which can be obtained from plasma is relatively small compared to genomic DNA extracted from formalin-fixed paraffin-embedded (FFPE) tissue. Moreover, the fraction of cfDNA that originates from tumor cells (ctDNA) is extremely low. First, we analyzed quantity and quality of our cfDNA, which has been isolated using a magnetic bead-based protocol applicable for higher plasma volumes. All samples were isolated successfully and compared to other studies we revealed a considerably high mean cfDNA value of 1.9 ng/µL (range 0.49–4.76 ng/µL) in a volume of ~40 µL.33,38,39 One sample yielded 53 ng/µL cfDNA, which is substantially higher than the cfDNA amount of other samples and therefore not included into the mean-calculation. Due to the high concentration of DNA, we wanted to exclude contamination with high-molecular weight genomic DNA (gDNA) wherefore we performed fragment size analysis with the TapeStation System. CfDNA is highly fragmented and shows a size distribution of ~ 130 bp-180 bp. Generally, fragments higher than 1000 bp are considered as gDNA. The average cfDNA peak of our samples was around 180 bp and shows that there is little to no genomic DNA contamination (see quality control of representative PDAC samples in Supplementary Figure S1). Even the quality of the cfDNA sample with 53 ng/µL was sufficient for NGS (Supplementary Figure S2). In summary, we conclude that all our samples were suitable for downstream applications such as NGS without any adaptation, which usually are necessary in cases of low cfDNA yields.
Mutational Profile of PDAC ctDNA Revealed with 15-Gene Panel
In a next step, we analyzed a total of 42 samples from 21 PDAC patients using a small gene panel containing 15 genes with a high coverage and high sensitivity. Paired-end sequencing resulted in average 3.84 Mio passed filter reads per sample and mean amplicon coverage of 23.086. The ctDNA variant detection limit depends on the background signal of our control samples. The control samples revealed allelic frequencies of 0–0.21%.
Sixteen out of 21 sequenced patients (76.2%) exhibited at least one variant (see Figure 1A). The number of gene mutations per patient ranged from 1-3 in at least one time point. The identified variants revealed allelic frequencies of 0.1–22% and were distributed over the following six cancer-related genes: KRAS (n = 14; 66.6%), TP53 (n = 7; 33.3%), PIK3CA (n = 2; 9.5%), EGFR (n = 1; 4.8%), MET (n = 1; 4.8%), PDGFRA (n = 1; 4.8%) (see Figure 1B). All detected variants with known or likely pathogenic effect are listed in detail in Supplementary Table S1. In all 16 patients at least one mutation was detected at baseline level. In eight of 16 patients (50%) all baseline variants were still found in the follow-up sample at varying percentages. In two patients (12.5%) (#3 and #15) one baseline mutation was also present in the follow-up sample at varying frequencies while a new mutation was identified in the subsequent sample and appeared during therapy. In patient #7 two baseline variants were also present with very low allele frequency in the consecutive sample while a TP53 variant disappeared. In the remaining five patients (31.3%) the baseline mutation was not detectable in the second sample. In summary, our 15-gene panel was sufficient to identify at least one tumor-associated mutation in 76.2% of our cases, which was suitable for follow-up monitoring.
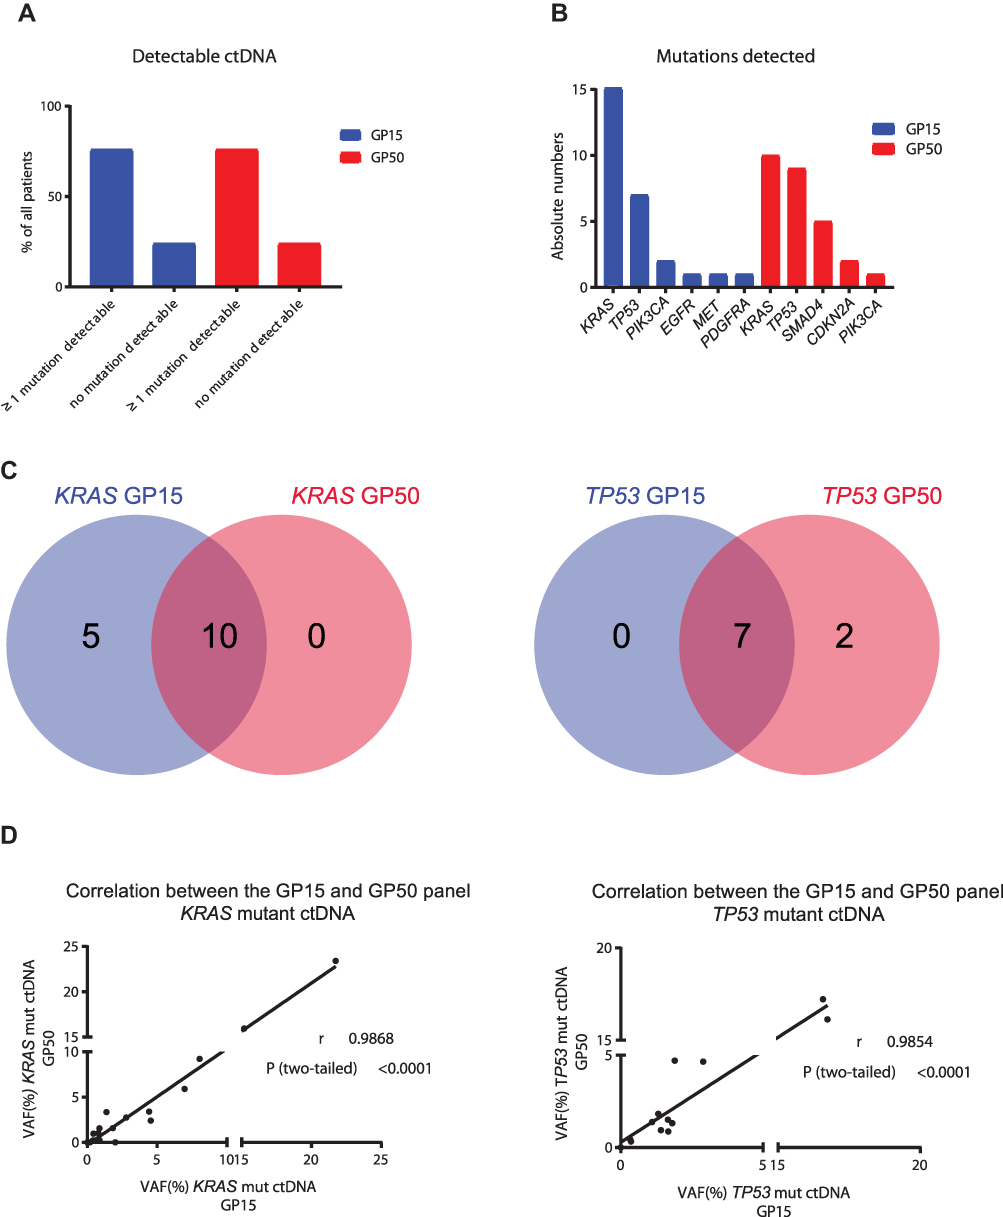 |
Figure 1 Comparison between GP15 and GP50. Ratio of patients with at least one detectable mutation versus no detectable mutation according to the two panels (A). Absolute numbers of mutations detected with the two panels (B). Venn diagrams showing the number of patients with shared or exclusive mutations detected by the two panels (C). Correlation between variant allele frequency (VAF) between the two panels, r = Pearson r, P = p-value (D). |
Mutational Profile of PDAC ctDNA Revealed with 50-Gene Panel
Since KRAS, TP53, SMAD4, and CDKN2A are known driver genes for PDAC and GP15 does not cover the latter two, all 42 samples were concomitantly analyzed with a larger panel containing 50 genes, which automatically leads to lower coverage and thus lower sensitivity. Paired-end sequencing resulted in average 1.08 Mio passed filter reads per sample and mean amplicon coverage of 4370. The detection limit of cfDNA variants depends on the background signal of our control samples, which revealed allelic frequencies of 0–0.149%. Sixteen out of 21 sequenced patients (76.2%) exhibited at least one variant (see Figure 1A). The number of gene mutations per patient ranged from 1-4 in at least one time point. The identified variants revealed allelic frequencies of 0.17–23% and were distributed over the following five cancer-related genes: KRAS (n = 10; 47.6%), TP53 (n = 9; 42.8%), SMAD4 (n = 5; 23.8%), CDKN2A (n = 2; 9.5%), PIK3CA (n = 1; 4.8%) (see Figure 1B). All detected variants with known or likely pathogenic effect are listed in detail in Supplementary Table S2. In patient #5 a mutation was only detectable in the consecutive sample, but not at baseline. In six patients the baseline variants were still found in the follow-up sample at varying percentages. In patient #4 one baseline mutation was also present in the consecutive sample while an additional mutation disappeared during therapy. In patient #2 the baseline mutations were not detectable during therapy, but a new variant emerged in the follow-up sample reflecting different subclones. In the remaining seven patients the detected baseline mutation disappeared under therapy. In summary, with this 50-gene panel we were able to detect at least one tumor-associated mutation in 76.2% of our cases, even if the variant-frequency of some mutations is very low.
15-Gene versus 50-Gene Panel for PDAC ctDNA Analysis
As stated above, KRAS and TP53 are the two most commonly mutated genes in PDAC. The overlap for these two genes in our samples analyzed with GP15 and GP50 is shown in Figure 1C. Moreover, a strong correlation of the variant allele frequency (VAF) for KRAS (Pearson r (r) = 0.9868, p =< 0.0001) and TP53 (r = 0.9854, p = 0.0001) between the two sequencing panels for all analyzed samples was observed (see Figure 1D).
When comparing GP15 results with GP50, nine out of 21 patients (43.2%) revealed the same results regarding the GP15 genes. Five patients showed additional KRAS-mutations with GP15, which were not detectable with GP50 because of the low variant-frequency. Patients #3 and #5 had, among others, PIK3CA and MET mutations, respectively. These gene regions are not covered by GP50 and therefore were not detected. In two patients (#17 and #19) a low-frequency TP53 mutation was detected with GP50 (Figure 1C), which was found by GP15 as well, but had to be excluded because the allele frequency was not above the background threshold.
As aforementioned, SMAD4 and CDKN2A are frequently mutated genes in PDAC, but both genes are not covered by GP15. In this sense, in five GP15-positive cases additional variants in SMAD4 and CDKN2A were detected with GP50. Moreover, in one GP15-negative patient (#6) we could identify SMAD4 and CDKN2A mutations, even though they are low-frequency variants.
Ultimately, we have summarized the GP15 results with the two genes SMAD4 and CDKN2A, which were analyzed with GP50. Overall, 24 different variants with known or likely pathogenic effects were detected. The most commonly altered variants were KRAS p.G12D (n = 5), KRAS p.G12V (n = 3), KRAS p.G12R (n = 3) and the low-frequency variant CDKN2A p.Y129C (n = 2). All detected variants and the individual response to therapy are listed in detail in Table 2. In summary, four out of 21 (19.04%) cases revealed no pathogenic variants. It has been shown in previous studies that a therapy response is associated with a decreasing or unchanged mutant allele frequency, whereas an increase of ctDNA is associated with refractory disease.38,40,41 As a result, in seven of 21 (33.33%) PDAC patients the observed ctDNA dynamics suggests a correlation between ctDNA levels and response/non-response to cancer treatment. In ten of 21 (47.62%) patients a discordance of genetic and clinical data was observed (Table 2).
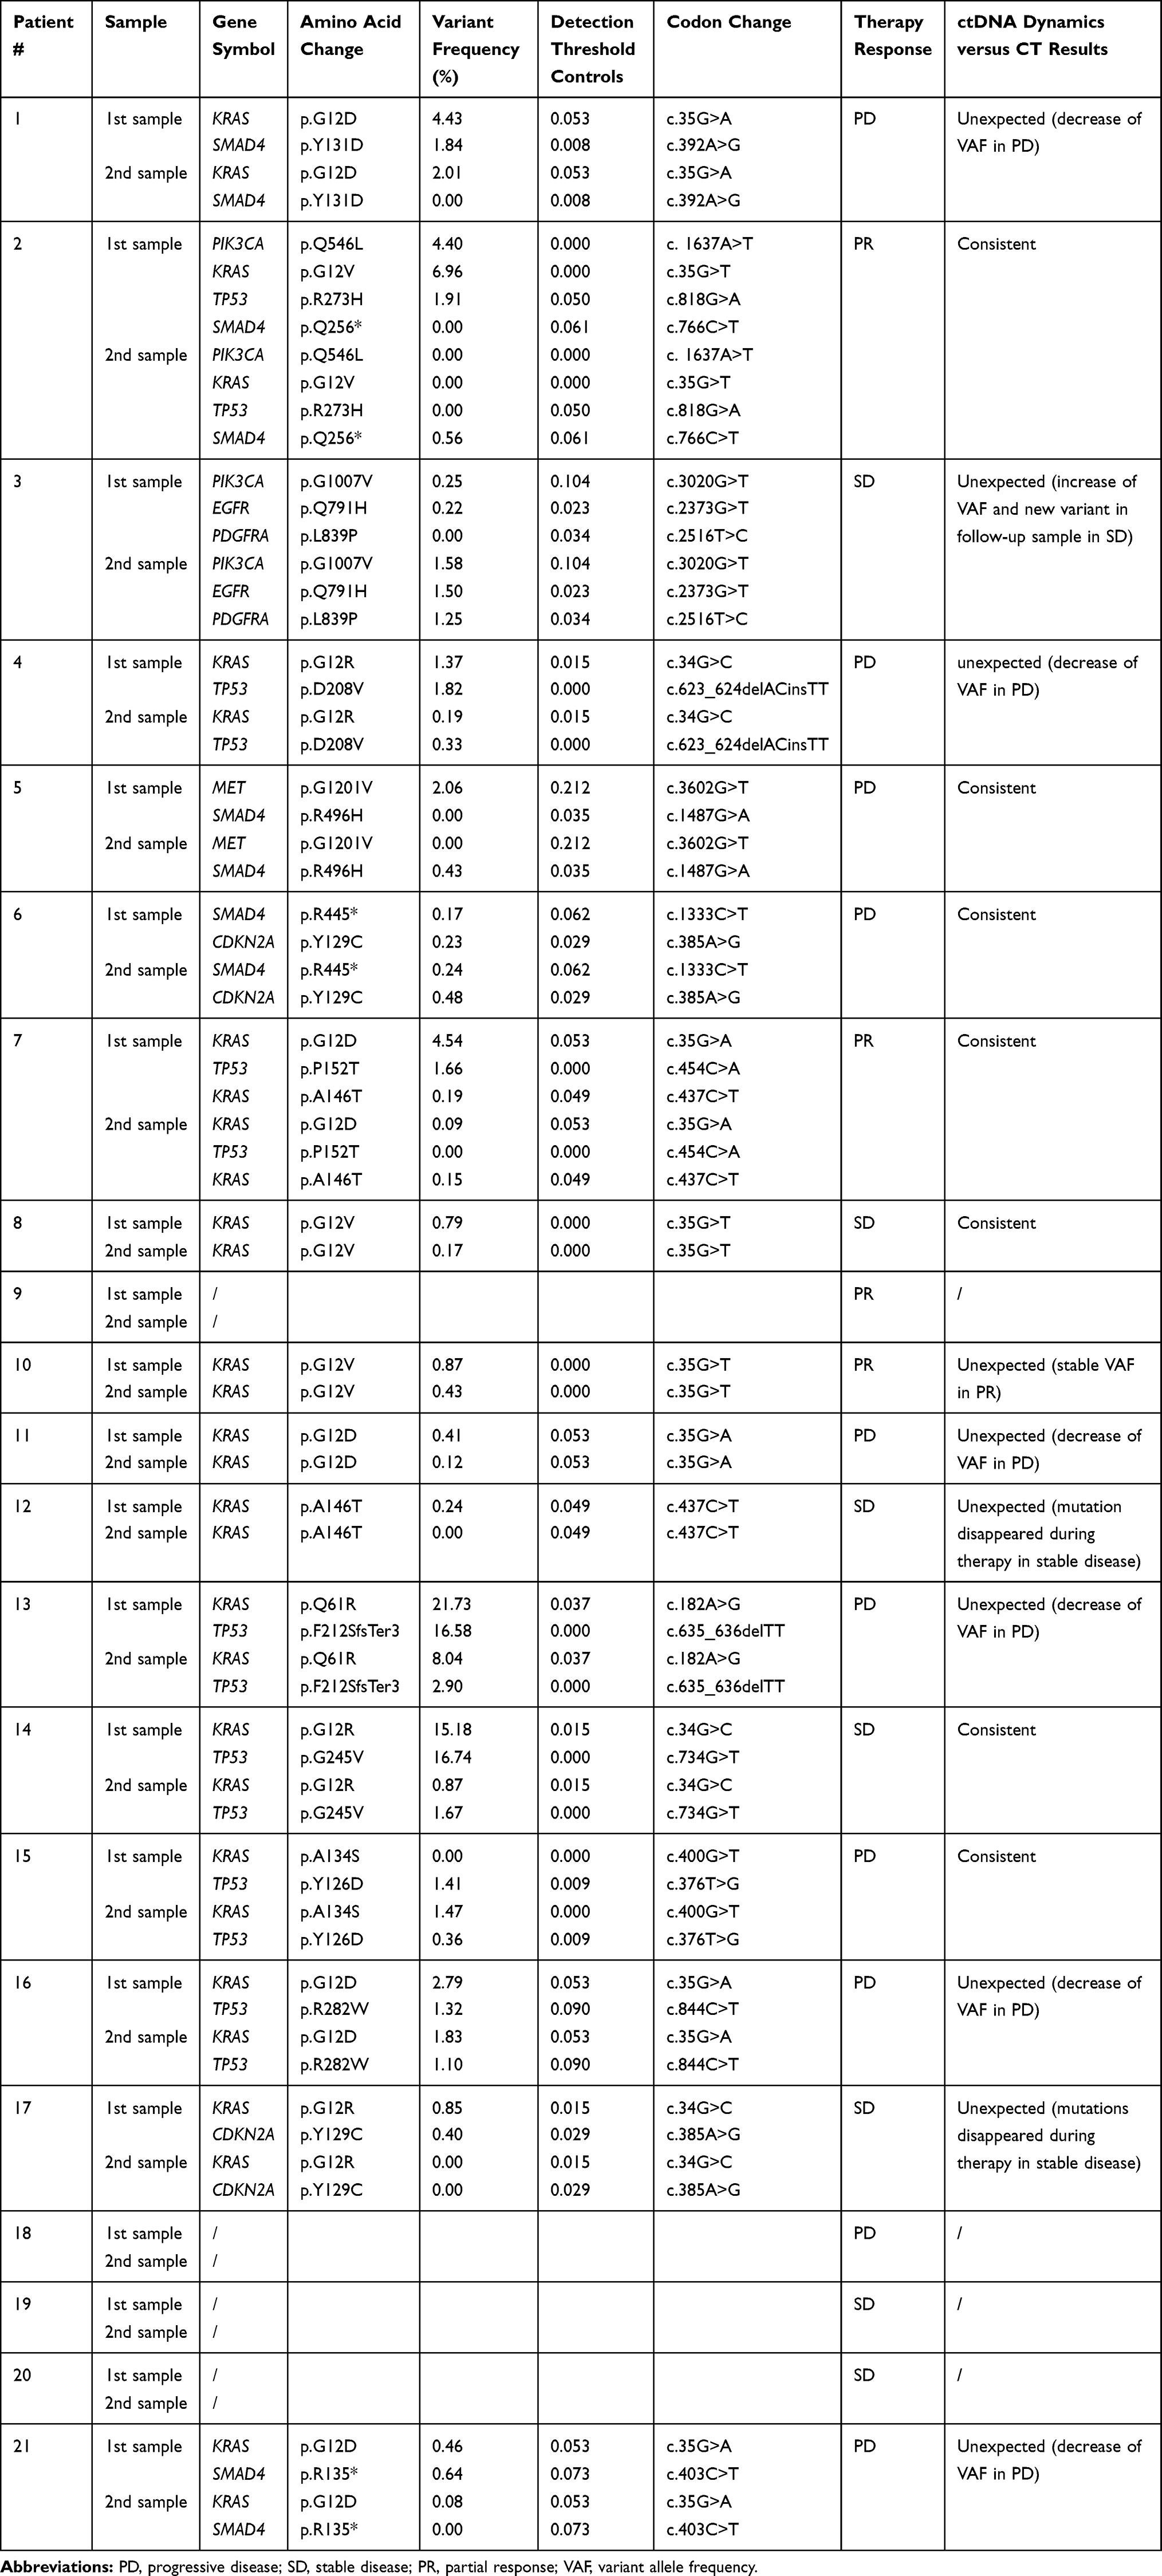 |
Table 2 Mutational Profile of 21 PDAC Patients (GP15 Results Combined with GP50 SMAD4 and CDKN2A Results). Paired-End Sequencing Resulted in a Mean Amplicon Coverage of 23.086 (GP15) and 4370 (GP50), respectively. |
Comparison of Primary and Recurrent Tumors
Depending on the availability, FFPE tissue samples of the primary tumor (n = 8) or liver metastasis (n = 3) were retrieved. To compare the mutations of the primary (FFPE) and recurrent tumor (which is represented by the ctDNA) the GP15 was used. In tissue DNA, alterations in KRAS were observed in all (n = 11) and in TP53 in 81% (n =9) of the available samples. In five (45.45%) patients blood-tissue mutational profiles were fully concordant (Table 3). KRAS and TP53 mutations were detectable in the tumor tissue of three (27.27%) patients, while ctDNA analysis only revealed the KRAS mutation in the respective sample (partially concordant mutational profiles). The remaining three (27.27%) patients only had detectable TP53 and/or KRAS mutations in the primary tumor or liver metastases but not in the corresponding ctDNA analysis with the GP15. Overall, genomic concordance rate between tissue DNA and ctDNA analyses was 65.22%, which means that 15/23 mutations that were present in the primary tumor/metastatic site could also be detected in ctDNA. More precisely, concordance rate was 72.72% for KRAS and 44.44% for TP53.
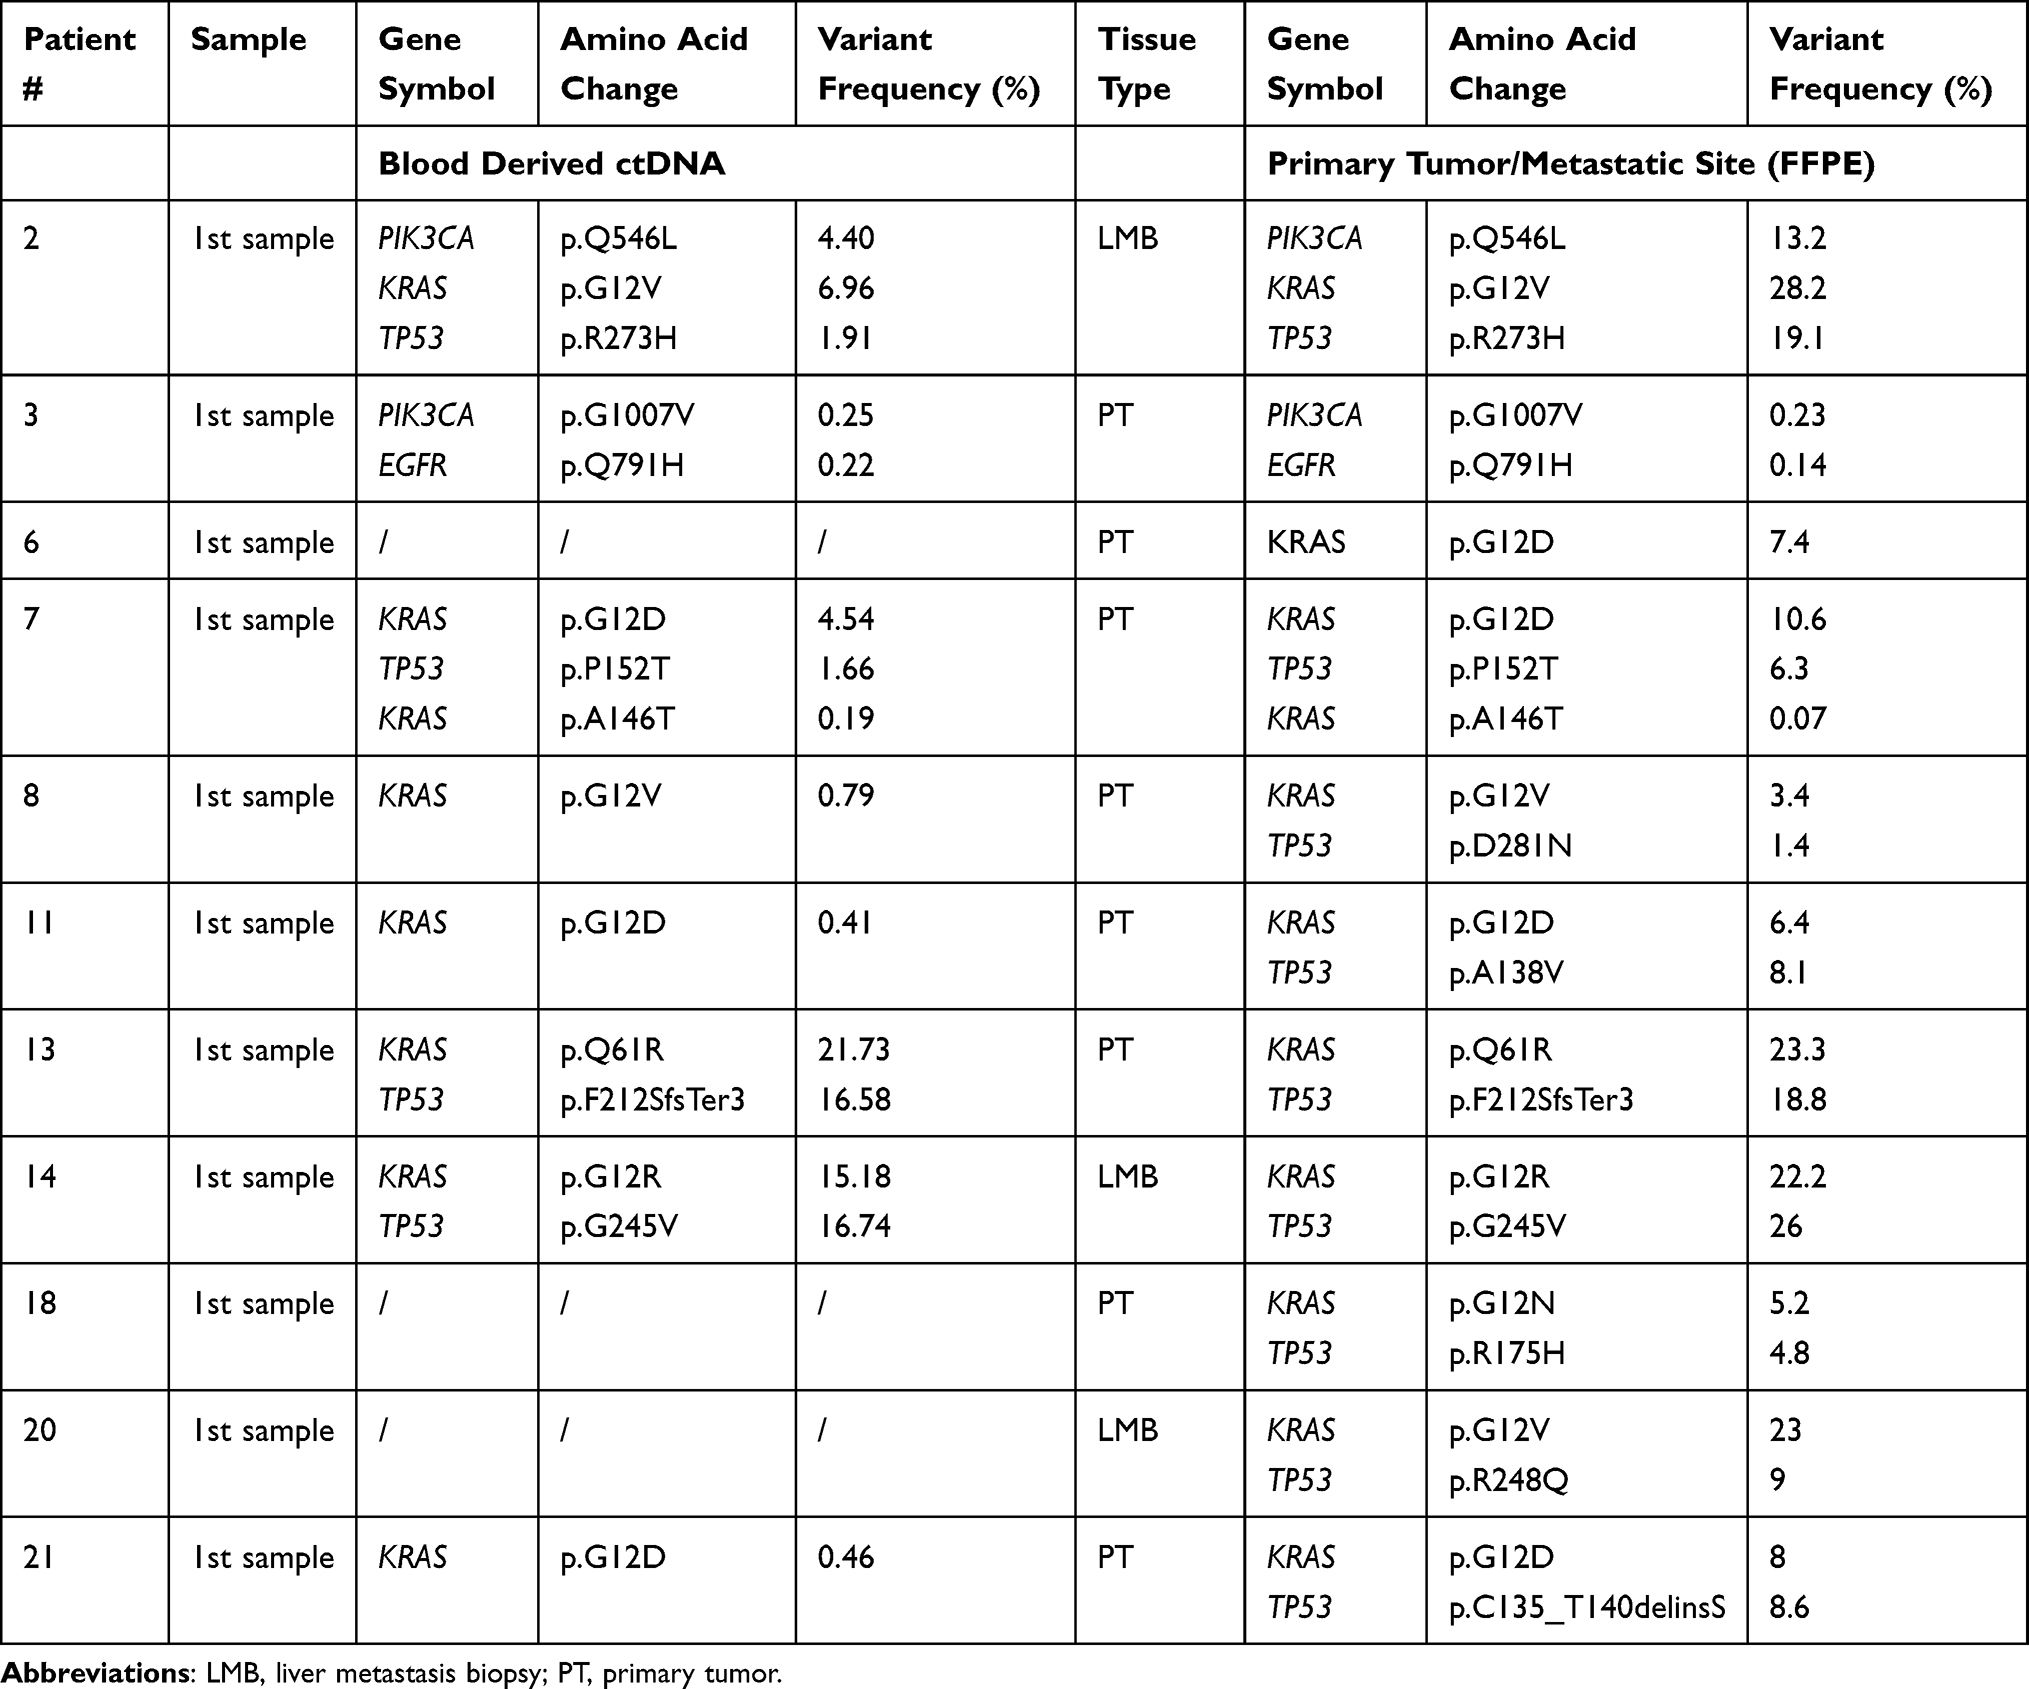 |
Table 3 Comparison of Mutations of cfDNA (Baseline) and Primary Tumor Sample/Metastatic Site of Eleven PDAC Patients |
Discussion
Liquid biopsy is increasingly recognized as a versatile tool for the detection of disease relapse and treatment monitoring of cancer patients.42,43 However, the plethora of potential methods, ranging from PCR-based techniques to NGS-based systems, complicates the comparison between different studies and ultimately limits the conclusions, which could be drawn on their clinical utility. Due to declining costs, the wide availability and the possibility to simultaneously detect multiple different mutations, NGS-based methods have also become very popular when analyzing low input samples like ctDNA from blood plasma of cancer patients. Given that a substantial proportion of patients, even if they present with metastatic disease, have unexpectedly low amounts of ctDNA,44 it is important to consider that the coverage of the used sequencing panel is mostly determined by the number of analyzed genes. The aim of this study was to assess the clinical applicability of two commercially available NGS gene panels (15 versus 50 genes), to detect the most frequent mutations in ctDNA from two consecutive blood samples in patients with advanced PDAC, which undergo systemic treatment.
Generally, the amount of total cfDNA, which can be isolated from plasma is quite small. Most studies give remarkably little detail about the quantity of cfDNA, which they have gained with their chosen DNA extraction methods. Some few studies reported about cfDNA levels in PDAC patients, which are much lower than our yield.33,38,39 By using a bead-based isolation approach applicable for higher plasma volumes, we were able to obtain relatively high mean cfDNA values (1.9 ng/µL in a volume of ~40 µL) with minimal genomic DNA contamination. These samples were suitable for NGS without any adaptation. The cfDNA sample collected at the second time point of patient #10 revealed a concentration of 53 ng/µL, much higher than our mean value. Such a high value suggests the assumption that genomic DNA contamination is present; even so the quality control displayed a characteristic profile of cfDNA (Supplementary Figure 2). Therefore, this sample was used for further analysis without any concerns. A non-malignant pathological process leading to the release of high amounts of cfDNA into the blood stream45–47 cannot be the only explanation since KRAS p.G12V variant allele frequency was almost unchanged in both samples (Table 2) despite of 20x cfDNA concentration differences (2.51 ng/µL versus 53.0 ng/µL).
To the best of our knowledge, we present here for the first time results of this promising isolation approach. Some downstream applications require high levels of cfDNA, therefore our results could be of interest for the medical and biobanking communities.
With our 15-gene panel at least one tumor-associated mutation in 76.16% of the patients in our cohort could be identified. With our 50-gene panel we were able to detect in 76.16% of the cases a mutation as well; even though the mutation-positive cases are slightly different. Differences are mainly caused by the number of assessed genes, amplicon coverages and amplicon positions. Variant allele frequency of some mutations detected with the 50-gene panel is very low. Although we have used controls to determine the background threshold, these results are still not reliable enough for routine clinical practice, as with the TP53 low-frequency variants in patients #17 and #19. One possible option to overcome this issue is to combine NGS results with droplet digital PCR just for specific low-frequency mutations.31 Since droplet digital PCR is a more sensitive method,48,49 it would help to validate true positive low-level mutations detected by NGS.
Despite the same detection rate of 76.16% for at least one mutation, the 15-gene panel seems to be more informative (five additional KRAS mutations were detected), sensitive and reliable based on our results in respect of routine clinical practice.
During tumorigenesis KRAS mutations are among the first to occur and consequently they are seen as founder mutations.32–33–50–52 Correspondingly, KRAS is the most frequently mutated gene in patients with PDAC. In accordance with these studies, we also predominantly detected mutations in KRAS, more precisely in codon 12.31 In general, therapy response is associated with a decreasing or unchanged mutant allele frequency, whereas an increase of ctDNA is associated with refractory disease.38,40,41 With both our panels we were able to observe changes of the ctDNA allele frequencies under therapy. In 33.33% (7/21) of our cases a correlation between mutational frequency and therapy response assessed by CT-scans can be assumed. For example in patient #14 the mutational frequencies of both detected mutations dropped and correspondingly the follow-up CT-scan showed that the tumor lesions were not progressing. Furthermore, it can be hypothesized that both mutations originate from the same tumor clone because of the similar allele frequency (Table 2). In contrast, in 47.62% (10/21) of our cases a discordance of genetic and clinical data was observed. Patient #4 revealed a KRAS and TP53 mutation and the allele frequency of both decreased during therapy, which would indicate a therapy response. Contrary to this, disease reassessment by CT-scan revealed a disease progression. Based on such findings we propose that it is important to be cautious with the interpretation of mutation frequencies in respect to clinical response. Furthermore, in patients #12 and #17 baseline mutations were not detectable during therapy, although disease reassessment showed a stable disease. Regarding the radiological response evaluation, it should be considered that standard imaging methods cannot always reliably distinguish between vital tumor tissue and fibrotic masses, which could complicate the assessment of treatment responses.
In eleven of 21 patients (52.38%) primary tissue or metastatic sites were analyzed for comparison. In 5/11 patients sequencing analysis revealed a complete blood-tissue concordance of the mutational landscape and in 3/11 patients there was a partial concordance. In the latter case (#8, #11 and #21), KRAS mutations are presented in both analyses, whereas TP53 mutations were not detectable in ctDNA. One possible explanation for the absence of TP53 mutations could be a different clonal composition of the tumor in further treatment lines compared to the primary tumor. Treatment could have eradicated most of these clones during first line treatment.53 In patients #18 and #20 KRAS and TP53 mutations were detected only in the tissue of the primary tumor or metastasis but missing in ctDNA analyses. A reason for the discrepancy in the mutational profile between tissue and ctDNA might be low ctDNA levels in these samples, a limitation, which has been described in patients who are under treatment.39,53,54 In summary, the genomic concordance rate between tissue and ctDNA in our cohort was 65.22% for all mutations and in particular 72.72% for KRAS, which is higher than the rates reported by a previous study from Patel et al.25 These results emphasize the potential of ctDNA as a biomarker in PDAC and underline the promising cfDNA-isolation technique.
Limitations of this study are the relatively small number of included patients and that blood samples were only collected early in the treatment course, which would miss potential outgrowing tumor clones that arise shortly before therapy response evaluation. We decided to collect blood samples early in the treatment course because we speculated to be able to anticipate the treatment response before radiological reassessment would be performed. Our results demonstrate that by following these early ctDNA dynamics we were successful in predicting the clinical outcome in about half of all patients with a detectable mutation at baseline. In the other half of the patients treatment responses were not predictable. The selection of the NGS sequencing panels was based on the covered genes, however at the time of study initiation no PDAC-specific product suitable for ctDNA was available. We would highly encourage the development of a commercially available NGS sequencing panel optimized for ctDNA analysis in PDAC, which focuses only on a limited number of genes that are typically mutated in this disease, like KRAS, TP53, CDKN2A, SMAD4, and KDM6A. With this gene panel it would be possible to simultaneously assess multiple genes to maximize the rate of patients with at least one mutation, which can be monitored during therapy while maintaining a sufficiently high coverage essential for detecting low-abundance ctDNA.
Conclusions
This study demonstrates the feasibility of using an NGS-based analyzing method for ctDNA in PDAC patients undergoing a palliative chemotherapy. Our results underscore the importance of precise DNA isolation to yield high quality samples for further ctDNA analysis and the selection of a gene panel with a high coverage. Further validation of our findings, with a specifically for this purpose developed NGS-based gene panel, in a larger patient cohort is warranted.
Data Sharing Statement
The data that support the findings of this study are available from the corresponding author upon reasonable request.
Acknowledgments
We want to thank Robert Brettner for the processing of plasma samples and Sarah Szaffich for her great technical support. Thanks to Dr. Judith Stift for the estimation of the tumor-harboring areas on HE stained FFPE tissue slices. All sequencing was performed in cooperation with the Core Facility Genomics of the Medical University Vienna. This work was supported by the “Fonds der Stadt Wien für innovative interdisziplinäre Krebsforschung“.
Funding
This research received no external funding.
Disclosure
GWP: Personal financial interests: Merck Serono, Roche, Amgen, Sanofi, Lilly, Servier, Taiho, Bayer, Halozyme, BMS, Celgene, Pierre Fabre, Shire, Institutional financial interests – Clinical trials: Celgene, Array, Servier, Bayer, BostonBiomedical, Merck, BMS. All other authors declare no conflict of interest.
References
1. Rahib L, Smith BD, Aizenberg R, et al. Projecting cancer incidence and deaths to 2030: the unexpected burden of thyroid, liver, and pancreas cancers in the United States. Cancer Res. 2014;74:2913–2921. doi:10.1158/0008-5472.CAN-14-0155
2. Malvezzi M, Bertuccio P, Rosso T, et al. European cancer mortality predictions for the year 2015: does lung cancer have the highest death rate in EU women? Ann Oncol. 2015;26:779–786. doi:10.1093/annonc/mdv001
3. Balachandran VP, Beatty GL, Dougan SK. Broadening the impact of immunotherapy to pancreatic cancer: challenges and opportunities. Gastroenterology. 2019;156:2056–2072. doi:10.1053/j.gastro.2018.12.038
4. Neesse A, Bauer CA, Ohlund D, et al. Stromal biology and therapy in pancreatic cancer: ready for clinical translation? Gut. 2019;68:159–171. doi:10.1136/gutjnl-2018-316451
5. Singhi AD, Koay EJ, Chari ST, et al. Early detection of pancreatic cancer: opportunities and challenges. Gastroenterology. 2019;156:2024–2040. doi:10.1053/j.gastro.2019.01.259
6. Kleeff J, Korc M, Apte M, et al. Pancreatic cancer. Nat Rev Dis Primers. 2016;2:16022. doi:10.1038/nrdp.2016.22
7. Biankin AV, Waddell N, Kassahn KS, et al. Pancreatic cancer genomes reveal aberrations in axon guidance pathway genes. Nature. 2012;491:399–405. doi:10.1038/nature11547
8. Waddell N, Pajic M, Patch AM, et al. Whole genomes redefine the mutational landscape of pancreatic cancer. Nature. 2015;518:495–501. doi:10.1038/nature14169
9. Bailey P, Chang DK, Nones K, et al. Genomic analyses identify molecular subtypes of pancreatic cancer. Nature. 2016;531:47–52. doi:10.1038/nature16965
10. Jahr S, Hentze H, Englisch S, et al. DNA fragments in the blood plasma of cancer patients: quantitations and evidence for their origin from apoptotic and necrotic cells. Cancer Res. 2001;61:1659–1665.
11. Crowley E, Di Nicolantonio F, Loupakis F, et al. Liquid biopsy: monitoring cancer-genetics in the blood. Nat Rev Clin Oncol. 2013;10:472–484. doi:10.1038/nrclinonc.2013.110
12. Li L, Zhang J, Jiang X, et al. Promising clinical application of ctDNA in evaluating immunotherapy efficacy. Am J Cancer Res. 2018;8:1947–1956.
13. Alix-Panabieres C, Pantel K. Real-time liquid biopsy: circulating tumor cells versus circulating tumor DNA. Ann Transl Med. 2013;1:18. doi:10.3978/j.issn.2305-5839.2013.06.02
14. Murtaza M, Dawson SJ, Tsui DW, et al. Non-invasive analysis of acquired resistance to cancer therapy by sequencing of plasma DNA. Nature. 2013;497:108–112. doi:10.1038/nature12065
15. Dawson SJ, Tsui DW, Murtaza M, et al. Analysis of circulating tumor DNA to monitor metastatic breast cancer. N Engl J Med. 2013;368:1199–1209. doi:10.1056/NEJMoa1213261
16. Aravanis AM, Lee M, Klausner RD. Next-generation sequencing of circulating tumor DNA for early cancer detection. Cell. 2017;168:571–574. doi:10.1016/j.cell.2017.01.030
17. Madsen AT, Winther-Larsen A, McCulloch T, et al. Genomic profiling of circulating tumor DNA predicts outcome and demonstrates tumor evolution in ALK-positive non-small cell lung cancer patients. Cancers (Basel). 2020;12. doi:10.3390/cancers12040947
18. Kurihara S, Ueda Y, Onitake Y, et al. Circulating free DNA as non-invasive diagnostic biomarker for childhood solid tumors. J Pediatr Surg. 2015;50:2094–2097. doi:10.1016/j.jpedsurg.2015.08.033
19. Ikeda S, Lim JS, Kurzrock R. Analysis of tissue and circulating tumor DNA by next-generation sequencing of hepatocellular carcinoma: implications for targeted therapeutics. Mol Cancer Ther. 2018;17:1114–1122. doi:10.1158/1535-7163.Mct-17-0604
20. Zill OA, Greene C, Sebisanovic D, et al. Cell-free DNA next-generation sequencing in pancreatobiliary carcinomas. Cancer Discov. 2015;5:1040–1048. doi:10.1158/2159-8290.Cd-15-0274
21. Kinugasa H, Nouso K, Miyahara K, et al. Detection of K-ras gene mutation by liquid biopsy in patients with pancreatic cancer. Cancer. 2015;121:2271–2280. doi:10.1002/cncr.29364
22. Sefrioui D, Blanchard F, Toure E, et al. Diagnostic value of CA19.9, circulating tumour DNA and circulating tumour cells in patients with solid pancreatic tumours. Br J Cancer. 2017;117:1017–1025. doi:10.1038/bjc.2017.250
23. Perdomo Zaldivar E, Inga E, Cano T, et al. K-Ras mutation in liquid biopsy and tumor tissue correlation in patients with pancreatic cancer. Ann Oncol. 2019;30:iv84. doi:10.1093/annonc/mdz155.304
24. Wang Z-Y, Ding X-Q, Zhu H, et al. KRAS mutant allele fraction in circulating cell-free DNA correlates with clinical stage in pancreatic cancer patients. Front Oncol. 2019;9. doi:10.3389/fonc.2019.01295
25. Patel H, Okamura R, Fanta P, et al. Clinical correlates of blood-derived circulating tumor DNA in pancreatic cancer. J Hematol Oncol. 2019;12:130. doi:10.1186/s13045-019-0824-4
26. Ako S, Nouso K, Kinugasa H, et al. Utility of serum DNA as a marker for KRAS mutations in pancreatic cancer tissue. Pancreatology. 2017;17:285–290. doi:10.1016/j.pan.2016.12.011
27. Perets R, Greenberg O, Shentzer T, et al. Mutant KRAS circulating tumor DNA is an accurate tool for pancreatic cancer monitoring. The Oncologist. 2018;23:566–572. doi:10.1634/theoncologist.2017-0467
28. Pishvaian MJ, Joseph Bender R, Matrisian LM, et al. A pilot study evaluating concordance between blood-based and patient-matched tumor molecular testing within pancreatic cancer patients participating in the Know Your Tumor (KYT) initiative. Oncotarget. 2017;8:83446–83456. doi:10.18632/oncotarget.13225
29. Earl J, Garcia-Nieto S, Martinez-Avila JC, et al. Circulating tumor cells (Ctc) and kras mutant circulating free Dna (cfdna) detection in peripheral blood as biomarkers in patients diagnosed with exocrine pancreatic cancer. BMC Cancer. 2015;15:797. doi:10.1186/s12885-015-1779-7
30. Chen H, Tu H, Meng ZQ, et al. K-ras mutational status predicts poor prognosis in unresectable pancreatic cancer. Eur J Surg Oncol. 2010;36:657–662. doi:10.1016/j.ejso.2010.05.014
31. Le Calvez-kelm F, Foll M, Wozniak MB, et al. KRAS mutations in blood circulating cell-free DNA: a pancreatic cancer case-control. Oncotarget. 2016;7:78827–78840. doi:10.18632/oncotarget.12386
32. Takai E, Totoki Y, Nakamura H, et al. Clinical utility of circulating tumor DNA for molecular assessment in pancreatic cancer. Sci Rep. 2015;5:18425. doi:10.1038/srep18425
33. Adamo P, Cowley CM, Neal CP, et al. Profiling tumour heterogeneity through circulating tumour DNA in patients with pancreatic cancer. Oncotarget. 2017;8:87221–87233. doi:10.18632/oncotarget.20250
34. Hadano N, Murakami Y, Uemura K, et al. Prognostic value of circulating tumour DNA in patients undergoing curative resection for pancreatic cancer. Br J Cancer. 2016;115:59–65. doi:10.1038/bjc.2016.175
35. Del Re M, Vivaldi C, Rofi E, et al. Early changes in plasma DNA levels of mutant KRAS as a sensitive marker of response to chemotherapy in pancreatic cancer. Sci Rep. 2017;7:7931. doi:10.1038/s41598-017-08297-z
36. Cohen JD, Javed AA, Thoburn C, et al. Combined circulating tumor DNA and protein biomarker-based liquid biopsy for the earlier detection of pancreatic cancers. Proc Natl Acad Sci U S A. 2017;114:10202–10207. doi:10.1073/pnas.1704961114
37. Buscail E, Maulat C, Muscari F, et al. Liquid biopsy approach for pancreatic ductal adenocarcinoma. Cancers. 2019;11:852.
38. Wei T, Zhang Q, Li X, et al. Monitoring tumor burden in response to FOLFIRINOX chemotherapy via profiling circulating cell-free DNA in pancreatic cancer. Mol Cancer Ther. 2019;18:196–203. doi:10.1158/1535-7163.Mct-17-1298
39. Pietrasz D, Pécuchet N, Garlan F, et al. Plasma circulating tumor DNA in pancreatic cancer patients is a prognostic marker. Clin Cancer Res. 2017;23:116–123. doi:10.1158/1078-0432.Ccr-16-0806
40. Cheng H, Liu C, Jiang J, et al. Analysis of ctDNA to predict prognosis and monitor treatment responses in metastatic pancreatic cancer patients. Int J Cancer. 2017;140:2344–2350. doi:10.1002/ijc.30650
41. Siravegna G, Mussolin B, Buscarino M, et al. Clonal evolution and resistance to EGFR blockade in the blood of colorectal cancer patients. Nat Med. 2015;21:795–801. doi:10.1038/nm.3870
42. Pantel K, Alix-Panabieres C. Liquid biopsy and minimal residual disease - latest advances and implications for cure. Nat Rev Clin Oncol. 2019;16:409–424. doi:10.1038/s41571-019-0187-3
43. Kilgour E, Rothwell DG, Brady G, et al. Liquid biopsy-based biomarkers of treatment response and resistance. Cancer Cell. 2020;37:485–495. doi:10.1016/j.ccell.2020.03.012
44. Bettegowda C, Sausen M, Leary RJ, et al. Detection of circulating tumor DNA in early- and late-stage human malignancies. Sci Transl Med. 2014;6:224ra224–224ra224. doi:10.1126/scitranslmed.3007094
45. Kustanovich A, Schwartz R, Peretz T, et al. Life and death of circulating cell-free DNA. Cancer Biol Ther. 2019;20:1057–1067. doi:10.1080/15384047.2019.1598759
46. Schwarzenbach H, Hoon DS, Pantel K. Cell-free nucleic acids as biomarkers in cancer patients. Nat Rev Cancer. 2011;11:426–437. doi:10.1038/nrc3066
47. Volik S, Alcaide M, Morin RD, et al. Cell-free DNA (cfDNA): clinical Significance and utility in cancer shaped by emerging technologies. Mol Cancer Res. 2016;14:898–908. doi:10.1158/1541-7786.Mcr-16-0044
48. Postel M, Roosen A, Laurent-Puig P, et al. Droplet-based digital PCR and next generation sequencing for monitoring circulating tumor DNA: a cancer diagnostic perspective. Expert Rev Mol Diagn. 2018;18:7–17. doi:10.1080/14737159.2018.1400384
49. Yang X, Zhuo M, Ye X, et al. Quantification of mutant alleles in circulating tumor DNA can predict survival in lung cancer. Oncotarget. 2016;7:20810–20824. doi:10.18632/oncotarget.8021
50. Kanda M, Matthaei H, Wu J, et al. Presence of somatic mutations in most early-stage pancreatic intraepithelial neoplasia. Gastroenterology. 2012;142:730–733.e739. doi:10.1053/j.gastro.2011.12.042
51. Hruban RH, Wilentz RE, Kern SE. Genetic progression in the pancreatic ducts. Am J Pathol. 2000;156:1821–1825. doi:10.1016/S0002-9440(10)65054-7
52. Jones S, Zhang X, Parsons DW, et al. Core signaling pathways in human pancreatic cancers revealed by global genomic analyses. Science. 2008;321:1801–1806. doi:10.1126/science.1164368
53. Berger AW, Schwerdel D, Ettrich TJ, et al. Targeted deep sequencing of circulating tumor DNA in metastatic pancreatic cancer. Oncotarget. 2018;9:2076–2085. doi:10.18632/oncotarget.23330
54. Vidal J, Muinelo L, Dalmases A, et al. Plasma ctDNA RAS mutation analysis for the diagnosis and treatment monitoring of metastatic colorectal cancer patients. Ann Oncol. 2017;28:1325–1332. doi:10.1093/annonc/mdx125
 © 2021 The Author(s). This work is published and licensed by Dove Medical Press Limited. The full terms of this license are available at https://www.dovepress.com/terms.php and incorporate the Creative Commons Attribution - Non Commercial (unported, v3.0) License.
By accessing the work you hereby accept the Terms. Non-commercial uses of the work are permitted without any further permission from Dove Medical Press Limited, provided the work is properly attributed. For permission for commercial use of this work, please see paragraphs 4.2 and 5 of our Terms.
© 2021 The Author(s). This work is published and licensed by Dove Medical Press Limited. The full terms of this license are available at https://www.dovepress.com/terms.php and incorporate the Creative Commons Attribution - Non Commercial (unported, v3.0) License.
By accessing the work you hereby accept the Terms. Non-commercial uses of the work are permitted without any further permission from Dove Medical Press Limited, provided the work is properly attributed. For permission for commercial use of this work, please see paragraphs 4.2 and 5 of our Terms.