")
Back to Journals » Clinical Epidemiology » Volume 10
Barthel Index at hospital admission is associated with mortality in geriatric patients: a Danish nationwide population-based cohort study
Authors Ryg J, Engberg H, Mariadas P, Pedersen SGH , Jorgensen MG, Vinding KL, Andersen-Ranberg K
Received 1 June 2018
Accepted for publication 4 October 2018
Published 27 November 2018 Volume 2018:10 Pages 1789—1800
DOI https://doi.org/10.2147/CLEP.S176035
Checked for plagiarism Yes
Review by Single anonymous peer review
Peer reviewer comments 3
Editor who approved publication: Professor Vera Ehrenstein
Jesper Ryg,1,2 Henriette Engberg,3,4 Pavithra Mariadas,3,4 Solvejg Gram Henneberg Pedersen,5 Martin Gronbech Jorgensen,6 Kirsten Laila Vinding,7 Karen Andersen-Ranberg1,2
1Department of Geriatric Medicine, Odense University Hospital, Odense, Denmark; 2Geriatric Research Unit, Institute of Clinical Research, University of Southern Denmark, Odense, Denmark; 3Research Unit of Clinical Epidemiology, Department of Clinical Research, University of Southern Denmark, Odense, Denmark; 4Center for Clinical Epidemiology, Odense University Hospital, Odense, Denmark; 5Medical Department, Holbæk Hospital, Holbæk, Denmark; 6Department of Geriatric Medicine, Aalborg University Hospital, Aalborg, Denmark; 7Medical Department, Kolding Hospital, Kolding, Denmark
Purpose: The Barthel Index (BI)-100 is used to measure geriatric patients’ activities of daily living (ADL). The aim of this study was to explore whether BI at hospital admission is associated with mortality.
Patients and methods: In a nationwide population-based cohort study, patients aged ≥65 years admitted during 2005–2014 to Danish geriatric departments were assessed with BI at admission. Data were entered into the Danish National Database of Geriatrics and linked at the individual level to the Danish health registers (Civil Registration System, National Patient Register, and National Database of Reimbursed Prescriptions). The BI was categorized into four predefined standard subcategories according to the national Danish version of the statistical classification of diseases (BI =80–100 [independent ADL], BI =50–79 [moderate reduced ADL], BI =25–49 [low ADL], and BI =0–24 [very low ADL]). Patients were followed until death, emigration, or end of the study (December 31, 2015). Associations with mortality adjusted for age, admission year, marital status, body mass index, Charlson comorbidity index, polypharmacy, and hospitalizations during the preceding year were analyzed by multivariable Cox regression analysis.
Results: Totally, 74,603 patients were included. Women (63%) were older than men (mean [SD] age; 83 [7] vs 81 [7] years) and had higher BI (median [IQR]; 55 [30–77] vs 52 [26–77]). Median survival (years [95% CI]) was lowest in the subcategory “BI =0–24” in both women (1.3 [1.2–1.4]) and men (0.9 [0.8–0.9]). Adjusted mortalities (HR [95% CI]; reference BI =80–100) in women were 2.41 (2.31–2.51) for BI =0–24, 1.66 (1.60–1.73) for BI =25–49, and 1.34 (1.29–1.39) for BI =50–79 and in men were 2.07 (1.97–2.18) for BI =0–24, 1.58 (1.51–1.66) for BI =25–49, and 1.29 (1.23–1.35) for BI =50–79.
Conclusion: BI at admission is strongly and independently associated with mortality in geriatric patients. BI has the potential to provide useful supplementary information for the planning of treatment and future care of older patients.
Keywords: ADL, prognostic, death, older, longitudinal
Introduction
The population of older people in the industrialized world is increasing due to the large birth cohorts born after World War II (WW2) in combination with a steady increase in life expectancy.1,2 There is an ongoing debate whether the increased life expectancy is adding bad or good years to life.3 National Danish data show that the gained years of life are largely years spent in good health,4 while years spent with severe limitations have not changed.4 In contrast, data from USA show that although average life expectancy has increassed the time spent with disease and the loss in functional mobility has increased over a 10-year period.4,5 Other data from USA show that the increased life expectancy has been associated with an increased disabled population in the final years of life.6–8 Irrespective of the ongoing debate, the demographic change will lead to an increase in absolute numbers of older patients with chronic diseases, which will not diminish the need for hospital care. Yet, data from the WHO show that the number of hospital beds per 1,000 individuals in the Western world has decreased in the past 30 years.9 This inverse relationship has now become a challenge for the health care systems,1 especially for older patients who find outpatient attendance and treatment more challenging.
Not only disability is increasing with aging but also both the number of morbidities and the proportion of people with multimorbidity increase substantially with age.10 In a new simulation model study, the number of older patients with complex multimorbidity is predicted to rise substantially over the next 20 years.11
Health care sectors are thus under pressure, and accurate prognostic instruments in hospital settings would be helpful to plan and optimize health care delivery for older people.12 Several prognostic measurements already exist such as the multidimensional prognostic index (MPI).13 The latter includes clinical, functional, cognitive, nutritional, and social parameters and has been shown to have better prognostic accuracy in terms of mortality compared with other frailty scores.14 Other examples are the Hospital-patient One-year Mortality Risk (HOMR) score15 with an updated validated version “the HOMR-now! prognostic index”.16 However, MPI is time-consuming,17 and both “HOMR” and “HOMR-now!” fail to consider patients’ actual functioning level.15,16
A simple way to describe a person’s functional level is to evaluate activities of daily living (ADL).1 ADL characterize the capability of a person to do routine everyday activities, ranging from being very independent to being very dependent and requiring assistance. Therefore, an ADL assessment is a good proxy for a patient’s general health condition.
While both emerging disease and increasing disease severity may be difficult to identify in multimorbid and frail older patients, an increasing dependency in ADL is often recognized as an early warning sign of underlying disease in the geriatric patient. In a recent systematic review on prognostic indices for older hospitalized adults, most of the described indices indeed included different kinds of functional status assessments.18 ADL can be assessed using a score system like the Barthel Index (BI), which is a recognized and simple scoring instrument used to evaluate basic ADL functions, the level of physical performance, and the intensity of needed care.19–21 It is often noted as a gold standard outcome in terms of addressing ADL.22 In Denmark, BI is routinely assessed in geriatric patients at the time of hospital admission and data are collected in the Danish National Database of Geriatrics (NDG).23 Prior studies assessing older community-dwelling patients24,25 as well as smaller single-center studies on hospitalized geriatric patients26,27 have reported associations with disability and mortality, but more generalizable data are lacking.
The aim of the present study was to examine whether nationwide routinely assessed BI in geriatric patients at hospital admission is associated with short- and long-term mortality.
Patients and methods
This study is a nationwide register-based longitudinal cohort study that combines data from four different Danish national registers: the Danish NDG,23 the Danish National Patient Register (NPR),28 the Danish Civil Registration System (CRS),29 and the Danish National Database of Reimbursed Prescriptions (NDRP).30
Data sources
The Danish CRS
The CRS has, since 1968, assigned a unique ten-digit civil personal registry (CPR) number to each Danish citizen at birth and to residents upon immigration.29 This enables accurate linkage of information at the individual level using many population-based national registers.31 Among others, the CRS holds data on death, migration, and marital status.
The Danish NDG
The NDG is a Danish national clinical quality database designed to include all patients aged >50 years admitted to a geriatric department in Denmark.23 Twenty-four geriatric departments exist in Denmark, and patients are admitted directly from the general practitioner, through the emergency department, or by transfer from other hospital departments. The nationwide database was established in 2005 and has shown stable completeness of 90%.23 The NDG contains information on a number of variables collected at the time of hospital admission, ie, height, weight, and assessment of ADL.
The Danish NPR
The NPR was established in 1977 and contains individual-level information on all hospital admissions, discharge diagnoses, and dates of admission and discharge.28 Emergency department contacts and outpatient visits have been included since 1995.
The Danish NDRP
The NDRP is a prescription database that contains information on redeemed prescriptions from all pharmacies in Denmark since 2004.30 Data are reported at the individual level. Only medications that are reimbursed are covered by the database.
Study population
The study population was identified through the NDG23 and included all patients aged ≥65 years with their first registration in the NDG during the period from January 1, 2005, to December 31, 2014 (Figure 1).
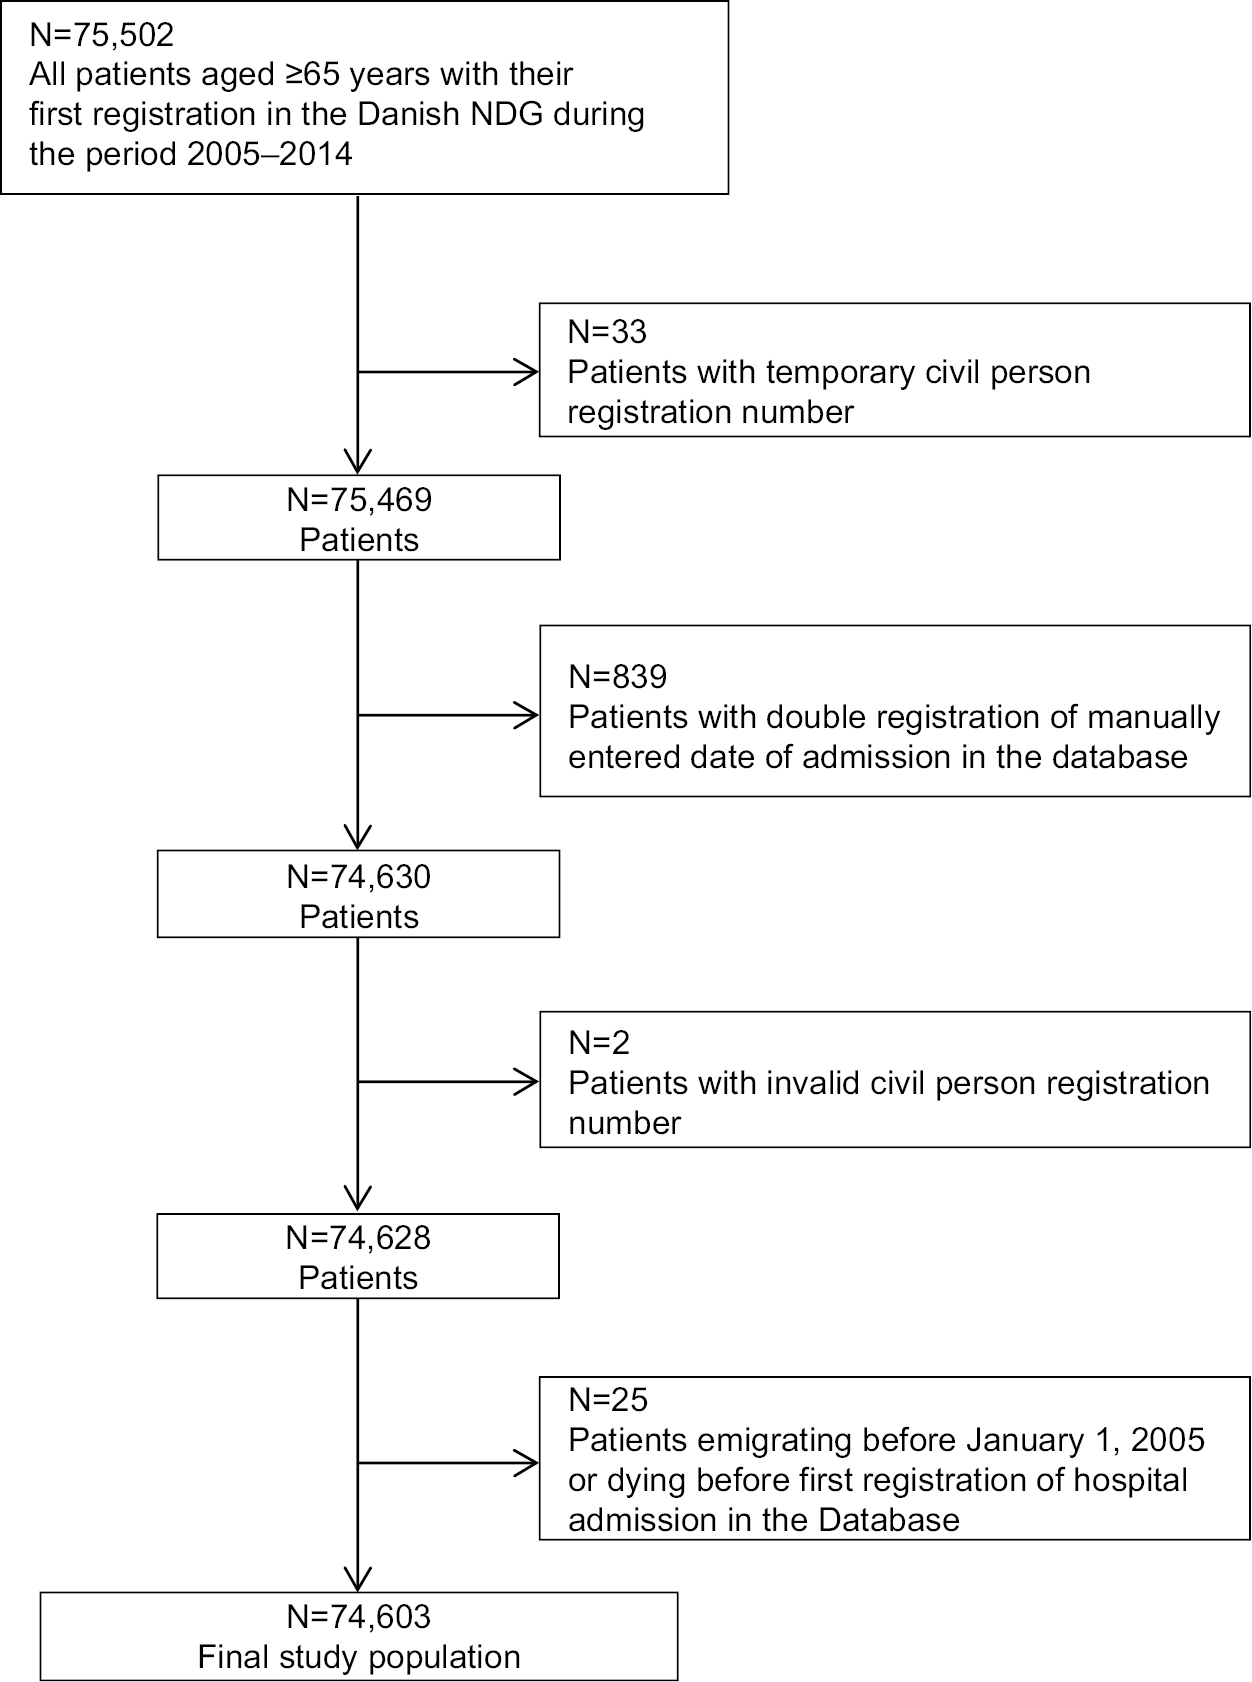 | Figure 1 Flowchart of the study population. Abbreviation: NDG, National Database of Geriatrics. |
Variables
Index date (index hospital admission date)
The index date was defined as the date of first registration of hospital admission in the NDG23 during the study period.
Mortality
The CPR number was retrieved from the NDG23 and linked to data from the CRS29 regarding the exact date of death.
Follow-up
Patients were followed from the index date until the time of death (outcome), emigration, or the end of the study on December 31, 2015, whichever occurred first, allowing for a maximum of 11 years of follow-up depending on the time of admission.
BI-100
The BI was used to measure the patients’ level of dependency in ADL at the time of hospital admission.20,21,32 The NDG uses the modified BI version developed by Shah et al.32 The BI is a sum score across ten domains of ADL. Each domain is scored on a weighted numerical scale with lowest score indicating total dependency and highest score indicating complete independency: feeding (0–10 points), transfer (0–15 points), grooming (0–5 points), toilet use (0–10 points), bathing (0–5 points), mobility (0–15 points), stair climbing (0–10 points), dressing (0–10 points), bowel function (0–10 points), and bladder function (0–10 points). Thus, the total score ranges from 0 (completely dependent) to 100 (completely independent). The numerical BI was retrieved from the NDG23 and grouped into four standard diagnostic categories according to the national Danish version of the statistical classification of diseases:33 BI =80–100 (diagnose of chapter XVIII “Symptoms, signs and abnormal clinical laboratory findings, not elsewhere classified (R00-R99)” [DR] 670; independent ADL), BI =50–79 (DR671; moderate reduced ADL), BI =25–49 (DR672; low ADL), and BI =0–24 (DR673; very low ADL).27 The highest subcategory (BI =80–100) served as the reference category throughout analyses. At the time of hospital admission to geriatric departments, the BI is routinely scored by a geriatric nurse or a nursing assistant. Time for completion is approximately 5–10 minutes.19
Age
Patients were categorized in the following age group intervals: 65–74, 75–84, 85–94, or ≥95 years.
Body mass index (BMI)
The BMI was calculated as the weight in kilograms divided by the height in meters squared retrieved from the NDG.23 The BMI was divided into categories according to the WHO: BMI <18.5 (underweight), BMI 18.5–24.9 (normal weight), BMI 25–29.9 (overweight), or BMI ≥30 (obesity).
Marital status
Marital status at the index date was determined using data from the CRS29 and defined as unmarried, married, divorced, or widowed.
Charlson comorbidity index (CCI)
The CCI is a weighted index that reflects the prevalence of 19 chronic diseases during a predefined time window and points are assigned according to the number and severity of disease.34 To take into account the burden of comorbidity, we calculated the CCI based on ICD-10 hospital discharge diagnoses extracted from the NPR28 10 years prior to the index date. The CCI was calculated and categorized as 0, 1–2, or ≥3 points with higher scores indicating increased morbidity.
Number of medications
The NDRP28 provided information about all redeemed prescriptions for 3 years prior to the index date. The number of medications was defined as the number of different medications purchased in the 120 days prior to index date. Using a 120-day cutoff as the observation window prior to the index date was chosen since most medications administered for long-term treatment in Denmark are dispensed in packages of around 100 pills.35 All redeemed prescriptions were included, except from the following Anatomical Therapeutic Chemical (ATC) codes: B05x (blood substitutes and perfusion solutions), B06x (other hematological agents), D09x (medicated dressings), J07x (vaccines), N01x (anesthetics), and Vx (various). Medications were counted at the fourth level of the ATC code, ie, including the first five digits of the ATC code (eg, salicylic acid and derivate ATC code: N02BA). Polypharmacy was defined as ≥5 redeemed prescriptions36 and excessive polypharmacy as ≥10 redeemed prescriptions.37,38 Patients were grouped into four categories according to the number of redeemed prescriptions: 0, 1–4, 5–9, or ≥10.
Prior hospital admission
The NPR28 was used to assess the number of hospitalizations (acute and elective) 1 year prior to the index date. Patients were grouped into three categories: 0, 1–2, or ≥3 hospitalizations.
Period of index admission
Admission was grouped into two time periods: years 2005–2009 and years 2010–2014.
Statistical analyses
Data on variables were inspected graphically to identify normal or skewed data distribution. Descriptive statistics are reported as median with corresponding IQR (25–75% percentile) or mean with corresponding SD as appropriate. Tests of differences in the categorical variables were performed using the chi-squared test. Differences between groups in the numerical variables were tested, using the Wilcoxon rank-sum test (median differences) or the Student’s t-test (mean differences), as appropriate. Kaplan–Meier survival curves were calculated to examine crude survival proportions according to each of the four exposure subcategories of the BI. Univariable and multivariable analyses were carried out using Cox regression and the multivariable analyses included adjustment for the following confounders: age, marital status, BMI, comorbidity, medication use, previous hospital admissions, and period of index admission. All variables were treated as categorical in the models. The statistical significance of the categorical variables included in the multivariable Cox regression model was tested using Wald statistics. The proportional hazard assumption was inspected graphically for the BI variable using a log–log plot and was found to be satisfactory. Patients with missing data on one or more of the included variables were excluded from the multivariable analyses, and thus the fully adjusted models were conducted as complete case analyses. For variables with a substantial amount of missing data, an additional descriptive nonresponse analysis was carried out to examine whether patients with missing vs non-missing data differed on selected variables. Imputation methods were not employed.39 All analyses were conducted separately for men and women to detect any gender differences in the associations. The statistical software STATA (StataCorp LP, College Station, TX, USA) was used to perform all analyses, and a P-value of 0.05 indicated statistical significance.
Ethics
Informed consent was not necessary according to the Danish law on medical ethics due to the design using register-based data only. The Danish Data Protection Agency approved the study allowing linkage of data on an individual level (2012-58-0018, journal number 16/23359). Data are reported according to STROBE (Strengthening the Reporting of Observational studies in Epidemiology) guidelines.40
Results
Among all patients identified in the NDG (N=75,502), a total of 899 patients were excluded due to multiple registrations or invalid information (Figure 1). Thus, the final study population at baseline consisted of 74,603 patients (46,823 women [63%] and 27,780 men [37%]; Figure 1). The baseline characteristics of the final study population are summarized in Table 1. The age (mean [SD]) and the BI (median [IQR]) of the total cohort were 82 (7) years and 54 (29–77), respectively. Compared with men, women were older (83 [7] years vs 81 [7] years), had a higher BI score (55 [30–77] vs 52 [26–77]), were more often widowed (64.2% vs 31.8%), had less comorbidity (CCI ≥3 points; 29.5% vs 43.9%), and had higher prevalence of polypharmacy (≥5 medications; 65.8% vs 62.3%; Table 1).
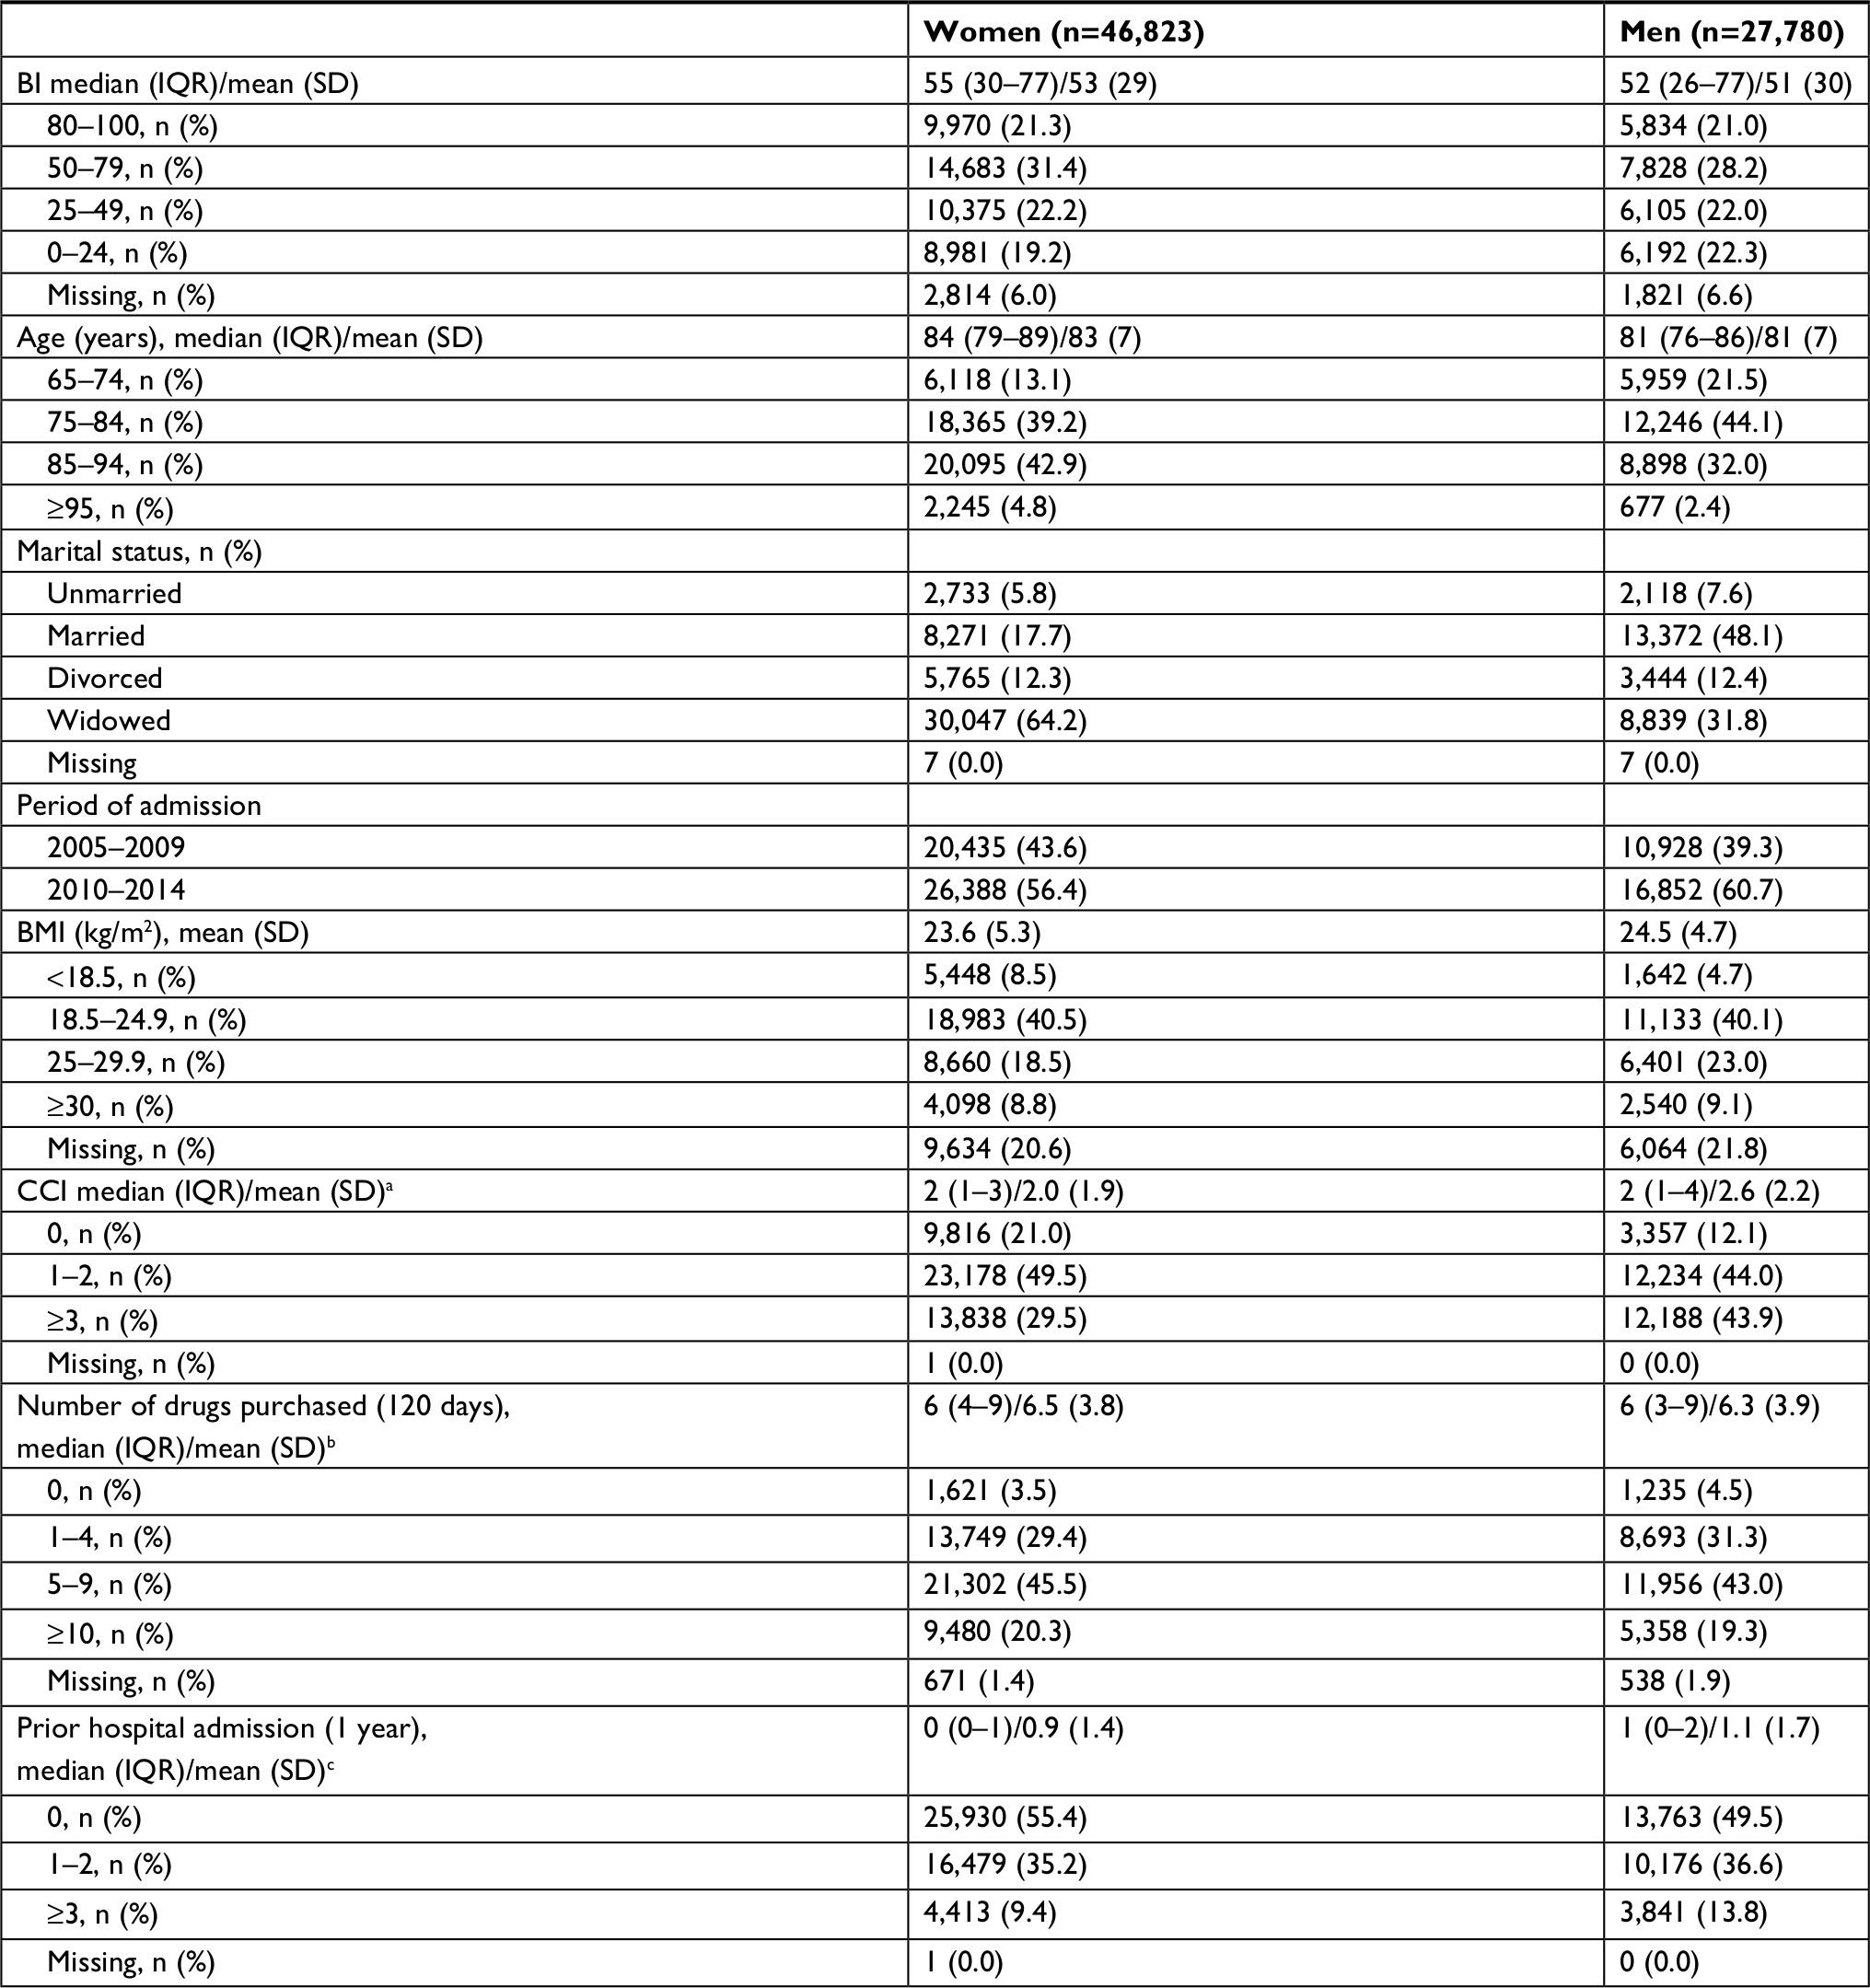 | Table 1 Baseline characteristics of the study population (N=74,603) Notes: aThe CCI was calculated based on hospital discharge diagnoses during 10 years before baseline. bAll redeemed prescriptions were included, except from the following ATC codes: B05x (blood substitutes and perfusion solutions), B06x (other hematological agents), D09x (medicated dressings), J07x (vaccines), N01x (anesthetics), and Vx (various); medications were counted at the fourth level of the ATC code, ie, including the first five digits of the ATC code (eg, salicylic acid and derivates: N02BA). cBased on hospital admissions during 1 year before baseline. Normal distributed data are presented with mean (SD), whereas non-normal distributed data are presented with both median (IQR) and mean (SD). Abbreviations: ATC, Anatomical Therapeutic Chemical; BI, Barthel Index; BMI, body mass index; CCI, Charlson comorbidity index. |
A total of 69,968 (93.8%) patients (44,009 women and 25,959 men) had complete data on BI at baseline. The distribution of these patients (n [%]) in the four BI subcategories was for women, 9,970 (22.7%; BI =80–100), 14,683 (33.4%; BI =50–79), 10,375 (23.6%; BI =25–49), and 8,981 (20.4%; BI =0–24), and for men, 5,834 (22.5%; BI =80–100), 7,828 (30.2%; BI =50–79), 6,105 (23.5%; BI =25–49), and 6,192 (23.9%; BI =0–24). Sixty patients (31 women and 29 men) died on the same day at the index hospital admission and were therefore excluded from further analyses. Of these patients, only 15 women and 18 men had a BI reported. Thus, the total population with a BI score included in the further analyses was 69,935 patients (93.7%; 43,994 women and 25,941 men).
Follow-up ranged from 1 day to 10.98 years. A total of 51,197 deaths occurred with no patients lost to follow-up. The median follow-up time after baseline was 2.23 years in women and 1.62 years in men, corresponding to a total of 192,012 person-years.
Kaplan–Meier survival curves for the entire cohort are illustrated in Figure 2. Survival curves for the four BI subcategories showed higher mortality with decreasing BI subcategory (Figure 2). In each BI subcategory, the survival was greatest in women (univariable Cox regression with gender as exposure and restriction to each BI subcategory). The median survival (years [95% CI]) for the four BI subcategories in women was 4.9 (4.7–5.0; BI =80–100), 3.5 (3.4–3.6; BI =50–79), 2.7 (2.6–2.8; BI =25–49), and 1.3 (1.2–1.4; BI =0–24), and in men was 3.6 (3.4–3.7; BI =80–100), 2.3 (2.2–2.4; BI =50–79), 1.7 (1.6–1.8; BI =25–49), and 0.9 (0.8–0.9; BI =0–24; Figure 2).
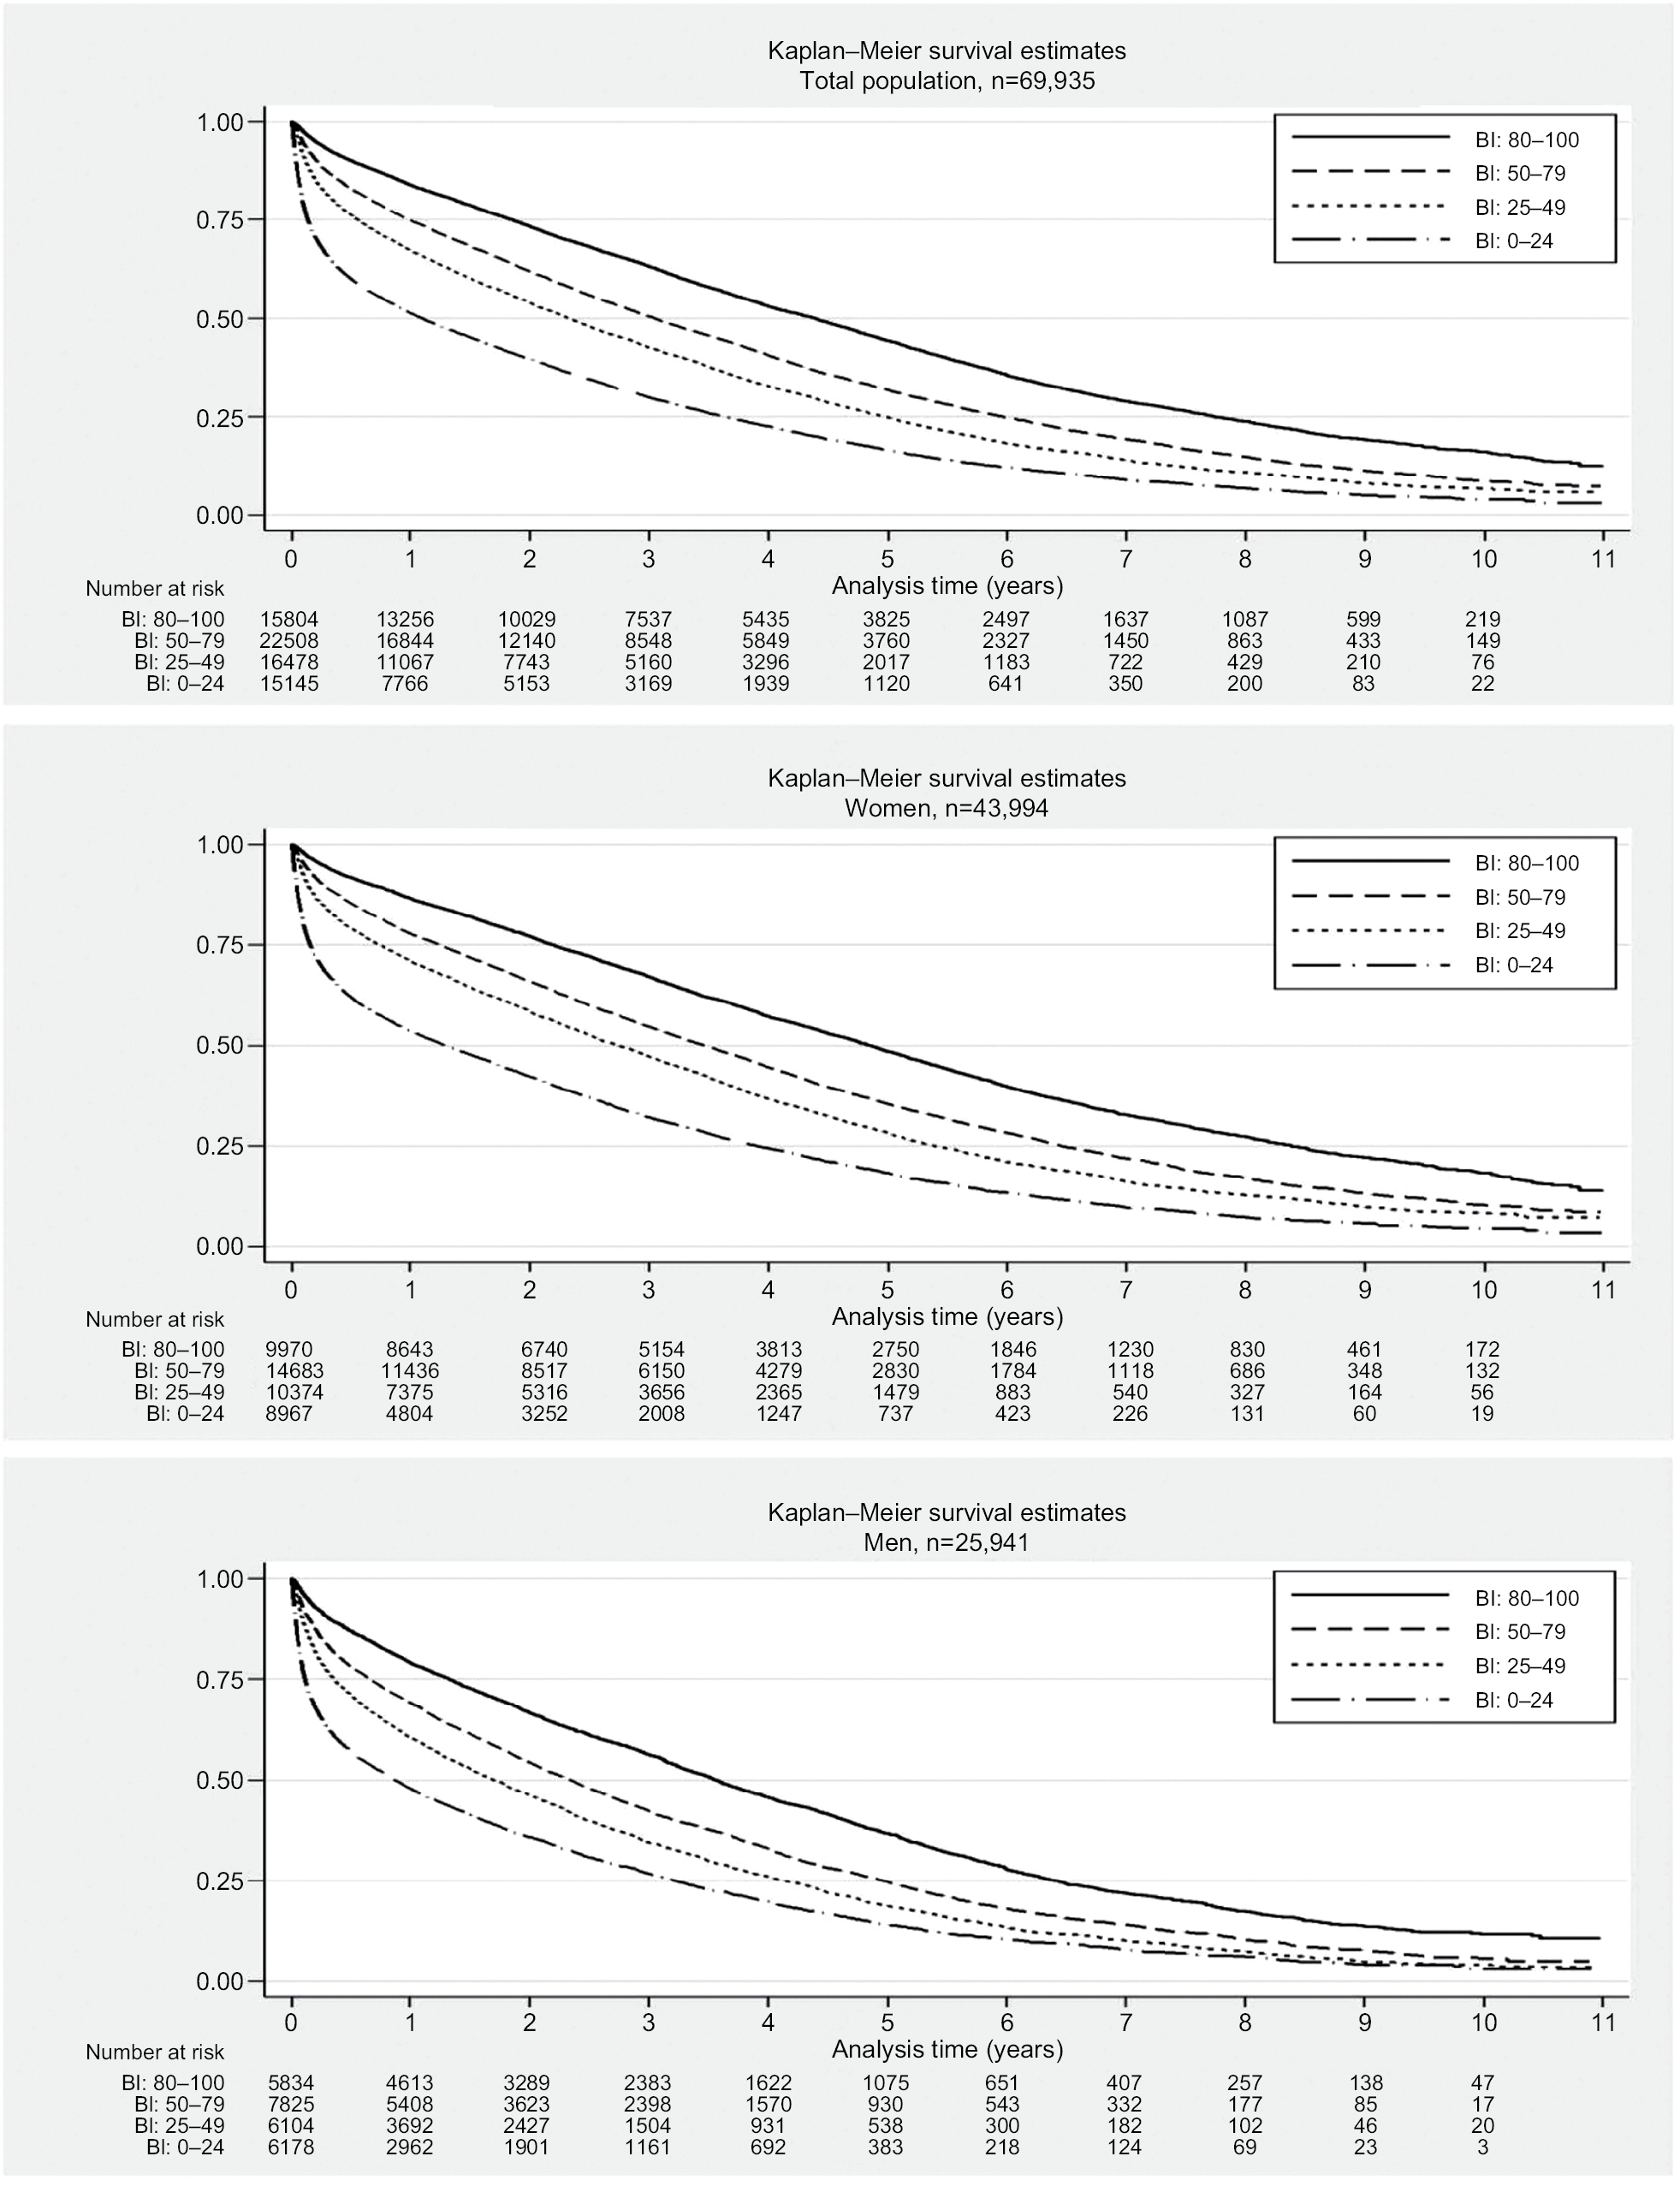 | Figure 2 Survival for the total cohort stratified by gender: for each of the four predefined BI subcategories (0–24, 25–49, 50–79, 80–100). Abbreviation: BI, Barthel Index. |
In univariable analyses, the risk of mortality (HR [95% CI]) increased with decreasing BI using subcategory “BI =80–100” as reference for women, 1.42 (1.38–1.47; BI =50–79), 1.76 (1.70–1.82; BI =25–49), and 2.72 (2.6–2.82; BI =0–24), and for men, 1.40 (1.35–1.46; BI =50–79), 1.73 (1.66–1.81; BI =25–49), and 2.29 (2.19–2.39; BI =0–24; Table 2). The mortality also increased for both genders with increasing age, comorbidity, amounts of prescribed medications, and with increasing numbers of prior hospitalizations, whereas no difference was seen in the period of index admission (Table 2).
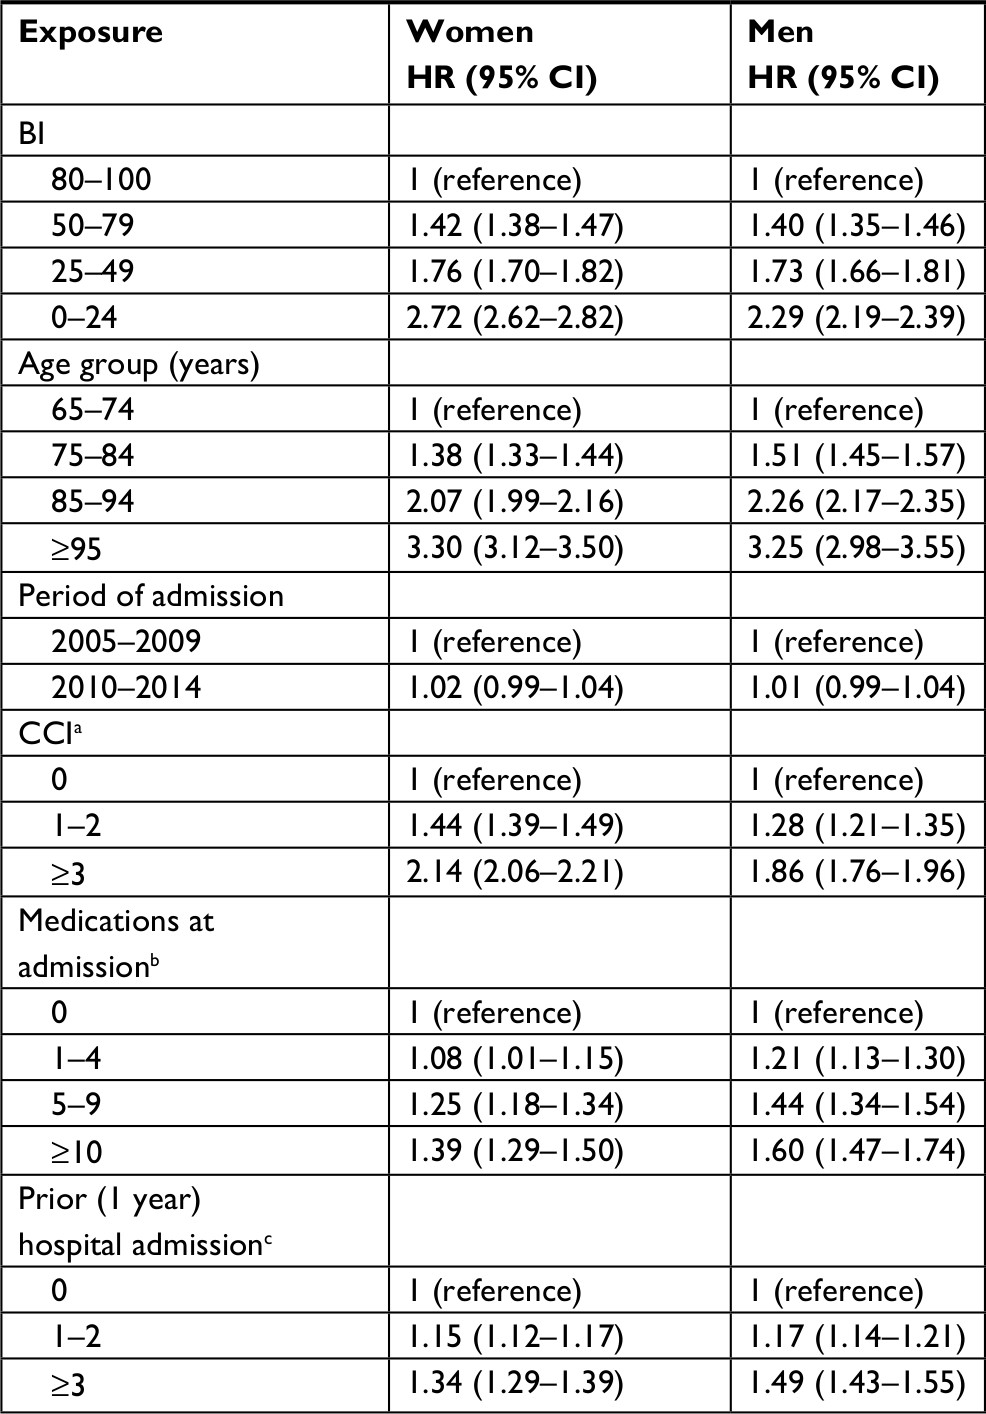 | Table 2 Univariable HRs and corresponding 95% CIs for overall mortality by gender Notes: aThe CCI was calculated based on hospital discharge diagnoses during 10 years before baseline. bAll redeemed prescriptions were included, except from the following ATC codes: B05x (blood substitutes and perfusion solutions), B06x (other hematological agents), D09x (medicated dressings), J07x (vaccines), N01x (anesthetics), and Vx (various); medications were counted at the fourth level of the ATC code, ie, including the first five digits of the ATC code (eg, salicylic acid and derivates: N02BA). cBased on hospital admissions during 1 year before baseline. Abbreviations: ATC, Anatomical Therapeutic Chemical; BI, Barthel Index; CCI, Charlson comorbidity index. |
In multivariable analyses, lower BI scores remained associated with higher mortality across gender (35,818 women and 20,754 men) using subcategory “BI =80–100” as the reference category and adjusting for age group, marital status, BMI, CCI, number of medications purchased in the 120 days prior to index date, number of hospital admissions during 1 year before baseline, and year of index admission (Tables 3 and 4). The risk of overall mortality (HR [95% CI]) was increased, 2.41 (2.31–2.51) in women and 2.07 (1.97–2.18) in men, for subcategory “BI =0–24” compared with “BI =80–100” as the reference category (Table 3). BI was associated with both increased short- and long-term mortality with the corresponding 7-day, 30-day, 90-day, 1-year, and 2-year risk of mortality for women, (HR [95% CI]) 14.61 (8.47–25.19), 8.64 (7.11–10.49), 5.59 (5.01–6.25), 3.83 (3.57–4.10), and 3.10 (2.93–3.28), and for men, 9.37 (5.68–15.46), 5.14 (4.30–6.14), 3.89 (3.48–4.35), 2.77 (2.57–2.98), and 2.44 (2.29–2.60) for subcategory “BI =0–24” compared with “BI =80–100” as the reference category (Table 4).
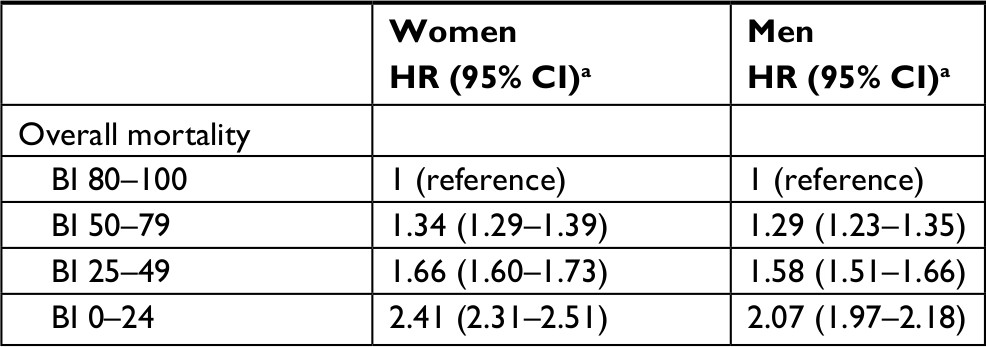 | Table 3 Multivariable HRs and corresponding 95% CIs for overall mortality according to the BI by gender, using the subcategory “BI=80–100” as the reference category Notes: aAdjusted for age group, marital status, BMI, CCI, number of different medications purchased in the 120 days prior to index date, number of hospital admissions during 1 year before baseline, and period of index admission. Women: n=35,818; men: n=20,754. Abbreviations: BI, Barthel Index; BMI, body mass index; CCI, Charlson comorbidity index. |
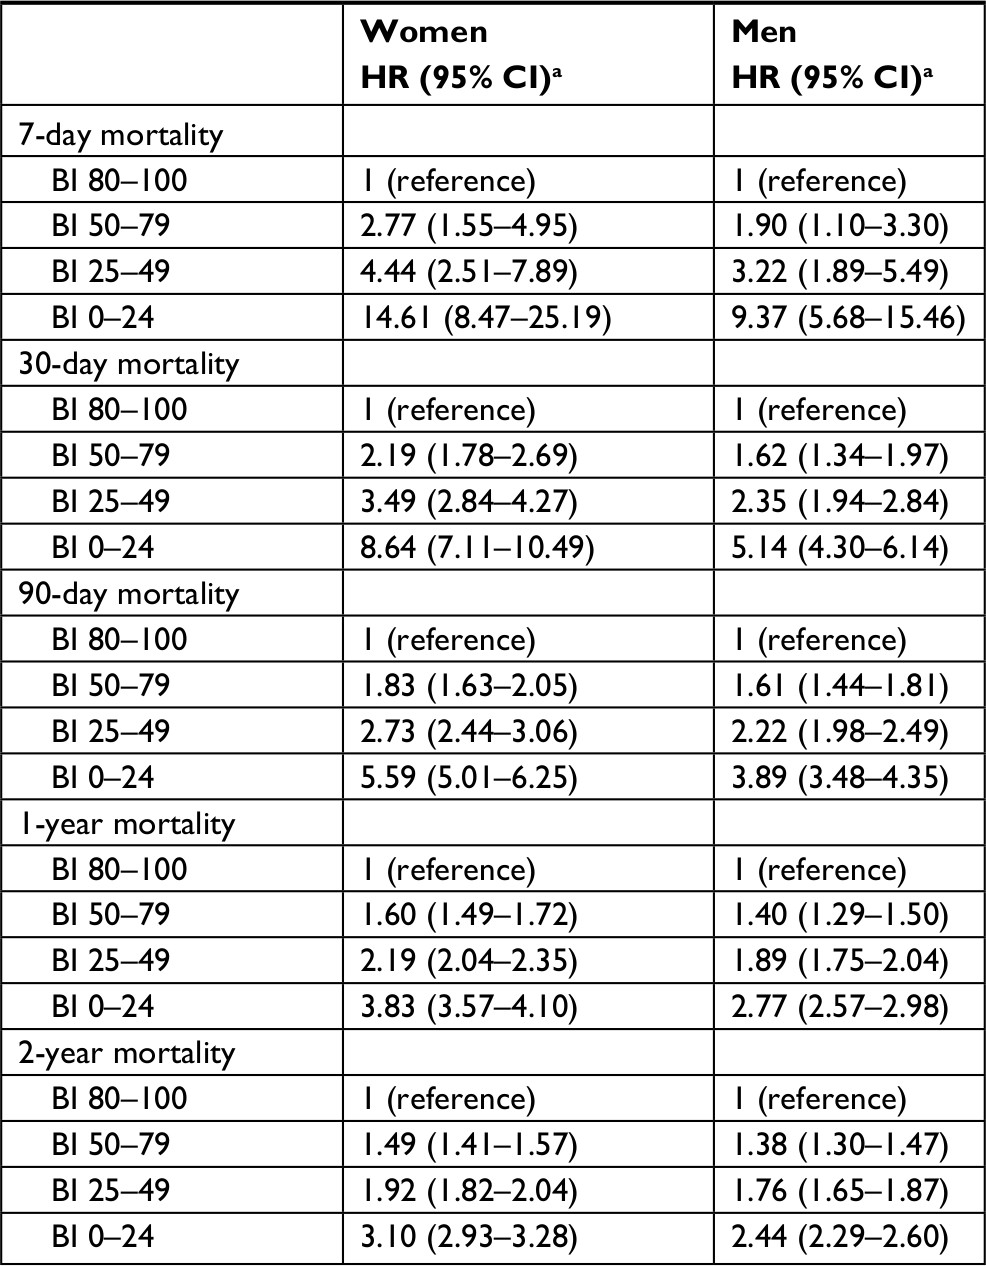 | Table 4 Multivariable HRs and corresponding 95% CIs for 7-day, 30-day, 90-day, 1-year, and 2-year mortality according to the BI by gender, using the subcategory “BI=80–100” as the reference category Notes: aAdjusted for age group, marital status, BMI, CCI, number of different medications purchased in the 120 days prior to index date, number of hospital admissions during 1 year before baseline, and period of index admission. Women: n=35,818; men: n=20,754. Abbreviations: BI, Barthel Index; BMI, body mass index; CCI, Charlson comorbidity index. |
Two variables were exposed to a substantial amount of missing data: the BI and the BMI. Among patients without a BI score (n=4,635) more were men (39.3% vs 37.1%); they were slightly younger, were more often married, and had more comorbidity compared with patients with a BI score. Furthermore, patients without a BI score had a lower crude survival compared with patients with a BI score (data not shown).
In terms of BMI, the additional analysis revealed that patients with missing BMI data (n=15,698, and of these patients n=12,417 had a BI score) had lower BI, more comorbidities, and more prior hospitalizations compared with patients with a BMI score. Furthermore, patients with missing data on BMI had a lower crude survival compared with patients with complete data on BMI. Nevertheless, the crude association between the BI and mortality was similar in the missing vs the non-missing BMI population, ie, the lower the BI score the higher the mortality (data not shown).
Discussion
In our study, the BI-100 was found to be associated with overall, short- and long-term mortality in hospitalized geriatric patients (both women and men) even in the multivariable model. Lower scores on the BI were associated with increased mortality.
Strengths and limitations
Our study has several strengths. To the best of our knowledge, this is the first study to assess the association between BI and mortality in hospitalized geriatric patients using nationwide data in a longitudinal cohort design with a long follow-up of 11 years. We were able to perform accurate linkage at the individual level between the nationwide population-based Danish health registers28–30 and the Danish NDG.23 The linkage of register data allowed us to account for all patients during the entire study period with no patients lost to follow-up, thereby increasing the validity of our results.
The study also has limitations. First, the geriatric database has a completeness of 90%, which might limit the possibilities of extrapolating the results to other populations. Yet, the database completeness reaches the standard requirement for national clinical databases.23 Second, when adjusting for prior medications, we were not able to account for over-the-counter drugs or the actual adherence to the prescribed medication. This may have led to under- or overestimation of the impact of number of medications at admission. Third, according to NDG guidelines, BI score should be evaluated within 24 hours of admission to the geriatric department. However, we had no information on the actual timing of the BI scoring in the database, which may have introduced a potential bias concerning misclassification. But we assume that the risk of misclassification of patients into BI subcategories would be evenly distributed in the cohort. Fourth, even though we accounted for several confounders we had no data available on socioeconomic position or lifestyle factors such as smoking or alcohol use. Fifth, when we accounted for comorbidity, we calculated CCI using prior ICD-10 diagnoses from the health registers. This may have introduced information bias, because these data are based on hospital discharge records. However, a prior study has shown high validity in using the Danish National Registers to calculate CCI.41 Finally, some patients had missing data on BI (6.2%). Among patients with missing data on BI the proportion of men were higher, patients were younger, and had more comorbidity. However, the observed differences were very small and most likely due to the large sample size. A substantially higher proportion had missing data on the BMI variable (21.0%). Less than 10% of missing data may not be critical to the results of a study,39 but the relatively high proportion of patients with missing data on BMI may have introduced selection bias in our study. The results of the additional analysis revealed that the patients with missing BMI were more disabled and had worse health and survival compared with patients with complete data on BMI. Thus, we excluded the disabled and diseased patients from the multivariable analyses. However, the association between BI and mortality was found to be similar in the missing and non-missing BMI population, ie, the lower the BI score the higher the mortality. This may indicate that selection bias cannot account for the pronounced association as revealed between the BI and mortality using complete case analysis. Rather, the fully adjusted estimates may be too conservative, because we excluded a high proportion of diseased patients with low BI and high mortality from the multivariable models.
In the present study, we categorized BI into four standard subcategories established by the Danish health authorities for administrative purposes.33 An earlier and smaller single-center Danish study using a shorter time period employed the same BI subcategories.27 The study reported slightly lower median survival for each BI subcategory, but their overall results corroborate our findings. The difference between the two studies might be due to the possible overestimation of the influence of BI on mortality in the prior study27 since no data on BMI or medications were available. Other studies that address the association between ADL and risk of mortality also corroborate our findings, notwithstanding the choice of BI cutoff level,42–44 whether they are community-dwellers24,25,45 or institutionalized,46 whether BI is assessed at admission or at discharge,47 or whether disease-specific populations are addressed (hip fracture,48 dementia,49 pneumonia,42 heart failure,50 or non-valvular atrial fibrillation43).All these previous studies show the same trend as our study, ie, reduced ADL is associated with increased risk of mortality which advocates for the importance of addressing older people’s functional capacity at hospital admission.
When addressing the future challenges with a growing population of older patients with multimorbidity and multiple disabilities,1,11 it would be desirable to be able to include the level of dependency in ADL in the overall assessment of patients for the purpose of evaluating future health care resources. Furthermore, the information on dependency is of great importance in the conversation with patients and their relatives regarding the level of future medical diagnostics and treatment as well as care plans. Many prognostic indices exist, but are time-consuming,17 do not take the actual dependency into account,15,16,51 or use data that are not intuitively the most relevant to health care professionals.51 BI is a simple measure, easy to interpret in clinical practice, takes around 5 minutes for a nurse/nursing assistant to carry out,19 and has a high reliability.19,32
Our data do not allow for the prediction of mortality at the individual level, but can provide a probability. Specific categories of patients at risk were identified. We found more disability in men in terms of lower BI and also a higher mortality. In general, men tend to have higher mortality but have fewer disabilities than women.52 The reason for this is still debated and not fully understood. However, some data suggest that men may react later to severe symptoms than women and are therefore more likely to be hospitalized at more advanced stages of disease and thus at a greater risk of dying.53 This could be the case in our study and at least partly explain why we see more disability in this hospital sample of acutely admitted older men. Our study also revealed that the association of BI with mortality is strongest for those patients in the lowest subcategory and especially high on the very short-term mortality. This is evident across gender but especially for women (7 days, 14.61 [95% CI 8.47–25.19]). This information is of particular importance for clinicians allowing useful supplementary knowledge to help identify patients at high risk and to support clinical decision making. BI should thus not be used as a definite prognostic instrument but rather as an add-on to the indicators physicians use in daily clinical practice.
Future perspectives of our results could be addressing the use of BI both at admission and at discharge from hospital to understand the impact of potential changes in BI during hospitalization. BI could also be routinely assessed in the primary health care system, as a recent Danish study has shown a significant increase in home care prior to acute hospital admission.54 This way, information on changes from prior to actual functional level might be used to identify older people at risk of admission as well as a useful information when targeting treatment and rehabilitation of the individual patient.
Conclusion
ADL assessed by BI at the time of admission to a geriatric hospital department is associated with overall, short, and long-term mortality in both genders also in the multivariable model. BI has the potential to provide useful supplementary information for the planning of treatment and future care of older patients. Future studies are needed to look further into the ADL phenotypes of those patients with the highest mortality, to explore which domain in the BI has the highest impact, and to investigate whether improving level of functioning might improve survival.
Data sharing statement
According to the Danish law on personal data, we are not allowed to make the dataset publicly available. Access to data from the Danish Health Data Authority requires approval from the Danish Data Protection Agency: https://www.datatilsynet.dk/english/the-danish-data-protection-agency/introduction-to-the-danish-data-protection-agency/. For access and sharing of data and materials, the corresponding author can be contacted to get help with the process on how to obtain data.
Acknowledgments
The abstract of this paper was presented at the 13th International Congress of European Union Geriatric Medicine Society (EUGMS) 2017 as a conference talk with interim findings. The conference abstract was published in “Abstracts of the 13th International Congress of EUGMS” European Geriatric Medicine; 2017; vol 8 (suppl 1): O-031: DOI 10.1016/S1878-7649(17)30178-X. Abstract was also presented in Danish at PROgram for Clinical Research INfrastructure (PROCRIN) Symposium 2017, Aarhus, Denmark, as a poster and conference talk with interim findings without the publication of abstract. The study was supported by the Program for Clinical Research Infrastructure (PROCRIN) established by the Lundbeck Foundation and the Novo Nordisk Foundation. The funders were not involved in the study design, collection, analysis, and interpretation of the data, writing of the report, or the decision to submit the paper for publication.
Author contributions
All the authors participated in the study design. HE and PM performed the statistical analyses in dialog with JR. All the authors contributed to the interpretation of data. JR wrote the first draft of the manuscript, and all the authors contributed to the critical revision of the manuscript. JR had the primary responsibility for the final content, but all the authors are accountable for all aspects of the work. All the authors read and approved the final manuscript.
Disclosure
Dr Karen Andersen-Ranberg reported grants from Danish Ministry of Health/National Board of Health, Velux Foundation, the Health Foundation (Helsefonden), Innovation Fund Denmark, Innovation Fund Odense University Hospital, and Strategic Funds, University of Southern Denmark, outside the submitted work. The authors report no other conflicts of interest in this work.
References
Christensen K, Doblhammer G, Rau R, Vaupel JW. Ageing populations: the challenges ahead. Lancet. 2009;374(9696):1196–1208. | ||
Oeppen J, Vaupel JW. Demography. Broken limits to life expectancy. Science. 2002;296(5570):1029–1031. | ||
Gruenberg EM. The failures of success. Milbank Mem Fund Q Health Soc. 1977;55(1):3–24. | ||
Jeune B, Eriksen ML, Andersen-Ranberg K, Brønnum-Hansen H. Improvement in health expectancy at ages 50 and 65 in Denmark during the period 2004–2011. Scand J Public Health. 2015;43(3):254–259. | ||
Crimmins EM, Beltrán-Sánchez H. Mortality and morbidity trends: is there compression of morbidity? J Gerontol B Psychol Sci Soc Sci. 2011;66(1):75–86. | ||
Gill TM, Allore HG, Holford TR, Guo Z. Hospitalization, restricted activity, and the development of disability among older persons. JAMA. 2004;292(17):2115–2124. | ||
Gill TM, Gahbauer EA, Han L, Allore HG. Trajectories of disability in the last year of life. N Engl J Med. 2010;362(13):1173–1180. | ||
Zunzunegui MV, Nunez O, Durban M, García de Yébenes MJ, Otero A. Decreasing prevalence of disability in activities of daily living, functional limitations and poor self-rated health: a 6-year follow-up study in Spain. Aging Clin Exp Res. 2006;18(5):352–358. | ||
The World Bank Group [homepage on the Internet]. Hospital beds (per 1,000 people). 2014; Data are from the World Health Organization, supplemented by country data. Available from: https://data.worldbank.org/indicator/SH.MED.BEDS.ZS. Accessed May 22, 2018. | ||
Barnett K, Mercer SW, Norbury M, Watt G, Wyke S, Guthrie B. Epidemiology of multimorbidity and implications for health care, research, and medical education: a cross-sectional study. Lancet. 2012;380(9836):37–43. | ||
Kingston A, Robinson L, Booth H, Knapp M, Jagger C; MODEM project. Projections of multi-morbidity in the older population in England to 2035: estimates from the Population Ageing and Care Simulation (PACSim) model. Age Ageing. 2018;47(3):374–380. | ||
Gill TM, Gahbauer EA, Han L, Allore HG. The role of intervening hospital admissions on trajectories of disability in the last year of life: prospective cohort study of older people. BMJ. 2015;350:h2361. | ||
Pilotto A, Ferrucci L, Franceschi M, et al. Development and validation of a multidimensional prognostic index for one-year mortality from comprehensive geriatric assessment in hospitalized older patients. Rejuvenation Res. 2008;11(1):151–161. | ||
Pilotto A, Rengo F, Marchionni N, et al. Comparing the prognostic accuracy for all-cause mortality of frailty instruments: a multicentre 1-year follow-up in hospitalized older patients. PLoS One. 2012;7(1): e29090. | ||
van Walraven C. The Hospital-patient One-year Mortality Risk score accurately predicted long-term death risk in hospitalized patients. J Clin Epidemiol. 2014;67(9):1025–1034. | ||
van Walraven C, Forster AJ. The HOMR-Now! Model Accurately Predicts 1-Year Death Risk for Hospitalized Patients on Admission. Am J Med. 2017;130(8):991.e9–999.e16. | ||
Pilotto A, Sancarlo D, Pellegrini F, et al. The Multidimensional Prognostic Index predicts in-hospital length of stay in older patients: a multicentre prospective study. Age Ageing. 2016;45(1):90–96. | ||
Yourman LC, Lee SJ, Schonberg MA, Widera EW, Smith AK. Prognostic indices for older adults: a systematic review. JAMA. 2012;307(2):182–192. | ||
Katz P. Measures of adult general functional status: The Barthel Index, Katz Index of Activities of Daily Living, Health Assessment Questionnaire (HAQ), MACTAR Patient Preference Disability Questionnaire, and Modified Health Assessment Questionnaire (MHAQ). Arthritis Care Res. 2003;49(5):S15–S27. | ||
Mahoney FI, Barthel DW. Functional evaluation: the Barthel Index. Md State Med J. 1965;14:61–65. | ||
Mahoney FI, Wood OH, Barthel DW. Rehabilitation of chronically ill patients: the influence of complications on the final goal. South Med J. 1958;51(5):605–609. | ||
Fillit H, Rockwood K, Young J. Brocklehurst’s Textbook of Geriatric Medicine and Gerontology. 8th ed. Philadelphia, PA: Elsevier; 2017. | ||
Kannegaard PN, Vinding KL, Hare-Bruun H. National Database of Geriatrics. Clin Epidemiol. 2016;8:731–735. | ||
Landi F, Liperoti R, Russo A, et al. Disability, more than multimorbidity, was predictive of mortality among older persons aged 80 years and older. J Clin Epidemiol. 2010;63(7):752–759. | ||
Nybo H, Petersen HC, Gaist D, et al. Predictors of mortality in 2,249 nonagenarians--the Danish 1905-Cohort Survey. J Am Geriatr Soc. 2003;51(10):1365–1373. | ||
Torres Moreno B, Núñez González E, Pérez Hernández DG, et al. Barthel and Charlson indexes for the prognosis of mortality and institutionalization in hospitalized geriatric patients. Rev Esp Geriatr Gerontol. 2009;44(4):209–212. | ||
Matzen LE, Jepsen DB, Ryg J, Masud T. Functional level at admission is a predictor of survival in older patients admitted to an acute geriatric unit. BMC Geriatr. 2012;12:32. | ||
Schmidt M, Schmidt SA, Sandegaard JL, Ehrenstein V, Pedersen L, Sørensen HT. The Danish National Patient Registry: a review of content, data quality, and research potential. Clin Epidemiol. 2015;7:449–490. | ||
Schmidt M, Pedersen L, Sørensen HT. The Danish Civil Registration System as a tool in epidemiology. Eur J Epidemiol. 2014;29(8):541–549. | ||
Johannesdottir SA, Horváth-Puhó E, Ehrenstein V, Schmidt M, Pedersen L, Sørensen HT. Existing data sources for clinical epidemiology: The Danish National Database of Reimbursed Prescriptions. Clin Epidemiol. 2012;4:303–313. | ||
Frank L. Epidemiology. When an entire country is a cohort. Science. 2000;287(5462):2398–2399. | ||
Shah S, Vanclay F, Cooper B. Improving the sensitivity of the Barthel Index for stroke rehabilitation. J Clin Epidemiol. 1989;42(8):703–709. | ||
Danish National Health Board [homepage on the Internet]. SKS-browser. Danish version of the statistical classification of diseases; 2017. Available from: http://medinfo.dk/sks/brows.php. Accessed August 19, 2018. | ||
Charlson ME, Pompei P, Ales KL, Mackenzie CR. A new method of classifying prognostic comorbidity in longitudinal studies: development and validation. J Chronic Dis. 1987;40(5):373–383. | ||
Larsen MD, Rosholm JU, Hallas J. The influence of comprehensive geriatric assessment on drug therapy in elderly patients. Eur J Clin Pharmacol. 2014;70(2):233–239. | ||
Gnjidic D, Hilmer SN, Blyth FM, et al. Polypharmacy cutoff and outcomes: five or more medicines were used to identify community-dwelling older men at risk of different adverse outcomes. J Clin Epidemiol. 2012;65(9):989–995. | ||
Haider SI, Johnell K, Weitoft GR, Thorslund M, Fastbom J. The influence of educational level on polypharmacy and inappropriate drug use: a register-based study of more than 600,000 older people. J Am Geriatr Soc. 2009;57(1):62–69. | ||
Jyrkkä J, Enlund H, Lavikainen P, Sulkava R, Hartikainen S. Association of polypharmacy with nutritional status, functional ability and cognitive capacity over a three-year period in an elderly population. Pharmacoepidemiol Drug Saf. 2011;20(5):514–522. | ||
Bennett DA. How can I deal with missing data in my study? Aust N Z J Public Health. 2001;25(5):464–469. | ||
von Elm E, Altman DG, Egger M, Pocock SJ, Gøtzsche PC, Vandenbroucke JP. Strengthening the Reporting of Observational Studies in Epidemiology (STROBE) statement: guidelines for reporting observational studies. BMJ. 2007;335(7624):806–808. | ||
Thygesen SK, Christiansen CF, Christensen S, Lash TL, Sørensen HT. The predictive value of ICD-10 diagnostic coding used to assess Charlson comorbidity index conditions in the population-based Danish National Registry of Patients. BMC Med Res Methodol. 2011;11:83. | ||
Corrao S, Argano C, Natoli G, et al. Disability, and not diabetes, is a strong predictor of mortality in oldest old patients hospitalized with pneumonia. Eur J Intern Med. 2018;54:53–59. | ||
Gullón A, Formiga F, Camafort M, et al. Baseline functional status as the strongest predictor of in-hospital mortality in elderly patients with non-valvular atrial fibrillation: Results of the NONAVASC registry. Eur J Intern Med. 2018;47:69–74. | ||
Martínez-Velilla N, Cambra-Contin K, Ibáñez-Beroiz B. Comorbidity and prognostic indices do not improve the 5-year mortality prediction of components of comprehensive geriatric assessment in hospitalized older patients. BMC Geriatr. 2014;14:64. | ||
Scott WK, Macera CA, Cornman CB, Sharpe PA. Functional health status as a predictor of mortality in men and women over 65. J Clin Epidemiol. 1997;50(3):291–296. | ||
Nakazawa A, Nakamura K, Kitamura K, Yoshizawa Y. Association between activities of daily living and mortality among institutionalized elderly adults in Japan. J Epidemiol. 2012;22(6):501–507. | ||
Walter LC, Brand RJ, Counsell SR, et al. Development and validation of a prognostic index for 1-year mortality in older adults after hospitalization. JAMA. 2001;285(23):2987–2994. | ||
Wong TM, Leung FKL, Lau TW, Fang C, Chan FHW, Wu J. Effectiveness of a Day Rehabilitation Program in Improving Functional Outcome and Reducing Mortality and Readmission of Elderly Patients With Fragility Hip Fractures. Geriatr Orthop Surg Rehabil. 2018;9: 2151459318759355. | ||
Martín J, Padierna A, Anton-Ladislao A, Moro I, Quintana JM. Predictors of mortality during hospitalization and 3 months after discharge in elderly people with and without dementia. Aging Ment Health. 2018:1–9. | ||
Pacho C, Domingo M, Núñez R, et al. Predictive biomarkers for death and rehospitalization in comorbid frail elderly heart failure patients. BMC Geriatr. 2018;18(1):109. | ||
Gilbert T, Neuburger J, Kraindler J, et al. Development and validation of a Hospital Frailty Risk Score focusing on older people in acute care settings using electronic hospital records: an observational study. Lancet. 2018;391(10132):1775–1782. | ||
Oksuzyan A, Juel K, Vaupel JW, Christensen K. Men: good health and high mortality. Sex differences in health and aging. Aging Clin Exp Res. 2008;20(2):91–102. | ||
Juel K, Christensen K. Are men seeking medical advice too late? Contacts to general practitioners and hospital admissions in Denmark 2005. J Public Health. 2008;30(1):111–113. | ||
Fournaise A, Espensen N, Jakobsen S, Andersen-Ranberg K. Increasing primary health-care services are associated with acute short-term hospitalization of Danes aged 70 years and older. Eur Geriatr Med. 2017;8(5–6):435–439. |
 © 2018 The Author(s). This work is published and licensed by Dove Medical Press Limited. The full terms of this license are available at https://www.dovepress.com/terms.php and incorporate the Creative Commons Attribution - Non Commercial (unported, v3.0) License.
By accessing the work you hereby accept the Terms. Non-commercial uses of the work are permitted without any further permission from Dove Medical Press Limited, provided the work is properly attributed. For permission for commercial use of this work, please see paragraphs 4.2 and 5 of our Terms.
© 2018 The Author(s). This work is published and licensed by Dove Medical Press Limited. The full terms of this license are available at https://www.dovepress.com/terms.php and incorporate the Creative Commons Attribution - Non Commercial (unported, v3.0) License.
By accessing the work you hereby accept the Terms. Non-commercial uses of the work are permitted without any further permission from Dove Medical Press Limited, provided the work is properly attributed. For permission for commercial use of this work, please see paragraphs 4.2 and 5 of our Terms.