")
Back to Journals » Journal of Healthcare Leadership » Volume 8
Barriers and facilitators of Canadian quality and safety teams: a mixed-methods study exploring the views of health care leaders
Authors White DE, Norris JM , Jackson K, Khandwala F
Received 5 July 2016
Accepted for publication 19 September 2016
Published 12 December 2016 Volume 2016:8 Pages 127—137
DOI https://doi.org/10.2147/JHL.S116477
Checked for plagiarism Yes
Review by Single anonymous peer review
Peer reviewer comments 3
Editor who approved publication: Professor Russell Taichman
Deborah E White,1 Jill M Norris,1 Karen Jackson,2 Farah Khandwala3
1Faculty of Nursing, University of Calgary, 2Workforce Research and Evaluation, Alberta Health Services, 3Cancer Care Services, Alberta Health Services, Calgary, AB, Canada
Background: Health care organizations are utilizing quality and safety (QS) teams as a mechanism to optimize care. However, there is a lack of evidence-informed best practices for creating and sustaining successful QS teams. This study aimed to understand what health care leaders viewed as barriers and facilitators to establishing/implementing and measuring the impact of Canadian acute care QS teams.
Methods: Organizational senior leaders (SLs) and QS team leaders (TLs) participated. A mixed-methods sequential explanatory design included surveys (n=249) and interviews (n=89). Chi-squared and Fisher’s exact tests were used to compare categorical variables for region, organization size, and leader position. Interviews were digitally recorded and transcribed for constant comparison analysis.
Results: Five qualitative themes overlapped with quantitative data: (1) resources, time, and capacity; (2) data availability and information technology; (3) leadership; (4) organizational plan and culture; and (5) team composition and processes. Leaders from larger organizations more often reported that clear objectives and physician champions facilitated QS teams (p<0.01). Fewer Eastern respondents viewed board/senior leadership as a facilitator (p<0.001), and fewer Ontario respondents viewed geography as a barrier to measurement (p<0.001). TLs and SLs differed on several factors, including time to meet with the team, data availability, leadership, and culture.
Conclusion: QS teams need strong, committed leaders who align initiatives to strategic directions of the organization, foster a quality culture, and provide tools teams require for their work. There are excellent opportunities to create synergy across the country to address each organization’s quality agenda.
Keywords: health services research, qualitative research, surveys, leadership, quality of health care
Introduction
Quality improvement initiatives are extensively used across health care; however, disappointing outcomes from these initiatives remain troublesome for health care professionals and researchers alike.1 In light of this quality chasm, quality and safety (QS) teams have been offered as a collaborative strategy to achieve better alignment between care offered and population needs.2–5 Also termed project or quality improvement teams,6 QS teams are groups of individuals brought together in efforts to improve the quality of care (ie, efficiency, effectiveness, accessibility, patient-centeredness, safety, timeliness).7–9 Members include health professionals and support staff who identify factors impeding safe health care delivery, and subsequently develop and implement actions to address concerns in their clinical area.
While QS teams are being widely applied, reviews of the literature show little evidence for their efficacy or evidence-based recommendations for creating or sustaining highly effective QS teams.6,7,10,11 Compared to interdisciplinary care delivery and management teams largely discussed within health care teams and teamwork literature,6,12,13 QS teams implement more complex initiatives requiring organizational change. QS teams are not equally effective even when working on the same initiative and using the same quality improvement methodology, as in the case of teams within quality improvement collaboratives.14–16 This suggests that research should focus on detailing the strategies used to facilitate uptake of practices (ie, educational workshops, academic detailing, audit and feedback),17,18 as well as understanding contextual barriers and factors that encourage well-functioning and innovative teams.11,12,19
Within the Canadian context, there are few studies about QS teams and fewer that detail the influence of broader contextual factors. To better understand QS teams across Canada, we conducted a large descriptive study of organizational senior leaders (SLs) and QS team leaders (TLs) to understand how leaders viewed and stewarded quality and QS teams in their organizations. The purpose of this paper is to present key findings about the contextual factors that act as barriers and facilitators to establishing/implementing and measuring the impact of QS teams, and explore potential differences in perspectives across the country. Specifically, we were interested in differences as a result of leadership position (SL, leader of QS team), region, and organization size. The implications of this paper extend beyond Canada, providing decision makers with factors in most immediate need of intervention to improve QS in their organizations.
Methods
Design
This multiphase study used a mixed-methods sequential explanatory design20 and included national online surveys followed by semi-structured interviews with SLs and QS TLs in Canadian hospitals. A mixed-methods design was selected for significance enhancement,21 that is, to achieve an in-depth understanding of study findings through augmenting quantitative findings with the richness of qualitative data.22
Participants and recruitment
The study was advertised through the Canadian Patient Safety Institute newsletter 8 weeks prior to the first phase of recruitment. We identified all Canadian chief executive officers (CEOs) of organizations/regions that included an acute care hospital with >50 beds.23,24 From publicly available information provided by the hospital or health region, 151 CEOs were invited to participate in the study through a personal email from the research team describing the study; they were asked to forward the email and attachments to other appropriate SLs and TLs, from within their organization, who were involved in QS teams (ie, snowball sampling; Figure 1 presents flow diagram). Email reminders were sent to nonresponders at 2-week and 4-week intervals to optimize response rate.25 At the end of the survey, all participants were asked to provide their contact information if interested in an interview. From the 102 participants who offered to be interviewed, purposive sampling was then used to assure that key informants were selected from hospitals of different sizes (<500 beds, >500 beds), academic status (teaching, non-teaching, both), and from different geographic regions. These regions were categorized according to the Accreditation Canada format26 (West – British Columbia, Alberta, Saskatchewan, Manitoba, Northwest Territories; East – New Brunswick, Newfoundland and Labrador, Nova Scotia, Prince Edward Island; Ontario). It is important to note that SLs responded on behalf of their organization, while TLs responded from a single-team perspective.
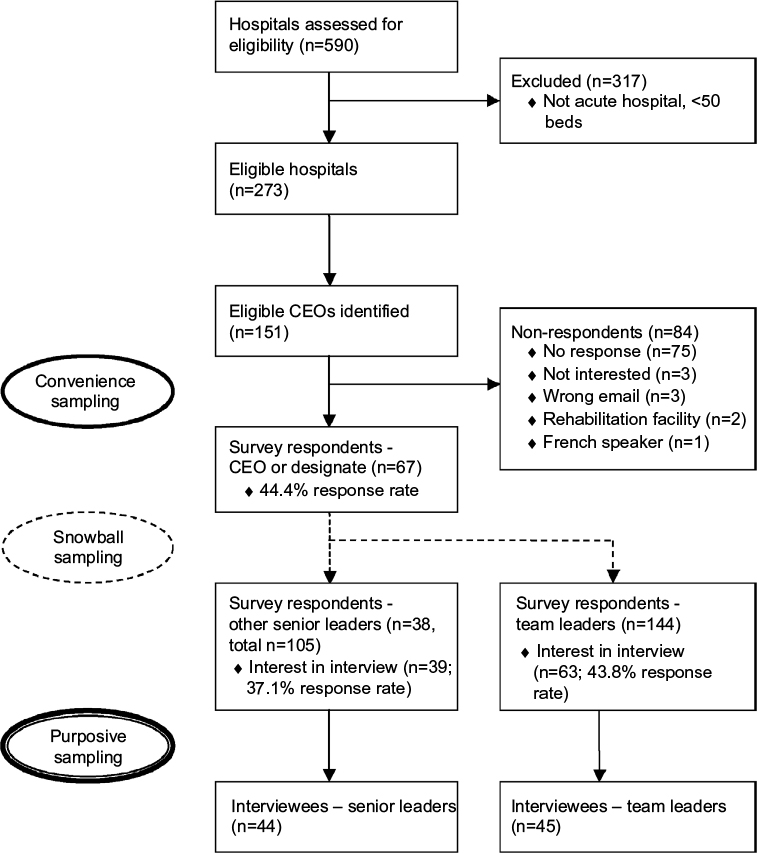 | Figure 1 Participants flow diagram Abbreviation: CEO, chief executive officer. |
Data collection
Data were collected between March and July 2010. The online survey items and semi-structured interview questions were generated through a scoping review,7 expert review by health service researchers and decision makers, and a pilot study. In the pilot study, the online survey was given to SLs and TLs to assess face validity, optimize completeness of survey items, and test the study website. These same individuals participated in pilot interviews, and the results of these were used to refine the interview guide and develop a provisional qualitative coding framework.
Online survey
Thirty-three items assessed facilitators and barriers to (1) establishing and implementing QS team initiatives, and (2) measuring the impact of initiatives. Responses were measured using a checkbox to indicate the presence of the facilitator or barrier. Two additional open-ended items asked participants to describe other facilitators and barriers that were not identified in the survey. The survey also included questions regarding demographic and organizational characteristics, such as position, professional designation, location, setting, and academic status.
Interviews
Telephone interviews were conducted by the principal investigator (DW), an experienced qualitative researcher. Interviews were digitally recorded and lasted 60 minutes. Interviewees were asked in-depth questions about the challenges and facilitators in implementing their teams and measuring the impact of the teams. Each participant’s survey data was reviewed by the interviewer prior to each interview and was used to probe for a richer understanding about his/her survey responses. Interviewer notes were also documented. Sampling continued to data saturation across regions, organizational size, and leader type.
Data analysis
The data generated from this study were analyzed using a mixed-methods data analysis process.21 Data reduction, display, and transformation were conducted independently for survey and interview data. Data comparison and integration were achieved by combining both qualitative and quantitative data.
Data from the online survey were downloaded into an Excel database, and subsequently analyzed using the statistical package SAS 9.2. Survey results were summarized via descriptive statistics. Frequency distributions were used to identify and correct data entry errors, and to explore the array of answers to each question. Univariate statistics including chi-squared and Fisher’s exact test were used to compare categorical variables for region, organization size, and type of leader (SL, TL). A significance level of .05 was used; however, a conservative significance level of <.01 was used to account for post hoc multiple comparisons in regions.
Interviews were transcribed verbatim, and imported into NVivo 8 for qualitative data storage, indexing, and theorizing.27,28 From our pilot interviews, the authors (DW, KJ, JN) and a research assistant developed a provisional coding framework to facilitate thematic analysis.29 Starting after the first interview, the team independently coded all interviews by examining and assigning text to codes. Biweekly meetings during data analysis facilitated a negotiated and refined coding framework for constant comparsion30 between themes within a single interview (open coding) and across interviews (axial coding), and discrepant and negative information. To establish an audit trail, coding team discussions, coding definitions, and rationale for changes to the coding framework were documented. Matrices of the themes were created to understand theme interrelationships and cross-validation of the data. To assure reliability, 20% of the interviews were coded by two coders, and a coding comparison indicated 85–90% agreement. Memos were also used to record researcher’s comments and insights, contributing to analysis.
Ethical approval
Ethical approval was secured from the University of Calgary Conjoint Health Research Ethics Board, the University of Saskatchewan Biomedical Research Ethics Board, and the Atlantic Health Sciences Corporation Research Services. Consent was implied through submission of the online survey, and all interview participants provided written informed consent.
Results
Sample
Two hundred and forty-nine surveys and 89 interviews were completed (Table 1). The survey response rate for the CEO or a designate from his/her organization was 44.4%. Snowball sampling did not permit further response rate calculations for other SLs and TLs who were not the first point of contact. CEO/designate survey respondents and nonrespondents did not differ significantly by their organization’s overall or acute care bed size, hospital teaching status, or provincial/regional grouping. In total, 67 CEOs/designates, 38 other SLs, and 144 TLs responded to the survey.
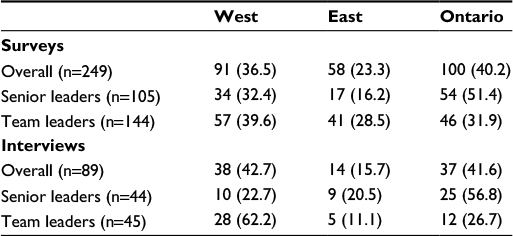 | Table 1 Distribution of survey and interview participants by region, N (%) |
Academic status (teaching, n=30; nonteaching, n=31; both, n=40) and number of acute care beds in the organization (<100, n=39; 100–299, n=14; 300–499, n=22; 500–999, n=4; >1000, n=20) were distributed evenly across CEO/designate respondents’ organizations (Table 2). Ninety-two SLs reported having a quality and/or safety portfolio/department in their organization. SLs who completed the survey primarily included CEOs and vice presidents. TLs also included senior executives and directors, in addition to other positions. TL professional designations included a large proportion of registered nurses and allied health professionals (eg, physiotherapists, psychologists), and several physicians and pharmacists. Almost half of SLs were responsible for one hospital, and roughly one-third of TLs participated on a single team.
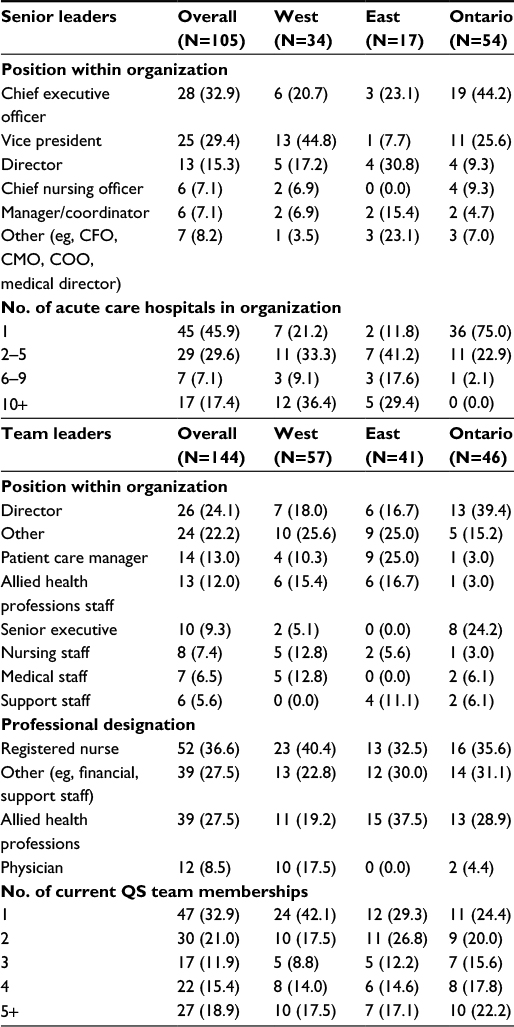 | Table 2 Characteristics of senior leader and team leader survey respondents, N (%) Abbreviations: CFO, chief financial officer; CMO, chief medical officer; COO, chief operating officer; QS, quality and safety. |
Interviewees included CEOs (n=13), other senior executives (n=31), directors, managers, or coordinators (n=19), medical staff (n=3), quality and/or safety personnel (n=21), and other staff positions (n=11). TL interviewees included nurses (n=20), physicians (n=5), allied health professionals (n=10), and others (n=9).
Facilitators and barriers of QS teams
Regional differences in facilitators and barriers are reported in Tables 3 and 4. Some factors were highlighted simultaneously as a barrier and facilitator. Five themes from the qualitative analysis overlapped with quantitative data, and are integrated below: (1) resources, time, and capacity; (2) data availability and information technology (IT); (3) leading across the organization; (4) organizational plan and culture; and (5) team composition and processes. A purposeful selection of quotes that augment the quantitative findings are presented as follows.
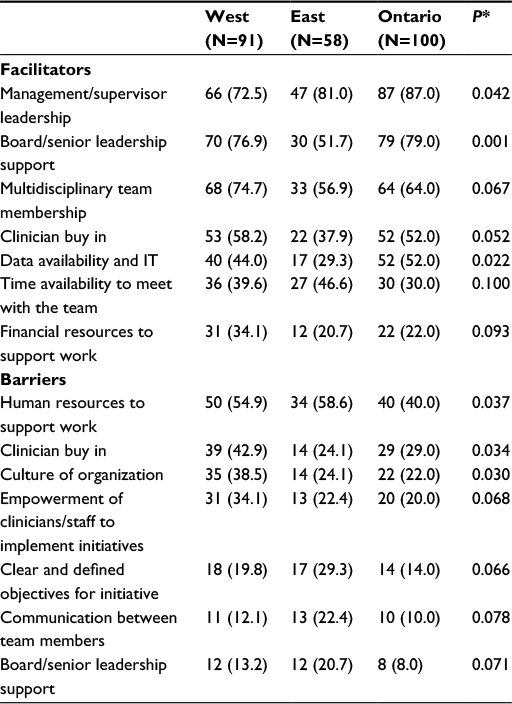 | Table 3 Facilitators and barriers to establishing/implementing QS teams, N (%) Notes: *p-Value comparing differences in proportions between regions. A significance level of 0.01 was used to adjust for post hoc multiple comparisons. Abbreviations: QS, quality and safety; IT, information technology. |
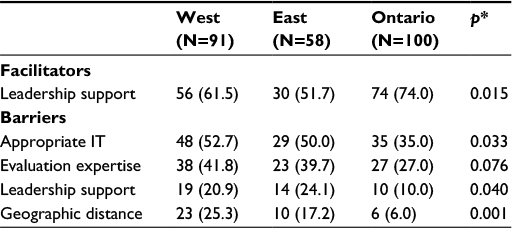 | Table 4 Facilitators and barriers to measuring the impact of QS teams, N (%) Notes: *p-Value comparing differences in proportions between regions. A significance level of 0.01 was used to adjust for post hoc multiple comparisons. Abbreviations: QS, quality and safety; IT, information technology. |
Resources, time, and capacity
Survey respondents expressed that insufficient financial (48.6%) and human resources (49.8%) were barriers to establishing/implementing QS teams, while a lack of financial resources hindered evaluating their work (45.0%). In an interview, one SL expressed, “We are not resourced to continue to measure for every quality improvement project.” Financial resources were linked to insufficient infrastructure, data system, and human resources.
So if people want these things measured, then they need to provide the resources to actually measure […] but there aren’t enough people and resources to be able to actually do all these things. [TL West 2.1.14]
Participants identified the importance of access to expertise, “time to do the work,” and “to be able to support getting people away from their daily work to focus on quality.” In particular, 60.2% of survey respondents voiced a lack of time to meet with team, although this was less often reported by TLs than SLs (54.2% vs. 68.6%, p<.001). When discussed as a facilitator, time to meet with the team was identified more so by TLs (45.8%) than SLs (25.7%, p<.001).
I think that it is important that we have dedicated resources. People on the frontlines with whites of the patients’ eyes demanding time need to have somebody with the skills and capacity to support them in this work. They want to do it but they can’t fit it into their workload. [TL West 1.4.1]
Participants extended their description of resources to include organizational investment in building capacity across the whole organization, within teams, and “inside the programs right at the unit level.” While staff are expected to “be doing [quality work],” they need to have “the tools and the templates and ad hoc advice” as well as “a basket of skills that allows them to analyze their work” so that they can “make some decisions about how they can improve.” Participants emphasized that all people within the organization need to be held accountable for QS. For example, one SL stated:
We trained the staff and while it was being rolled out on the unit, these were the people who supported the staff in their practice. We want patient safety champions on each unit. We want to build capacity through the organization […] and then give people the data to look at on a regular basis so they can actually respond to it themselves. [Ontario 71.0]
Expertise in evaluation and expertise in statistics were viewed as facilitators (55.8%, 44.6%), while the lack thereof acted as barriers to measurement (35.3%, 40.2%). Fewer TLs (45.1%) than SLs (70.5%, p<.001) reported evaluation expertise as a facilitator. It was further acknowledged that expertise was required at the unit (microsystem) and organization (macrosystem) level.
You need people that can understand that [statistics] and can articulate it. Not like statisticians, but unit managers and clinical leaders. [TL West 2.1.22]
Data availability and IT
Meaningful data were seen as helpful to engage stakeholders and “help them realize that their work is making a difference” by visibly tracking and communicating outcomes from QS team projects. Participants highlighted how having accessible real-time data and data systems (ie, data availability=66.7%) with appropriate IT (46.2%) was crucial to support planning and evaluation, without which “teams cannot be successful.”
However, data availability was a challenge as there seemed to be a constant struggle between what should and could be measured: “we know there’s indicators we’d like to collect or report on, but we can’t get the data for it. Our board wants to see the indicator […] to see trends […] and how we compare provincially and nationally” [SL East 1.7.0]. Data availability (48.6%) and IT (45.0%) were top barriers reported for measuring team impact, and together were a barrier to establishing/implementing teams (35.7%). For some, the technology to drive data collection was either not available or inadequate:
[Technology is] always a struggle for us. We do not have an electronic health record. We don’t have a business intelligence tool, but we’re moving towards that. So a lot of the work that we do on the quality front is still manually driven, so it’s pretty labour intensive. [SL East 1.3.1]
Several participants described that they were “really at [their] infancy” in terms of measurement capacity, but were beginning to “expand [their] quality initiatives around measurement.” Fewer TLs (40.3%) than SLs (60.0%, p=.002) reported data availability as a barrier.
Leading across the organization
Participants emphasized various forms of leadership in facilitating QS team establishment/implementation (management/supervisory=80.3%; board/senior=71.9%) and measuring team impact (64.3%). Participants in Eastern provinces viewed board/senior leadership (51.7%) as less of a facilitator than participants in the West (76.9%, p=.001) or Ontario (79.0%, p<.001). While fewer TLs than SLs reported that leadership enables establishment/implementation (management/supervisory; 72.2% vs. 91.4%, p<.001) and measurement (54.2% vs. 78.1%, p<.001), respectively, this differentiation was not apparent across the interviews. Interviewees spoke to multiple levels of leadership (ie, governance/board, senior executive, manager, team/frontline), and that leaders “don’t just lead from the top. [They] lead from all directions and all layers in an organization” [SL Ontario 34.0]. Interviewees also discussed the roles of leaders, including the importance of setting the “vision,” establishing a “strategic approach” to the quality agenda, enabling and engaging staff in QS team initiatives, and creating and providing access to resources.
A number of interview participants identified the need for co-executive sponsors of teams as well as physician co-leads: “We know that where we’ve had some of our best results is where we’ve had strong physician involvement, and ideally, physician leadership. We’ve got a dyad leadership model here” [SL West 3.7.1]. These leadership positions were seen to support engagement of other important champions in QS teams: “It doesn’t matter how it happens; it’s useful to have champions within all corners of the organization and physicians especially because they are the gatekeepers” [TL West 1.4.1]. A lack of a physician champion (36.9%) was one of the top barriers to establishing/implementing QS teams, and emerged as a facilitator more often for larger (64.3%) than smaller organizations (36.8%, p=.007).
Organizational plan and culture
Participants discussed the importance of organizational goals and strategic plans (78.7%) to establishing/implementing QS teams. Several participants noted that their organizations were “requiring the teams to link their activity to the strategic plan of the organization […] identify how it’s tied to one of the strategic directions” [TL West 2.1.1]. Some participants felt that by aligning QS team initiatives with corporate priorities, resource allocation could be improved, and leaders’ responsibilities and accountabilities better clarified. How the vision was communicated and operationalized in the strategic plan influenced the culture of QS. As one TL noted, “I see where my project fits in into whole organizational identity. And I know how my work now contributes and I feel valued” [TL Ontario 34.1]. Culture was seen as interconnected to improvement efforts and the organization’s strategic direction. “The biggest barrier [can be] culture. Without a positive culture it’s very difficult to push the [quality agenda] forward” [SL West 1.1]. Overall, culture of the organization (63.9%) was identified as one of the top facilitators to establishing/implementing QS teams; however, more TLs than SLs reported the culture of the organization as a barrier (35.4% vs. 19.1%, p<.001).
Team composition and processes
Survey respondents saw team composition, specifically a multidisciplinary team (66.7%), as facilitating QS team establishment/implementation. Several interviewees emphasized multidisciplinary QS teams as being more successful than those with representation from a single discipline. Others expanded to include members “[who] have the knowledge and skills” and frontline professionals “closest to the activity […] to have some skin in the game to be able to come up with the solutions” [SL West 4.1.0].
While not apparent in the interviews, survey results revealed that more TLs than SLs reported communication between team members (54.2% vs. 31.4%, p<.001) as a facilitator to establishing/implementing QI teams. “There has to be […] open lines of communication and they have to have that ability to communicate” [SL East 1.3.3]. Having clear and defined objectives for initiatives emerged as a facilitator more often for larger organizations (69.0%) than smaller organizations (40.4%, p=.005).
Discussion
Health systems face unparalleled pressure to improve the quality and performance of their organizations. QS teams are being used as a mechanism to assist organizations in meeting the goals of their quality agenda. In this study, our aim was to understand the barriers and facilitators that SLs and TLs faced in establishing/implementing and measuring the impact of QS team initiatives, and explore differences across the country. Themes that emerged in our data reflect the important contextual factors identified in the Model for Understanding Success in Quality (MUSIQ).31 Across Canada, there were several significant differences by region, organization size, and leader position.
Resources, in particular time and expertise, were fundamental to QS team initiatives. Given that SLs’ perspectives reflect the accountability of multiple teams and other competing organizational priorities, it is not surprising that significantly more SLs than TLs viewed lack of time as a barrier. In their study of Canadian SLs of quality improvement and performance, Price Waterhouse Coopers32 reported that a lack of capacity (ie, resources, skills) was a barrier to the success of quality improvement initiatives. Building QS capacity in QS teams requires targeted knowledge development and mentorship.33 Baker et al34 further highlight that investment in resources is the responsibility of individual organizations, and also a collective responsibility of governments at the local, provincial, and national level. To address resources, organizations need to consider the number of projects and collaborations within and outside the organization.
Similar to the recommendations of Curtis et al,35 data and IT support enabled QS teams. Nearly half of respondents indicated that data availability was a barrier, and many felt that it was difficult for teams to create a sense of urgency and share the impact of the initiative if data were unavailable or translated in a manner not understandable to the end user. As Ferlie and Shortell36 and others37,38 note, successful quality improvement work requires infrastructure (eg, data systems, communication channels). Creating effective quality improvement collaborative is dependent on development of measurable targets and the feasibility of accomplishing these targets.39 With organizational accountability for evidence of impact (ie, patient, provider, system outcomes), it is not unexpected that more SLs saw data availability as a barrier.
Across the organizational, team effectiveness, and quality improvement literature, leadership is central to creating and implementing changes required to advance the quality agenda of health care organizations.40–43 Taylor et al44 suggest that strengthening primary care and the larger health system requires the commitment of primary care leaders as well as leadership in regulatory bodies and government to provide resources to support development of skills and knowledge. Our participants clearly spoke to the necessity of leadership at various levels. Critical to this transformation are skilled leaders across the organization who can catalyze high performance by engaging and energizing people to strive for this fundamental goal. Fewer participants in the East reported board and senior leadership as a facilitator of QS teams. During the time of the study, major restructuring was occurring in several Eastern provinces, where both regionalization and leadership were shifting and unstable. In comparison, we suggest that Ontario’s Excellent Care for All Act45 guided organizational leaders in Ontario toward a clear commitment to quality in their own organization. This legislation has addressed how health care quality is defined, who is responsible and accountable for quality, how to support organizational capability to deliver quality of care, and how to make performance transparent to the public.
Quality improvement research has primarily focused on the role of physicians and SLs, and less work has included patient care managers at the operational level, who guide initiatives.46 In our research, fewer TLs than SLs saw supervisors or management as enablers of QS teams, which may be the result of the direct influence of microsystem leadership on the work of teams. Supporting this claim, the MUSIQ31 hypothesizes a close relationship from microsystem leadership to QS team leadership, representing how the capacity for and support and involvement in improvement efforts by microsystem leaders impacts QS teams. While interprofessional team membership was important, many participants indicated that teams were more successful when physicians were involved and when physicians were leaders. There is an increasing recognition of the need for, and training of, physicians to lead quality initiatives47–51 and emerging evidence that high-performing organizations benefit from physician leadership.37,52 Almost twice as many participants from larger organizations compared with smaller organizations saw the facilitative role of physician champions. Physician involvement could be related to a number of potential factors to be explored in future work: incentives for participation, availability/accessibility of physicians, usage of physician coleaders in hospital structures, and alignment of QS team initiatives with physician practice and interest.47
Advancing the quality agenda and organizational performance requires a vision set by SLs and the hospital board that makes the status quo uncomfortable, yet the future attainable.53 Interviewees spoke of the importance of a vision and strategic plan in creating a learning and QS culture. More TLs viewed culture as a barrier to their work; TLs are faced with the reality of either a positive or negative culture in implementing initiatives at the microsystem level. Mills and Weeks14 have found that QS teams that implement work aligned with organizational strategic priorities are more likely to be successful. Such alignment supports acquisition of resources and attention toward indicators and their measurement. In a study of 29 quality improvement teams, Versteeg et al54 found that those teams that had more favorable organization conditions (ie, executive sponsorship, resources, inspirational and skilled leaders, a local and organizational climate for change) also had more favorable patient outcomes. Similarly, Carter et al55 found that local and organizational context highly influenced success. For effective quality improvement, teams require supportive internal team structures and general organizational structure.17 In this study, the organizational plan was interconnected with culture. Leaders experience a tension between local, organizational, and provincial priorities. Accordingly, focusing and aligning projects with strategic priorities will help with this balance. Clinical managers can play a key role in creating a climate and developing structures such as QS huddle rounds to identify in care processes or organizational practices requiring further improvement.56
Like Santana et al’s study of successful quality improvement teams,11 participants in this study expressed the need for a “diverse(ly) skilled” team to develop and execute improvement projects. Specifically, successful teams were seen as interprofessional (including a diversity of clinical and business representation) with emphasis on the necessary involvement of physicians and frontline staff with content and end-user knowledge. While this study did not explore this in depth, other literature emphasizes additional team dimensions known to effect performance, such as skills that enhance team member interactions (ie, team processes).6,57,58 In their study of a quality improvement learning collaborative program in primary health care, Kotecha et al59 reported improvement in interdisciplinary team functioning, specifically a better understanding and respect of roles, improved communication, and team collaboration. The finding that more TLs viewed communication between members as enabling their QS team is not unexpected given that necessity of communication to complete the tasks of the initiative. More participants from large organizations reported the importance of clear QS team objectives, which may be due to a larger number of projects and additional complexity in their structures and processes.
Canadian health care organizations are striving for excellence and are utilizing QS teams as a means to meeting the goals of their quality agenda. It is apparent from our national study that there are more similarities than differences with respect to the barriers and facilitators faced by QS teams. Tremendous opportunity exists to create synergy across the country through streamlining quality initiatives, pooling expertise and resources, and developing collaboration across organizations and geographical regions. Work such as this could contribute to a structured yet shared approach to the improvement of QS. Furthermore, a physician quality network/consortium47 should be considered by boards and provincial governments. This type of initiative would support physician leadership in QS by identifying effective improvement strategies and sharing of common challenges, tools, resources, and quality improvement initiatives. We believe there is merit in the continued support and development of such initiatives.
Limitations
We acknowledge that this study was conducted in 2010, which limits the impact and relevance of study findings for leaders and policymakers. Nonetheless, our current work within Alberta’s health system suggests that many of the factors identified in this study remain pertinent today. Several other limitations must be noted in interpreting our descriptive study findings. First, the small, heterogeneous survey sample size limits transferability of results to other Canadian QS teams in hospitals. However, the response rate for CEOs was modest and similar to other online surveys in our population, and respondents and nonrespondents did not differ across several characteristics. The qualitative data from a large number of interviewees suggested divergent experiences with QS; some were just starting their quality journey, while others were further along. Second, the qualitative data analysis and interpretation is subject to researcher bias. However, a rigorous process to ensure credibility of the data was undertaken by the research team. Third, participants from two provinces were not included in the study, one due to refusal and the other due to feasibility of language translation. Finally, each respondent was treated as a separate data point, and we did not account for intra-organization variability.
Conclusion
This article describes contextual factors that act as facilitators and barriers to the work of Canadian QS teams. Further research that seeks to delineate the relationships among factors and QS team effectiveness will permit a more comprehensive understanding of the mechanism by which these contextual factors influence the success or lack of success of QS teams. Key recommendations for organizations include the following: (1) creating a strategic improvement culture that is visible within the local and organization’s structure and processes (ie, QS ambassadors; quality circles and celebrations) and empowers QS teams and microsystems; (2) establishing organizational and regulatory structures and processes supporting physicians as co-executive sponsors or co-leads of QS teams; (3) prioritizing and mapping QS team initiatives to the organization’s strategic directions, accountability framework, and business plan; (4) developing strong committed leaders and clinical champions who can access data and other resources, create a sense of urgency, and demonstrate changes from QS team initiatives; (5) attending to the potential impact of organization size and geographic spread across provinces on the work of QS teams; and (6) monitoring the fidelity of the multiple methods used by quality improvement teams to implement their improvement projects.
Acknowledgments
The authors acknowledge grant funding for the work from the Canadian Institutes of Health Research (PHE 85201) and Alberta Innovates-Health Solutions (200701285), and in-kind/and or cash contributions from Alberta Health Services, Canadian Patient Safety Institute, Faculty of Nursing (University of Calgary), Saskatoon Health Region, and Winnipeg Regional Health Authority. They would also like to acknowledge Karolina Zjadewicz and Halima Mohammed for assistance with the data analysis, and Drs. Sharon Straus and Jayna Holroyd-Leduc for their careful review of the manuscript. Results expressed in this report are those of the investigators and do not necessarily reflect the opinions or policies of Winnipeg Regional Health, Saskatoon Health Region, Alberta Health Services, or Canadian Patient Safety Institute.
Disclosure
The authors report no conflicts of interest in this work.
References
Powell AE, Rushmer RK, Davies HTO. A Systematic Narrative Review of Quality Improvement Models in Health Care. Edinburgh: NHS Quality Improvement Scotland; 2009. | ||
Denis JL, Davies HTO, Ferlie E, Fitzgerald L, McManus A. Assessing Initiatives to Transform Healthcare Systems: Lessons for the Canadian Healthcare System. Ottawa, ON: Canadian Health Services Research Foundation; 2011. | ||
Institute of Medicine. To Err is Human. Building a Safer Health System. Washington, DC: National Academy Press; 2000. | ||
Institute of Medicine. Crossing the Quality Chasm: A New Health System for the 21st Century. Washington, DC: National Academy of Sciences; 2001. | ||
Devers KJ, Pham HH, Liu G. What is driving hospitals’ patient-safety efforts? Health Aff (Millwood). 2004;23(2):103–115. | ||
Lemieux-Charles L, McGuire WL. What do we know about health care team effectiveness? A review of the literature. Med Care Res Rev. 2006;63(3):263–300. | ||
White DE, Straus SE, Stelfox HT, et al. What is the value and impact of quality and safety teams? A scoping review. Implement Sci. 2011;6:97. | ||
Akins RB. A process-centered tool for evaluating patient safety performance and guiding strategic improvement. In: Henriksen K, Battles JB, Marks ES, Lewin DI, editors. Advances in Patient Safety: From Research to Implementation (Volume 4: Programs, Tools, and Products). Rockville, MD: Agency for Healthcare Research and Quality; 2005;109–125. | ||
Ketring SP, White JP. Developing a systemwide approach to patient safety: the first year. Jt Comm J Qual Improv. 2002;28(6):287–295. | ||
Strating MM, Nieboer AP. Explaining variation in perceived team effectiveness: results from eleven quality improvement collaboratives. J Clin Nurs. 2013;22(11–12):1692–1706. | ||
Santana C, Curry LA, Nembhard IM, Berg DN, Bradley EH. Behaviors of successful interdisciplinary hospital quality improvement teams. J Hosp Med. 2011;6(9):501–506. | ||
Oandasan I, Baker GR, Barker K. Teamwork in Healthcare: Promoting Effective Teamwork in Healthcare in Canada. Policy Synthesis and Recommendations. Ottawa, ON: Canadian Health Services Research Foundation; 2006. | ||
Salas E, Rosen MA. Building high reliability teams: progress and some reflections on teamwork training. BMJ Qual Saf. 2013;22(5):369–373. | ||
Mills PD, Weeks WB. Characteristics of successful quality improvement teams: lessons from five collaborative projects in the VHA. Jt Comm J Qual Saf. 2004;30(3):152–162. | ||
Lynn J, Schall MW, Milne C, Nolan KM, Kabcenell A. Quality improvements in end of life care: insights from two collaboratives. Jt Comm J Qual Improv. 2000;26(5):254–267. | ||
Schouten LM, Hulscher ME, Akkermans R, van Everdingen JJ, Grol RP, Huijsman R. Factors that influence the stroke care team’s effectiveness in reducing the length of hospital stay. Stroke. 2008;39(9):2515–2521. | ||
Matthaeus-Kraemer CT, Thomas-Rueddel DO, Schwarzkopf D, et al. Barriers and supportive conditions to improve quality of care for critically ill patients: a team approach to quality improvement. J Crit Care. 2015;30(4):685–691. | ||
Shaw EK, Ohman-Strickland PA, Piasecki A, et al. Effects of facilitated team meetings and learning collaboratives on colorectal cancer screening rates in primary care practices: a cluster randomized trial. Ann Fam Med. 2013;11(3):220–228, S1–S8. | ||
West MA, Hirst G, Richter A, Shipton H. Twelve steps to heaven: successfully managing change through developing innovative teams. Eur J Work Organ Psychol. 2004;13(2):269–299. | ||
Creswell JW, Plano Clark VL, Gutmann ML, Hanson WE. Advanced mixed methods research designs. In: Tashakkori A, Teddlie C, editors. Handbook of Mixed Methods in the Behavioral and Social Sciences. Thousand Oaks, CA: Sage; 2003:209–240. | ||
Leech NL, Onwuegbuzie AJ. Guidelines for conducting and reporting mixed research in the field of counseling and beyond. J Couns Dev. 2010;88:61–69. | ||
Bazeley P. Issues in mixing qualitative and quantitative approaches to research. In: Buber R, Gadner J, Richards L, editors. Applying Qualitative Methods to Marketing Management Research. Palgrave: Macmillan; 2004:141–56. | ||
Canadian Healthcare Association. Guide to Canadian Healthcare Facilities (2007–2008). Vol. 15. Ottawa, ON: Canadian Healthcare Association Press; 2007. | ||
Canadian Institute for Health Information. Canadian MIS database: hospital beds staffed and in operation, fiscal year 2007–2008. Available from: http://publications.gc.ca/collections/collection_2012/icis-cihi/H115-17-1-2009-eng.pdf. Accessed October 10, 2009. | ||
Dillman DA, Smyth JD, Christian LM. Internet, Mail, and Mixed-Mode Surveys: The Tailored Design Method. Hoboken, NJ: John Wiley & Sons; 2008. | ||
Accreditation Canada. Canadian Health Accreditation Report: Required Organizational Practices: Emerging Risks, Focused Improvements. Ottawa, ON: Accreditation Canada; 2012. | ||
Lincoln Y, Guba E. Naturalistic Inquiry. Beverly Hills, CA: Sage; 1985. | ||
Miles MB, Huberman AM. Qualitative Data Analysis: An Expanded Sourcebook. 2nd ed. Thousand Oaks, CA: Sage; 1994. | ||
Braun V, Clarke V. Using thematic analysis in psychology. Qual Res Psychol. 2006;3(2):77–101. | ||
Boeije H. A purposeful approach to the constant comparative method in the analysis of qualitative interviews. Qual Quantity. 2002;36(4):391–409. | ||
Kaplan HC, Provost LP, Froehle CM, Margolis PA. The Model for Understanding Success in Quality (MUSIQ): building a theory of context in healthcare quality improvement. BMJ Qual Saf. 2012;21(1):13–20. | ||
Price Waterhouse Coopers. National Health Leadership Survey on Performance and Quality Improvement. Ottawa, ON: Canadian Health Services Research Foundation; 2011. | ||
Massoud MR, Nielsen GA, Nolan K, Schall MW, Sevin C. A Framework for Spread: From Local Improvements to System-Wide Change. Cambridge, MA: Institute for Healthcare Improvement; 2006. | ||
Baker GR, Denis JL, Pomey MP, MacIntosh-Murray A. Effective Governance for Quality and Patient Safety in Canadian Healthcare Organizations. Ottawa, ON: Canadian Health Services Research Foundation, Canadian Patient Safety Institute; 2010. | ||
Curtis JR, Cook DJ, Wall RJ, et al. Intensive care unit quality improvement: a “how-to” guide for the interdisciplinary team. Crit Care Med. 2006;34(1):211–288. | ||
Ferlie E, Shortell SM. Improving the quality of health care in the United Kingdom and the United States: a framework for change. Milbank Q. 2001;79(2):281–315. | ||
Baker GR, MacIntosh-Murray A, Porcellato C, Dionne L, Stelmacovich K, Born K. Delivering Quality by Design: An Examination of Leadership Strategies, Organizational Processes and Investments Made to Create and Sustain Improvement in Healthcare. Toronto, ON: Longwoods; 2008. | ||
MacIntosh-Murray A, Choo CW. Information behavior in the context of improving patient safety. J Am Soc Inf Sci Technol. 2005;56(12):1332–1345. | ||
Strating MMH, Nieboer AP, Zuiderent-Jerak T, Bal RA. Creating effective quality-improvement collaboratives: a multiple case study. BMJ Qual Saf. 2011;20(4):344–350. | ||
Baker DP, Day R, Salas E. Teamwork as an essential component of high-reliability organizations. Health Serv Res. 2006;41(4 Pt 2):1576–1598. | ||
Mohr JJ, Abelson HT, Barach P. Creating effective leadership for improving patient safety. Qual Manag Health Care. 2002;11(1):69–78. | ||
Sullivan T, Denis JL, editors. Building Better Health Care Leadership for Canada: Implementing Evidence. Montreal, QC: McGill-Queens University Press; 2011. | ||
White DE, Jackson K, Norris JM. Leadership, a central ingredient for a successful quality agenda: a qualitative study of Canadian leaders’ perspectives. Healthc Q. 2013;16(1):62–67. | ||
Taylor E, Genevro J, Peikes D, Geonnotti K, Wang W, Meyers D. Building Quality Improvement Capacity in Primary Care: Supports and Resources. Rockville, MD: Agency for Healthcare Research and Quality; 2013. | ||
Ontario Ministry of Health and Long-Term Care. About the Excellent Care for All Act. Available from: http://www.health.gov.on.ca/en/pro/programs/ecfa/legislation/act.aspx. Accessed May 21, 2014. | ||
Birken SA, Lee SYD, Weiner BJ. Uncovering middle managers’ role in healthcare innovation implementation. Implement Sci. 2012;7:28. | ||
Hayes C, Yousefi V, Wallington T, Ginzburg A. Case study of physician leaders in quality and patient safety, and the development of a physician leadership network. Healthc Q. 2010;13:68–73. | ||
Reinertsen JL, Gosfield AG, Rupp W, Whittington JW. Engaging Physicians in a Shared Quality Agenda. Cambridge, MA: Institute for Healthcare Improvement; 2007. | ||
Reinertsen JL, Bisognano M, Pugh MD. Seven Leadership Leverage Points for Organization-Level Improvement in Health Care. Cambridge, MA: Institute for Healthcare Improvement; 2005. | ||
Patel N, Brennan PJ, Metlay J, Bellini L, Shannon RP, Myers JS. Building the pipeline: the creation of a residency training pathway for future physician leaders in health care quality. Acad Med. 2015;90(2):185–190. | ||
Gupta R, Arora VM. Merging the health system and education silos to better educate future physicians. JAMA. 2015;314(22):2349–2350. | ||
Pronovost PJ, Miller MR, Wachter RM, Meyer GS. Perspective: physician leadership in quality. Acad Med. 2009;84(12):1651–1656. | ||
Heath C, Heath D. Switch: How to Change Things When Change Is Hard. New York, NY: Crown Business; 2010. | ||
Versteeg MH, Laurant MG, Franx GC, Jacobs AJ, Wensing MJ. Factors associated with the impact of quality improvement collaboratives in mental healthcare: an exploratory study. Implement Sci. 2012;7:1. | ||
Carter P, Ozieranski P, McNicol S, Power M, Dixon-Woods M. How collaborative are quality improvement collaboratives: a qualitative study in stroke care. Implement Sci. 2014;9(1):32. | ||
Pannick S, Sevdalis N, Athanasiou T. Beyond clinical engagement: a pragmatic model for quality improvement interventions, aligning clinical and managerial priorities. BMJ Qual Saf. 2016;25(9):716–725. | ||
Mathieu J, Maynard MT, Rapp T, Gilson L. Team effectiveness 1997-2007: a review of recent advancements and glimpse into the future. J Manag. 2008;34(3):410–476. | ||
Marks MA, Mathieu JE, Zaccaro SJ. A temporally based framework and taxonomy of team processes. Acad Manage Rev. 2001;26(3):356–76. | ||
Kotecha J, Brown JB, Han H, et al. Influence of a quality improvement learning collaborative program on team functioning in primary healthcare. Fam Syst Health. 2015;33(3):222–230. |
 © 2016 The Author(s). This work is published and licensed by Dove Medical Press Limited. The full terms of this license are available at https://www.dovepress.com/terms.php and incorporate the Creative Commons Attribution - Non Commercial (unported, v3.0) License.
By accessing the work you hereby accept the Terms. Non-commercial uses of the work are permitted without any further permission from Dove Medical Press Limited, provided the work is properly attributed. For permission for commercial use of this work, please see paragraphs 4.2 and 5 of our Terms.
© 2016 The Author(s). This work is published and licensed by Dove Medical Press Limited. The full terms of this license are available at https://www.dovepress.com/terms.php and incorporate the Creative Commons Attribution - Non Commercial (unported, v3.0) License.
By accessing the work you hereby accept the Terms. Non-commercial uses of the work are permitted without any further permission from Dove Medical Press Limited, provided the work is properly attributed. For permission for commercial use of this work, please see paragraphs 4.2 and 5 of our Terms.