")
Back to Journals » International Journal of Nanomedicine » Volume 12
Autophagy promotes degradation of polyethyleneimine–alginate nanoparticles in endothelial progenitor cells
Authors Wang GD, Tan YZ, Wang HJ, Zhou P
Received 11 May 2017
Accepted for publication 7 July 2017
Published 7 September 2017 Volume 2017:12 Pages 6661—6675
DOI https://doi.org/10.2147/IJN.S141592
Checked for plagiarism Yes
Review by Single anonymous peer review
Peer reviewer comments 2
Editor who approved publication: Professor Lei Yang
Video abstract presented by Guo-dong Wang
Views: 662
Guo-dong Wang, Yu-zhen Tan, Hai-jie Wang, Pei Zhou
Department of Anatomy, Histology and Embryology, Shanghai Medical School of Fudan University, Shanghai, China
Abstract: Polyethyleneimine (PEI)–alginate (Alg) nanoparticle (NP) is a safe and effective vector for delivery of siRNA or DNA. Recent studies suggest that autophagy is related to cytotoxicity of PEI NPs. However, contribution of autophagy to degradation of PEI–Alg NPs remains unknown. CD34+VEGFR-3+ endothelial progenitor cells isolated from rat bone marrow were treated with 25 kDa branched PEI modified by Alg. After treatment with the NPs, morphological changes and distribution of the NPs in the cells were examined with scanning and transmission electron microscopies. Cytotoxicity of the NPs was analyzed by reactive oxygen species (ROS) production, lactate dehydrogenase leakage and induction of apoptosis. The level of autophagy was assessed with expression of Beclin-1 and LC3 and formation of autophagic structures and amphisomes. Colocalization of LC3-positive puncta and the NPs was determined by LC3–GFP tracing. Cytotoxicity of PEI NPs was reduced greatly after modification with Alg. PEI–Alg NPs were distributed in mitochondria, rough endoplasmic reticula and nuclei as well as cytoplasm. After phagocytosis of the NPs, expression of Beclin-1 mRNA and LC3 protein was upregulated, and the number of LC3-positive puncta, autophagic structures and amphisomes increased significantly. The number of lysosomes also increased obviously. There were LC3-positive puncta in nuclei, and some puncta were colocalized with the NPs. These results demonstrate that the activated autophagy promotes degradation of PEI–Alg NPs via multiple pathways.
Keywords: polyethyleneimine, alginate, nanoparticles, endothelial progenitor cells, autophagy
Introduction
Current delivery capabilities centered around nucleic acid delivery have already yielded dramatic progress with pDNA and mRNA for gene expression and siRNA and miRNA for gene silencing.1 The key therapeutic advantage of siRNA lies in its ability to specifically and potently knock down the expression of disease-causing genes of known sequence,2 while nanoparticles (NPs) hold promise for the safe and effective intracellular delivery of siRNA.3
Polyethyleneimine (PEI) is one of the most effective and widely used cationic vectors for siRNA or DNA delivery.4,5 PEI can spontaneously adhere to and condense siRNA to form toroidal complexes. Compared with the linear PEI, the branched PEI is more effective in delivering siRNA. PEI contains primary, secondary and tertiary amino groups in a 1:2:1 ratio. Third atom of the polymeric backbone is an amino nitrogen that may undergo protonation. As the polymer contains repeating units of ethylamine, PEI is water soluble. PEI–siRNA NPs carrying a net positive surface charge can interact with the negatively charged cell membrane and are readily endocytosed by cells. However, cationic PEI NPs may induce cytotoxicity.6 Cellular internalization of PEI may trigger a two-stage cytotoxicity with an early necrotic cell damage and a later apoptotic cell death.7 By modification with alginate (Alg), cytotoxicity of PEI (25 kDa)–Alg (4.8%) NPs is almost negligible.8 Cytotoxicity of PEI–Alg NPs is lower than PEI NPs in delivering siRNA.9 Alg is considered to be biocompatible, nontoxic, nonthrombogenic and nonimmunogenic and is approved by the US Food and Drug Administration for various medical applications.10 As a linear anionic polysaccharide, Alg can reduce PEI toxicity by neutralizing positive charge of PEI and therefore suppress PEI cytotoxicity.8,9 However, potential cytotoxicity of PEI–Alg NPs is poorly understood.
In recent years, more and more attention is focused on association of cellular autophagy with cytotoxicity of polymeric NPs.11 Autophagy is an evolutionarily conserved process that through degradation of cytoplasmic material supports cell preservation in response to various forms of stress. Autophagy may be divided into macroautophagy, microautophagy and chaperone-mediated autophagy based on the pathways by which cargos are delivered into lysosomes. Macroautophagy (hereafter referred to as autophagy) proceeds through several phases, including formation of autophagosome precursor, autophagosome maturation and cargo sequestration and autophagosome–lysosome fusion. In the autolysosome, autophagosomal cargoes are degraded for metabolic recycling.12 Cytotoxicity of polymeric nanovectors may be related to an activation of autophagy.13 Phagocytosis of 25 kDa branched PEI induces autophagy of the treated cells. PEI-induced autophagy plays a protective role in cell survival.14,15 However, effects of autophagy on PEI degradation remain unknown.
This investigation was designed to examine toxicity of Alg-modified 25 kDa branched PEI NPs to bone marrow-derived lymphatic endothelial progenitor cells (LEPCs) and to evaluate the effects of autophagy on degradation of PEI–Alg NPs. Here, we demonstrated that PEI–Alg NPs are distributed in mitochondria, rough endoplasmic reticula (rERs) and nuclei, and cytotoxicity of PEI–Alg NPs is mild compared with that of PEI NPs. Autophagy is involved in the degradation of PEI–Alg NPs. Moreover, nuclear microtubule-associated protein 1 light chain 3 (LC3) is recruited onto the fragments of the NPs. This study suggests that PEI–Alg NP-induced autophagy enhances degradation of the NPs via multiple pathways.
Materials and methods
Isolation of endothelial progenitor cells (EPCs)
Bone marrow of the femurs and tibias of Sprague Dawley (SD) rats (30–50 g) were harvested by washing with PBS supplemented with 5 mM ethylenediaminetetraacetic acid (EDTA). The protocol followed the National Research Council’s Guide for the Care and Use of Laboratory Animals (USA) and was approved by the Institutional Animal Care Committee of Fudan University. The lavage of the bone marrow cells was resuspended in Dulbecco’s Modified Eagle’s Medium (DMEM; Thermo Fisher Scientific, Waltham, MA, USA), and the mononuclear cells were isolated with Percoll solution (Amersham Pharmacia Biotech, Uppsala, Sweden) using gradient centrifugation. The cells were suspended in DMEM supplemented with 15% fetal bovine serum (FBS; Thermo Fisher Scientific), 100 U/mL penicillin, 100 μg/mL streptomycin and 50 ng/mL vascular endothelial growth factor-C (VEGF-C; PeproTech, Rocky Hill, NJ, USA) and then seeded in 35 mm dish at a density of 1×10⁶ cells/mL. After incubation for 24 h, the nonattached cells were transferred into another dish precoated with gelatin (Sigma-Aldrich Co., St Louis, MO, USA) to be incubated for 3 days.
For sorting EPCs, the cells were harvested with digestion in 0.25% trypsin–EDTA (Thermo Fisher Scientific) and then suspended with PBS containing 1% bovine serum albumin (Amresco, Solon, OH, USA). After centrifugation, the cells were incubated with mouse anti-rat CD34 antibody (1:200; Santa Cruz Biotechnology Inc., Dallas, TX, USA) and rabbit anti-rat vascular endothelial growth factor receptor-3 (VEGFR-3) antibody (1:100; Santa Cruz Biotechnology Inc.) at 4°C for 50 min. Following washing with PBS, the cells were incubated with Alexa 647-labelled goat anti-mouse IgG and Alexa 488-labeled goat anti-rabbit IgG (Jackson ImmunoResearch Laboratories, Inc., West Grove, PA, USA) at 4°C for 30 min. After washing, the cells were resuspended in DMEM supplemented with 2.5% FBS. CD34+VEGFR-3+ cells were sorted using a fluorescence-activated cell sortor (Beckman Coulter, Fullerton, CA, USA). Expression of CD34 and VEGFR-3 on the sorted cells was examined with a confocal laser scanning microscope (Leica Microsystems, Wetzlar, Germany). Differentiation of the cells toward lymphatic endothelial cells was identified with 5′-nucleotidase (5′-Nase) and lymphatic vessel endothelial hyaluronan receptor-1 (LYVE-1) immunostaining as previously described.16
Formulation of PEI and PEI–Alg NPs
PEI NPs were prepared by adding 25 kDa branched PEI (Sigma-Aldrich Co.) to the deionized water and heating to 90°C. PEI–Alg NPs were fabricated as described in our previous study.9 Briefly, PEI and Alg (Sigma-Aldrich Co.) were dissolved in the heated distilled water (90°C), and then, the solutions were filtered with a syringe filter (0.22 μm; EMD Millipore, Billerica, MA, USA). PEI–Alg NPs were formulated by adding the Alg solution (4.8%) to PEI solution. The mixed solution was incubated for 30 min at room temperature and then stored at 4°C before use. The hydrodynamic size and zeta potential of PEI and PEI–Alg NPs were detected with a Zetasizer Nano ZS90 (Malvern Instruments, Worcestershire, UK).
Analysis of siRNA loading efficiency
To evaluate siRNA loading efficiency, gel electrophoresis was performed. The different amounts of PEI–Alg NPs were mixed with 1 μL of FAM–siRNA (sense: 5′-UUCUCCGAACGUGUCACGUTT-3′; antisense: 5′-ACGUGACACGUUCGGAGAATT-3′) (GenePharma, Shanghai, China) and incubated for 30 min at room temperature to generate PEI–Alg/FAM–siRNA at different nitrogen/phosphorus (N/P) ratios. All the mixtures were loaded in the wells of 1% (w/v) agarose gel (Biowest, Shanghai, China) and electrophoresed at 100 V for 20 min, stained with ethidium bromide (EB) and visualized on a FR-980A Gel Documentation System (Furi Technology, Shanghai, China). For evaluating efficiency of delivering siRNA with PEI–Alg NPs, transfection of PEI–Alg/FAM–siRNA to LEPCs was examined with a fluorescence microscope (Olympus Corporation, Tokyo, Japan).
Scanning electron microscopy
The cells were seeded on cover slips and incubated for 24 h. Then, the cells were treated with PEI NP solution (21.8 μL) or PEI–Alg NP solution (32.8 μL) for 4 h. After rinsing with PBS for three times, the cells were fixed overnight in 3% glutaraldehyde and dehydrated using an ethanol gradient, 15 min per step. Following drying in vacuum, the cells were coated with platinum. Uptake of NPs by the cells was examined using a scanning electron microscope (Hitachi Ltd., Tokyo, Japan).
Transmission electron microscopy
After treatment with PEI or PEI–Alg NPs for 4 or 12 h, the cells were fixed overnight in 3% glutaraldehyde and postfixed in 1% osmic acid for 2 h. Subsequently, a series of dehydration was performed. The cells were embedded in epoxy resin. The ultrathin sections were made by an ultramicrotome. After being stained with lead citrate and uranyl acetate, the distribution of NPs, autophagic structures and amphisomes was examined using a transmission electron microscope (Philips Electronic Instruments, Mahwah, NJ, USA). The cross-section areas of autophagosome precursors, autophagosomes and autolysosomes were measured with VLCDS image analyzer (Leica) in 200 cells for each group. Ratios of the cross-section areas of the autophagic structures to those of the cytoplasm were calculated.
Labeling of lysosomes
The cells were treated with Alexa Fluor 568 N-hydroxysuccinimide (NHS) Ester (Thermo Fisher)-labeled PEI–Alg NPs for 4 h at 37°C. After washing with PBS, the cells were incubated with 50 nM LysoTracker Green DND-26 (Thermo Fisher Scientific) for 30 min. Then, the cells were washed with ice-cold PBS for three times. Lysosomes were viewed and counted, and colocalization of lysosomes and NPs was examined with a fluorescent microscopy.
Detection of reactive oxygen species (ROS) production
Production of ROS was determined using an ROS assay kit (Beyotime, Jiangsu, China). After treatment with PEI or PEI–Alg NPs for 4 h, the cells were collected and resuspended with 2′,7′-dichlorofluorescein diacetate (diluted in serum-free medium, 10 μM). After incubation for 30 min, the cells were washed twice with PBS to remove the probe out of the cells. Fluorescence intensities of the cells at excitation and emission wavelengths of 488 and 525 nm were determined using NanoQuant Infinite M200 plate reader (Tecan, Männedorf, Switzerland).
Lactate dehydrogenase (LDH) leakage assay
Disruption of cell membrane after treatment with PEI and PEI–Alg NPs was evaluated by LDH release assay. LDH leakage is regarded as an index for the loss of membrane integrity. The cells were seeded in a 96-well plate and treated with the NPs for 4 h. After centrifugation (400 g, 5 min), LDH in the supernatant was assessed by LDH Detection Kit (Beyotime). Absorbance of all samples was recorded with a microplate reader (Tecan) at a wavelength of 490 nm. Each sample was assayed in triplicate for three independent experiments.
Apoptosis assay
Apoptosis of the cells phagocytosing PEI or PEI–Alg NPs was analyzed with flow cytometry (FACSCalibur; BD, Heidelberg, Germany). At 4 and 12 h after treatment with NPs, the cells were stained with Annexin V-FITC Apoptosis Detection Kit (BD Biosciences, San Jose, CA, USA) according to manufacturer’s protocol. Moreover, the apoptotic cells were stained with ethidium bromide (EB) and acridine orange (AO) and then counted using a fluorescence microscope. The percentages of viable, early apoptotic, late apoptotic and necrotic cells were calculated respectively by the following formula: percent (%) = number of viable, early apoptotic, late apoptotic cells/number of all counted cells. The experiment was repeated thrice.
Reverse transcription polymerase chain reaction (RT-PCR) analysis
Expression of VEGFR-3 mRNA on the differentiated cells and Beclin-1 mRNA in the cells after engulfment of PEI or PEI–Alg NPs was analyzed with RT-PCR. Total RNA was extracted using TRIzol (Thermo Fisher Scientific) and reverse transcribed using PrimeScript RT Reagent Kit (Takara, Tokyo, Japan). PCRs were performed using two times Takara PCR Master Mix (Takara) under the following conditions: 95°C for 5 min, followed by 35 cycles for 30 s of denaturation at 94°C, 30 s of annealing at 57°C and 50 s of extension at 72°C and one cycle at 72°C for 10 min. PCR products were confirmed on 2% agarose gels and visualized under ultraviolet (UV) light after EB staining. Sequences of VEGFR-3 primer pairs were as follows: forward, 5′-CTGAGGCAGAATATCAGTCTGGAG-3′ and reverse, 5′-AGATGCTCATACGTGTAGTTGTCC-3′. Sequences of Beclin-1 primers were as follows: forward, 5′-GCGGCTCCTATTCCATCAA-3′ and reverse, 5′-AACTACGGCAGGGCTCTT-3′. Sequences of the β-actin primers were as follows: forward, 5′-GAGAGGGAAATCGTGCGTGAC-3′ and reverse, 5′-CATCTGCTGGAAGGTGGACA-3′. Beclin-1, a phylogenetically conserved protein, is regarded as a specific autophagic gene.17 The relative expression of Beclin-1 was compared to the expression of β-actin and normalized to the untreated cells as a control.
Western blot
LC3 is expressed mainly on autophagosome and used as a specific marker for autophagic structures.18 The cells were lysed in cold lysis buffer containing 1% phenylmethylsulfonyl fluoride (PMSF; 0.5 mM) for 20 min. Cell lysates were centrifuged (12,000 g, 15 min) at 4°C. The supernatant was collected, and protein concentration was estimated using bicinchoninic acid assay (Beyotime). Equal amounts of 40 μg of lysate proteins were loaded onto 12% sodium dodecyl sulfate–polyacrylamide gels (Bio-Rad Laboratories Inc., Hercules, CA, USA) and electrophoretically transferred to polyvinylidene fluoride membrane (EMD Millipore, Billerica, MA, USA). After blocking with 5% skimmed milk in Tris-buffered saline and Tween 20 (TBST) for 1 h, the membrane was incubated with rabbit anti-rat LC3 (1:500; Novus Biologicals, Littleton, CO, USA) and β-actin (1:1,000; Proteintech, Chicago, IL, USA) antibodies overnight at 4°C. After washing with TBST, the membrane was incubated with HRP-conjugated secondary antibodies (1:5,000; Cell Signaling, Frankfurt, Germany) for 2 h at room temperature. The membrane was then incubated with enhanced chemiluminescence reagent (Bio-Rad Laboratories Inc.) solution for 3 min. Visualization of the immunolabelled bands was carried out by a Bio-Rad’s ChemiDoc System (Bio-Rad Laboratories Inc.). The densitometric analysis of expression LC3-I and LC3-II was performed using the Image Lab Software (Bio-Rad Laboratories Inc.).
Immunostaining
After treatment with PEI or PEI–Alg NPs for 4 h, the cells were fixed with 4% formaldehyde for 10 min and then permeabilized with 0.2% Triton X-100 for 5 min. After blocked with goat serum for 30 min, the cells were incubated with rabbit anti-rat Beclin-1 polyclonal antibody (1:100; Abcam, Cambridge, MA, USA) overnight at 4°C. Following washing with PBS, the cells were incubated with Alexa 488-conjugated goat anti-rabbit IgG (1:200) for 30 min at 37°C. The nuclei were stained with 4′,6-diamidino-2-phenylindole (DAPI; 1:1,000; Sigma-Aldrich Co.) for 10 min. Beclin-1 expression was examined using a fluorescent microscope.
For assessing LC3 expression on autophagic structures, the cells treated with PEI or PEI–Alg NPs for 4 h were incubated with rabbit anti-rat LC3 antibody (1:50) overnight at 4°C. Then, the cells were incubated with Alexa 488-conjugated goat anti-rabbit IgG (1:200) for 1 h at room temperature. LC3-positive puncta were viewed with confocal laser scanning microscope and counted in 100× fields (five sequential fields, averaged per coverslip) for three coverslips. To determine colocalization of LC3-positive puncta and PEI–Alg NPs, the cells were treated with NPs labeled with Alexa Fluor 568 NHS Ester for 4 h. After fixation with 4% paraformaldehyde for 15 min, the cells were incubated with 0.3% Triton X-100 for 5 min.
LC3–GFP transfection
The cells were transfected with lentivirus expressing LC3–GFP (multiplicities of infection: 60; Hanbio, Shanghai, China) according to the manufacturer’s protocol and continued to be incubated for 72 h. After PEI–Alg NPs labeled with Alex Fluor 568 NHS Ester were added to the medium, the cells were incubated for 4 h. Then, the cells were stained with DNA-specific fluorescent Hoechst 33342 for 30 min. Distribution and colocalization of PEI–Alg NPs and LC3-positive puncta were examined using confocal laser scanning microscope with optical sectioning (depth was 0.1 μm).
Statistical analysis
Data of the experiments were presented as mean ± SD. Statistical assessment of significant variations was analyzed by GraphPad Prism 5 (GraphPad Software, Inc., La Jolla, CA, USA). Statistical analyses were performed using Student’s t-test for comparison of two groups or one-way analysis of variance (ANOVA) followed by Bonferroni post hoc test for multiple groups. p-values <0.05 were considered to be statistically significant.
Results
Characteristics of bone marrow-derived LEPCs
The result of fluorescence-activated cell sorting revealed that CD34+VEGFR-3+ cells were 2.64% in the mononuclear cells isolated from rat bone marrow (Figure 1A). In immunostaining, the cells co-expressed CD34 and VEGFR-3 (Figure 1B). The freshly sorted CD34+VEGFR-3+ cells were round or elliptic. At day 7 after induction with VEGF-C, the cells exhibited spindle-shaped morphology. At day 10 after induction, the cells grew into confluent monolayer displaying a typical cobblestone appearance like endothelial cells (Figure 1C). After induction for 2 weeks, the cells expressed VEGFR-3 mRNA (Figure 1D) and were positive for lymphatic endothelial cell makers 5′-Nase, VEGFR-3 and LYVE-1 (Figure 1E and F).
 | Figure 1 Differentiation of CD34+VEGFR-3+ cells toward lymphatic endothelial cells. |
Properties of PEI and PEI–Alg NPs
The size and surface charge of PEI NPs are 118.7±1.5 nm and 35.7±9.6 mV, respectively. Polydispersity index of PEI NPs is 0.18±0.01. Compared with PEI NPs, PEI–Alg NPs became larger (130.9±7.0 nm) and their surface charges decreased (24.4±4.7 mV; Figure 2A–D). Polydispersity index of PEI–Alg NPs is 0.39±0.09. Efficiency of siRNA loading in PEI–Alg NPs increased following increase of N/P ratio. It was desirable for siRNA loading that the N/P ratio of PEI-Alg/siRNA nanocomplexes was 32. There was no migrated siRNA band at the N/P ratio 32 (Figure 2E). siRNA delivered with PEI–Alg NPs could transfect the cells effectively (Figure 2F).
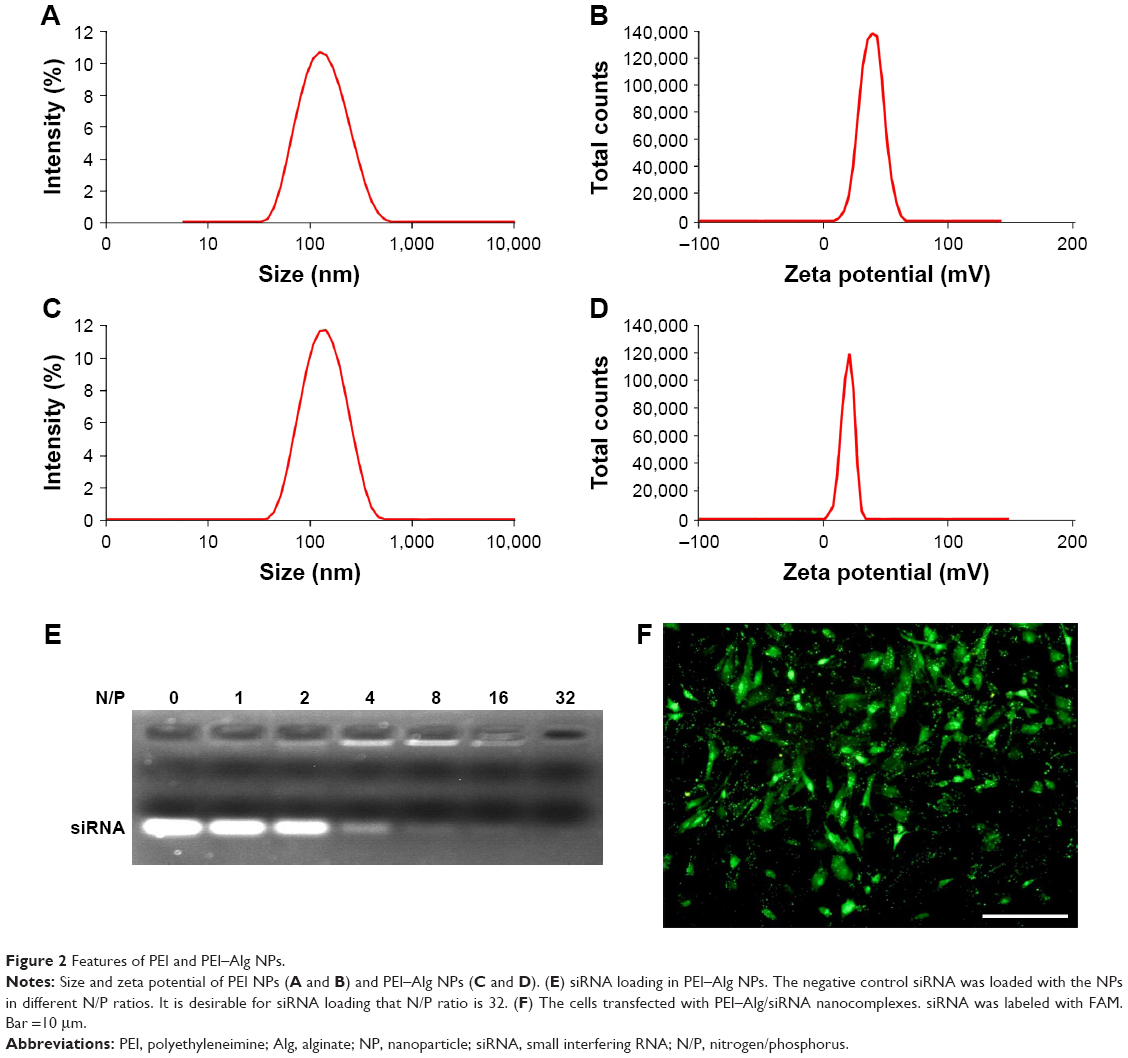 | Figure 2 Features of PEI and PEI–Alg NPs. |
Phagocytosis of PEI and PEI–Alg NPs
In images of scanning electron microscope, ~30% cells were broken after treatment with PEI NPs for 4 h. The membrane of the cells was smashed, the intracellular contents were lost and the network of cytoskeleton was left (Figure 3A). In the cells phagocytosing PEI–Alg NPs, cell membrane was integrated (Figure 3B). The membrane-disrupted cells were not observed. In images of transmission electron microscope, the membrane of some cells phagocytosing PEI NPs was disrupted severely. Cellular organelles were damaged; the cytoplasm became vacuolated (Figure 4A). In the cells phagocytosing PEI–Alg NPs, the phagosome containing NPs fused with lysosome in which the NPs were degraded into round fragments. Some lysosomes were broken; the fragments of NPs were released into cytoplasm (Figure 4B and C). The NP fragments in free state could be observed within rERs (Figure 4D), mitochondria (Figure 4E), nucleoplasm and nucleolus (Figure 4F). The size of the NP fragments in nucleoplasm and nucleolus was ~50 nm.
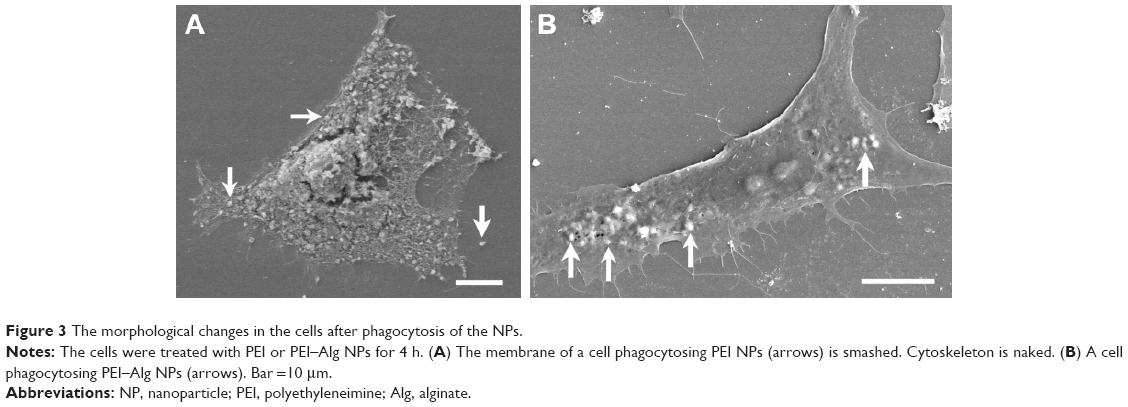 | Figure 3 The morphological changes in the cells after phagocytosis of the NPs. |
 | Figure 4 The distribution of the NPs within the cells. |
Apoptosis of the cells after treatment with PEI or PEI–Alg NPs
ROS production and LDH leakage of the cells increased after treatment with PEI or PEI–Alg NPs for 4 h. The levels of ROS and LDH in the PEI–Alg group were lower than those in the PEI group. In the levels of ROS, difference between the PEI–Alg group and control group was significant (Figure 5). In flow cytometric analysis and EB/AO staining, some cells became apoptotic after phagocytosis of PEI or PEI–Alg NPs for 4 h. Compared with the PEI group, the number of apoptotic cells in the PEI–Alg group was lesser significantly (Figure 6).
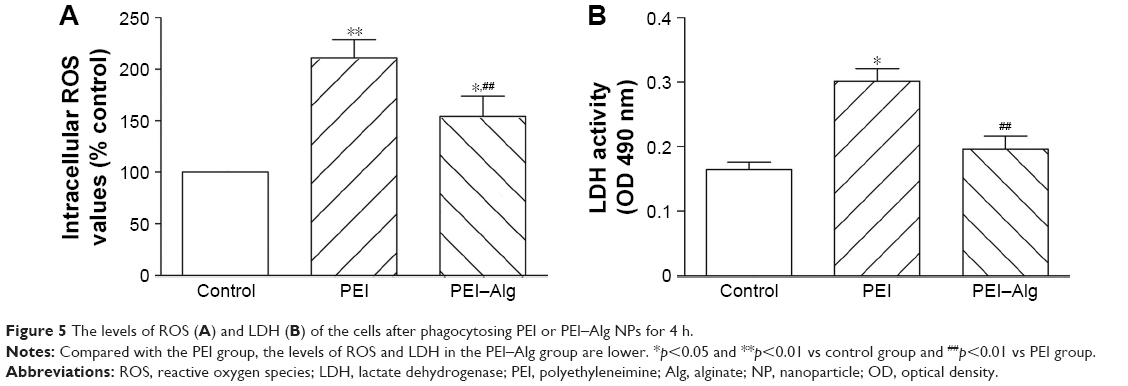 | Figure 5 The levels of ROS (A) and LDH (B) of the cells after phagocytosing PEI or PEI–Alg NPs for 4 h. |
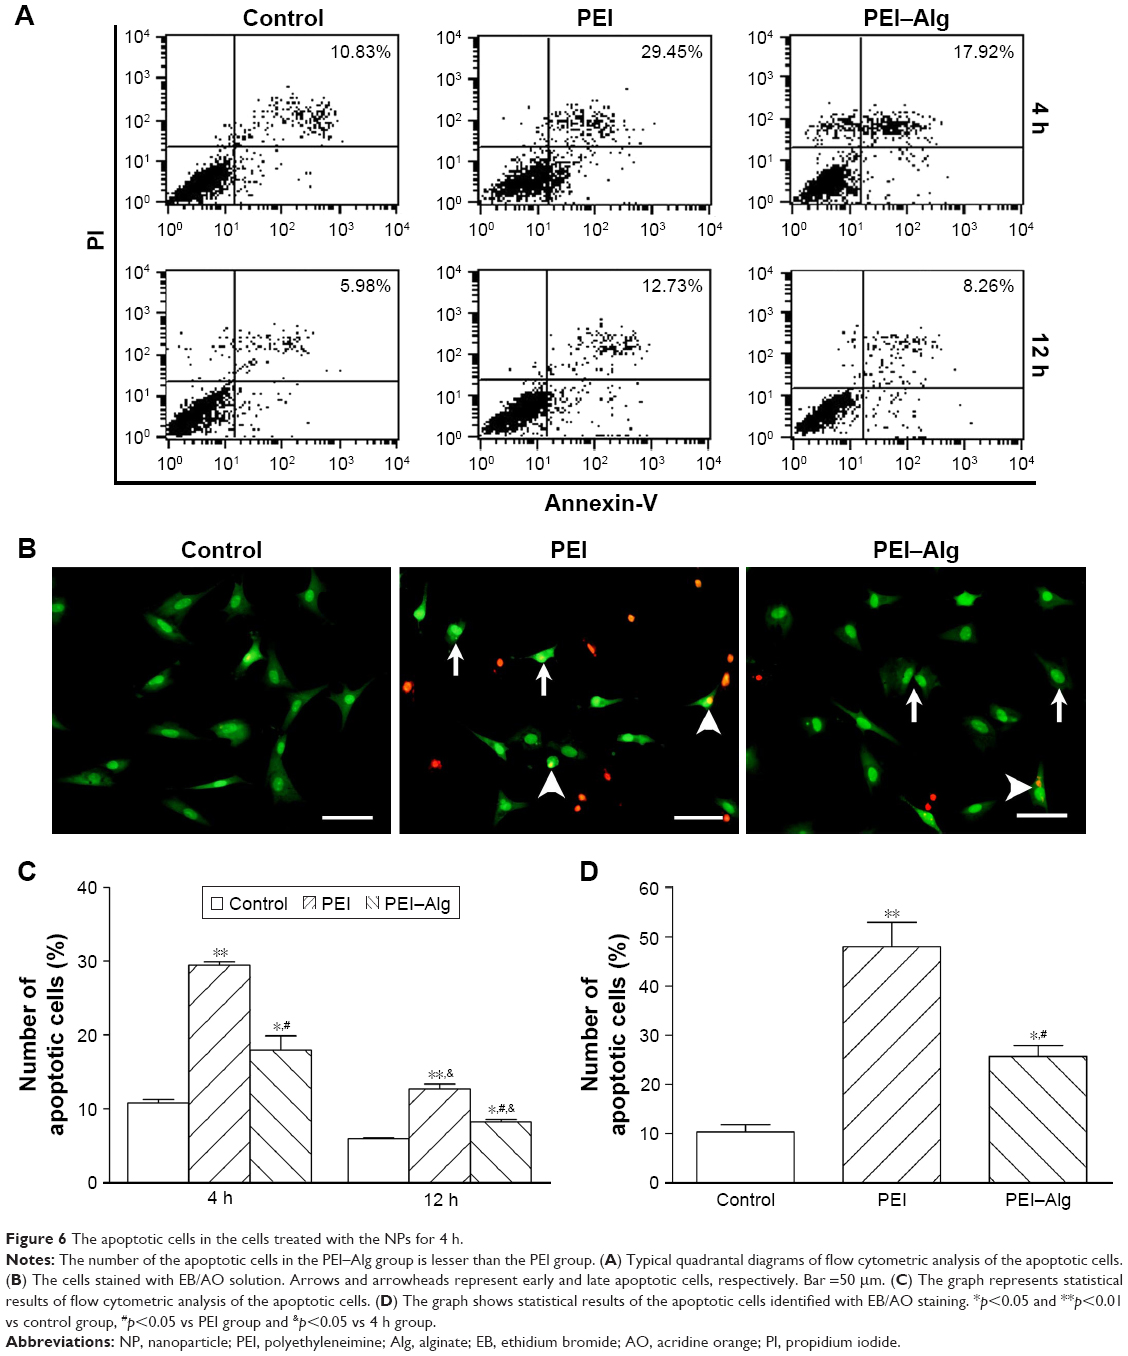 | Figure 6 The apoptotic cells in the cells treated with the NPs for 4 h. |
Increase in lysosomes after phagocytosis of PEI–Alg NPs
Compared with the control group (67.45±18.12), the number of lysosomes in the cells phagocytosing PEI–Alg NPs for 4 h was greater (139.80±23.21, p<0.05). Colocalization of many lysosomes with PEI–Alg NPs could be observed (Figure 7).
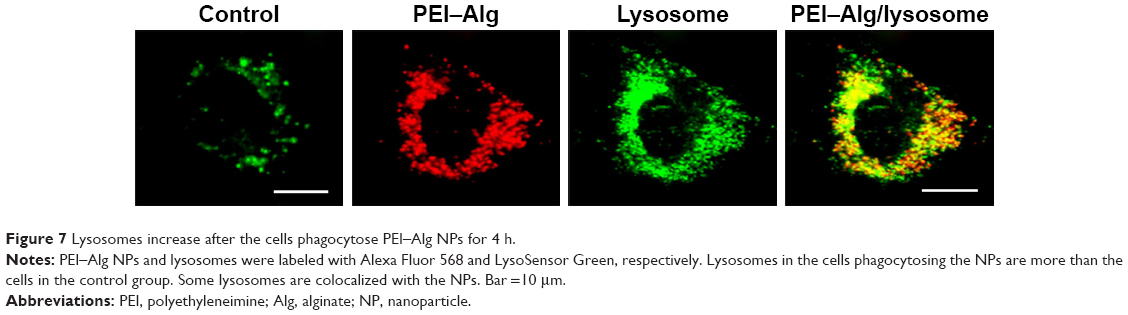 | Figure 7 Lysosomes increase after the cells phagocytose PEI–Alg NPs for 4 h. |
Increase in Beclin-1 and LC3 expression after phagocytosing PEI and PEI–Alg NPs
The results of RT-PCR analysis and immunostaining showed that expression of Beclin-1 increased after the cells phagocytosed PEI or PEI–Alg NPs (Figure 8A, B and F). Expression of Beclin-1 mRNA in the 12 h group was higher than that in the 4 h group. In the 12 h group, Beclin-1 expression in the cells phagocytosing PEI–Alg NPs was lower than that in the cells phagocytosing PEI NPs (Figure 8A and F). The level of LC3-II expression in the cells of the PEI group was higher than that in the control group. At 12 h after treatment, LC3-II expression in the PEI–Alg group was higher than that in control group and lower than that in the PEI group (Figure 8C and E). Autophagic structures labeled with LC3 immunostaining were round or oval. Compared with the control group, the number of LC3-positive puncta in the PEI and PEI–Alg groups was greater. LC3-positive puncta in the PEI–Alg group were less than that in the PEI group (Figure 8D and G).
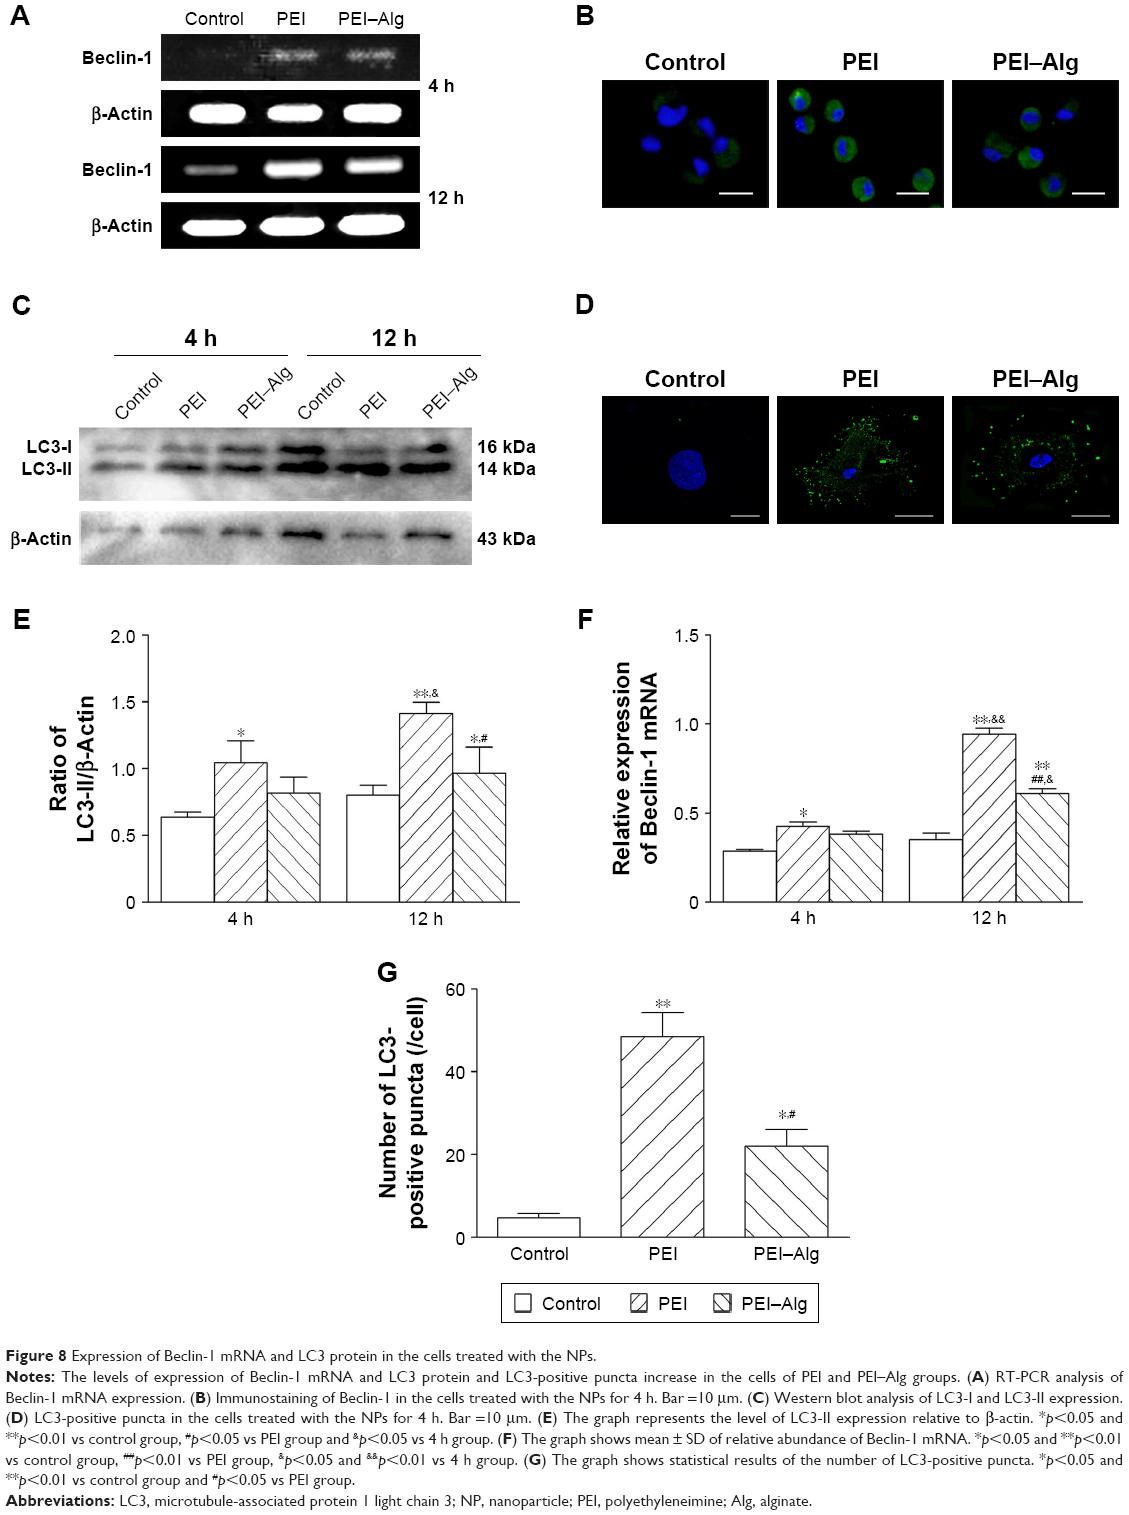 | Figure 8 Expression of Beclin-1 mRNA and LC3 protein in the cells treated with the NPs. |
Increase in autophagic ultrastructures after phagocytosis of PEI–Alg NPs
Representative autophagic ultrastructures in the cells phagocytosing PEI–Alg NPs are shown in Figure 9. After phagocytosis of the NPs, some mitochondria and rERs became swollen and even ruptured (Figure 9A, B and F). The autophagosome precursor wrapped NP fragments to form autophagosome (Figure 9D and E). The autophagosome with multilayer membranes was observed occasionally. The autolysosome contained one or more autophagosome that had single membrane. There were NP fragments and autophagosomes in most lysosomes (Figure 9B, F and H). Ratios of the cross-section areas of the autophagic structures to that of the cytoplasm were significantly higher in the 4 h group (11.51±3.52, p<0.05) than those in the control group (5.52±0.26). Difference in the ratios between the 4 h group and 12 h group (21.83±5.74, p<0.05) was significant. The NP fragments could enter endosomes (Figure 9C). The amphisome was formed by fusion of autophagosome with endosome or phagosome containing the NP fragments (Figure 10). The cells containing amphisomes were ~70% in the cells treated with NPs.
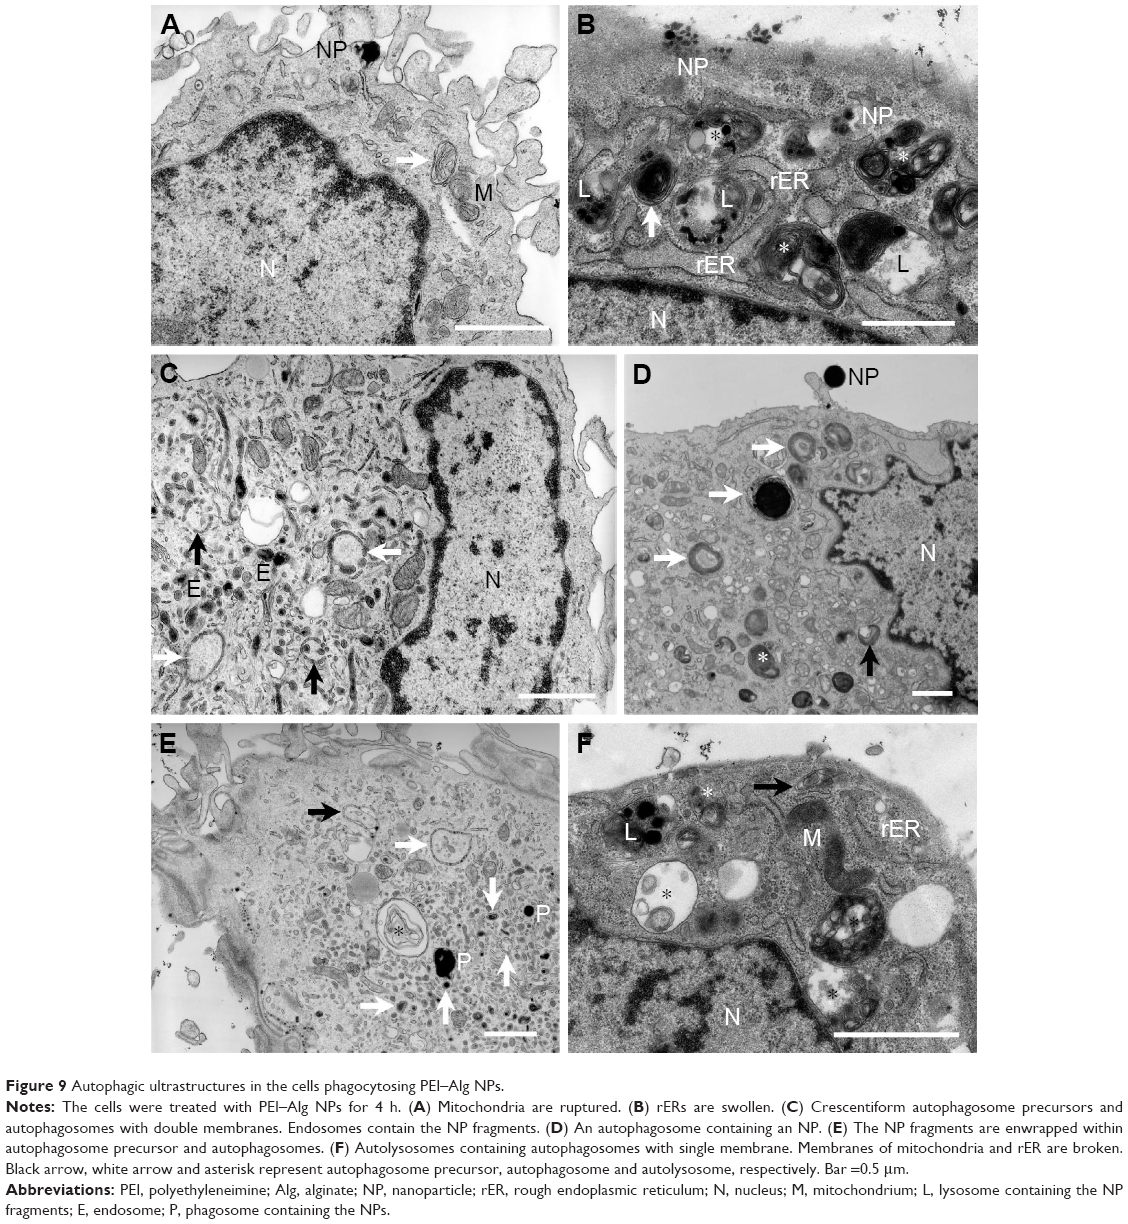 | Figure 9 Autophagic ultrastructures in the cells phagocytosing PEI–Alg NPs. |
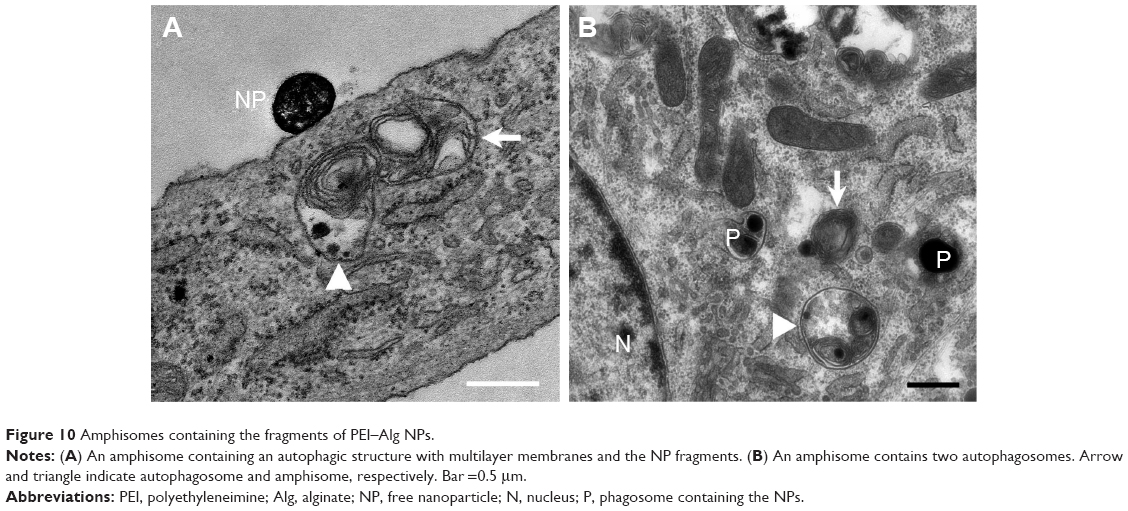 | Figure 10 Amphisomes containing the fragments of PEI–Alg NPs. |
Colocalization of LC3-positive puncta and fragments of PEI–Alg NPs
Colocalization of LC3-positive puncta and NP fragments was determined with LC3 immunostaining or LC3–GFP tracing and NP labeling. LC3-positive puncta were distributed in nucleus and cytoplasm. Colocalization of LC3-positive puncta with the NP fragments (~50% of LC3-positive puncta) could be observed in nuclei and cytoplasm (Figure 11). LC3-positive puncta could not be observed within nuclei in the control group.
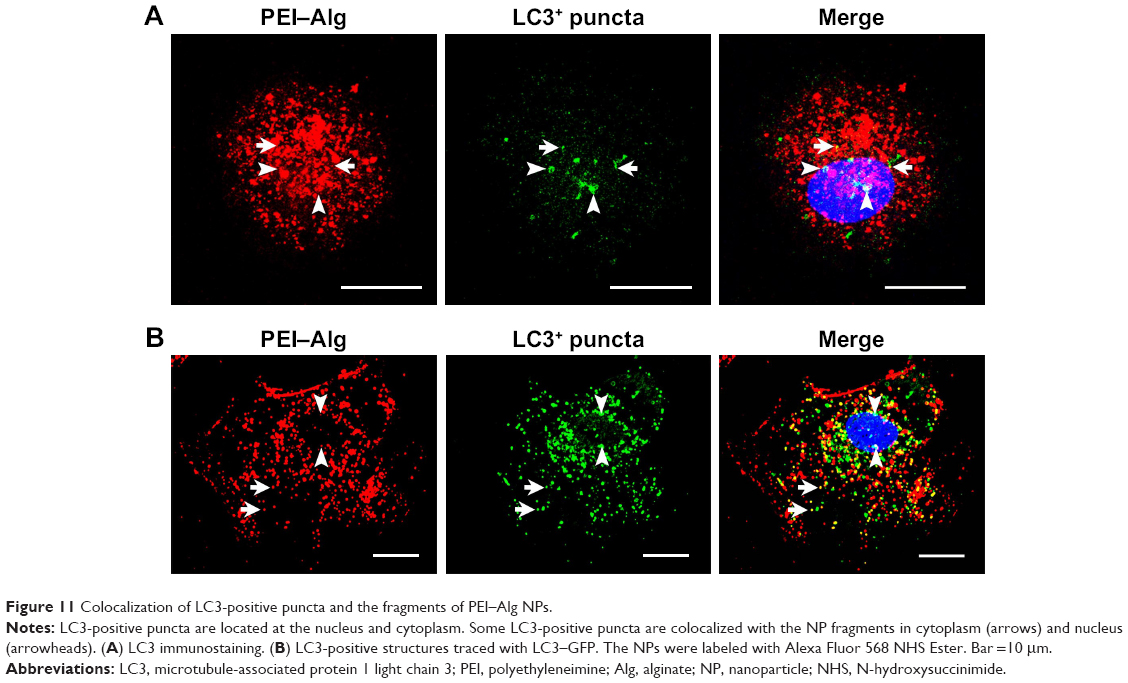 | Figure 11 Colocalization of LC3-positive puncta and the fragments of PEI–Alg NPs. |
Discussion
In this study, we demonstrate that cytotoxicity of PEI NPs is reduced greatly by modification with Alg. After treatment with PEI NPs, the membrane of the cells is smashed, ROS production and LDH leakage of the cells increase and many cells become apoptotic. Cationic NPs can induce disruption of lipid bilayers, including formation of holes, membrane thinning and/or membrane erosion.19 The branched PEI (45 mV) induced transient hole formation and thinning of cell membrane.20 Although injury of cell membrane is a common phenomenon during cellular internalization of cationic NPs, higher molecular weight and more cationic PEI is more toxic.21 Intense NP engulfment may lead to severe disruption of cell membrane. Lowering endocytosis levels overcomes most toxicity of NPs.22 To achieve effective membrane-disruption-based delivery, the disruption must be sufficient to introduce the intended cargo, yet the cell must be capable of repairing itself without permanent damage.1 Alg can reduce PEI toxicity by neutralizing its positive charge. After modification with Alg, the membrane of PEI–Alg NP-treated cells is almost integrated. ROS production, LDH leakage and the number of the apoptotic cells in PEI–Alg NP-treated cells decrease significantly. We found that the fragments of PEI–Alg NPs can enter mitochondria, rERs and nuclei besides releasing into cytoplasm. The distribution of the NP fragments in cytoplasm, mitochondria and nuclei meets the demand of targeting delivery of siRNA or DNA. The results of this study show that PEI–Alg NP is a reliable vector for delivering siRNA to LEPCs. The N/P ratio of 32 for PEI–Alg/siRNA nanocomplexes is regarded as a desirable siRNA loading. In all, 25 kDa branched PEI facilitates mitochondrial proton leak and inhibits the electron transport system in a concentration- and time-dependent manner.23 Further studies are needed to understand the impact of the PEI–Alg NPs on integrity and functions of the organelles and nuclei.
The data of our experiments indicate that the activated autophagy is involved in the degradation of PEI–Alg NPs. After treatment with the NPs, expression of Beclin-1 mRNA and LC3 protein, LC3-positive puncta and autophagic structures increases. In addition, the number of amphisomes increases. With proton buffering capacity, PEI–Alg NPs at low lysosomal pH trigger the influx of Cl−. Consequently, increase in the osmotic pressure and water influx causes rupture of lysosome, leading to the release of the NP fragments into cytoplasm. This process allows the delivered nucleic acid to escape rapid degradation by lysosomal enzymes.24,25 Some free NP fragments may be enwrapped by autophagosome precursor to form autophagosome. The microinjected NPs can be captured by autophagosome.26 The NP fragments also can be observed in endosomes. Some autophagosomes are fused with endosomes or phagosomes containing the NP fragments to form amphisomes, which flux into lysosomes finally. Formation of the amphisome is regarded as a supplemented pathway for degrading the engulfed apoptotic corpses.27 We observed that lysosomes in the cells phagocytosing PEI–Alg NPs increased obviously. Effective biogenesis of the lysosomes is implicated in supplying for heterophagy and autophagy and substituting the disrupted lysosomes during processing the NPs. This study suggests that PEI–Alg NPs can be degraded via autophagosome and amphisome pathways as well as phagosome pathway (Figure 12). Moreover, upregulation of autophagic activities is beneficial in removing degenerative mitochondria and rERs, which undergo oxidative stress induced by active phagocytosis of the NPs. These degenerative organelles can be eliminated via autophagy, protecting the cells to survive from apoptosis.28,29 Autophagy-mediated cytoprotection in turn promotes degradation of the NPs. Recent studies reveal that LC3 may be recruited to single-membrane phagosome and promotes phagosome acidification and fusion with lysosome.30,31 Contribution of LC3-associated phagocytosis to clearance of the NPs should be defined and compared with canonical autophagy in further research.
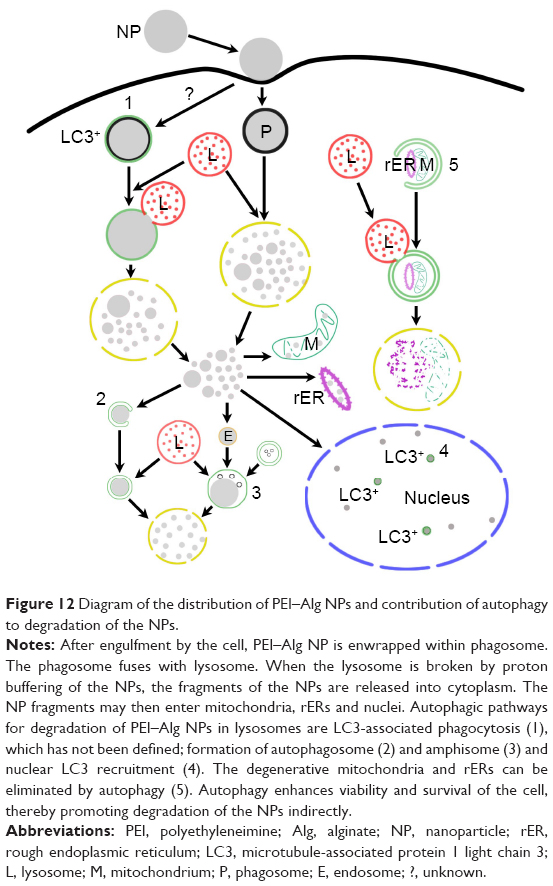 | Figure 12 Diagram of the distribution of PEI–Alg NPs and contribution of autophagy to degradation of the NPs. |
Our findings provide the first evidence that LC3-positive structures are colocalized with NPs in nucleus. In the images of LC3 immunostaining and GFP-traced LC3, colocalization of LC3-positive puncta with the fragments PEI-Alg NPs was observed in the nuclei except for cytoplasm. Soluble LC3 is enriched in nucleus relative to cytoplasm.32 In starvation condition, nuclear LC3 is translocated in cytoplasm to conjugate to the autophagic membranes.33 In transmission electron images, all NP fragments within nuclei are free, and no double-membrane or single-membrane structure is observed in nuclei. Being consistent with results of Buckingham et al,34 colocalization of LC3-positive puncta with the NP fragments does not represent autophagosomes. Recent study suggests that autophagy is related to degradation of nuclear components outside nucleus. Perinuclear autophagosomes and autolysosomes contain nuclear components in nuclear envelopathy.35 Nuclear LC3 mediates degradation of nuclear lamina in lysosome.36 Further works should focus on implication of nuclear LC3 recruitment in transport and degradation of the NPs.
The results in our experiments for the first time demonstrate that there is a population of CD34+VEGFR-3+ EPCs with lymphatic potential in bone marrow. The cells may differentiate into lymphatic endothelial cells under induction with VEGF-C. LEPCs are also present in cord blood16 and adult peripheral blood.37 LEPCs are rich in bone marrow compared with cord or peripheral blood. Bone marrow-derived CD34+VEGFR-3+ LEPCs may be a reliable source in transplantation therapy for lymphatic regenerative diseases. Because both LEPCs and lymphatic endothelial cells express VEGFR-3, VEGFR-3 is a specific target for inhibiting tumor lymphangiogenesis and lymphatic metastasis by delivery of siRNA with NPs.
In summary, this article suggests that autophagy promotes degradation of PEI–Alg NPs via direct (formation of autophagosome and amphisome) and indirect (maintaining viability and survival of the cells) pathways. Alg-modified 25 kDa branched PEI is a safe and effective vector for siRNA delivery. However, intense phagocytosis and subsequent turnover of membrane structures may result in severe oxidative stress, leading to cell apoptosis. Therefore, administrating PEI–Alg NPs in appropriate concentration should be considered in order to avoid occurrence of severe oxidative stress during phagocytosis. Moreover, for optimizing NP-based therapeutic strategy, prospective studies must pay attention to design double-targeting NPs, which can bind VEGFR-3 of the cells and deliver VEGFR-3 siRNA effectively.
Acknowledgments
This work was supported by National Natural Science Foundation of China (30570948) and Scientific Research Foundation of State Education Commission (20130071110080) to Haijie-jie Wang.
Author contributions
All authors contributed toward data analysis, drafting and critically revising the paper and agree to be accountable for all aspects of the work.
Disclosure
The authors report no conflicts of interest in this work.
References
Stewart MP, Sharei A, Ding X, Sahay G, Langer R, Jensen KF. In vitro and ex vivo strategies for intracellular delivery. Nature. 2016;538(7624):183–192. | ||
Kim DH, Rossi JJ. Strategies for silencing human disease using RNA interference. Nat Rev Genet. 2007;8(3):173–184. | ||
Pecot CV, Calin GA, Coleman RL, Lopez-Berestein G, Sood AK. RNA interference in the clinic: challenges and future directions. Nat Rev Cancer. 2011;11(1):59–67. | ||
Günther M, Lipka J, Malek A, Gutsch D, Kreyling W, Aigner A. Polyethylenimines for RNAi-mediated gene targeting in vivo and siRNA delivery to the lung. Eur J Pharm Biopharm. 2011;77(3):438–449. | ||
Nimesh S. Polyethylenimine as a promising vector for targeted siRNA delivery. Curr Clin Pharmacol. 2012;7(2):121–130. | ||
Parhamifar L, Larsen AK, Hunter AC, Andresenc TL, Moghimi SM. Polycation cytotoxicity: a delicate matter for nucleic acid therapy – focus on polyethylenimine. Soft Matter. 2010;6:4001–4009. | ||
Moghimi SM, Symonds P, Murray JC, Hunter AC, Debska G, Szewczyk A. A two-stage poly(ethylenimine)-mediated cytotoxicity: implications for gene transfer/therapy. Mol Ther. 2005;11(6):990–995. | ||
Patnaik S, Arif M, Pathak A, Singh N, Gupta KC. PEI-alginate nanocomposites: efficient non-viral vectors for nucleic acids. Int J Pharm. 2010;385(1–2):194–202. | ||
Li T, Wang GD, Tan YZ, Wang HJ. Inhibition of lymphangiogenesis of endothelial progenitor cells with VEGFR-3 siRNA delivered with PEI-alginate nanoparticles. Int J Biol Sci. 2014;10(2):160–170. | ||
Ruvinov E, Cohen S. Alginate biomaterial for the treatment of myocardial infarction: progress, translational strategies, and clinical outlook: from ocean algae to patient bedside. Adv Drug Deliver Rev. 2016;96(suppl C):54–76. | ||
Peynshaert K, Manshian BB, Joris F, et al. Exploiting intrinsic nanoparticle toxicity: the pros and cons of nanoparticle-induced autophagy in biomedical research. Chem Rev. 2014;114(15):7581–7609. | ||
Choi AMK, Ryter SW, Levine B. Mechanisms of disease: autophagy in human health and disease. N Engl J Med. 2013;368(7):651–662. | ||
Eidi H, Joubert O, Némos C, et al. Drug delivery by polymeric nanoparticles induces autophagy in macrophages. Int J Pharm. 2012;422(1–2):495–503. | ||
Lin CW, Jan MS, Kuo JHS, Hsu LJ, Lin YS. Protective role of autophagy in branched polyethylenimine (25K)- and poly(L-lysine) (30–70K)-induced cell death. Eur J Pharm Sci. 2012;47(5):865–874. | ||
Lin CW, Jan MS, Kuo JHS. Autophagy-related gene expression analysis of wild-type and atg5 gene knockout mouse embryonic fibroblast cells treated with polyethylenimine. Mol Pharm. 2014;11(9):3002–3008. | ||
Tan YZ, Wang HJ, Zhang MH, Quan Z, Li T, He QZ. CD34+VEGFR-3+ progenitor cells have a potential to differentiate towards lymphatic endothelial cells. J Cell Mol Med. 2014;18(3):422–433. | ||
Liang XH, Jackson S, Seaman M, et al. Induction of autophagy and inhibition of tumorigenesis by beclin 1. Nature. 1999;402(6762):672–676. | ||
Kabeya Y, Mizushima N, Ueno T, et al. LC3, a mammalian homologue of yeast Apg8p, is localized in autophagosome membranes after processing. EMBO J. 2000;19(21):5720–5728. | ||
Leroueil PR, Berry SA, Duthie K, et al. Wide varieties of cationic nanoparticles induce defects in supported lipid bilayers. Nano Lett. 2008;8(2):420–424. | ||
Hong S, Leroueil PR, Janus EK, et al. Interaction of polycationic polymers with supported lipid bilayers and cells: nanoscale hole formation and enhanced membrane permeability. Bioconjug Chem. 2006;17(3):728–734. | ||
Monnery BD, Wright M, Cavill R, et al. Cytotoxicity of polycations: relationship of molecular weight and the hydrolytic theory of the mechanism of toxicity. Int J Pharm. 2017;521(1–2):249–258. | ||
Manshian BB, Himmelreich U, Soenen SJ. Standard cellular testing conditions generate an exaggerated nanoparticle cytotoxicity profile. Chem Res Toxicol. 2017;30(2):595–603. | ||
Hall A, Larsen AK, Parhamifar L, Meyle KD, Wu LP, Moghimi SM. High resolution respirometry analysis of polyethylenimine-mediated mitochondrial energy crisis and cellular stress: mitochondrial proton leak and inhibition of the electron transport system. Biochim Biophys Acta. 2013;1827(10):1213–1225. | ||
Akinc A, Thomas M, Klibanov AM, Langer R. Exploring polyethylenimine-mediated DNA transfection and the proton sponge hypothesis. J Gene Med. 2005;7(5):657–663. | ||
Dominska M, Dykxhoorn DM. Breaking down the barriers: siRNA delivery and endosome escape. J Cell Sci. 2010;123(pt 8):1183–1189. | ||
Remaut K, Oorschot V, Braeckmans K, Klumperman J, De Smedt SC. Lysosomal capturing of cytoplasmic injected nanoparticles by autophagy: an additional barrier to non viral gene delivery. J Control Release. 2014;195:29–36. | ||
Zhou P, Tan YZ, Wang HJ, et al. Cytoprotective effect of autophagy on phagocytosis of apoptotic cells by macrophages. Exp Cell Res. 2016;348(2):165–176. | ||
Moreau K, Luo S, Rubinsztein DC. Cytoprotective roles for autophagy. Curr Opin Cell Biol. 2010;22(2):206–211. | ||
Wang HJ, Zhang D, Tan YZ, Li T. Autophagy in endothelial progenitor cells is cytoprotective in hypoxic conditions. Am J Physiol Cell Physiol. 2013;304(7):C617–C626. | ||
Martinez J, Malireddi RK, Lu Q, et al. Molecular characterization of LC3-associated phagocytosis reveals distinct roles for Rubicon, NOX2 and autophagy proteins. Nat Cell Biol. 2015;17(7):893–906. | ||
Klionsky DJ, Abdelmohsen K, Abe A, et al. Guidelines for the use and interpretation of assays for monitoring autophagy (3rd edition). Autophagy. 2016;12(1):1–222. | ||
Drake KR, Kang M, Kenworthy AK. Nucleocytoplasmic distribution and dynamics of the autophagosome marker EGFP-LC3. PLoS One. 2010;5(3):e9806. | ||
Huang R, Xu Y, Wan W, et al. Deacetylation of nuclear LC3 drives autophagy initiation under starvation. Mol Cell. 2015;57(3):456–467. | ||
Buckingham EM, Carpenter JE, Jackson W, Grose C. Nuclear LC3-positive puncta in stressed cells do not represent autophagosomes. Biotechniques. 2014;57(5):241–244. | ||
Park YE, Hayashi YK, Bonne G, et al. Autophagic degradation of nuclear components in mammalian cells. Autophagy. 2009;5(6):795–804. | ||
Dou Z, Xu C, Donahue G, et al. Autophagy mediates degradation of nuclear lamina. Nature. 2015;527(7576):105–109. | ||
DiMaio TA, Wentz BL, Lagunoff M. Isolation and characterization of circulating lymphatic endothelial colony forming cells. Exp Cell Res. 2016;340(1):159–169. |
 © 2017 The Author(s). This work is published and licensed by Dove Medical Press Limited. The full terms of this license are available at https://www.dovepress.com/terms.php and incorporate the Creative Commons Attribution - Non Commercial (unported, v3.0) License.
By accessing the work you hereby accept the Terms. Non-commercial uses of the work are permitted without any further permission from Dove Medical Press Limited, provided the work is properly attributed. For permission for commercial use of this work, please see paragraphs 4.2 and 5 of our Terms.
© 2017 The Author(s). This work is published and licensed by Dove Medical Press Limited. The full terms of this license are available at https://www.dovepress.com/terms.php and incorporate the Creative Commons Attribution - Non Commercial (unported, v3.0) License.
By accessing the work you hereby accept the Terms. Non-commercial uses of the work are permitted without any further permission from Dove Medical Press Limited, provided the work is properly attributed. For permission for commercial use of this work, please see paragraphs 4.2 and 5 of our Terms.