")
Back to Journals » International Journal of Nanomedicine » Volume 12
Autophagic flux induced by graphene oxide has a neuroprotective effect against human prion protein fragments
Authors Jeong JK, Lee YJ, Jeong SY, Jeong S, Lee GW, Park SY
Received 14 July 2017
Accepted for publication 26 September 2017
Published 8 November 2017 Volume 2017:12 Pages 8143—8158
DOI https://doi.org/10.2147/IJN.S146398
Checked for plagiarism Yes
Review by Single anonymous peer review
Peer reviewer comments 3
Editor who approved publication: Dr Thomas Webster
Jae-Kyo Jeong,1 You-Jin Lee,1 Seung Yol Jeong,2,3 Sooyeon Jeong,2 Geon-Woong Lee,2 Sang-Youel Park1
1Biosafety Research Institute, College of Veterinary Medicine, Chonbuk National University, Iksan, 2Nano Hybrid Technology Research Center, Korea Electrotechnology Research Institute (KERI), Changwon, 3Department of Electrical Functionality Material Engineering, University of Science and Technology (UST), Daejon, Republic of Korea
Abstract: Graphene oxide (GO) is a nanomaterial with newly developing biological applications. Autophagy is an intracellular degradation system that has been associated with the progression of neurodegenerative disorders. Although induction of autophagic flux by GO has been reported, the underlying signaling pathway in neurodegenerative disorders and how this is involved in neuroprotection remain obscure. We show that GO itself activates autophagic flux in neuronal cells and confers a neuroprotective effect against prion protein (PrP) (106–126)-mediated neurotoxicity. GO can be detected in SK-N-SH neuronal cells, where it triggers autophagic flux signaling. GO-induced autophagic flux prevented PrP (106–126)-induced neurotoxicity in SK-N-SH cells. Moreover, inactivation of autophagic flux blocked GO-induced neuroprotection against prion-mediated mitochondrial neurotoxicity. This is the first study to demonstrate that GO regulates autophagic flux in neuronal cells, and that activation of autophagic flux signals, induced by GO, plays a neuroprotective role against prion-mediated mitochondrial neurotoxicity. These results suggest that the nanomaterial GO may be used to activate autophagic flux and could be used in neuroprotective strategies for treatment of neurodegenerative disorders, including prion diseases.
Keywords: graphene oxide, neuroprotection, autophagy, prion protein, mitochondria
Introduction
Autophagy is a cellular process for degrading cell organelles via the lysosomal degradation pathway.1 Activation of autophagic flux through inhibition of mammalian target of rapamycin (mTOR) results in translocation of the cytoplasmic mTOR complex (mTORC) to the endoplasmic reticulum (ER).2 The translocation of mTORC to the ER induces the formation of the phagophore.3 The ensuing phagophore elongation and autophagosome formation requires multiple proteins, including microtubule-associated light chain 3 (LC3) and Sequestosome 1 (p62).4,5 LC3, in particular, plays a pivotal role in autophagosome formation, where it is membrane-bound and converted from the free form (LC3-I) to the phagophore membrane-bound form (LC3-II).6–9 The polyubiquitin chain-binding protein p62 is involved in the ubiquitin–proteasome degradation system, and the p62 complex is selectively sequestered in autophagosomes by the interaction of p62 and LC.6,7 Autophagosomes fuse with lysosomes to form autolysosomes, mediated by a receptor in the lysosomal membrane – the lysosome-associated membrane protein 2 (Lamp-2).10 In the autolysosomes, the luminal cargo is degraded by lysosomal enzymes.6,7,10 Some studies have shown that activation of autophagic flux plays a crucial role in a variety of conditions, including tumor suppression, immune response, adaptation to starvation, and neuroprotection.11 A previous study from our laboratory showed melatonin protects neuronal cells against prion protein (PrP) (106–126)-mediated mitochondrial neurotoxicity via upregulation of autophagy.12 Moreover, GO can simultaneously trigger an antitumor effect and activate an immune response through activation of autophagic flux.13–15 It is well known that a lack of essential nutrients can induce autophagy.
Nanotechnology involves the application of nano-sized materials that possess distinctive properties in comparison to bulk materials of different composition.16 Graphene-based nanotechnology is a promising area of research due to its potential applications in the fields of sensors, alternative energy, and biomedical areas.17,18 Graphene is a two-dimensional (2D) nanomaterial composed of sp2-bonded carbon atoms and has unique electronic and mechanical properties.19 As previously stated, the application of graphene to biological systems is a relative new area of study with latent potential, and has drawn intense attention for many bioapplications.20,21 Since the seminal report on use of graphene oxide (GO), a derivative of graphene, this compound has seen increasing application in biomedical areas, including cell proliferation and differentiation, drug delivery, immune response, and anticancer therapy.15,18,20,22–24 Significantly, GO has abundant oxygen functional groups, including hydroxyl, epoxy, carbonyl, and carboxyl groups.25 The effect of GO can be modulated by modification of its oxygen moieties as well as altering chemical functionality on graphene layers.25 Some studies suggest that GO promotes differentiation of neural stem cells and neural outgrowth.26,27 Moreover, injection of GO stimulates the immune response and antitumor effects via upregulation of autophagic flux.13–15 However, the effect of GO-mediated autophagy has not yet been defined in neurodegenerative disorders.
Prion diseases, also known as transmissible spongiform encephalopathies (TSE), belong to a group of neurodegenerative disorders that affect the central nervous system (CNS).28–32 The main pathological mechanism of prion disease is related to the accumulation of misfolded prion protein PrPSc, a protease-resistant protein that is structurally converted from the normal prion protein PrPC.33 The accumulation of PrPSc or exposure to PrP (106–126) induces mitochondria-mediated neurotoxicity,34,35 which can be prevented by activating autophagic flux.36 Thus, we hypothesized that activation of autophagic flux by GO treatment may prevent prion-mediated neurotoxicity.
In this study, we show that GO treatment protects neuronal cells against PrP (106–126)-mediated mitochondrial damage. However, this protective effect was suppressed by inhibition of autophagic flux. These results suggest that GO may have a neuroprotective effect via upregulation of autophagic flux and may be relevant to therapeutic strategies for neurodegenerative disease.
Materials and methods
Materials
A penicillin–streptomycin solution and fetal bovine serum (FBS) were obtained from Life Technologies/Gibco (Carlsbad, CA, USA). Modified Eagle’s Medium (MEM) was purchased from GE Healthcare/HyClone (Logan, UT, USA). The immunoblotting and immunocytochemical antibodies targeted LC3 and ATG5 (Cell SignalingTechnology, Danvers, MA, USA), p62 (Millipore, Temecula, CA, USA) and β-actin (Sigma-Aldrich, St Louis, MO, USA).
Preparation and characterization of GO
GO sheets were prepared by exfoliation of graphite oxide powder, which was produced from natural graphite (Alfa Aesar, 99.999% purity, −200 mesh) using the modified Hummers method. As an oxidation process, 20 g of graphite and 460 mL of sulfuric acid (H2SO4) were mixed in a flask. Subsequently, 60 g of potassium permanganate (KMnO4) wasslowly added over 1 h. Stirring was continued for 2 h in an ice-water bath. After the mixture was stirred vigorously for 3 days at room temperature, 920 mL of deionized (DI) water was added, and stirring wasfor 10 min in an ice-water bath. To this, 50 mL of H2O2 (30 wt% aqueous solution) was added, and the mixture was stirred for 2 h at room temperature. To exfoliate from graphite oxide to GO nanosheets, the graphite oxide solution dispersed in water with a concentration of 1 g/L was sonicated for 1 h by a high-powered horn sonicator. In order to obtain small-sized GO nanosheets, it was sorted by centrifugation at 10,000 rpm for 30 min. Then, the supernatant GO solution was decanted. The final concentration of GO solution is approximately 200 mg/L in this case. The size distribution of GO nanosheets is less than 1 μm, with 90% as shown in Figure 1A. Morphologies of the samples were imaged by field-emission scanning electron microscopy (FESEM, HITACHI S4800) and atomic force microscopy (AFM, Digital Instruments Nanoscope IIIA) using silicon tips with a typical resonance frequency of 320 kHz. The oxidation level of GO was identified by X-ray photoelectron spectroscopy (XPS) using a Multilab 2000 (Thermo VG Scientific Inc., Waltham, MA, USA) spectrometer with monochromatized Al K X-ray radiation as the X-ray excitation source. The power was set to 150 W and the voltage to 20 eV for high-resolution scanning, and a 500 μm-diameter beam size was used. Fitted peaks of XPS spectra were determined by considering a combination of Gaussian and Lorentzian distribution as shown in Figure 1B.
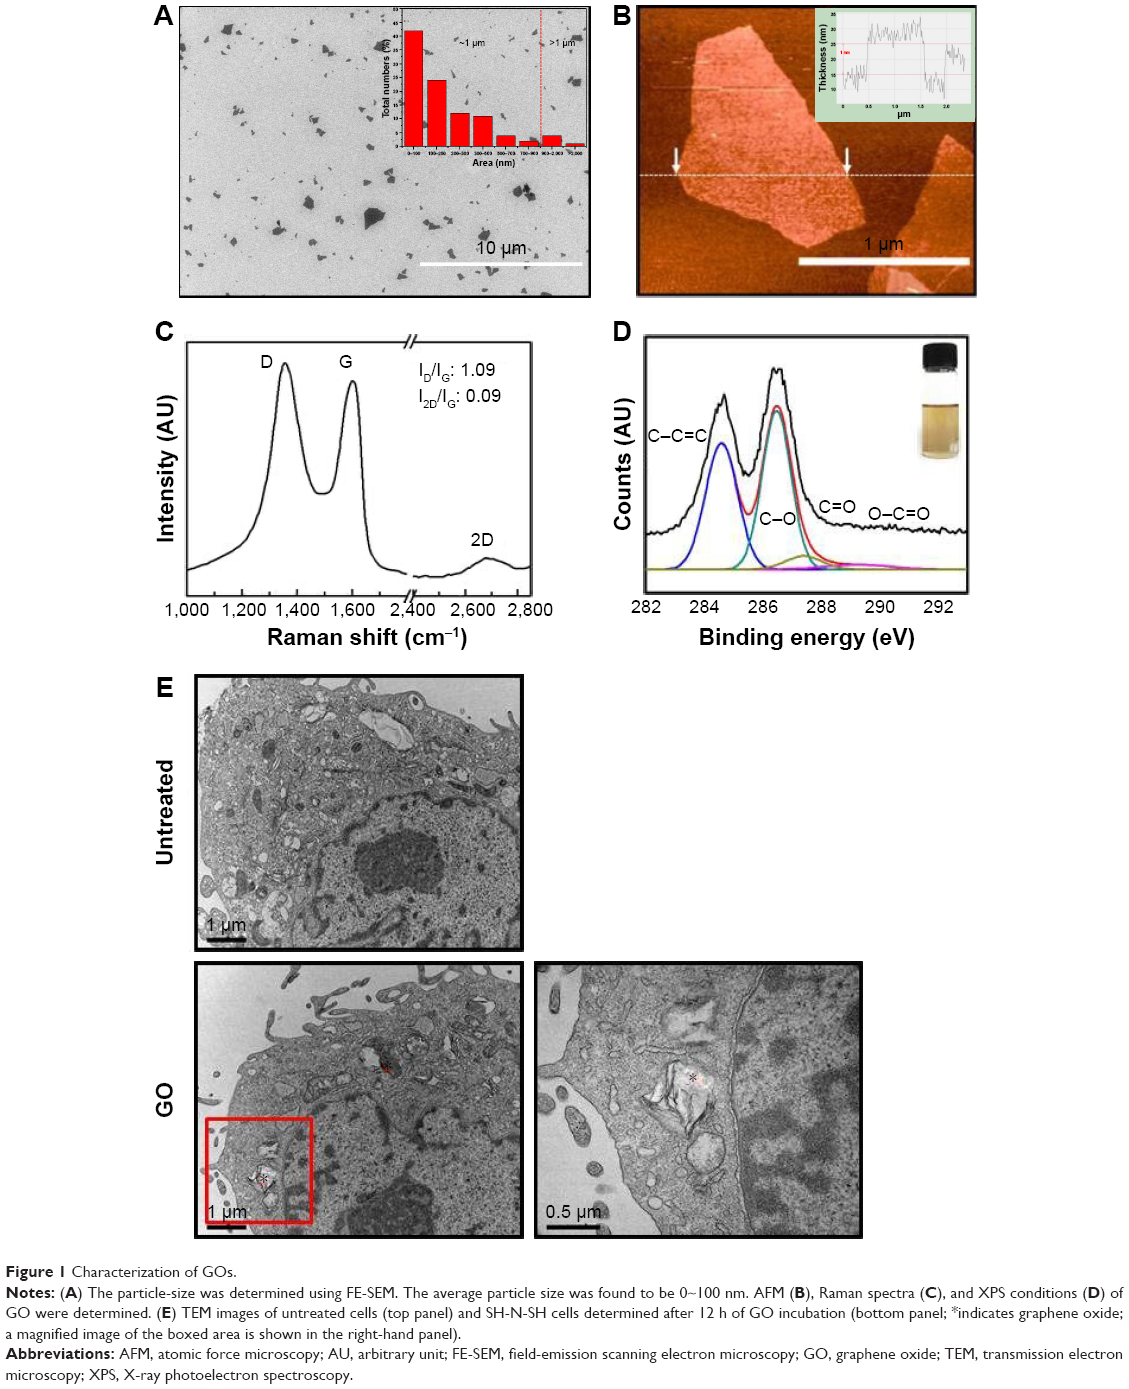 | Figure 1 Characterization of GOs. |
Cell culture
The human neuroblastoma cell line SK-N-SH was obtained from American Type Culture Collection (ATCC, Rockville, MD, USA). Cells were cultured in MEM that contained 10% FBS and 100 U penicillin–streptomycin solution in a humidified incubator maintained at 37°C and 5% CO2.
Transmission electron microscopy (TEM) analysis
TEM samples were analyzed by a transmission electron microscope (JEM-2010, JEOL) installed in the Center for University-Wide Research Facilities (CURF) at Chonbuk National University. After fixation of arterial samples in 2.5% glutaraldehyde (TED PELLA, USA) in PBS (pH, 7.2), specimens were post-fixed in 1% osmium tetroxide (Heraeus, South Africa), dehydrated in graded ethanol and propylene oxide (Acros Organics, USA), and then embedded in Epoxy resin (Embed812, NMA; nadic methyl anhydride. DDSA; dodenyl succinic anhydride. DMP-30, USA) as used previously. Serial ultrathin sections were cut on an LKB-III ultratome (LEICA, Germany). Ultrathin sections were stained with uranyl acetate (TED PELLA, USA) and lead citrate (TED PELLA, USA) and examined with the aid of a Hitachi H7600 electron microscope (Hitachi, Japan) at an accelerating voltage of 100 kV.
PrP (106–126) treatment
Synthetic PrP (106–126) (sequence, Lys-Thr-Asn-Met-Lys-His-Met-Ala-Gly-Ala-Ala-Ala-Ala-Gly-Ala-Val-Val-Gly-Gly-Leu-Gly) was synthesized by Peptron (Seoul, Korea). The peptide was dissolved at a concentration of 12.5 mM in sterile diemthyl sulfoxide (DMSO) and stored at −80°C.
Annexin V assay
Apoptosis was assessed by the Annexin V assay in detached cells using the Annexin V Assay kit (Santa Cruz Biotechnology, Santa Cruz, CA, USA), according to the manufacturer’s protocol. Annexin V was quantified by measuring fluorescence at an excitation wavelength of 488 nm and an emission wavelength of 525/30 nm using a Guava EasyCyte HT (Millipore).
Tetraethylbenzimidazolcarbocyanine iodide (JC-1) assay
The change in MTP was evaluated by the cationic fluorescent indicator JC-1 (Molecular Probes Eugene, OR, USA), in which J-aggregates in intact mitochondria showed evident red fluorescence with emission at 583 nm, indicating high or normal MTP. Green fluorescence with emission at 525 nm indicates low MTP when it remains in the monomeric form in the cytoplasm. Cells were incubated in MEM containing 10 μM JC-1 at 37°C for 15 min and then transferred to a clear 96-well plate. The J-1 aggregate fluorescent emission was measured at 583 nm with an excitation wavelength of 488 nm, and JC-1 monomer fluorescence intensity was measured with an excitation and emission wavelength of 488 and 525 nm, respectively, using a SpectraMax m2 microplate reader (SpectraMAX; Molecular Devices, Sunnyvale, CA, USA). Moreover, JC-1 monomer form-positive cells populations were determined by using a Guava EasyCyte HT (Millipore). Further, JC-1 stained cells were cultured with SK-N-SH cells on cover slips in a 12-well plate and incubated in MEM containing 10 μM JC-1 at 37°C for 15 min. Finally, cells were mounted with DakoCytomation fluorescent medium (DAKO, Glostrup, Denmark) and visualized via fluorescence microscopy.
Flow cytometric analysis
Cells were tripsinized and aliquoted. Aliquots containing 2.5 to 5.0*105 cells were stained for 30 min in fluorescence dye including JC-1 and Annexin V assay. Afterward, the cells were washed in PBS, centrifuged at 1,200 g and re-suspended in maintaining buffer (PBS containing 1% FBS). Cells were characterized by using a Guava EasyCyte HT, and the data were analyzed by InCytesoftware; 104 events were collected in each run.
Terminal deoxynucleotidyl transferase dUTP nick end labeling (TUNEL) assay
The TUNEL analysis was performed to measure the degree of cellular apoptosis using the APO-BrdU™ TUNEL Assay Kit (Invitrogen), according to the manufacturer’s instructions. Cells were fixed in paraformaldehyde for 15 min. Cells were pre-incubated with 50 μL DNA-labeling solution for 1 h at 37°C and then incubated with 5 μL anti-BrdU-fluorescein isothiocyanate (FITC) antibody for 30 min at room temperature (20°C). Finally, cells were mounted with DakoCytomation fluorescent medium and visualized under a fluorescence microscope (Olympus, Tokyo, Japan). These cells were counterstained with propidium iodide to reveal cell nuclei.
Western blotting
Cells were lysed in lysis buffer (25 mM HEPES; pH 7.4, 100 mM NaCl, 1 mM EDTA, 5 mM MgCl2, 0.1 mM DTT, and a protease inhibitor mixture). Proteins were electrophoretically resolved by 10%–15% sodium dodecyl sulfate-polyacrylamide gel electrophoresis (SDS-PAGE), and immunoblotting was performed as described previously. Equal amounts of lysate protein were resolved by 10%–15% SDS-PAGE, and electrophoretically transferred to a nitrocellulose membrane. Immunoreactivity was detected through sequential incubation with horseradish peroxidase-conjugated secondary antibodies and enhanced chemiluminescent reagents. Densitometry of the signal bands was conducted using the Bio-1D densitometer (Vilber Lourmat, Eberhardzell, Germany). Antibodies used for immunoblotting were p-62, LC3, ATG5, and β-actin. Images were examined using a Fusion-FX7 imaging system (Vilber Lourmat).
Immunocytochemistry
Cells were cultured on glass cover slips and fixed in cold acetone for 90 s at room temperature. They were blocked with 5% FBS in Tris-buffered saline with Tween, and incubated with anti-mouse-p-62 (2 μg/mL) monoclonal antibody and anti-rabbit-LC3 (2 μg/mL) polyclonal antibody for 48 h at room temperature. Unbound antibody was removed by an additional PBS wash, and cells were incubated with Alexa Fluor 488 anti-rabbit FITC (for the anti-LC3 antibodies) and Alexa Fluor 546 anti-mouse (for the anti-p62 antibody) IgG antibodies (4 μg/mL) for 2 h at room temperature. Finally, these cells were mounted using the DakoCytomation fluorescent medium (DAKO, Glostrup, Denmark) and visualized under a fluorescence microscope (Olympus).
RNA interference
Cells were transfected with ATG5 small interfering RNA (siRNA; oligoID HSS114104) using Lipofectamine 2000, according to the manufacturer’s instructions, respectively. After 48-h culture, knockdown efficiency was measured at the protein level by immunoblot. The RNAi Negative Control (Invitrogen) was used as a control.
Statistical analysis
All data are expressed as mean ± standard deviation and compared using one-way analysis of variance with GraphPad Prism ver. 5.0 software (GraphPad Software, Inc., La Jolla, CA, USA). A p<0.05 was considered significant.
Results
Synthesis and characterization of GO
The GO was synthesized by the modified Hummers method. In order to obtain small-sized GO nanosheets, graphite oxide was exfoliated by horn sonication in a water solution. The average sheet size was estimated from counting more than 200 sheets from scanning electron microscopy (SEM) images, and revealed the GO nanosheets to be in the size range from 100 nm to 2 μm, as shown in the Figure 1A. The size distribution of GO nanosheets reveals that 90% are less than 1 μm. As shown in Figure 1B, AFM images showed that the average thickness of GO was approximately 1 nm. Moreover, the 2D peaks were monitored at 2,649 and 2,646 cm−1 with symmetric line shape, confirming a single-layered graphene in Figure 1C. In Figure 1D, X-ray photoelectron spectroscopy (XPS) was used to determine the atomic percentage of oxygen functional groups in GO nanosheets, including C−O (hydroxyl and epoxy, ~286.5 eV), C=O (carbonyl, ~287.4 eV), O−C=O (carboxyl, ~289.3 eV), and C−C=C (sp2 and sp3, ~284.6 eV). The atomic ratio of C/O in GO is 0.75, confirming a high percentage of oxygen functional groups. GO has a strong negative charge due to the oxygen moieties on graphene layers. Thus, GO can be dispersed uniformly in a polar solvent such as water. In addition, the aqueous GO was yellow due to the large number of oxygen functional groups (Figure 1D inset). Next, we used transmission electron microscopy (TEM) imaging to determine whether the GO penetrated into the cytosol. Images revealed that GO-treated cells had detectable GO in the cytoplasm (Figure 1E).
Cellular uptake of GO induces accumulation of autophagosomes
Previous papers have shown that GO is associated with autophagic flux in various tissues and cell lines.37,38 However, the relationship between GO and autophagic flux in neuronal cells is not clear. We investigated this relationship using TEM and immunoblot analysis after cellular uptake of GO. These studies were carried out to determine the fate of GO, and its effect on agglomeration, internalization, and autophagosome and autolysosome formation. Cells were treated with different doses of GO and prepared for TEM and Western blot after 24-h exposure. TEM analysis showed that control cells possessed normal cellular features, with prominent nuclei and mitochondria (Figure 2A). Cells treated with GO were localized within double-membrane-bound vacuoles. Cells exposed to GO had increased numbers of typical autophagosomes with double membranes. Cellular organelles were observed in the TEM images of SK-N-SH cells compared to control groups. In addition, immunoblotting and immunocytochemistry results showed that GO dose-dependently increased LC3 and decreased p62 protein levels (Figure 2B and C). These data indicate that GO increases the number of autophagic vesicles and induced autophagic flux in SK-N-SH cells.
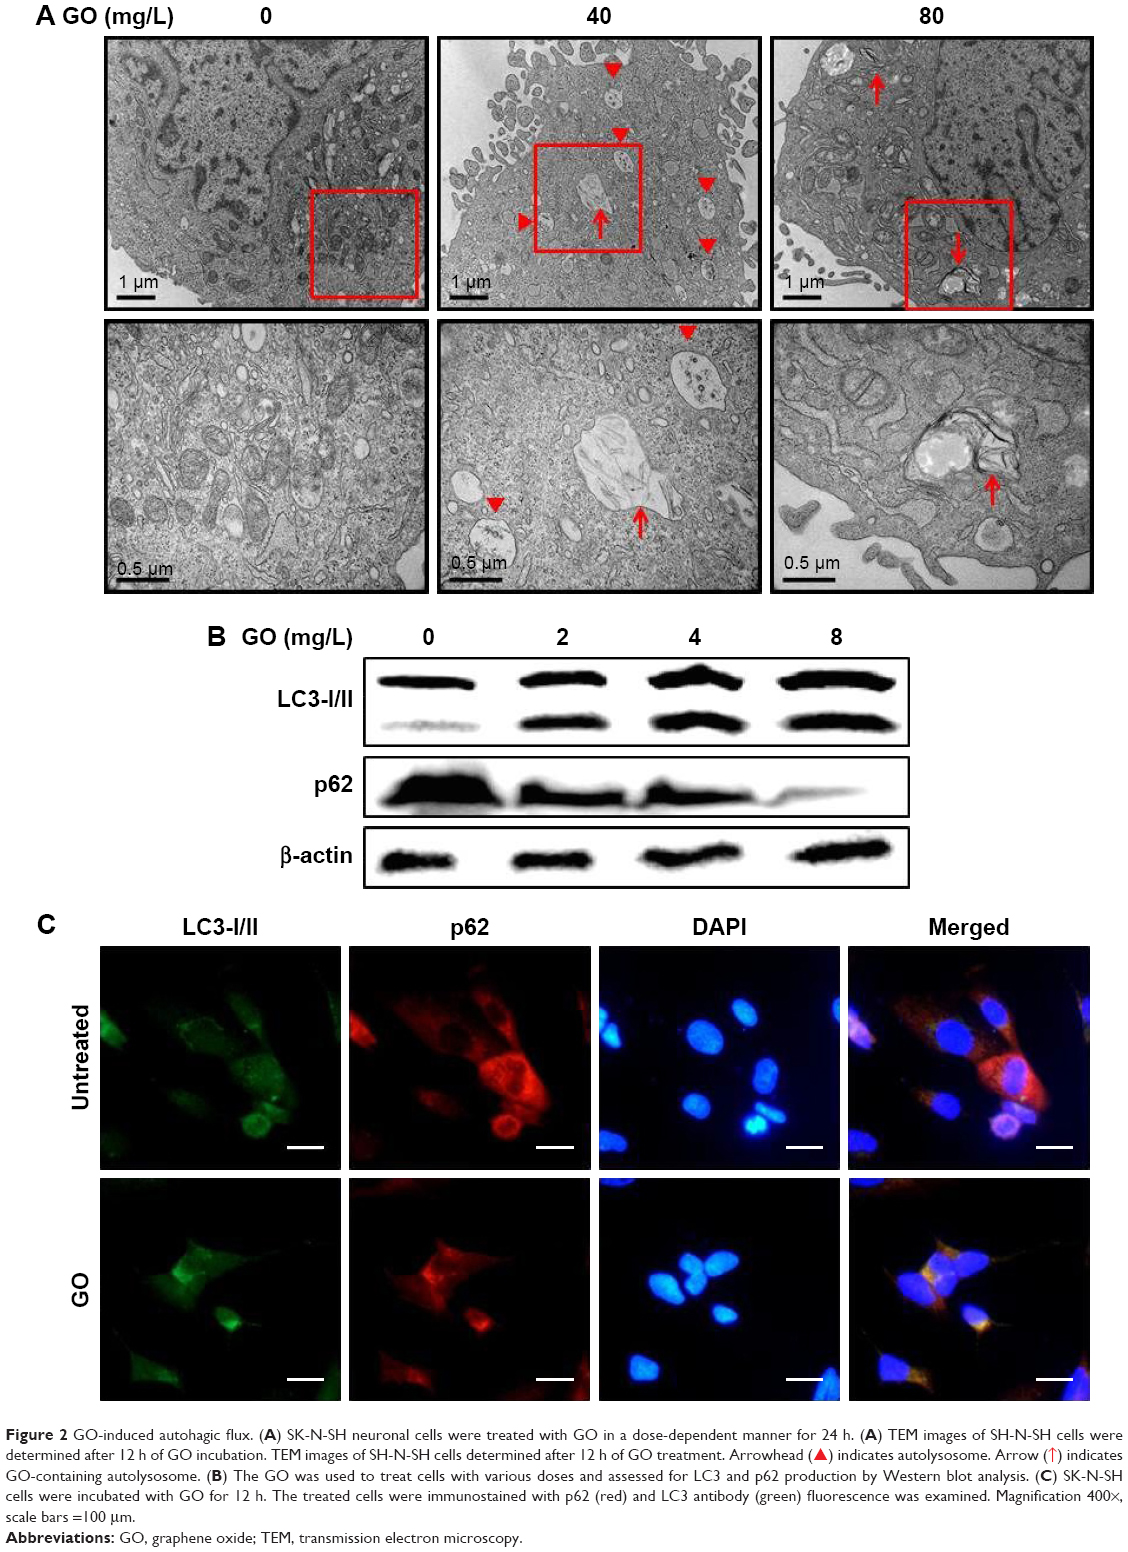 | Figure 2 GO-induced autohagic flux. (A) SK-N-SH neuronal cells were treated with GO in a dose-dependent manner for 24 h. (A) TEM images of SH-N-SH cells were determined after 12 h of GO incubation. TEM images of SH-N-SH cells determined after 12 h of GO treatment. Arrowhead ( |
 ) indicates autolysosome. Arrow (
 ) indicates GO-containing autolysosome. (B) The GO was used to treat cells with various doses and assessed for LC3 and p62 production by Western blot analysis. (C) SK-N-SH cells were incubated with GO for 12 h. The treated cells were immunostained with p62 (red) and LC3 antibody (green) fluorescence was examined. Magnification 400×, scale bars =100 μm.
GO protects SK-N-SH cells against PrP (106–126)-mediated apoptosis and upregulates autophagy flux
Mitochondrial neurotoxicity has been associated with prion-mediated neurotoxicity;34 therefore, we next examined whether autophagic flux induced by GO treatment could prevent PrP (106–126)-induced mitochondrial neurotoxicity. Cells were treated with GO for 12 h and then exposed to PrP (106–126) for 24 h. GO-treated SK-N-SH cells showed decreased PrP (106–126)-induced apoptosis (Figure 3A and B). Consistent with these results, the TUNEL assay (Figure 3C) showed that treatment with GO inhibited the DNA binding of anti-5-bromodeoxyuridine (BrdUrd) as compared to treatment with PrP (106–126) only. In addition, the PrP (106–126)-exposed group had increased JC-1 monomer positive cells (41.56%), indicating lower MTP values, whereas groups treated with GO had decreased PrP (106–126)-induced JC-1 monomer-positive cells, indicating normal MTP values (Figure 3D and E). These results were confirmed by fluoroscopy (Figure 3F). We also examined the influence of GO treatment on autophagic flux activation in PrP (106–126)-exposed cells by using Western blot and immunocytochemistry (Figure 4). As shown in Figure 4A and B, PrP (106–126) treatment increased LC3-II and p62 protein levels, which indicates inhibition of autophagic flux, whereas GO treatment increased LC3-II and decreased p62 protein levels, which indicates induction of autophagic flux. Collectively, these results suggested that GO treatment induces autophagic flux and prevents PrP (106–126)-induced mitochondria-mediated neurotoxicity.
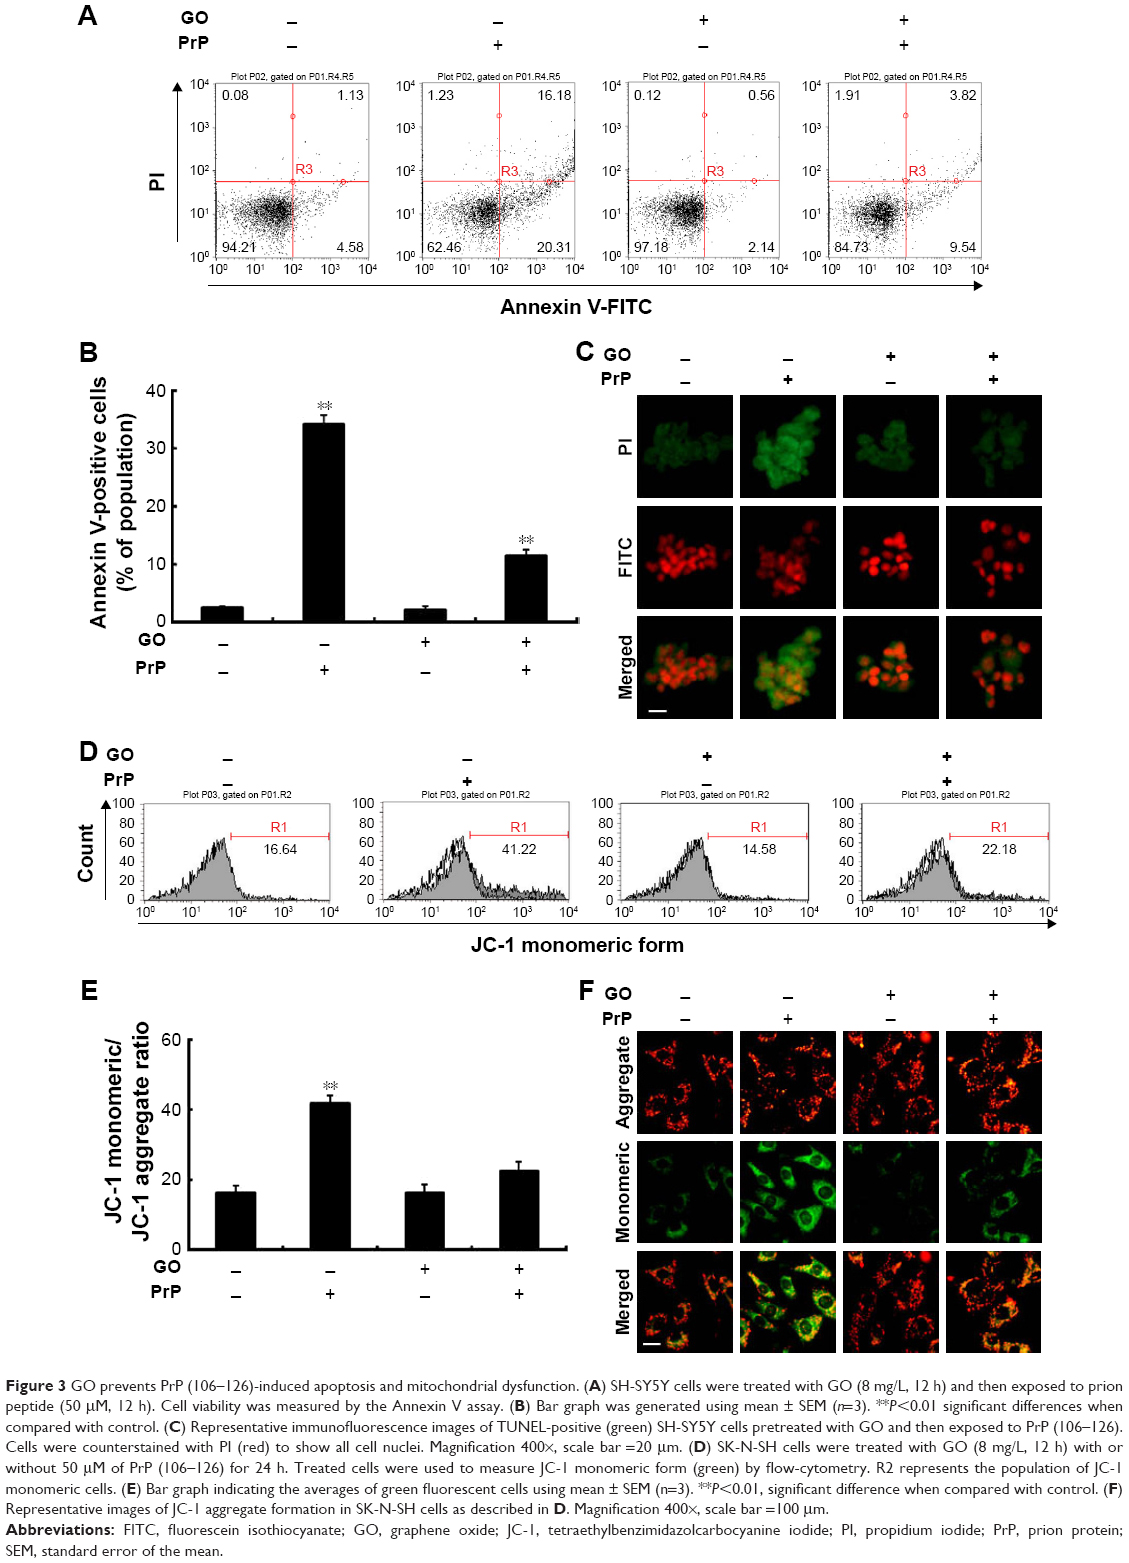 | Figure 3 GO prevents PrP (106–126)-induced apoptosis and mitochondrial dysfunction. (A) SH-SY5Y cells were treated with GO (8 mg/L, 12 h) and then exposed to prion peptide (50 μM, 12 h). Cell viability was measured by the Annexin V assay. (B) Bar graph was generated using mean ± SEM (n=3). **P<0.01 significant differences when compared with control. (C) Representative immunofluorescence images of TUNEL-positive (green) SH-SY5Y cells pretreated with GO and then exposed to PrP (106–126). Cells were counterstained with PI (red) to show all cell nuclei. Magnification 400×, scale bar =20 μm. (D) SK-N-SH cells were treated with GO (8 mg/L, 12 h) with or without 50 μM of PrP (106–126) for 24 h. Treated cells were used to measure JC-1 monomeric form (green) by flow-cytometry. R2 represents the population of JC-1 monomeric cells. (E) Bar graph indicating the averages of green fluorescent cells using mean ± SEM (n=3). **P<0.01, significant difference when compared with control. (F) Representative images of JC-1 aggregate formation in SK-N-SH cells as described in D. Magnification 400×, scale bar =100 μm. |
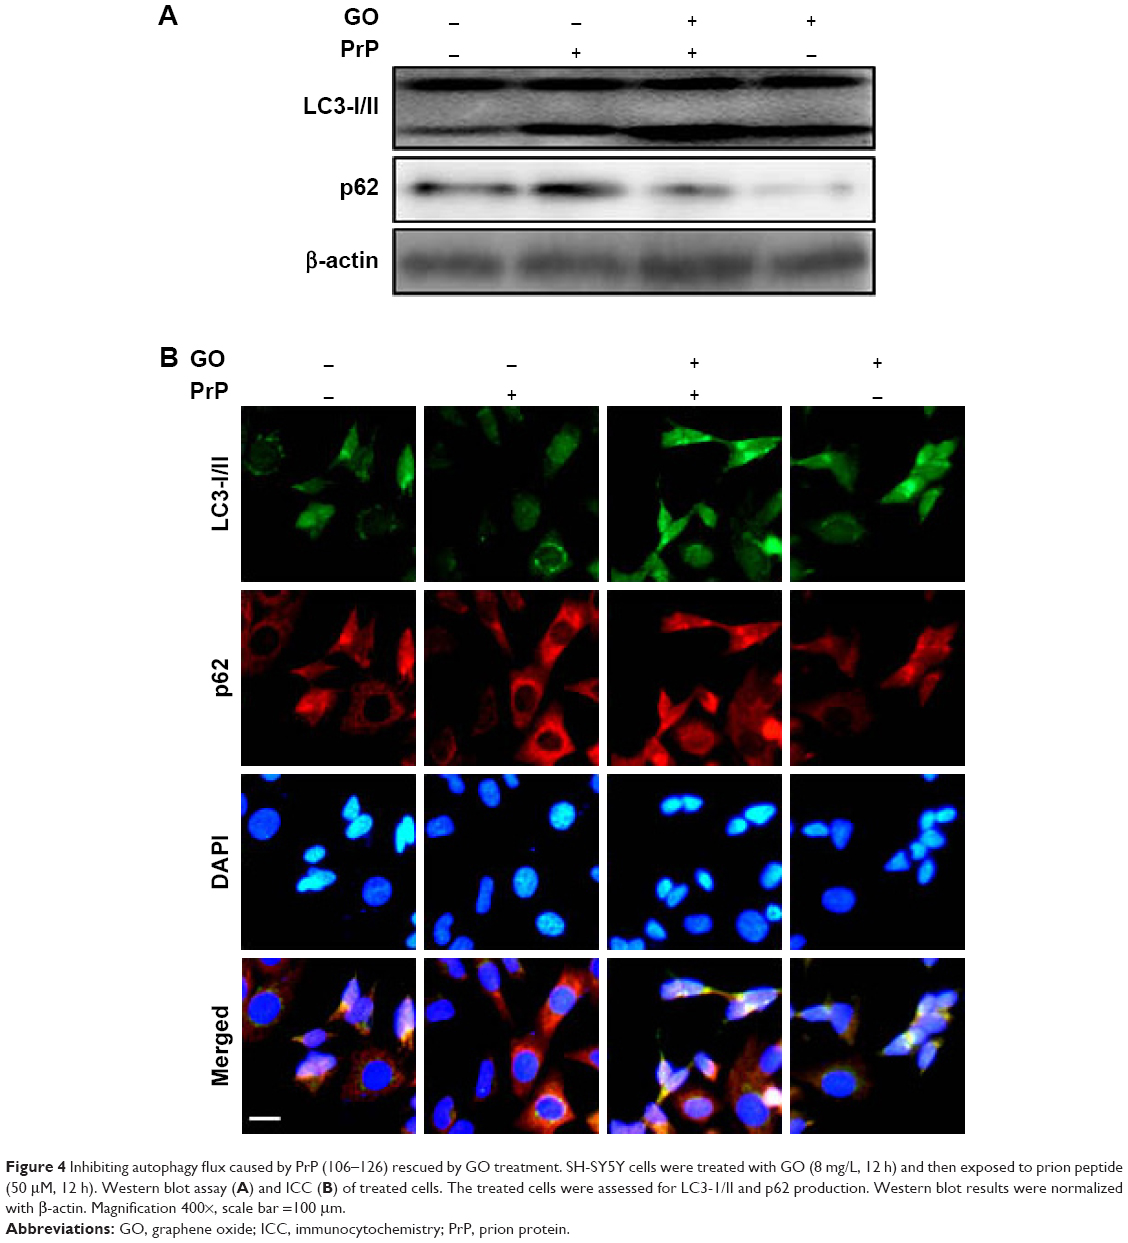 | Figure 4 Inhibiting autophagy flux caused by PrP (106–126) rescued by GO treatment. SH-SY5Y cells were treated with GO (8 mg/L, 12 h) and then exposed to prion peptide (50 μM, 12 h). Western blot assay (A) and ICC (B) of treated cells. The treated cells were assessed for LC3-1/II and p62 production. Western blot results were normalized with β-actin. Magnification 400×, scale bar =100 μm. |
Upregulation of autophagic flux induced by GO treatment protects SK-N-SH cells from PrP (106–126)-mediated mitochondrial neurotoxicity
We next wanted to determine whether upregulation of autophagic flux affected the protective effect of GO against PrP (106–126)-mediated mitochondrial neurotoxicity (Figure 5). SK-N-SH cells were pretreated with GO (12 h) with or without the autophagic flux inhibitor chloroquine (CQ, 10 μM, 12 h), and then exposed to 50 mM PrP (106–126) for 24 h. The number of annexin V-positive cells was decreased in groups co-treated with PrP (106–126) and GO compared to groups treated with PrP (106–126); the protective effect of GO was blocked by CQ treatment (Figure 5A and B). Consistent with these findings, results from the TUNEL assay showed that CQ treatment blocked the protective effect of GO on PrP (106–126)-treated cells (Figure 5C). Additionally, results from the JC-1 assay showed that CQ treatment blocked the protective effect of GO against PrP (106–126)-mediated mitochondrial damage (Figure 5D). Consistent with these results, a fluorescent polarization assay showed that CQ treatment increased the JC-1 green/red fluorescence intensity ratio compared to PrP (106–126)-exposed cells pretreated with GO (Figure 5E). These results were further confirmed by measuring the conversion of JC-1 by fluoroscopy (Figure 5F). We also found that treatment with CQ inhibited GO-mediated, autophagic flux signals (Figure 6A). In addition, we showed, by immunocytochemistry, that co-treatment with GO and PrP (106–126) increased LC3 and decreased p62 protein levels, indicative of autophagy activation, compared to treatment with PrP (106–126) alone (Figure 6B). Collectively, these data suggested that GO might prevent prion-induced mitochondrial neurotoxicity via upregulating autophagic flux.
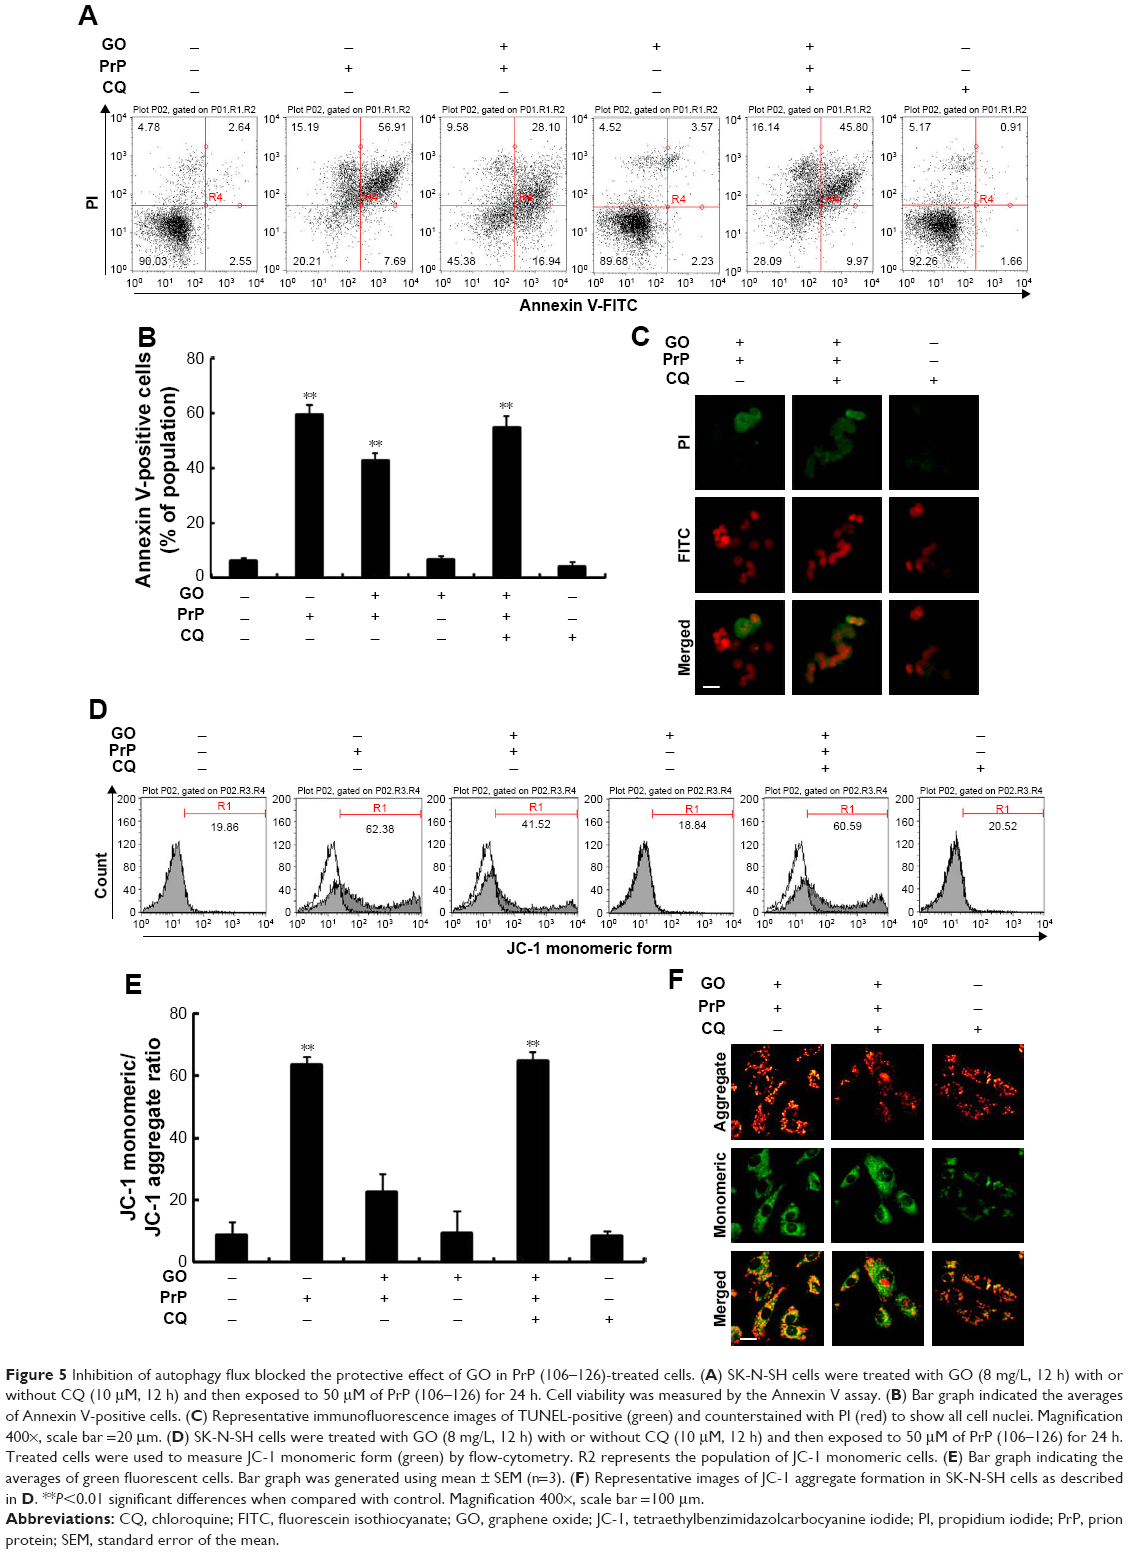 | Figure 5 Inhibition of autophagy flux blocked the protective effect of GO in PrP (106–126)-treated cells. (A) SK-N-SH cells were treated with GO (8 mg/L, 12 h) with or without CQ (10 μM, 12 h) and then exposed to 50 μM of PrP (106–126) for 24 h. Cell viability was measured by the Annexin V assay. (B) Bar graph indicated the averages of Annexin V-positive cells. (C) Representative immunofluorescence images of TUNEL-positive (green) and counterstained with PI (red) to show all cell nuclei. Magnification 400×, scale bar =20 μm. (D) SK-N-SH cells were treated with GO (8 mg/L, 12 h) with or without CQ (10 μM, 12 h) and then exposed to 50 μM of PrP (106–126) for 24 h. Treated cells were used to measure JC-1 monomeric form (green) by flow-cytometry. R2 represents the population of JC-1 monomeric cells. (E) Bar graph indicating the averages of green fluorescent cells. Bar graph was generated using mean ± SEM (n=3). (F) Representative images of JC-1 aggregate formation in SK-N-SH cells as described in D. **P<0.01 significant differences when compared with control. Magnification 400×, scale bar =100 μm. |
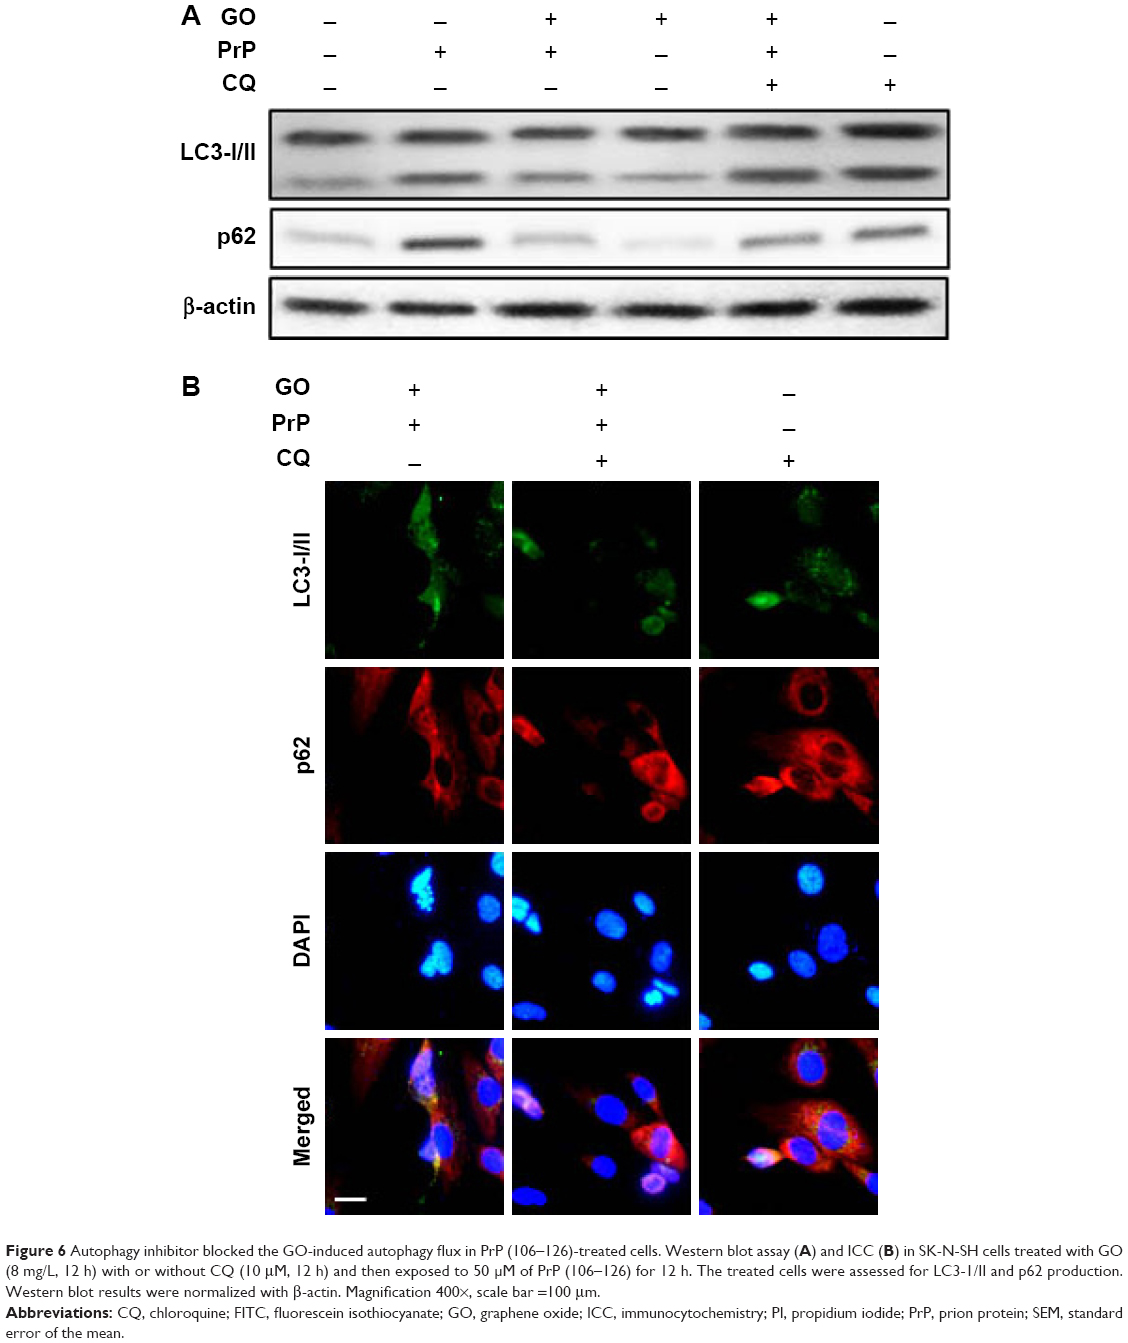 | Figure 6 Autophagy inhibitor blocked the GO-induced autophagy flux in PrP (106–126)-treated cells. Western blot assay (A) and ICC (B) in SK-N-SH cells treated with GO (8 mg/L, 12 h) with or without CQ (10 μM, 12 h) and then exposed to 50 μM of PrP (106–126) for 12 h. The treated cells were assessed for LC3-1/II and p62 production. Western blot results were normalized with β-actin. Magnification 400×, scale bar =100 μm. |
To verify that GO protects neuronal cells against PrP (106–126)-mediated mitochondrial damage via activation of autophagic flux, we knocked down an autophagy key factor, ATG5, in SH-SY5Y cells using an RNAi oligomer (si-ATG5). A negative control (NC) RNAi oligomer was used as a control (Figure 7). Immunoblotting showed that LC3-II protein levels were increased, and p62 protein levels were decreased in cells co-treated with PrP (106–126) and GO compared to NC cells treated with PrP (106–126) only (Figure 7A). However, si-ATG5 cells had increased p62 expression and decreased LC3-II expression that was not related to GO and PrP (106–126) treatment (Figure 7A). This result was confirmed by immunocytochemistry (Figure 7B).
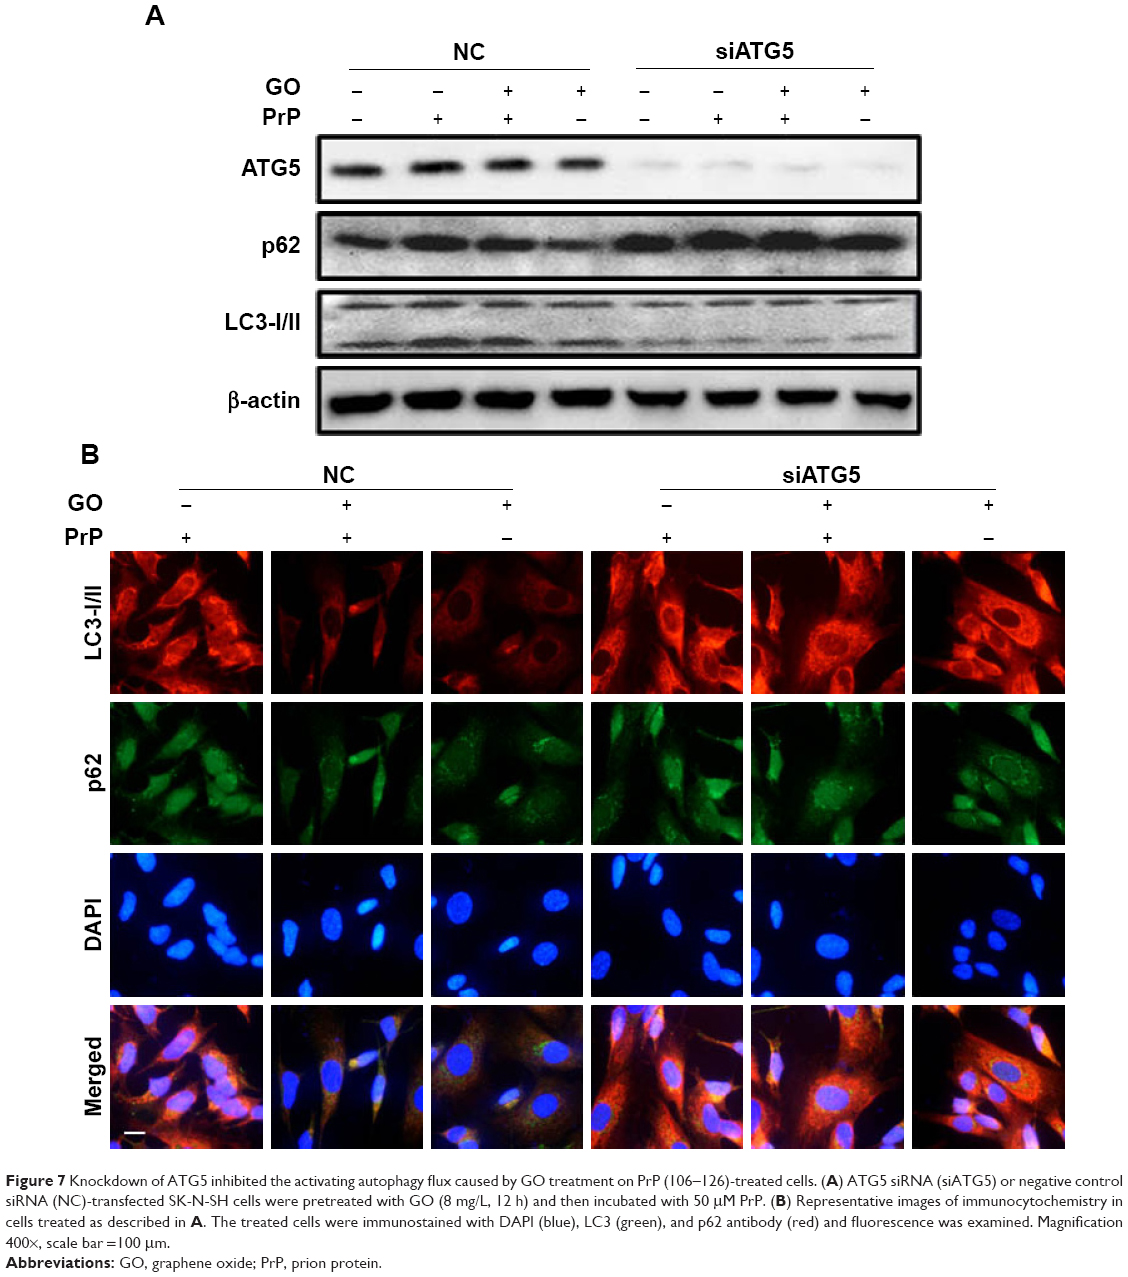 | Figure 7 Knockdown of ATG5 inhibited the activating autophagy flux caused by GO treatment on PrP (106–126)-treated cells. (A) ATG5 siRNA (siATG5) or negative control siRNA (NC)-transfected SK-N-SH cells were pretreated with GO (8 mg/L, 12 h) and then incubated with 50 μM PrP. (B) Representative images of immunocytochemistry in cells treated as described in A. The treated cells were immunostained with DAPI (blue), LC3 (green), and p62 antibody (red) and fluorescence was examined. Magnification 400×, scale bar =100 μm. |
Treatment with si-ATG5 attenuated the protective effect of GO on PrP (106–126)-induced neurotoxicity, as evident from the decreased number of annexin V positive cells (Figure 8A and B). Additionally, the effect of GO on PrP (106–126)-mediated induction of JC-1 monomer positive cell number as well as the JC-1 monomer/aggregate ratio was inhibited in SK-N-SH cells treated with ATG-5 siRNA (Figure 8C). Consistent with these results, fluorescence microscopy images showed that PrP (106–126)-treated cells fluoresced red (JC-1 aggregates form) after GO treatment (Figure 8D). Collectively, these results suggest that inhibition of autophagic flux blocked the protective effect of GO against PrP (106–126)-mediated neurotoxicity.
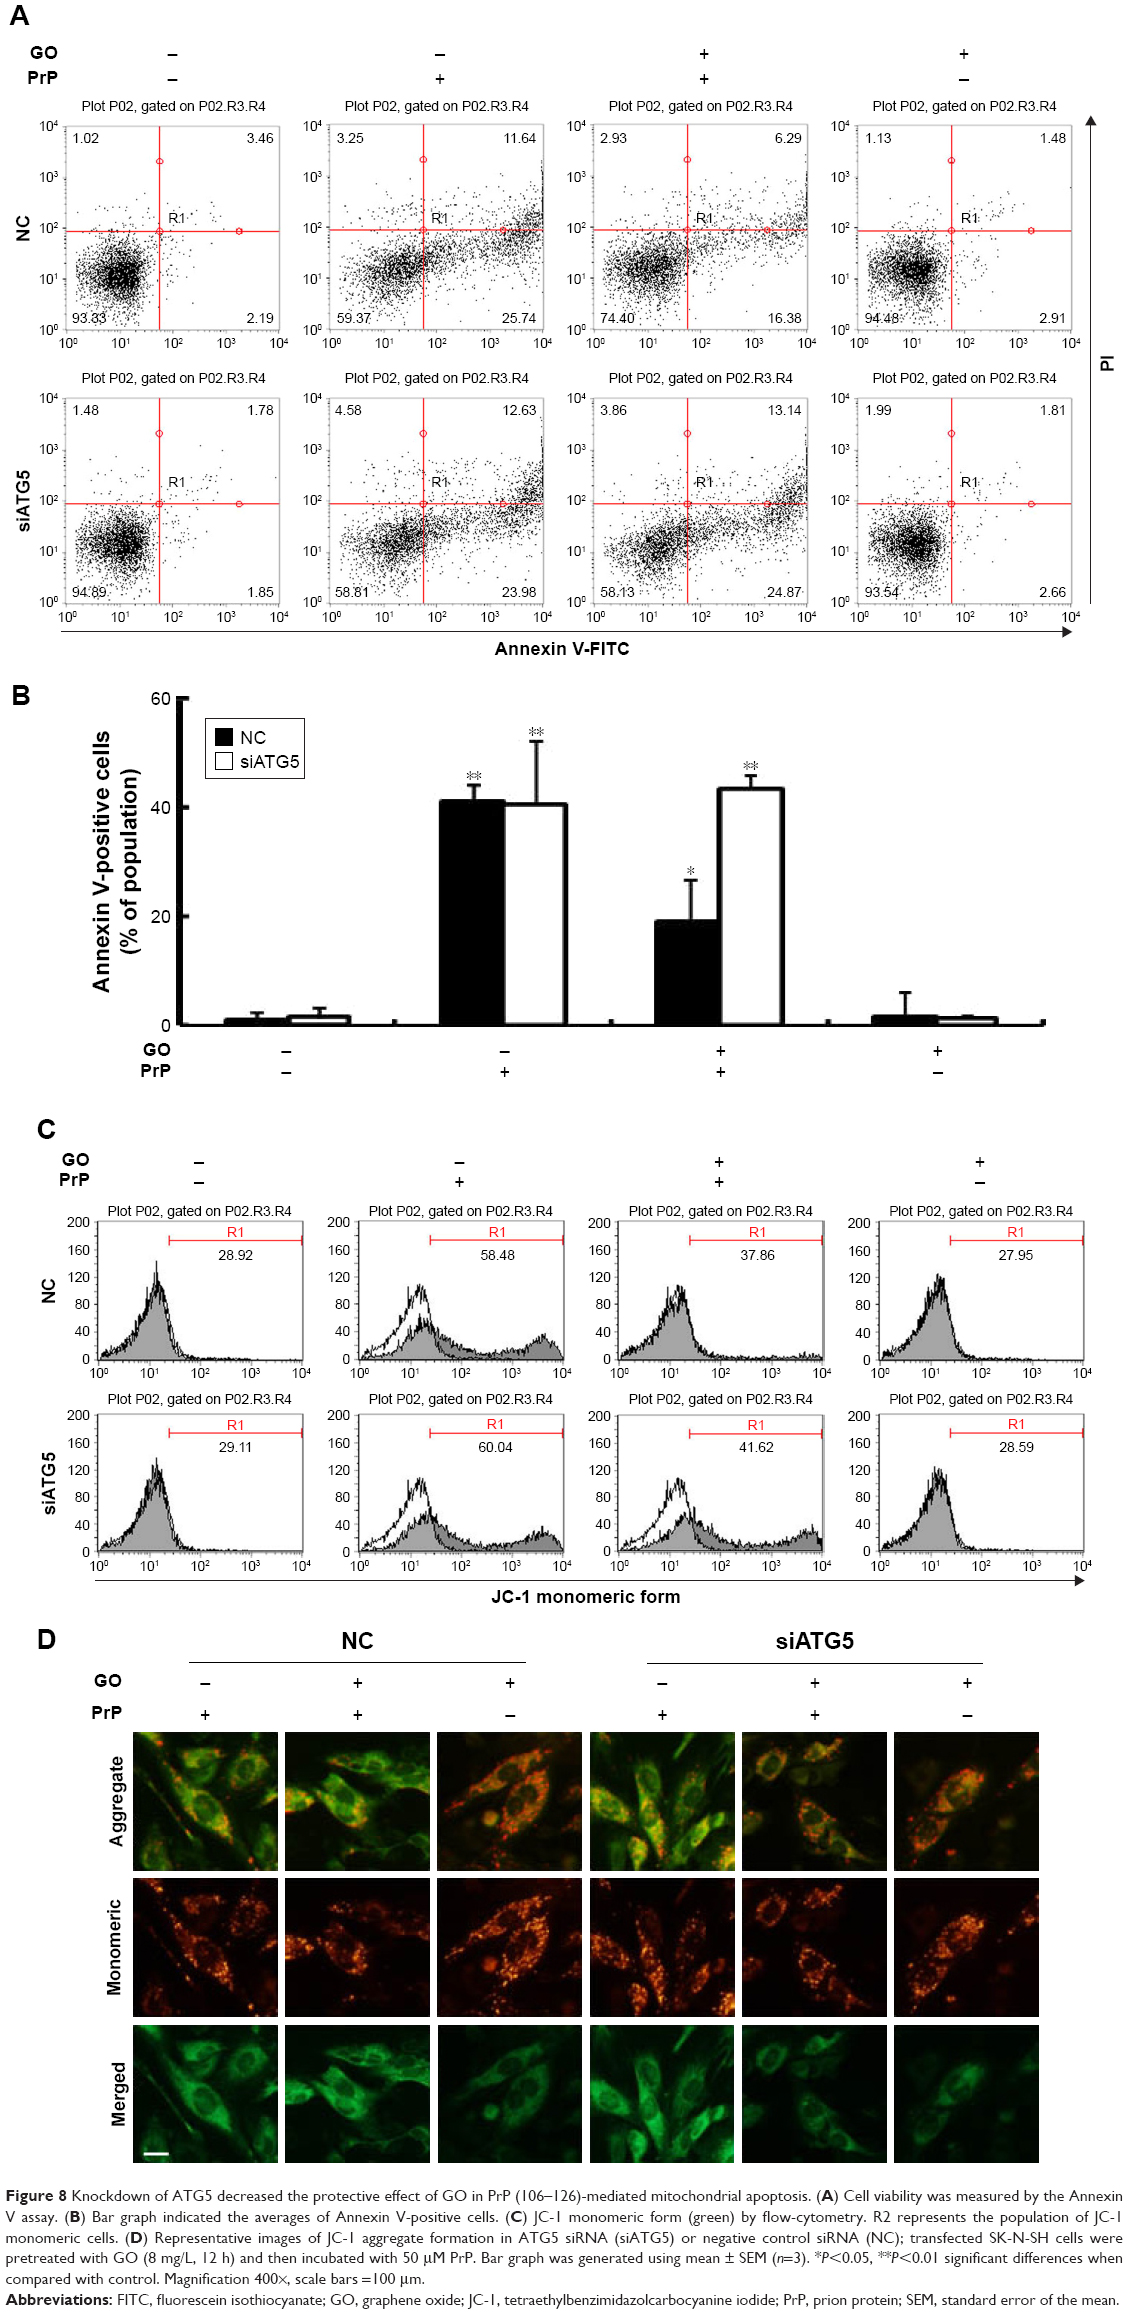 | Figure 8 Knockdown of ATG5 decreased the protective effect of GO in PrP (106–126)-mediated mitochondrial apoptosis. (A) Cell viability was measured by the Annexin V assay. (B) Bar graph indicated the averages of Annexin V-positive cells. (C) JC-1 monomeric form (green) by flow-cytometry. R2 represents the population of JC-1 monomeric cells. (D) Representative images of JC-1 aggregate formation in ATG5 siRNA (siATG5) or negative control siRNA (NC); transfected SK-N-SH cells were pretreated with GO (8 mg/L, 12 h) and then incubated with 50 μM PrP. Bar graph was generated using mean ± SEM (n=3). *P<0.05, **P<0.01 significant differences when compared with control. Magnification 400×, scale bars =100 μm. |
Discussion
The purpose of this study was to investigate whether the GO treatment prevents PrP (106–126)-mediated neurotoxicity, and if this protective effect is related to activation of autophagic flux. Our results suggest that GO treatment prevented prion-mediated mitochondrial neurotoxicity by activating autophagic flux. Notably, activation of autophagic flux due to GO treatment had neuroprotective properties.
Several lines of evidence support various roles for GO in the cellular response to proliferation, antioxidation, and antitumor effects.14,15 In particular, GO promotes differentiation of mouse stem cells to dopaminergic neurons.39 Furthermore, a recent study showed that cellular oxidative damage caused by exposure to X-rays is inhibited by GO treatment.40 Maintenance of mitochondrial homeostasis and protection against oxidative stress may be the main therapeutic strategy for prevention of progression in neurodegenerative diseases, including Alzheimer’s and prion disease.41–43 Recent studies have suggested that the activating autophagic flux prevents prion-mediated neurotoxicity via protection of mitochondrial function and prevention of oxidative stress.12,43 Consistent with this finding, we have shown here that PrP (106–126)-treated cells have reduced viability (Figure 3A–C) and MTP values, indicating mitochondrial damage (Figure 3D–F). However, neurotoxicity (Figure 3A–C) and mitochondrial damage (Figure 3D–F) due to PrP (106–126) exposure was decreased by GO treatment. These data support the hypothesis that GO treatment may prevent prion-mediated neurotoxicity by inhibition of mitochondrial malfunction.
Autophagy is the main lysosomal degradation pathway for recycling intracellular organelles.1,4 The main function of autophagy is facilitation of immune activation and protection from neuronal damage, including ischemic injury and neurodegeneration.44 Regulation of autophagic flux is thought to play a major role in the prevention of neurodegenerative diseases through protection against mitochondrial dysfunction.34,41 Some reports suggest that agents that induce autophagy prevent neurodegenerative diseases, including Parkinson’s and Alzheimer’s disease, by regulation of mitochondrial function.41–43 GO is known to induce autophagic flux in some cells and tissues.15 Our results showed that GO treatment could induce autophagic flux and increase the fusion of autophagosomes and lysosomes (Figure 2B and C). These observations suggest that GO treatment may prevent prion-mediated mitochondrial neurotoxicity via activation of autophagy. However, the influence of GO-induced autophagy in prion-mediated neurotoxicity has not yet been reported.
In this study, we examined the effect of GO-related autophagic flux on PrP (106–126)-mediated mitochondrial neurotoxicity. The results of this study showed that the protective effect of GO against PrP (106–126)-induced mitochondrial damage was blocked by autophagy inhibitor CQ (Figure 5). GO-treated cells had increased autophagy marker LC3-II protein levels and decreased p62 protein levels, indicating autophagy activation (Figures 2, 4, and 6). GO treatment also protected SK-N-SH cells from PrP (106–126) treatment (Figures 3, 5, and 8). However, the protective effect of GO treatment was blocked by autophagy inhibitor CQ or ATG5 RNAi oligomer treatment (Figures 5 and 8). Furthermore, both CQ and ATG5 RNAi treatment increased LC3-II and p62 protein levels, indicating inhibition of autophagic flux (Figure 6). These data strongly support the hypothesis that GO protects neuronal cells from prion-mediated mitochondrial neurotoxicity via upregulation of autophagic flux.
This is the first study showing that GO induces autophagy in neuronal cells and that GO-induced autophagic flux has a neuroprotective effect against prion-mediated mitochondrial neurotoxicity. However, the mechanism by which GO mediates neuroprotection through activation of autophagic flux is unclear. Whether GO treatment causes upregulation of autophagic flux in neurodegenerative disorders, including Alzheimer’s and prion disease, is also questionable. Further study will be necessary to assess the mechanism of GO-mediated activation of autophagy flux in prion-mediated neurotoxicity in vitro and/or in vivo. Taken together, these results collectively suggest that exposure to GO prevented PrP (106–126)-mediated mitochondrial neurotoxicity by upregulation of autophagy activation in cells. These results also suggest that GO might have use in neuroprotective strategies for neurodegenerative diseases, including prion diseases.
Acknowledgment
This study was supported by a grant from the National Research Foundation of Korea (NRF), funded by the Korean Government (2016R1A2B2009293).
Disclosure
The authors report no conflicts of interest in this work.
References
Glick D, Barth S, Macleod KF. Autophagy: cellular and molecular mechanisms. J Pathol. 2010;221(1):3–12. | ||
Qin L, Wang Z, Tao L, Wang Y. ER stress negatively regulates AKT/TSC/mTOR pathway to enhance autophagy. Autophagy. 2010;6(2):239–247. | ||
Kapuy O, Vinod PK, Banhegyi G. mTOR inhibition increases cell viability via autophagy induction during endoplasmic reticulum stress – an experimental and modeling study. FEBS Open Bio. 2014;4:704–713. | ||
Tanida I. Autophagosome formation and molecular mechanism of autophagy. Antioxid Redox Signal. 2011;14(11):2201–2214. | ||
Kadowaki M, Karim MR. Cytosolic LC3 ratio as a quantitative index of macroautophagy. Methods Enzymol. 2009;452:199–213. | ||
Karim MR, Kanazawa T, Daigaku Y, Fujimura S, Miotto G, Kadowaki M. Cytosolic LC3 ratio as a sensitive index of macroautophagy in isolated rat hepatocytes and H4-II-E cells. Autophagy. 2007;3(6):553–560. | ||
Kuusisto E, Salminen A, Alafuzoff I. Early accumulation of p62 in neurofibrillary tangles in Alzheimer’s disease: possible role in tangle formation. Neuropathol Appl Neurobiol. 2002;28(3):228–237. | ||
Mizumura K, Choi AM, Ryter SW. Emerging role of selective autophagy in human diseases. Front Pharmacol. 2014;5:244. | ||
Buckley KM, Hess DL, Sazonova IY, et al. Rapamycin up-regulation of autophagy reduces infarct size and improves outcomes in both permanent MCAL, and embolic MCAO, murine models of stroke. Exp Transl Stroke Med. 2014;6:8. | ||
Ruivo R, Anne C, Sagne C, Gasnier B. Molecular and cellular basis of lysosomal transmembrane protein dysfunction. Biochim Biophys Acta. 2009;1793(4):636–649. | ||
Wang H, Wang Y, Li D, et al. VEGF inhibits the inflammation in spinal cord injury through activation of autophagy. Biochem Biophys Res Commun. 2015;464(2):453–458. | ||
Jeong JK, Moon MH, Lee YJ, Seol JW, Park SY. Melatonin-induced autophagy protects against human prion protein-mediated neurotoxicity. J Pineal Res. 2012;53(2):138–146. | ||
Chen GY, Yang HJ, Lu CH, et al. Simultaneous induction of autophagy and toll-like receptor signaling pathways by graphene oxide. Biomaterials. 2012;33(27):6559–6569. | ||
Chen GY, Meng CL, Lin KC, et al. Graphene oxide as a chemosensitizer: diverted autophagic flux, enhanced nuclear import, elevated necrosis and improved antitumor effects. Biomaterials. 2015;40:12–22. | ||
Chen GY, Chen CL, Tuan HY, et al. Graphene oxide triggers toll-like receptors/autophagy responses in vitro and inhibits tumor growth in vivo. Adv Healthc Mater. 2014;3(9):1486–1495. | ||
Yamashita K, Yoshioka Y, Higashisaka K, et al. Silica and titanium dioxide nanoparticles cause pregnancy complications in mice. Nat Nanotechnol. 2011;6(5):321–328. | ||
Wei D, Kivioja J. Graphene for energy solutions and its industrialization. Nanoscale. 2013;5(21):10108–10126. | ||
Byun J. Emerging frontiers of graphene in biomedicine. J Microbiol Biotechnol. 2015;25(2):145–151. | ||
Perrozzi F, Prezioso S, Ottaviano L. Graphene oxide: from fundamentals to applications. J Phys Condens Matter. 2015;27(1):013002. | ||
Li Y, Dong H, Li Y, Shi D. Graphene-based nanovehicles for photodynamic medical therapy. Int J Nanomed. 2015;10:2451–2459. | ||
Spencer DS, Puranik AS, Peppas NA. Intelligent nanoparticles for advanced drug delivery in cancer treatment. Curr Opin Chem Eng. 2015;7:84–92. | ||
Chew SA, Danti S. Biomaterial-based implantable devices for cancer therapy. Adv Healthc Mater. 2017;6(2):1600766. | ||
Mohapatra S, Saha A, Mondal P, et al. Synergistic anticancer effect of peptide-docetaxel nanoassembly targeted to tubulin: toward development of dual warhead containing nanomedicine. Adv Healthc Mater. 2017;6(2):1600718. | ||
Yu J, Lin YH, Yang L, et al. Improved anticancer photothermal therapy using the bystander effect enhanced by antiarrhythmic peptide conjugated dopamine-modified reduced graphene oxide nanocomposite. Adv Healthc Mater. 2017;6(2):1600804. | ||
Zhang B, Fan L, Zhong H, Liu Y, Chen S. Graphene nanoelectrodes: fabrication and size-dependent electrochemistry. J Am Chem Soc. 2013;135(27):10073–10080. | ||
Lee WC, Lim CH, Shi H, et al. Origin of enhanced stem cell growth and differentiation on graphene and graphene oxide. ACS Nano. 2011;5(9):7334–7341. | ||
Tu Q, Pang L, Chen Y, et al. Effects of surface charges of graphene oxide on neuronal outgrowth and branching. Analyst. 2014;139(1):105–115. | ||
Prusiner SB. Prions. Proc Natl Acad Sci USA. 1998;95(23):13363–13383. | ||
Wickner RB. Prion diseases: infectivity versus toxicity. Nature. 2011;470(7335):470–471. | ||
Freixes M, Rodriguez A, Dalfo E, Ferrer I. Oxidation, glycoxidation, lipoxidation, nitration, and responses to oxidative stress in the cerebral cortex in Creutzfeldt-Jakob disease. Neurobiol Aging. 2006;27(12):1807–1815. | ||
Avrahami D, Gabizon R. Age-related alterations affect the susceptibility of mice to prion infection. Neurobiol Aging. 2011;32(11):2006–2015. | ||
Hara H, Okemoto-Nakamura Y, Shinkai-Ouchi F, Hanada K, Yamakawa Y, Hagiwara K. Mouse prion protein (PrP) segment 100 to 104 regulates conversion of PrPC to PrPSc in prion-infected neuroblastoma cells. J Virol. 2012;86(10):5626–5636. | ||
Sim VL. Prion disease: chemotherapeutic strategies. Infect Disord Drug Targets. 2012;12(2):144–160. | ||
Jeong JK, Moon MH, Lee YJ, Seol JW, Park SY. Autophagy induced by the class III histone deacetylase Sirt1 prevents prion peptide neurotoxicity. Neurobiol Aging. 2013;34(1):146–156. | ||
Jeong JK, Seo JS, Moon MH, Lee YJ, Seol JW, Park SY. Hypoxia-inducible factor-1 alpha regulates prion protein expression to protect against neuron cell damage. Neurobiol Aging. 2012;33(5):1006.e1–e10. | ||
Pellegrino MW, Haynes CM. Mitophagy and the mitochondrial unfolded protein response in neurodegeneration and bacterial infection. BMC Biol. 2015;13:22. | ||
Xu H, Fan M, Elhissi AM, et al. PEGylated graphene oxide for tumor-targeted delivery of paclitaxel. Nanomedicine (Lond). 2015;10(8):1247–1262. | ||
Sydlik SA, Jhunjhunwala S, Webber MJ, Anderson DG, Langer R. In vivo compatibility of graphene oxide with differing oxidation states. ACS Nano. 2015;9(4):3866–3874. | ||
Yang D, Li T, Xu M, et al. Graphene oxide promotes the differentiation of mouse embryonic stem cells to dopamine neurons. Nanomedicine (Lond). 2014;9(16):2445–2455. | ||
Qiao Y, Zhang P, Wang C, Ma L, Su M. Reducing x-ray induced oxidative damages in fibroblasts with graphene oxide. Nanomaterials (Basel). 2014;4(2):522–534. | ||
Kamat PK, Kalani A, Kyles P, Tyagi SC, Tyagi N. Autophagy of mitochondria: a promising therapeutic target for neurodegenerative disease. Cell Biochem Biophys. 2014;70(2):707–719. | ||
Pan Y, Sun L, Wang J, et al. STI571 protects neuronal cells from neurotoxic prion protein fragment-induced apoptosis. Neuropharmacology. 2015;93:191–198. | ||
Choi HS, Choi YG, Shin HY, et al. Dysfunction of mitochondrial dynamics in the brains of scrapie-infected mice. Biochem Biophys Res Commun. 2014;448(2):157–162. | ||
Alirezaei M, Kemball CC, Whitton JL. Autophagy, inflammation and neurodegenerative disease. Eur J Neurosci. 2011;33(2):197–204. |
 © 2017 The Author(s). This work is published and licensed by Dove Medical Press Limited. The full terms of this license are available at https://www.dovepress.com/terms.php and incorporate the Creative Commons Attribution - Non Commercial (unported, v3.0) License.
By accessing the work you hereby accept the Terms. Non-commercial uses of the work are permitted without any further permission from Dove Medical Press Limited, provided the work is properly attributed. For permission for commercial use of this work, please see paragraphs 4.2 and 5 of our Terms.
© 2017 The Author(s). This work is published and licensed by Dove Medical Press Limited. The full terms of this license are available at https://www.dovepress.com/terms.php and incorporate the Creative Commons Attribution - Non Commercial (unported, v3.0) License.
By accessing the work you hereby accept the Terms. Non-commercial uses of the work are permitted without any further permission from Dove Medical Press Limited, provided the work is properly attributed. For permission for commercial use of this work, please see paragraphs 4.2 and 5 of our Terms.