")
Back to Journals » Journal of Hepatocellular Carcinoma » Volume 9
Autoantibody Against Ferritin Light Chain is a Serum Biomarker for the Detection of Liver Cirrhosis but Not Liver Cancer
Authors Ren P , Wang K, Ma J, Cao X, Zhao J, Zhao C, Guo Y , Ye H
Received 8 December 2021
Accepted for publication 18 March 2022
Published 29 March 2022 Volume 2022:9 Pages 221—232
DOI https://doi.org/10.2147/JHC.S352057
Checked for plagiarism Yes
Review by Single anonymous peer review
Peer reviewer comments 2
Editor who approved publication: Prof. Dr. Imam Waked
Pengfei Ren,1,2,* Keyan Wang,3,* Jie Ma,1,2 Xiaoqin Cao,4 Jiuzhou Zhao,1,2 Chengzhi Zhao,1,2 Yongjun Guo,1,2 Hua Ye5,6
1Department of Molecular Pathology, The Affiliated Cancer Hospital of Zhengzhou University, Henan Cancer Hospital, Zhengzhou, People’s Republic of China; 2Henan Key Laboratory of Molecular Pathology, Zhengzhou, People’s Republic of China; 3Henan Institute of Medical and Pharmaceutical Sciences, Zhengzhou University, Zhengzhou, People’s Republic of China; 4Department of Cancer Epidemiology, The Affiliated Cancer Hospital of Zhengzhou University, Henan Cancer Hospital, Zhengzhou, People’s Republic of China; 5College of Public Health, Zhengzhou University, Zhengzhou, People’s Republic of China; 6Henan Key Laboratory of Tumor Epidemiology and State Key Laboratory of Esophageal Cancer Prevention & Treatment, Zhengzhou University, Zhengzhou, People’s Republic of China
*These authors contributed equally to this work
Correspondence: Yongjun Guo, Department of Molecular Pathology, The Affiliated Cancer Hospital of Zhengzhou University, 127 Dongming Road, Zhengzhou, 450008, People’s Republic of China, Fax +86 371 65587506 Email [email protected] Hua Ye, College of Public Health, Zhengzhou University, 100 Science Avenue, Zhengzhou, 450001, People’s Republic of China, Fax +86 371 67781248, Email [email protected]
Purpose: Ferritin is a protein that plays an important role in iron metabolism, it consists of two subunits: heavy chain (FTH) and light chain (FTL). Elevated expression of FTL is observed in multiple malignancies. Recent studies have found that the frequency of circulating autoantibody against FTL (anti-FTL) increased significantly in hepatocellular carcinoma (HCC). The aim of this study is to verify circulating anti-FTL as a biomarker for the early detection of HCC.
Patients and Methods: A total of 1565 participants were enrolled and assigned to two independent validation cohorts, including 393 HCC patients, 379 liver cirrhosis (LC) patients, 400 chronic hepatitis (CH) patients, and 393 healthy subjects. The concentration of serum anti-FTL was measured by indirect Enzyme-Linked Immunosorbent Assay (ELISA). Kruskal–Wallis test was used to compare anti-FTL concentrations between HCC group and three control groups. Percentile 95 of anti-FTL absorbance value of healthy group was selected as the cut-off value to calculate the positive rate in each group. The area under receiver operating characteristic curve (AUC) was used to quantitatively describe its diagnostic value.
Results: The median concentration of anti-FTL in HCC patients was higher than that in CH patients and healthy subjects, but there was no difference between HCC patients and LC patients. Further analysis showed that there was no difference between early stage LC, advanced stage LC, Child-Pugh A HCC, Child-Pugh B HCC and Child-Pugh C HCC. The positive rate of anti-FTL was 12.2% (48/393) in HCC, 13.5% (51/379) in LC, 6.3% (25/400) in CH and 5.1% (20/393) in healthy subjects, respectively. The AUC of anti-FTL to distinguish LC from CH or healthy subjects were 0.654 (95% CI: 0.615– 0.692) and 0.642 (95% CI: 0.602– 0.681), respectively.
Conclusion: Anti-FTL is not a biomarker for the early diagnosis of HCC due to specificity deficiency, but may be helpful for the early detection of LC.
Keywords: biomarker, ferritin light chain, hepatocellular carcinoma, liver cirrhosis, tumor-associated antigen
Introduction
Hepatocellular carcinoma (HCC) is the sixth most common malignancy in the world,1 early diagnosis of HCC followed by curative treatment is critical for improving the prognosis and long-term survival. Surveillance with abdominal ultrasound with or without alpha-fetoprotein (AFP) is recommended by current clinical guidelines to detect HCC in high-risk populations.2–4 Although the combination of AFP and ultrasound showed the sensitivity as high as 96% with a specificity of 85% for HCC detection, as reported in a meta-analysis,2 these studies often included patients with all stages of HCC but not early-stage HCC. For small HCC with a diameter less than 2 cm, it is difficult to be detected by ultrasound, as the image is often different from typical ones, especially in the background of cirrhosis, resulting in the diagnostic sensitivity as low as 39%-65%.5 Besides, AFP values vary according to the tumor size, the sensitivity of AFP decreased from 52% for HCC > 3 cm to 25% for those < 3 cm in diameter.6–8 For the diagnosis of early-stage HCC, the sensitivity and specificity of the combination test decreased to 63% (95CI 48–75%) and 45% (95% CI 30–62%), respectively.9 So many new serological biomarkers have been identified and evaluated, such as genetic biomarkers, proteins, and metabolic biomarkers.10,11 Protein induced by vitamin K absence or antagonist-II (PIVKA-II) is a promising biomarker and has been evaluated extensively,12,13 it was reported that the sensitivity is 66% (95% CI 65–68%) with a specificity of 84% (95% CI 83–85%) in a meta-analysis result.13 But PIVKA-II level is positively correlated with the tumor size,14 the diagnostic sensitivity is only 55% with a specificity of 82% for small HCC.15 None of these biomarkers was ideal in clinical practice. Therefore, new biomarkers are continuing to be explored for the diagnosis of HCC at a very early stage.
Stimulation from a very small amount of tumor antigen may lead to the generation of a large amount of autoantibodies in the circulating blood.16 Thus, autoantibodies against tumor-associated antigens (anti-TAAs) are potential biomarkers for the ultra-early diagnosis of HCC.
Ferritin is a protein composed of 24 subunits containing heavy chains (H-ferritin) and light chains (FTL), which not only functions as the primary iron storage protein, but also plays roles in proliferation, angiogenesis and immunosuppression.17 In recent years, more and more studies have shown that the expression level of FTL is elevated in several solid tumor tissues, and elevated expression is associated with a poor prognosis.18–25 It plays an important role in the immune microenvironment of HCC.18 In one of our previous studies, it was found that FTL is a candidate TAA identified by serological analysis of recombinant cDNA expression library (SEREX), the occurrence frequency of autoantibody against ferritin light chain (anti-FTL) in sera of HCC was higher than that of control samples such as benign liver disease and normal control sera.26 In order to verify whether FTL is a HCC associated antigen and whether anti-FTL can be used as a biomarker for the early diagnosis of HCC, two independent cohorts were set up to describe the frequencies of anti-FTL in HCC patients and multiple controls including patients with liver cirrhosis (LC), patients with chronic hepatitis (CH) and healthy individuals (NC).
Patients and Methods
Patients and Serum Samples
This study consisted of 1717 subjects, including 467 cases of HCC, 379 cases of LC, 400 cases of CH and 471 healthy individuals. All the sera samples were obtained from two biobanks, which are The Serum BBank of Tumor Epidemiology Laboratory of Zhengzhou University and The Center of Bio-Repository, The Affiliated Cancer Hospital of Zhengzhou University (Henan Cancer Hospital). All HCC patients were confirmed by histopathological diagnosis and sera samples were collected before any treatment such as surgery, chemotherapy or radiotherapy. LC and CH patients were inpatients diagnosed without malignancy or autoimmune diseases. NC were adults during annual health examinations in people who had no obvious evidence of malignancy or liver disease.
In the validation cohort, 366 subjects were enrolled including 97 HCC patients, 83 LC patients, 89 CH patients and 97 healthy individuals. The HCC group and NC group were matched 1:1 according to the gender and age (±3 years).
In the extension cohort, 1199 subjects were enrolled including 296 HCC patients, 296 LC patients, 311 CH patients and 296 healthy individuals. The HCC group, LC group and NC group were matched 1:1:1 according to the gender and age (±3 years).
Written informed consent was obtained from all participants, and this study was approved by the Medical Ethics Committee of Zhengzhou University (ZZURIB 2019-001). We confirmed that this study was conducted in accordance with the Declaration of Helsinki.
FTL Recombinant Protein Expression and Purification
Full length cDNA of FTL was cloned into the pET 30a (+) expression vector, then the recombinant expression plasmid was transformed into E. coli BL21 (DE3) cells to express a fusion protein with N-terminal 6×histidine tag. Utilizing nickel column chromatography, the recombinant FTL protein was purified and further verified by Western blot utilizing anti-Ferritin light chain antibody (Abcam, USA).
Enzyme-Linked Immunosorbent Assay (ELISA)
Anti-FTL was measured by ELISA, as described in our previous studies.27,28 In brief, recombinant protein FTL was coated on 96-well microtiter plates at 4 °C overnight, with a final concentration of 1.0 μg/mL. After blocking with 2% Bovine Serum Albumin (BSA), sera samples diluted at 1:100 were added into the antigen-coated wells and incubated for 2 h at room temperature, followed by incubation with HRP-conjugated goat anti-human IgG for 1h at room temperature, an EL-ABTS chromogenic reagent kit (Sangon Biotech (Shanghai) Co., Ltd, Shanghai, China) was used as the manufacturer′s instructions. Optical density (OD) was measured at 405 nm wavelength. Eight normal sera samples were repeatedly test on each plate, and the mean value of OD was used to normalize the data of different plates. Samples of each cohort were test at a same batch with same operators and a same batch of reagents.
Serum FTL concentration was measured by Human FTL (Ferritin light chain) ELISA Kit (Wuhan Fine Biotech Co., Ltd, Wuhan, China). The procedure was performed according to the manufacturer′s instructions: Before started, wells of standard, test samples and blank control were set on the pre-coated plate; Step 1, 100 μL diluted sera or standards were added into each well of the pre-coated plate with a dilution ratio at 1:100 and incubate for 90 minutes at 37 °C, aspirate and wash plated with wash buffer for 2 times; Step 2, 100 μL Biotin-labeled antibody was added into above wells and incubate for 60 minutes at 37°C, aspirate and wash plates with wash buffer for 3 times; Step 3, 100 μL HRP-Streptavidin conjugate working solution was added into each well, cover the plate and incubate for 30 minutes at 37°C, aspirate and wash plates 5 times; Step 4, 90 μL TMB substrate solution was added into each well, cover the plate and incubated for 10–20 minutes at 37°C; Step 5, 50 μL stop solution was added into each well to terminate the chromogenic reaction, the color will turn yellow immediately; Step 6, read the OD at 450 nm in microplate reader immediately after adding the stop solution. The standard curve was plotted as the relative OD of each standard solution (Y) versus the respective concentration of the standard solution (X), the target concentration of the samples was interpolated from the standard curve.
RNA Sequencing (RNA-Seq) of FTL Gene Expression Level in Tissues
The expression level of FTL gene in HCC and normal liver tissues were downloaded from The Cancer Genome Atlas (TCGA). All the tissue samples were tested by RNA-Seq. The database contained information on 371 cases of HCC, of which there were 50 pairs of HCC tissues and self-matched para-cancerous tissues. The raw data of FTL gene expression were normalized and are log2(x+1) transformed.
Prognosis Analysis
Survival analysis was performed to explore whether elevated FTL expression is related to the prognosis of HCC patients. A total of 364 cases of HCC were enrolled in the survival analysis, including 253 patients at stage I–II with OS information, 87 patients at stage III–IV with OS information and 228 patients at stage I–II have recurrence-free survival (RFS) information. The expression level of FTL gene in HCC tissues and prognosis information were originally obtained from TCGA database (https://cancergenome.nih.gov/), and the survival analysis was performed by Kaplan-Meier Plotter, which is a public database (http://kmplot.com/analysis/). Kaplan-Meier curves, Log rank test and univariate proportional hazards regression model were used to analyze correlations between FTL levels and OS and RFS by online tools at this website.
Statistical Analysis
Differences of anti-FTL titers among multiple groups were analyzed by Kruskal–Wallis test, and the difference between each two groups was analyzed by Mann–Whitney U-test. The Percentile 95 (P95) of OD value in normal group was set as the cutoff value, differences of the positive rates among different groups were analyzed by Chi-Square test. Diagnostic values of anti-FTL in differentiating HCC and controls was measured by area under ROC (AUC) calculated from Receiver Operating Characteristic curve (ROC) analysis. Differences of FTL mRNA levels and serum FTL protein levels between HCC and NC were both analyzed by t-test. GraphPad Prism 6.0, SPSS 21.0 and MedCalc 15.0 were used to perform analysis and visualize the data. P < 0.05 was considered statistically significant.
Correlation analysis: To analyze the correlation between FTL antigen and anti-FTL autoantibody, both concentrations were measured simultaneously in 74 cases of HCC. Correlation analysis was performed in two ways. At first step, scatter plot and line regression were performed, and Pearson correlation coefficient was calculated; Then HCC patients were divided into high, medium and low groups according to serum anti-FTL autoantibody concentration, using Percentile 25 and Percentile 75 as cut-off points, the difference of serum FTL antigen concentration between high, medium and low groups was compared by Kruskal–Wallis test.
Results
Overall Study Design and Baseline Characteristics of Participants
The overall design of this study was shown in Figure 1, two independent cohorts were set up to test the frequency of serum anti-FTL in HCC patients and controls. Baseline characteristics of HCC patients and controls were shown in Table 1.
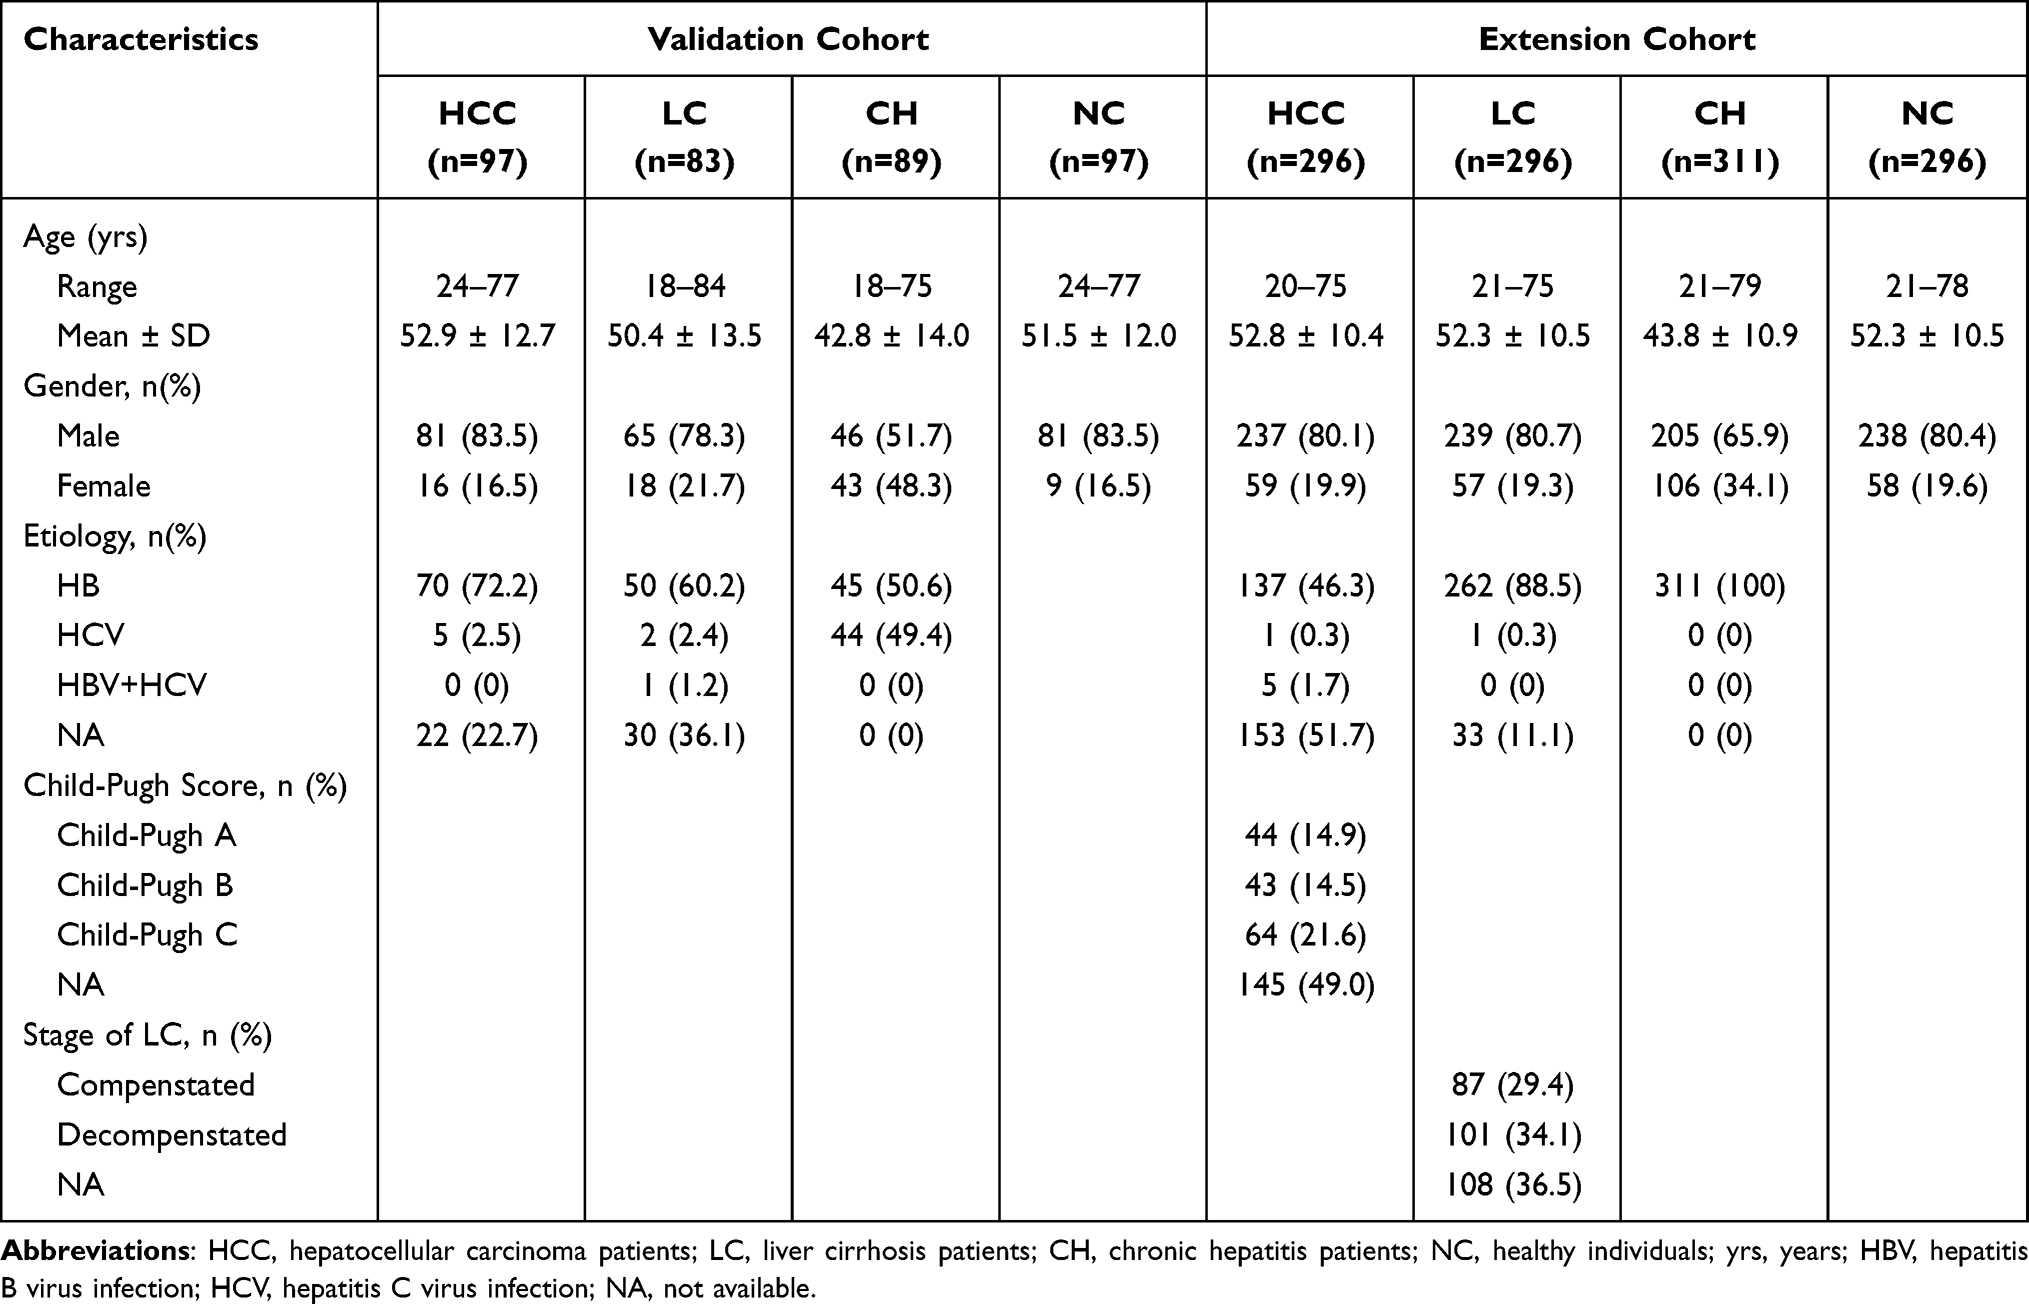 |
Table 1 Baseline Characteristics of Two Cohorts |
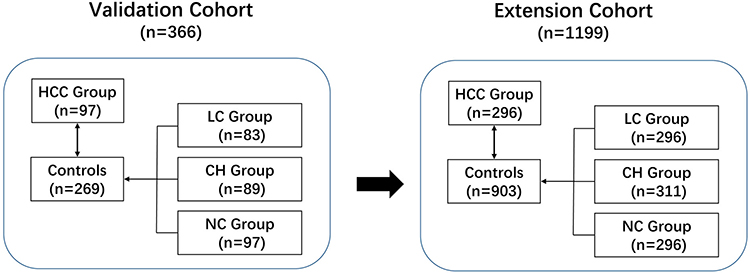 |
Figure 1 Overall study design. Abbreviations: HCC, hepatocellular carcinoma; LC, liver cirrhosis; CH, chronic hepatitis; NC, healthy individuals; n, participant numbers; anti-FTL, autoantibody against Ferritin light chain. |
The Titer of Circulating Anti-FTL Was Elevated in HCC and LC
In both the validation cohort and the extension cohort, the titer of circulating anti-FTL was elevated in HCC patients compared with the whole control population (both P < 0.05). When all the controls were divided into three subgroups including NC group, CH group and LC group, it was found that the median titer of anti-FTL in HCC group was obviously higher than that in NC group in both cohorts (all P < 0.01). Although there was no difference of the anti-FTL titer between HCC group and CH group in validation cohort because of small sample size (P = 0.058), the anti-FTL titer of HCC group was obviously higher than that in CH group in the extension cohort with a larger sample size (P < 0.01). Contrary to expectation, there was no difference between HCC group and LC group (P > 0.05), and the mean titer of anti-FTL in LC group was higher than that in CH group or NC group in both cohorts (all P < 0.01), as shown in Figure 2A and B.
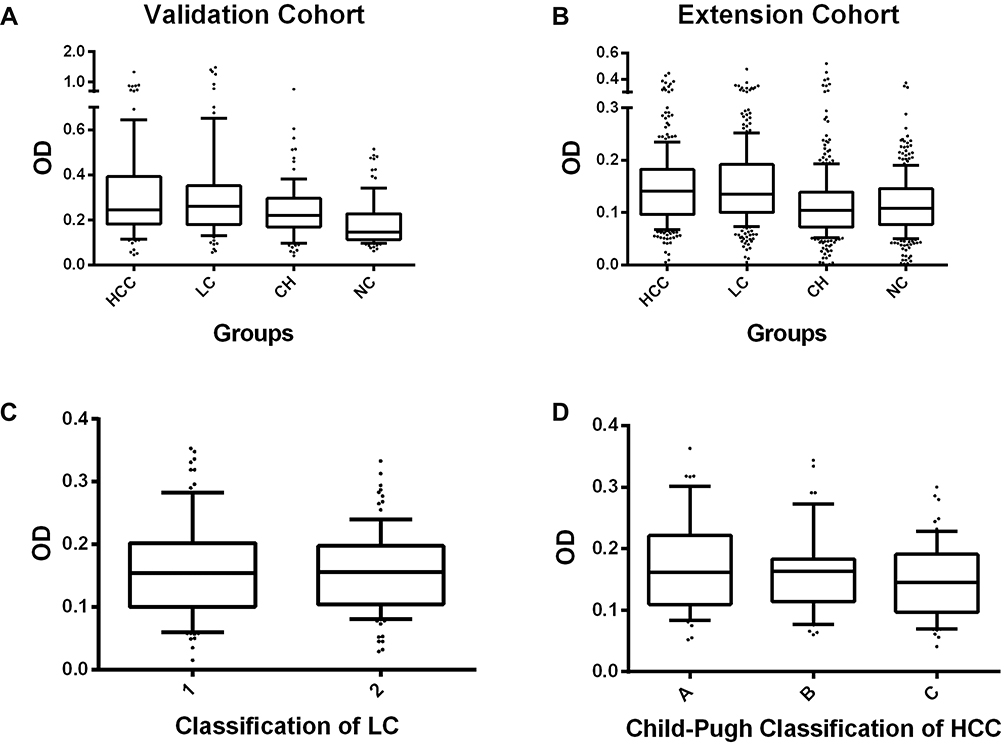 |
Figure 2 Titers of circulating anti-FTL in patients of HCC, LC, CH, and NC. (A) Validation cohort. (B) Extension cohort. (C) Comparison of circulating anti-FTL titers in different classification of LC, 1=Compensated LC, 2= Decompensated LC. (D) Comparison of circulating anti-FTL titers in Child-Pugh A, B and C stage of HCC. Abbreviations: Anti-FTL, autoantibody against Ferritin light chain; HCC, hepatocellular carcinoma; LC, liver cirrhosis; CH, chronic hepatitis; NC, healthy individuals; OD, optical density of anti-FTL. |
This study also analyzed the difference in anti-FTL concentration between males and females, and the results are shown in Figure S1. In the extension cohort, the median (IQR) of anti-FTL concentration in males and females of NC group was 0.108 (0.076, 0.148) versus 0.112 (0.087, 0.143), the difference was not statistically significant (P = 0.696). In patients with CH, LC, and HCC, the median (IQR) of anti-FTL concentration in males and females were 0.106 (0.073, 0.140) versus 0.102 (0.069, 0.139), 0.136 (0.101, 0.192) versus 0.126 (0.094, 0.185), 0.141 (0.096, 0.181) versus 0.140 (0.095, 0.188), respectively. There was still no statistical significance between males and females in each group (all P > 0.05). These results suggested that serum anti-FTL concentration was independent of gender.
In order to analyze whether the etiology of different hepatitis virus has an impact on the generation of anti-FTL autoantibody, the titers of anti-FTL was compared between 45 patients with HBV-associated chronic hepatitis and 44 patients with HCV-associated chronic hepatitis, there was no difference in the titer of anti-FTL between the two groups (P > 0.05). This result indicated that there may be no difference in the production of anti-FTL autoantibodies according to the viral etiology.
Furthermore, in order to understand the changes of anti-FTL titer from precancerous lesions of liver cancer, early stage HCC to advanced stage HCC, the data of patients with compensated LC, decompensated LC and Child-Pugh A to C HCC were analyzed in this study. LC is the precancerous stage of liver cancer, and compensated LC is the early stage while decompensated LC is the late stage. Based on the stage information of LC in the extension cohort, 87 cases of compensated LC and 101 cases of decompensated LC were included in the comparison, as shown in Figure 2C, the median (IQR) of compensated LC is 0.154 (0.100, 0.202), while decompensated LC is 0.156 (0.104, 0.198), there was no difference in the titer of anti-FTL between early stage and late stage of LC. We also analyzed 44 cases of Child-Pugh A, 43 cases of Child-Pugh B and 64 cases of Child-Pugh C HCC patients, the median (IQR) of Child-Pugh A, B and C were 0.162 (0.109, 0.222), 0.163 (0.114, 0.183), and 0.145 (0.097, 0.191), respectively. But there was no difference in the anti-FTL titers within these three subgroups (P > 0.05), as shown in Figure 2D. These results indicate that the anti-FTL titer has been elevated in the precancerous stage of HCC, but there is no difference in the stage of early cirrhosis, advanced cirrhosis, or different grades of HCC.
The Positive Rates of Anti-FTL in HCC and Controls
The percentile 95 (P95) of OD of anti-FTL in the normal group was taken as the cutoff value, the OD value which was higher than the cutoff value was defined as positive. In the validation cohort, the positive rates of anti-FTL in HCC group, LC group, CH group and NC group were 16.5% (16/97), 14.5% (12/83), 6.7% (6/89) and 5.2% (5/97), respectively. As shown in Table 2, the positive rate in HCC group was higher than that in NC group and CH group (all P < 0.05), but there was no statistical difference between HCC and LC (P > 0.05). The positive rate in LC group was higher than that of NC (P < 0.05).
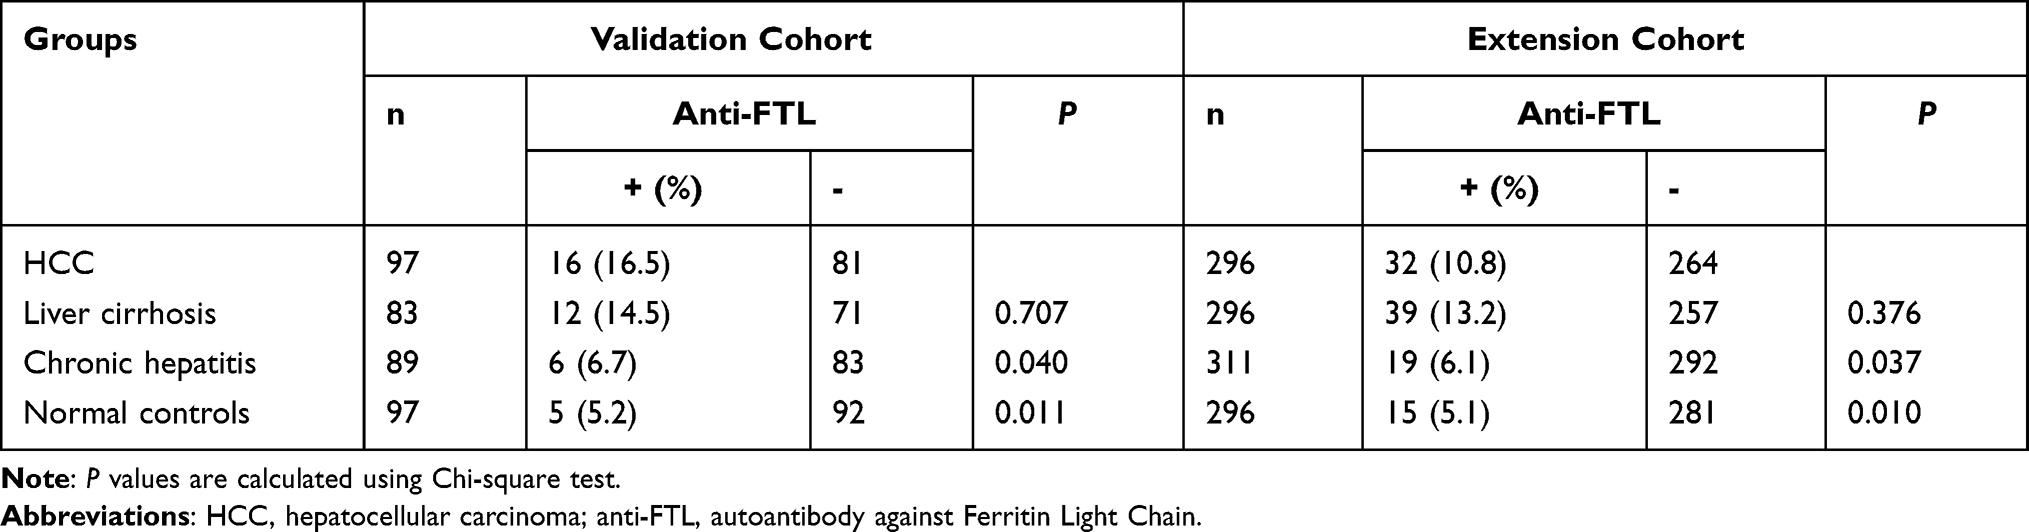 |
Table 2 The Positive Rate of Anti-FTL Autoantibodies in HCC Patients and Controls |
In the extension cohort, the positive rates of anti-FTL in HCC group, LC group, CH group and NC group were 10.8% (32/296), 13.2% (39/296), 6.1% (19/311) and 5.1% (15/296), respectively. As shown in Table 2, the positive rates of HCC group and LC group were both higher than that of CH group and normal controls (both P < 0.05), but the difference between HCC and LC patients was not statistically significant (P > 0.05). Besides, there was no significant difference in antibody positive rate between the CH group and the normal group (P > 0.05).
AUC of Anti-FTL as a Biomarker in Differentiating HCC or LC from Controls
In the validation cohort, the AUC was 0.609 (P = 0.001) when anti-FTL was used as a biomarker to differentiate HCC from all controls. After the control population was divided into three subgroups: normal group, CH group and LC group, the AUC of anti-FTL was 0.724 (P = 0.000) in differentiating HCC group from normal group, while it was 0.580 (P = 0.055) in differentiating HCC group from CH group. There was no diagnostic value of anti-FTL in differentiating HCC group from LC group on the base of that the AUC was only 0.505 (P = 0.917). When anti-FTL was taken as a biomarker in differentiating LC with NC or CH, the AUC were 0.737 (P = 0.000) and 0.575 (P = 0.088) respectively (Detailed in Figure 3).
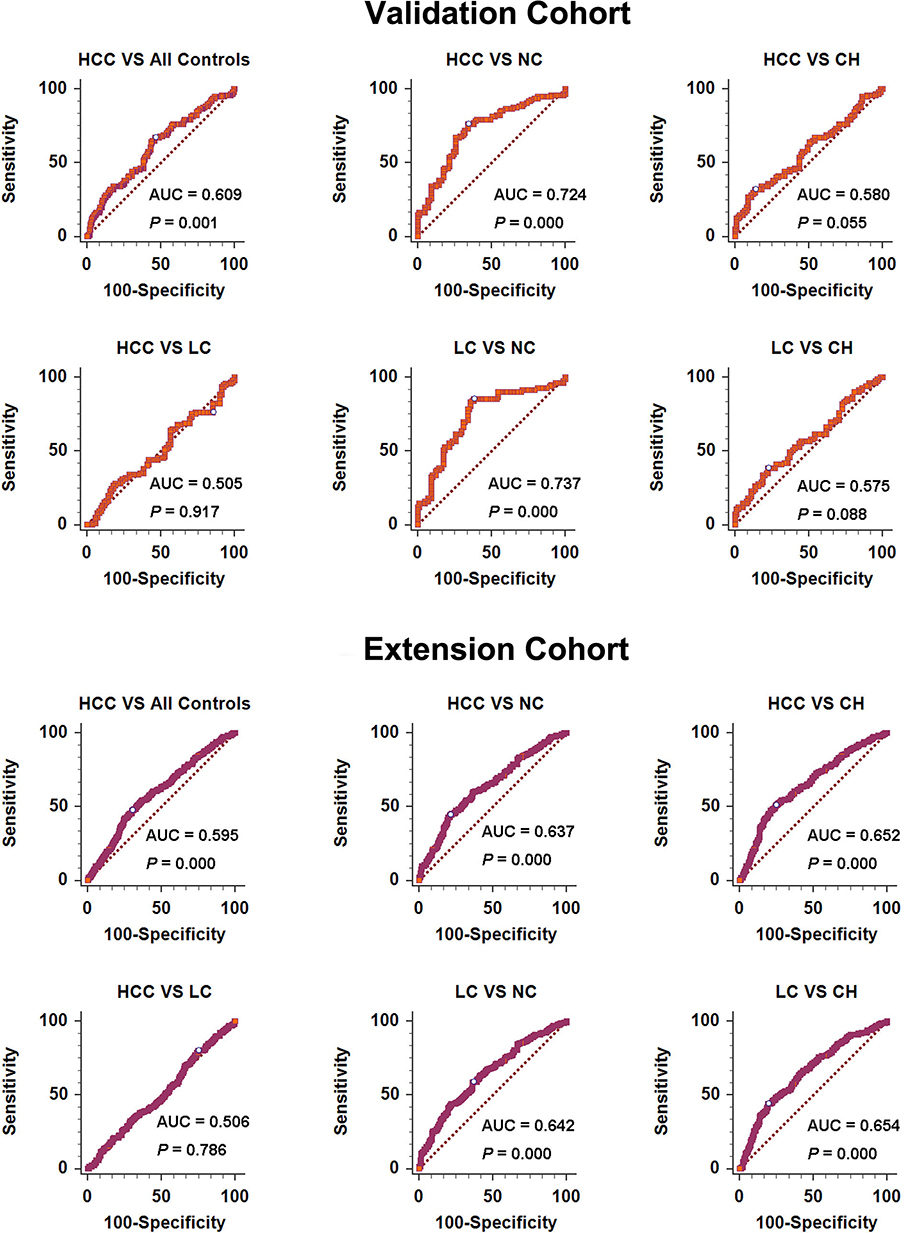 |
Figure 3 ROC curves of anti-FTL in discriminating HCC/LC with controls in validation cohort and extension cohort. Abbreviations: AUC, area under receiver operator characteristic curves; anti-FTL, autoantibody against Ferritin light chain; HCC, hepatocellular carcinoma; LC, liver cirrhosis; CH, chronic hepatitis; NC, healthy individuals. |
In the extension cohort, the AUC were 0.637 (P = 0.000), 0.652 (P = 0.000) and 0.506 (P = 0.786) respectively when anti-FTL was used to differentiate HCC from normal group, CH group and LC group (Detailed in Figure 3). When anti-FTL was taken as a biomarker in differentiating LC with NC or CH, the AUC were 0.642 (P = 0.000) and 0.654 (P = 0.000) respectively (Detailed in Figure 3). These results revealed that anti-FTL may be taken as a potential biomarker in distinguishing HCC or LC from NC and CH.
Elevated Expression of FTL Gene in HCC Tissues
FTL gene expression was increased in HCC tissues compared with para-cancerous tissues (P < 0.01), the median (IQR) was 13.1 (12.4, 14.0) in tumor tissues, while it was 12.4 (12.2, 12.6) in normal liver tissues, as shown in Figure 4A. For 50 pairs of self-matched HCC and adjacent tissues, the median (IQR) was 12.9 (12.0, 13.8) in tumor tissues, while it was 12.4 (12.2, 12.6) in normal liver tissues, but there was no significant difference between them (P = 0.07), as shown in Figure 4B.
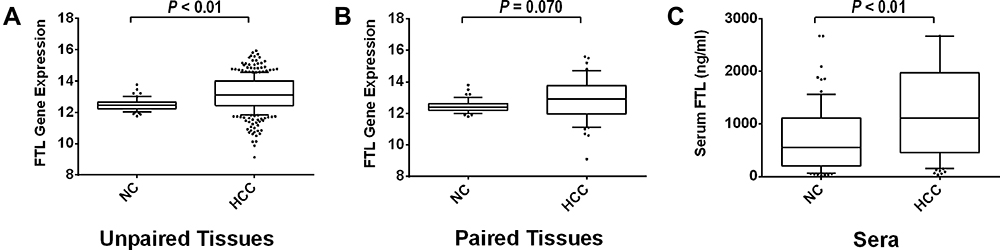 |
Figure 4 Elevated expression level of FTL in HCC. (A) Comparison of the expression of FTL gene between HCC tissues and unpaired normal liver tissues by RNA-Seq. (B) Comparison of the expression of FTL gene between HCC tissues and paired normal liver tissues by RNA-Seq. (C) Serum FTL concentration in HCC patients and normal controls. Abbreviations: NC, normal liver; HCC, hepatocellular carcinoma; NC, healthy individuals. |
Increased Release of FTL Protein in the Serum of HCC Patients Compared with Normal People
The median (IQR) of serum FTL concentration was 557.0 (201.5, 1112.8) ng/mL in normal people, while it was significantly elevated in HCC with a concentration of 1116.0 (453.5, 1974.8) ng/mL (P < 0.01), as shown in Figure 4C.
No Direct Correlation Existing Between Titer of Anti-FTL and Concentration of Serum FTL
As shown in Figure S2 (A), no correlation trend was observed in the scatter plot, and the Person correlation coefficients was not statistically significant (r = −0.013, P = 0.915).It indicated that there was no linear correlation between FTL antigen and anti-FTL autoantibodies. After the HCC patients were divided into high, medium and low groups according to anti-FTL autoantibody titers by another method of analysis, as shown in Figure S2 (B), we still failed to find statistical differences in serum FTL antigen concentrations between the three groups (P = 0.089). These results showed that there was no direct correlation existed between titer of anti-FTL and concentration of serum FTL.
The High Expression of FTL Gene in HCC is Associated with Poor Prognosis
As shown in Figure S3, The 10-year OS time was lower in the HCC patients with high expression of FTL gene than that in low expression patients. The hazards ratio (HR) of patients with high FTL gene expression was 1.52, 95% CI: 1.05–2.2 (P = 0.027). For patients with clinical stage I–II HCC, those with high FTL gene expression had a lower survival time (HR = 2.05, 95% CI: 1.26–3.32, P = 0.003) and lower postoperative recurrence-free time (RFS) (HR: 1.78, 95% CI: 1.15–2.75, P = 0.009) than those with low FTL gene expression. However, for patients with clinical stage III–IV HCC, there was no statistically significant difference in OS. These results indicated that high expression of FTL gene was a predictive biomarker of poor prognosis in HCC, especially for stage I–II patients.
Discussion
Human ferritin is composed of two different subunits, including light subunit (FTL/L-ferritin) and heavy subunit (FTH/H-ferritin). The ratio of FTL and H-ferritin varies on different organs and tissues.29 In liver organ, FTL is expressed at a higher level than H-ferritin. The expression of these two subunits is also different between cellular compartments. In liver cells, FTL is mainly expressed in the cytoplasm, while H-ferritin predominantly in nucleus.30 H-ferritin functions as a ferroxidase in the rapid oxidation of Fe2+ to Fe3+, while FTL is dedicated to the iron mineralization and storage inside the ferritin shell.31 It is shown that H-ferritin plays pro-inflammatory or immunosuppressive roles, but also plays an important role in the ferroptosis process of HCC.32 Serum ferritin is composed mostly of FTL subunits, and increased serum ferritin levels have been associated with poor prognosis in multiple cancers including HCC.33–37 In a previous study, it was observed that anti-FTL appeared more frequently in the serum of HCC patients compared to benign live diseases.26
In this study, two independent cohorts were built to validate anti-FTL as a biomarker for the diagnosis of HCC. It was found that, compared with normal people and CH patients, serum anti-FTL titers elevated significantly in patients of HCC and LC in the validation cohort, but there was no significant difference in the positive rate of anti-FTL between HCC and LC, ROC analysis showed there was no diagnostic value when anti-FTL was taken as a biomarker to discriminate HCC from LC. These findings were validated in the extension cohort. For LC patients, the elevation of serum anti-FTL titer was not related to the stage of LC.
Tumor-associated autoantibodies are usually elicited by the abnormal increase of antigen expression or changes of amino acid sequence. It was reported that the expression level of FTL gene in HCC tissues was higher than that in normal liver tissues,18,38 and the control was not self-matched normal liver tissues. In this study, it was found that there was no difference in the expression level of this gene in liver cancer and para-cancerous tissues. The reason was that 50 pairs of self-matched HCC tissues and para-cancerous tissues were selected in this study, and the comparison result obtained by paired t-test was more reliable. However, it is important to note that para-cancerous liver tissues are not completely normal liver tissues but with disease of hepatitis or liver fibrosis. It also suggests that the expression level of FTL gene is elevated in benign liver disease. These results are consistent with the increased positive rate of anti-FTL in peripheral blood of patients with HCC and LC.
After confirming that the expression level of FTL gene was elevated in HCC tissues, it was also found that the concentration of FTL protein in peripheral blood of HCC patients was significantly higher than that of normal individuals. Although few studies have reported the changes of FTL in peripheral blood of patients with HCC, there have been many reports on the role of serum ferritin in the diagnosis of liver cancer. Liver is an important organ for the production and storage of ferritin. Ferritin is a secretory protein synthesized by liver cells and secreted into the blood to maintain a relatively stable concentration in the peripheral blood. The concentration of serum ferritin increases when liver cells are injured.39,40 Although there is no significant difference in serum ferritin concentrations between patients with HCC and benign liver disease, several studies have demonstrated a positive correlation between elevated serum ferritin concentration and liver fibrosis. Elevated ferritin concentration is positively correlated with advanced liver fibrosis in patients with non-alcoholic fatty liver disease and chronic hepatitis C, and serum ferritin level in patients with severe liver fibrosis is higher than that in patients with liver disease without liver fibrosis.41–43 Some studies have also reported that the serum ferritin concentration of patients with HBV-related cirrhosis is higher than that of chronic hepatitis B patients without cirrhosis.44 FTL is the constituent subunit of ferritin, so the change pattern of serum ferritin concentration also indicates that of ferritin subunit. Therefore, it is reasonable to speculate that elevated serum FTL is also associated with advanced liver fibrosis or cirrhosis.
Concordant with the results that serum ferritin is elevated in patients with advanced liver fibrosis and cirrhosis, it was found that titers of anti-FTL autoantibodies were elevated in the serum of patients with liver cirrhosis in this study. This indicates that the increased concentration of serum FTL protein is consistent with the elevated occurrence frequency of circulating anti-FTL, suggesting that the cause of anti-FTL may be the increased concentration of circulating ferritin. In other words, the abnormal expression of FTL antigen can stimulate the body′s immune system to produce humoral immune response, resulting in the occurrence of specific autoantibodies against FTL. However, no direct correlation was found between circulating anti-FTL antibody titer and serum FTL antigen concentration in this study. Further studies are needed to answer the cause of anti-FTL production.
FTL plays an important role in the development of liver cirrhosis specifically by the regulation of epithelial-mesenchymal transition (EMT). EMT is considered as one of the mechanisms of myofibroblast generation in liver fibrosis.45,46 Studies on breast cancer and glioma have found that, FTL gene is expressed at a higher level in stromal tumor cells than that in epithelial tumor cells, and the expression level of FTL is positively correlated with the expression levels of EMT-related markers such as snail 1, Vimentin and twist.47 In glioma, it was revealed that by cell phenotype experiments that FTL knockdown could inhibit the migration and invasion of tumor cells, significantly reduce the expression of mesenchymal markers Vimentin and snail, and increase the expression of epithelial marker E-cadherin, and morphologically transform the cells into epithelial tumor cells with fewer pseudopods. Overexpression of FTL gene can significantly improve the migration and invasion ability of tumor cells, and increase the expression level of stromal markers. Further mechanism studies in vivo and in vitro confirmed that FTL promotes EMT by regulating AKT/GSK3β/β-catenin signaling pathway.48 However, the mechanism of FTL in the development of liver fibrosis is still unclear and needs to be determined in further studies.
There are some limitations in this study. Since liver fibrosis is an evolving process, the advanced irreversible stage is known as liver cirrhosis. Although this study found that the occurrence frequency of anti-FTL in peripheral blood of patients with liver cirrhosis was significantly elevated, the cases of liver fibrosis with different grades were not included. Therefore, it was impossible to determine whether the occurrence of this autoantibody was in the early or advanced stage of liver fibrosis. In our further research, we will observe its occurrence in the peripheral blood of patients with liver fibrosis at different grade, and explore its diagnostic performance.
In conclusion, the occurrence frequency of anti-FTL is increased in both liver cirrhosis and HCC, and the production of autoantibodies may be associated with increased concentrations of FTL released in peripheral blood. Anti-FTL can be used as a potential serum biomarker for the diagnosis of liver cirrhosis, but it is not suitable to be used as a serum biomarker for the early diagnosis of HCC due to the lack of specificity.
Abbreviations
HCC, hepatocellular carcinoma; LC, liver cirrhosis; CH, chronic hepatitis; anti-FTL, autoantibody against ferritin light chain; ROC, receiver operating characteristic curve; AUC, area under receiver operating characteristic curve.
Ethics Approval and Informed Consent
The studies involving human participants were reviewed and approved by Medical Ethics Committee of Zhengzhou University (Zhengzhou, China). The patients/participants provided their written informed consent to participate in this study. Written informed consent was obtained from the individual(s) for the publication of any potentially identifiable images or data included in this article. We confirmed that this study was conducted in accordance with the Declaration of Helsinki.
Funding
This work was supported by the National Science and Technology Major Project of China (Grant No. 2018ZX10302205), the Major Project of Science and Technology in Henan Province (Grant No. 16110311400), the Major public welfare projects in Henan Province (Grant No. 201300310400), the Funding Program for Medical Sciences and Technologies of Henan Province (Grant No. 2018020478), and Project of Basic Research Fund of Henan Institute of Medical and Pharmacological Sciences (No. 2020BP0113).
Disclosure
The authors have declared no conflicts of interest for this work.
References
1. Sung H, Ferlay J, Siegel RL. Global cancer statistics 2020: GLOBOCAN estimates of incidence and mortality worldwide for 36 cancers in 185 countries. CA: Cancer J Clin. 2021;71(3):209–249. doi:10.3322/caac.21660
2. Colli A, Nadarevic T, Miletic D, et al. Abdominal ultrasound and alpha-foetoprotein for the diagnosis of hepatocellular carcinoma in adults with chronic liver disease. Cochrane Database Syst Rev. 2021;4(4):Cd013346. doi:10.1002/14651858.CD013346.pub2
3. Singal AG, Lampertico P, Nahon P. Epidemiology and surveillance for hepatocellular carcinoma: new trends. J Hepatol. 2020;72(2):250–261. doi:10.1016/j.jhep.2019.08.025
4. Demirtas CO, Brunetto MR. Surveillance for hepatocellular carcinoma in chronic viral hepatitis: is it time to personalize it? World J Gastroenterol. 2021;27(33):5536–5554. doi:10.3748/wjg.v27.i33.5536
5. Harris PS, Hansen RM, Gray ME, Massoud OI, McGuire BM, Shoreibah MG. Hepatocellular carcinoma surveillance: an evidence-based approach. World J Gastroenterol. 2019;25(13):1550–1559. doi:10.3748/wjg.v25.i13.1550
6. Zhang G, Ha SA, Kim HK, et al. Combined analysis of AFP and HCCR-1 as an useful serological marker for small hepatocellular carcinoma: a prospective cohort study. Dis Markers. 2012;32(4):265–271. doi:10.1155/2012/964036
7. Saffroy R, Pham P, Reffas M, Takka M, Lemoine A, Debuire B. New perspectives and strategy research biomarkers for hepatocellular carcinoma. Clin Chem Lab Med. 2007;45(9):1169–1179. doi:10.1515/CCLM.2007.262
8. Hanif H, Ali MJ, Susheela AT, et al. Update on the applications and limitations of alpha-fetoprotein for hepatocellular carcinoma. World J Gastroenterol. 2022;28(2):216–229. doi:10.3748/wjg.v28.i2.216
9. Tzartzeva K, Obi J, Rich NE, et al. Surveillance imaging and alpha fetoprotein for early detection of hepatocellular carcinoma in patients with cirrhosis: a meta-analysis. Gastroenterology. 2018;154(6):1706–1718.e1701. doi:10.1053/j.gastro.2018.01.064
10. Wang T, Zhang KH. New blood biomarkers for the diagnosis of AFP-negative hepatocellular carcinoma. Front Oncol. 2020;10:1316. doi:10.3389/fonc.2020.01316
11. Chen F, Wang J, Wu Y, Gao Q, Zhang S. Potential biomarkers for liver cancer diagnosis based on multi-omics strategy. Front Oncol. 2022;12:822449. doi:10.3389/fonc.2022.822449
12. Li C, Zhang Z, Zhang P, Liu J. Diagnostic accuracy of des-gamma-carboxy prothrombin versus α-fetoprotein for hepatocellular carcinoma: a systematic review. Hepatol Res. 2014;44(10):E11–E25. doi:10.1111/hepr.12201
13. Xing H, Zheng YJ, Han J, et al. Protein induced by vitamin K absence or antagonist-II versus alpha-fetoprotein in the diagnosis of hepatocellular carcinoma: a systematic review with meta-analysis. Hepatobiliary Pancreat Dis Int. 2018;17(6):487–495. doi:10.1016/j.hbpd.2018.09.009
14. Feng H, Li B, Li Z, Wei Q, Ren L. PIVKA-II serves as a potential biomarker that complements AFP for the diagnosis of hepatocellular carcinoma. BMC Cancer. 2021;21(1):401. doi:10.1186/s12885-021-08138-3
15. Wang X, Zhang W, Liu Y, et al. Diagnostic value of prothrombin induced by the absence of vitamin K or antagonist-II (PIVKA-II) for early stage HBV related hepatocellular carcinoma. Infect Agent Cancer. 2017;12:47. doi:10.1186/s13027-017-0153-6
16. Zhang JY, Tan EM. Autoantibodies to tumor-associated antigens as diagnostic biomarkers in hepatocellular carcinoma and other solid tumors. Expert Rev Mol Diagn. 2010;10(3):321–328. doi:10.1586/erm.10.12
17. Alkhateeb AA, Connor JR. The significance of ferritin in cancer: anti-oxidation, inflammation and tumorigenesis. Biochim Biophys Acta. 2013;1836(2):245–254. doi:10.1016/j.bbcan.2013.07.002
18. Hu ZW, Chen L, Ma RQ, et al. Comprehensive analysis of ferritin subunits expression and positive correlations with tumor-associated macrophages and T regulatory cells infiltration in most solid tumors. Aging. 2021;13(8):11491–11506. doi:10.18632/aging.202841
19. Ciregia F, Giusti L, Molinaro A, et al. Presence in the pre-surgical fine-needle aspiration of potential thyroid biomarkers previously identified in the post-surgical one. PLoS One. 2013;8(9):e72911. doi:10.1371/journal.pone.0072911
20. An HJ, Kim DS, Park YK, et al. Comparative proteomics of ovarian epithelial tumors. J Proteome Res. 2006;5(5):1082–1090. doi:10.1021/pr050461p
21. Lin CY, Lin CJ, Chen KH, Wu JC, Huang SH, Wang SM. Macrophage activation increases the invasive properties of hepatoma cells by destabilization of the adherens junction. FEBS Lett. 2006;580(13):3042–3050. doi:10.1016/j.febslet.2006.04.049
22. Weinstein RE, Bond BH, Silberberg BK. Tissue ferritin concentration in carcinoma of the breast. Cancer. 1982;50(11):2406–2409. doi:10.1002/1097-0142(19821201)50:11<2406::AID-CNCR2820501127>3.0.CO;2-S
23. Wu T, Li Y, Liu B, et al. Expression of ferritin light chain (FTL) is elevated in glioblastoma, and FTL silencing inhibits glioblastoma cell proliferation via the GADD45/JNK pathway. PLoS One. 2016;11(2):e0149361. doi:10.1371/journal.pone.0149361
24. Li Z, Liu J, Chen H, et al. Ferritin Light Chain (FTL) competes with long noncoding RNA Linc00467 for miR-133b binding site to regulate chemoresistance and metastasis of colorectal cancer. Carcinogenesis. 2020;41(4):467–477. doi:10.1093/carcin/bgz181
25. Zhang L, Chen Z, Xu A. FTL: a novel predictor in gastric cancer. Int J Clin Exp Pathol. 2017;10(7):7865–7872.
26. Wang K, Xu X, Nie Y, Dai L, Wang P, Zhang J. Identification of tumor-associated antigens by using SEREX in hepatocellular carcinoma. Cancer Lett. 2009;281(2):144–150. doi:10.1016/j.canlet.2009.02.037
27. Wang K, Li M, Qin J, et al. Serological biomarkers for early detection of hepatocellular carcinoma: a focus on autoantibodies against tumor-associated antigens encoded by cancer driver genes. Cancers. 2020;12(5):1271. doi:10.3390/cancers12051271
28. Zhang HF, Qin JJ, Ren PF, et al. A panel of autoantibodies against multiple tumor-associated antigens in the immunodiagnosis of esophageal squamous cell cancer. Cancer Immunol Immunother. 2016;65(10):1233–1242. doi:10.1007/s00262-016-1886-6
29. Lavoie DJ, Marcus DM, Otsuka S, Listowsky I. Characterization of ferritin from human placenta. Implications for analysis of tissue specificity and microheterogeneity of ferritins. Biochim Biophys Acta. 1979;579(2):359–366. doi:10.1016/0005-2795(79)90063-1
30. Ahmad S, Moriconi F, Naz N, et al. Ferritin L and Ferritin H are differentially located within hepatic and extra hepatic organs under physiological and acute phase conditions. Int J Clin Exp Pathol. 2013;6(4):622–629.
31. Plays M, Muller S, Rodriguez R. Chemistry and biology of ferritin. Metallomics. 2021;13(5). doi:10.1093/mtomcs/mfab021
32. Asperti M, Bellini S, Grillo E, et al. H-ferritin suppression and pronounced mitochondrial respiration make Hepatocellular Carcinoma cells sensitive to RSL3-induced ferroptosis. Free Radic Biol Med. 2021;169:294–303. doi:10.1016/j.freeradbiomed.2021.04.024
33. Shpyleva SI, Tryndyak VP, Kovalchuk O, et al. Role of ferritin alterations in human breast cancer cells. Breast Cancer Res Treat. 2011;126(1):63–71. doi:10.1007/s10549-010-0849-4
34. Feng Z, Chen JW, Feng JH, et al. The association between serum ferritin with colorectal cancer. Int J Clin Exp Med. 2015;8(12):22293–22299.
35. Wu SJ, Zhang ZZ, Cheng NS, Xiong XZ, Yang L. Preoperative serum ferritin is an independent prognostic factor for liver cancer after hepatectomy. Surg Oncol. 2019;29:159–167. doi:10.1016/j.suronc.2019.05.013
36. Lee S, Jeon H, Shim B. Prognostic value of ferritin-to-hemoglobin ratio in patients with advanced non-small-cell lung cancer. J Cancer. 2019;10(7):1717–1725. doi:10.7150/jca.26853
37. Ramirez-Carmona W, Diaz-Fabregat B, Yuri Yoshigae A, et al. Are serum ferritin levels a reliable cancer biomarker? A systematic review and meta-analysis. Nutr Cancer. 2021:1–10. doi:10.1080/01635581.2021.1982996
38. Shen Y, Li X, Zhao B, et al. Iron metabolism gene expression and prognostic features of hepatocellular carcinoma. J Cell Biochem. 2018;119(11):9178–9204. doi:10.1002/jcb.27184
39. Meynard D, Babitt JL, Lin HY. The liver: conductor of systemic iron balance. Blood. 2014;123(2):168–176. doi:10.1182/blood-2013-06-427757
40. Wei Y, Ye W, Zhao W. Serum iron levels decreased in patients with HBV-related hepatocellular carcinoma, as a risk factor for the prognosis of HBV-related HCC. Front Physiol. 2018;9:66. doi:10.3389/fphys.2018.00066
41. Haghgoo SM, Sharafi H, Alavian SM. Serum cytokines, adipokines and ferritin for non-invasive assessment of liver fibrosis in chronic liver disease: a systematic review. Clin Chem Lab Med. 2019;57(5):577–610. doi:10.1515/cclm-2018-0357
42. Angulo P, George J, Day CP, et al. Serum ferritin levels lack diagnostic accuracy for liver fibrosis in patients with nonalcoholic fatty liver disease. Clin Gastroenterol Hepatol. 2014;12(7):1163–1169 e1161. doi:10.1016/j.cgh.2013.11.035
43. Yoneda M, Thomas E, Sumida Y, et al. Clinical usage of serum ferritin to assess liver fibrosis in patients with non-alcoholic fatty liver disease: proceed with caution. Hepatol Res. 2014;44(14):E499–E502. doi:10.1111/hepr.12327
44. Mao W, Hu Y, Lou Y, Chen Y, Zhang J. Abnormal serum iron markers in chronic hepatitis B virus infection may be because of liver injury. Eur J Gastroenterol Hepatol. 2015;27(2):130–136. doi:10.1097/MEG.0000000000000247
45. Yu K, Li Q, Shi G, Li N. Involvement of epithelial-mesenchymal transition in liver fibrosis. Saudi J Gastroenterol. 2018;24(1):5–11. doi:10.4103/sjg.SJG_297_17
46. Chen Y, Fan Y, Guo DY, et al. Study on the relationship between hepatic fibrosis and epithelial-mesenchymal transition in intrahepatic cells. Biomed Pharmacother. 2020;129:110413. doi:10.1016/j.biopha.2020.110413
47. Jezequel P, Campion L, Spyratos F, et al. Validation of tumor-associated macrophage ferritin light chain as a prognostic biomarker in node-negative breast cancer tumors: a multicentric 2004 national PHRC study. Int J Cancer. 2012;131(2):426–437. doi:10.1002/ijc.26397
48. Liu J, Gao L, Zhan N, et al. Hypoxia induced ferritin light chain (FTL) promoted epithelia mesenchymal transition and chemoresistance of glioma. J Exp Clin Cancer Res. 2020;39(1):137. doi:10.1186/s13046-020-01641-8
 © 2022 The Author(s). This work is published and licensed by Dove Medical Press Limited. The full terms of this license are available at https://www.dovepress.com/terms.php and incorporate the Creative Commons Attribution - Non Commercial (unported, v3.0) License.
By accessing the work you hereby accept the Terms. Non-commercial uses of the work are permitted without any further permission from Dove Medical Press Limited, provided the work is properly attributed. For permission for commercial use of this work, please see paragraphs 4.2 and 5 of our Terms.
© 2022 The Author(s). This work is published and licensed by Dove Medical Press Limited. The full terms of this license are available at https://www.dovepress.com/terms.php and incorporate the Creative Commons Attribution - Non Commercial (unported, v3.0) License.
By accessing the work you hereby accept the Terms. Non-commercial uses of the work are permitted without any further permission from Dove Medical Press Limited, provided the work is properly attributed. For permission for commercial use of this work, please see paragraphs 4.2 and 5 of our Terms.