")
Back to Archived Journals » International Journal of Wine Research » Volume 7
Australian wine consumers’ acceptance of and attitudes toward the use of additives in wine and food production
Authors Saltman Y, Johnson T, Wilkinson K, Bastian S
Received 19 June 2015
Accepted for publication 14 August 2015
Published 2 November 2015 Volume 2015:7 Pages 83—92
DOI https://doi.org/10.2147/IJWR.S90802
Checked for plagiarism Yes
Review by Single anonymous peer review
Peer reviewer comments 3
Editor who approved publication: Dr Roger Pinder
Yaelle Saltman, Trent E Johnson, Kerry L Wilkinson, Susan EP Bastian
Department of Wine and Food, School of Agriculture, Food and Wine, The University of Adelaide, Waite Campus, Adelaide, SA, Australia.
Abstract: Additives are routinely used in food and wine production to enhance product quality and/or prevent spoilage. Compared with other industries, the wine industry is only permitted to use a limited number of additives. Whereas flavor additives are often used to intensify the aroma and flavor of foods and beverages, the addition of flavorings to wine contravenes the legal definition of wine. Given the current legislation, it is perhaps not surprising that the potential use of food additives in wine production has not been explored. This study therefore investigated Australian wine consumers' acceptance of and attitudes toward the use of additives in food and wine production. Consumers (n=1,031) were segmented based on their self-reported wine knowledge (ie, subjective knowledge). Using these ratings, low (n=271), medium (n=528), and high (n=232) knowledge segments were identified. Consumers considered natural flavorings and colors, and additives associated with health benefits (eg, vitamins, minerals, and omega 3 fatty acids), to be acceptable food additives, irrespective of their level of wine knowledge. In contrast, the use of winemaking additives, even commonly used and legally permitted additives such as tartaric acid, preservatives, oak chips, and tannins, were considered far less acceptable, particularly, by less knowledgeable consumers. Surprisingly, natural flavorings were considered more acceptable than currently used winemaking additives. Consumers were therefore asked to identify the flavors they would most prefer in white and red wines. Fruit flavors featured prominently in consumer responses, eg, lemon and apple for white wines and blackcurrant and raspberry for red wines, but vanilla and/or chocolate, ie, attributes typically associated with oak maturation, were also suggested.
Keywords: wine quality, segmentation, natural flavors, artificial flavors, wine knowledge
Introduction
For centuries, additives have been used to extend shelf-life and enhance food flavor, eg, the addition of salt to preserve fish and meat, sugar to preserve fruit, vinegar to pickle vegetables, and herbs and spices to enhance flavor.1,2 Today, food additives are widely used at different stages of food and beverage production for a range of purposes. The term “food additive” encompasses a range of permissible substances, including flavorings, colorings, texture modifiers, nutrients, and preservatives.3 These additives are generally used in food and beverage production to: improve appearance (eg, flavorings, colorings); extend shelf-life (eg, preservatives); aid production (eg, clarifying agents); impart health benefits (eg, nutrients); and satisfy consumer expectations.4,5
The Australia New Zealand Food Standards Code (Code 1.3.1), which embodies food and beverage production, is a complex system, and the number of permissible additives varies widely across product categories. For example, for confectionaries and sauces, the list of permitted additives in the final product exceeds 100; in contrast, the wine industry is only permitted to use half this number of additives during winemaking (ie, ~50 additives). Consequently, winemakers have fewer opportunities with which to modify wine quality. In Australia, common wine additives include tartaric acid, grape-derived juice concentrates, cultured yeasts, fining agents, preservatives, grape-derived color extracts, tannins, and oak wood. The Food Standards Australia New Zealand6 lists the permitted additives, which are generally classified either as “additives” or “processing aids”. Flavor additives are not permitted in the production of wine, which is strictly (and legally) defined in Standard 2.7.4 as “the product of the complete or partial fermentation of fresh grapes, or a mixture of that product and products derived solely from grapes”.6 To date, wine consumers’ acceptance and attitudes toward the additives used in wine production have not been established.7
Wine producers have not always conformed to the strict regulations prescribing the use of additives in winemaking. In some cases, wine producers have admitted to the use of unauthorized additives to improve wine quality.8 The addition of prohibited substances to wine is known as adulteration or as fraud.9 Breaches of this kind suggest that some winemakers find the financial benefits of enhancing wine quality irresistible. Around the world, several incidents involving mishandling of wine have featured in media headlines, including reports in which producers allegedly adulterated wines by adding prohibited substances.8 The 1985 Austrian “antifreeze wine scandal” involved the addition of diethylene glycol to late harvest, sweet style wines to enhance sweetness.9,10 More recently, a South African winemaker supposedly added natural vegetable extracts to Sauvignon Blanc to enhance the vegetal character of the wine.11 Adulteration was also discovered in Australia when in 2000, an Australian winery was investigated following the alleged addition of silver nitrate to remedy sulfurous off-odors; with severe consequences for the winery concerned.12
Currently, flavor additives are only permitted in the production of “wine products”, ie, “food containing no less than 700 mL/L of wine which has been formulated, processed, modified, or mixed with other foods such that it is not wine”.6 Wine products are generally targeted toward prospective wine consumers and/or wine consumers who do not drink often;13 Rosemount winery’s “botanical” range, for example, came out with a range which consists of wine infused with fruit. However, there may be merit in the use of flavor additives as a technical solution for improving low-quality wine; pending consumer acceptance of wines made with flavor additives.
Other food and beverage industries have long recognized the success or failure of a product in the market depends on the factors driving consumer acceptability;14,15 yet surprisingly, relative to food, limited research has been undertaken to investigate the factors driving consumer acceptance of wines. Wine knowledge, prior consumption, wine style, grape variety, occasion, and price strongly influence wine selection and purchasing behavior,16–19 but to date, few studies have considered consumers’ acceptance of and attitudes toward the use of additives in wine and food production.
Consumer populations contain discreet segments of individuals who share common behaviors with respect to given product categories. By identifying and understanding individual consumer segments, industry can tailor products to specifically meet their respective needs; thus, segmentation serves as an important tool. Wine knowledge is a variable that measures consumers’ understanding of wine as a product, and can be measured either objectively or subjectively.20 Objective knowledge is measured using a series of questions that evaluate an individual’s familiarity with a wine product21 and is defined as “accurate information about the product class stored in long term memory”.22 Subjective knowledge is a self-reported measure of individuals’ perceptions of how much they know about a product class.23 Although a limitation of subjective knowledge is the possible discrepancy between what people think they know and what they actually know, previous research on wine knowledge17 concluded the two knowledge scales are highly correlated. Therefore, the subjective knowledge scale has been widely used in the wine marketing literature, as the basis for segmentation of large consumer populations.20,24,25 Wine knowledge has also been found to greatly influence consumers’ flavor preferences,20 wine involvement,26 and purchasing behavior.27 However, it is not known how consumers’ wine knowledge affects their perception of the use of additives in food and whether this differs to their opinions about additives in wine.
Additives, in particular flavors, are commonly used in foods and beverages to enhance quality, so it is reasonable to make the assumption that this would also be true in wines. The objectives of this study were to determine consumers’ acceptance of the use of flavor additives during wine production. We analyze consumer perceptions of additives including natural and artificial flavors in wine and food and determine if consumers’ wine knowledge assessed by the subjective knowledge scale23 will influence their acceptance, opinions, and convictions about additives used in wine and food production.
Materials and methods
Consumer sample
Wine consumers (n=1,031) were recruited nationally via a market research company (PureProfile, Sydney, Australia) and social media (including Facebook and electronic newsletters). Inclusion criteria required respondents to be of legal drinking age (ie, ≥18 years of age), regular wine drinkers (ie, wine consumption ≥ once per month), and residents of Australia. Demographic and alcohol and wine consumption characteristics of participants are reported in Table 1.
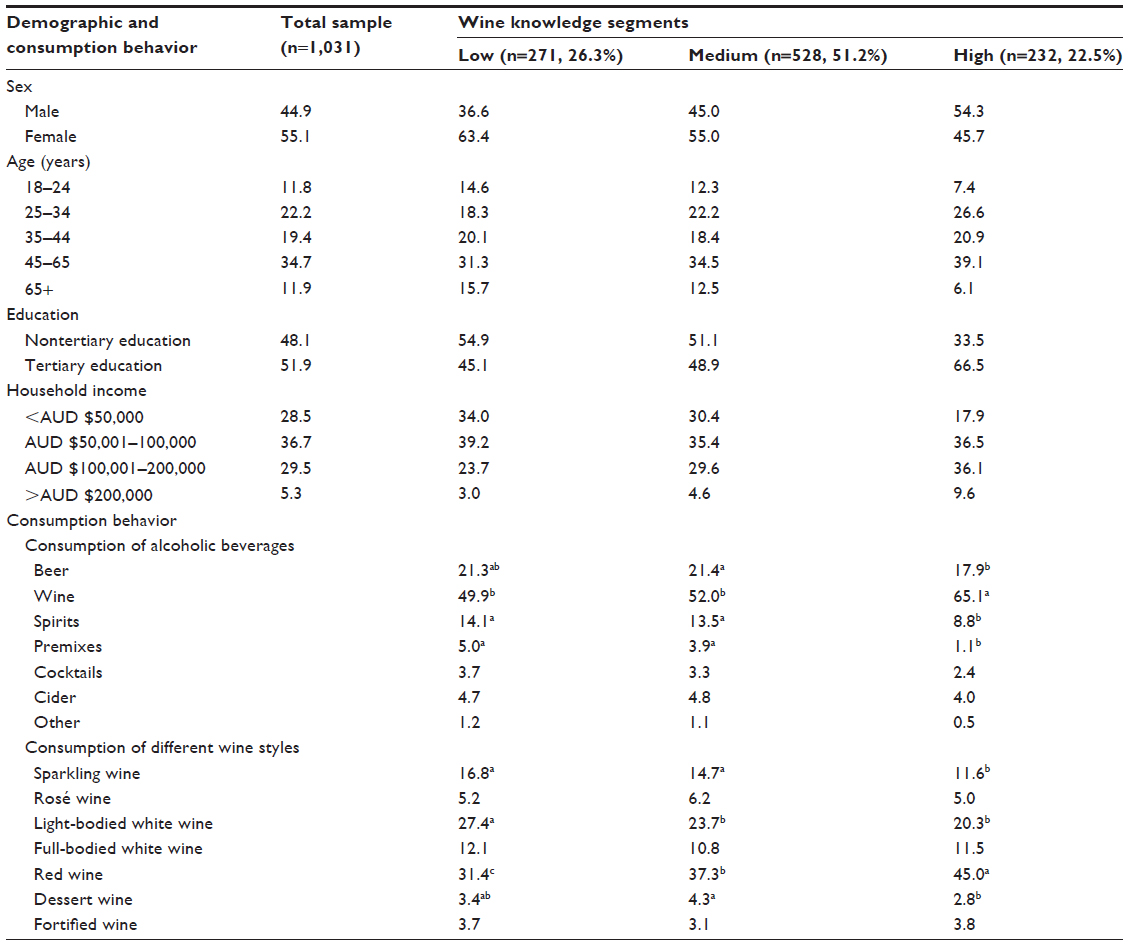 | Table 1 Demographic and consumption behavior of Australian wine consumers and low, medium, and high wine knowledge segments |
Questionnaire
An online questionnaire administered via SurveyMonkey™ (Palo Alto, CA, USA; www.surveymonkey.com) was developed to ascertain Australian wine consumers’ opinions and acceptance of the use of additives in food and wine. The questionnaire comprised five sections. The first section contained demographic questions relating to sex, age, education, and household income, as well as alcohol and wine consumption behavior (Table 1). The second section investigated consumers’ opinions about the use of various additives in wine and food (Tables 2 and 3). Section three then asked consumers to rate their acceptance of a range of additives used in wine and food production (Tables 4 and 5). Respondents were asked to indicate their level of agreement with a series of statements using a 9-point category scale, where 1= strongly disagree, 5= neither agree nor disagree, and 9= strongly agree. These statements were based on questions used in previous studies investigating consumer acceptance of additives used in food and beverage industries.28,29 In the fourth section, respondents were asked to rate their subjective wine knowledge,23 and several other consumer behaviors not reported in this paper. The final section comprised an optional, open-ended question asking consumers “If you could create a wine with your favorite flavors, what would you make?”
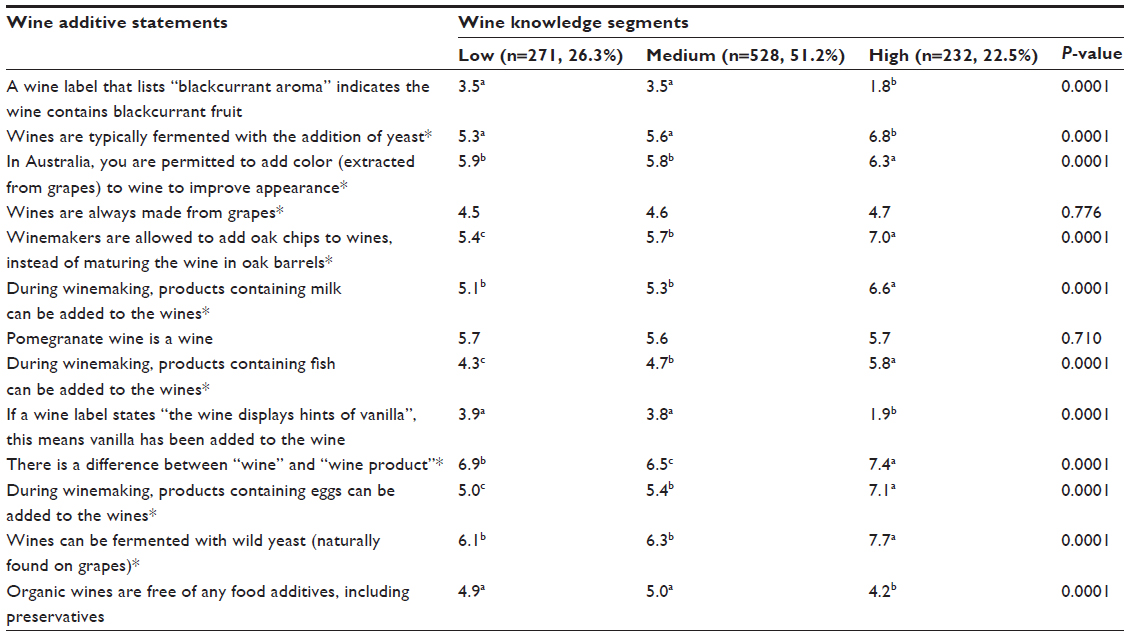 | Table 2 Australian consumers’ opinions on the use of additives in wine production |
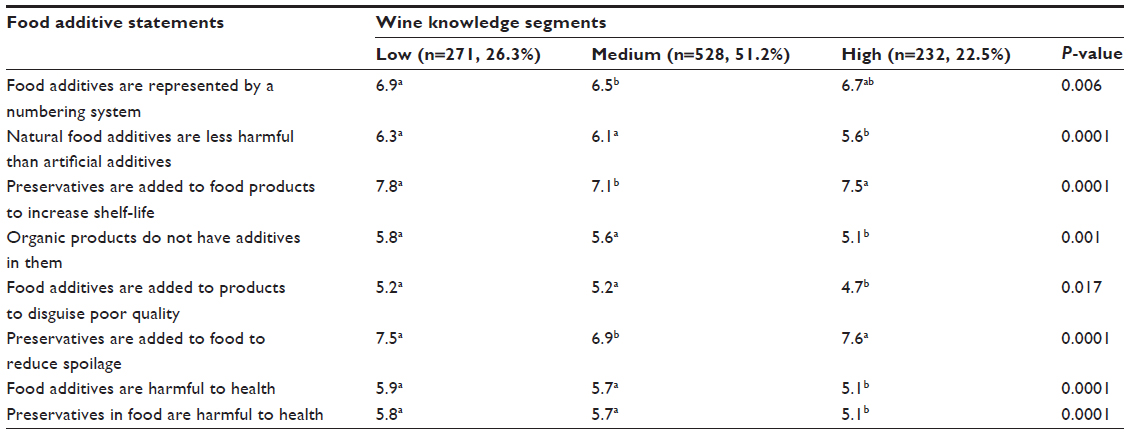 | Table 3 Australian consumers’ opinions on the use of additives in food production |
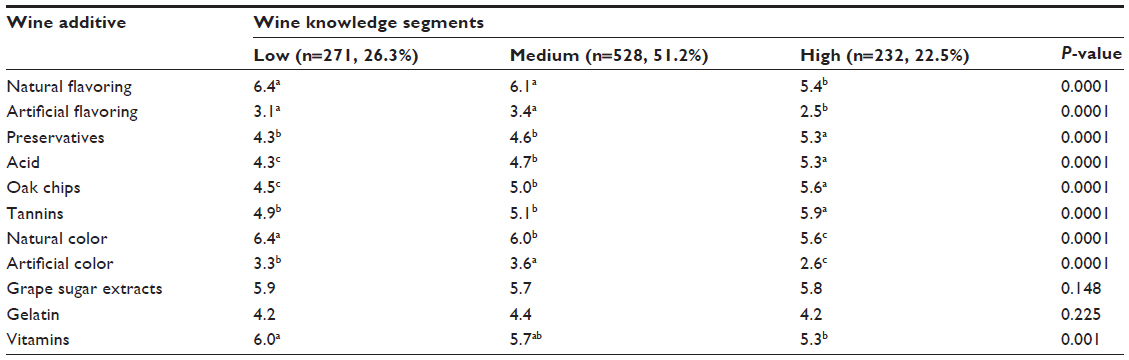 | Table 4 Australian consumers’ acceptance of additives in wine |
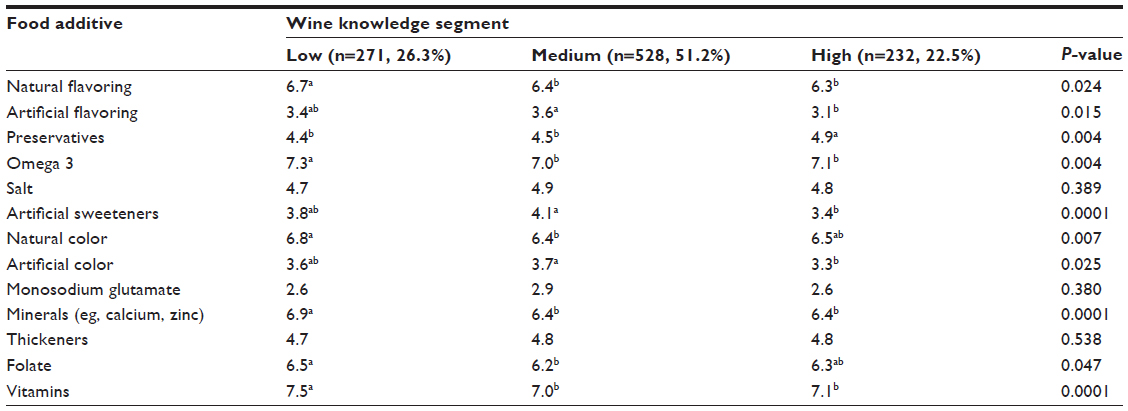 | Table 5 Australian consumers’ acceptance of additives in food |
Preliminary screening of the questionnaire was undertaken by 30 staff and students from the University of Adelaide’s Wine Science group, to ensure the clarity of survey questions.
Segmentation of consumers according to wine knowledge
Respondents were asked to rate their level of agreement (9-point scale) to the five statements of the subjective wine knowledge scale,23 where 1= strongly disagree, 5= neither agree nor disagree, and 9= strongly agree. The scale included both positively and negatively worded statements. The negatively worded statements were subsequently reversed, the scores summed and converted to a percentage. Then, following the protocol outlined by Quester and Smart,30 the 25th and 75th percentiles were identified and used as the cutoff points for the low and high knowledge segments, respectively, thereby creating three knowledge segments.
Statistical analysis
SPSS 20 (IBM Corporation, Armonk, NY, USA) was used to perform Cronbach’s alpha, Kaiser–Meyer–Olkin value, Bartlett’s test of sphericity, factor analysis, and Pearson correlation tests. XLSTAT (version 2011.5.01; Addinsoft, Paris, France) was used to perform one-way analysis of variance (ANOVA) where mean comparisons were performed by Fisher’s least significant difference (LSD) post hoc test at P<0.05.
Results and discussion
Consumer demographics, segmentation, and consumption behavior
The questionnaire was completed by 1,031 Australian wine consumers, who were recruited through a marketing research company and social media. The data from the two sources were analyzed to see if there were differences in the respective demographic profiles. As no differences were found (data not shown), the two datasets were combined. Participants were evenly distributed across the different age groups, with slightly higher participation by females (55.1%) than males (44.9%) (Table 1). Approximately half (51.3%) the participants held tertiary qualifications which were consistent with socio-demographic data reported for Australian wine consumers.31 Participants’ household incomes were slightly higher than the Australian median of approximately AUD$65,000,32 which can be attributed to the more qualified consumer sample.
Respondents were segmented using the subjective knowledge scale.23 The reliability and unidimensionality of the subjective knowledge scale was analyzed. The data revealed a Cronbach’s alpha of 0.87, the correlation matrix returned all values in excess of 0.3,33 the Kaiser–Meyer–Olkin value was 0.82, and Bartlett’s test of sphericity was significant (P<0.001). Subsequent factor analysis revealed a unidimensional scale which was used to segment the sample. The lowest quartile (n=271, 26.3%) scored less than 42.2% and the highest quartile (n=232, 22.5%) scored greater than 66.7%. The remaining 528 respondents (51.2%) became the medium knowledge segment.
The demographics for each knowledge segment (Table 1) revealed that the high knowledge segment comprised a higher proportion of male consumers (54.3%) than the low (36.6%) and medium (45.0%) knowledge segments (Table 1). Only 13.5% of the high knowledge segment comprised consumers aged below 25 or above 65 years of age; with most consumers (ie, 86.5%) aged between 25 and 65 years. Highly knowledgeable consumers were more likely to hold tertiary qualifications and thus, the highest household incomes were reported for this segment. In contrast, the low knowledge segment comprised the highest proportion of female consumers (63.4%), with age distributions skewed in favor of younger (18–24 years) and older (>65 years) consumers (ie, 30.3%). Only 45% of low knowledge consumers held tertiary qualifications, which likely explains their comparatively lower average household income; ie, 73% of low knowledge consumers reported a household income of <AUD$100,000. Wine was the preferred alcoholic beverage for each knowledge segment, but the high knowledge segment consumed significantly more wine (65.1%) than the other segments and in particular, consumed significantly more red wine (45.0%) than low (31.4%) and medium (37.3%) knowledge segments, who instead consumed higher proportions of sparkling and light-bodied white wines.
Consumer attitudes toward the use of additives in wine and food
Australian winemakers are permitted to use approximately 50 different winemaking additives during production, none of which are flavor additives per se. However, labeling laws only specify that preservatives (eg, sulfur dioxide) and fish-, milk- and egg-derived additives must be reported on wine back labels, for health purposes.6 Wine labels do not usually indicate the use of any other winemaking additives, so wine label content does not typically inform consumers regarding the use of additives in wine. The objectives of this study were to determine consumer acceptance of and attitudes toward winemaking additives. Consumers were therefore asked to indicate their agreement/disagreement to a series of statements related to the definitions of wine and wine products, winemaking practices, and the use of additives in wine (Table 2).
As expected, highly knowledgeable wine consumers generally had stronger convictions regarding winemaking practices; ie, they agreed that “Wines are typically fermented with the addition of yeast” (6.8/9), “Wines can be fermented with wild yeast” (7.7/9), “Winemakers are allowed to add oak chips to wines, instead of maturing the wine in oak barrels” (7.0/9), and that “During winemaking, products containing eggs can be added to the wines” (7.1/9). In contrast, low and medium knowledge segment responses to these statements were significantly lower, ie, ranging from 5.0 to 5.7, except for the “wild yeast” statement, for which responses ranged from 6.1 to 6.3. Responses close to 5.0, ie, “neither agree nor disagree”, are also known as “midpoint” responses34,35 and indicate neutrality or indifference, whereas “endpoint” responses, ie, responses situated away from 5.0, indicate greater conviction. As such, the high knowledge segment was less confident regarding the use of milk- and fish-derived products (6.6/9 and 5.8/9, respectively), whereas low and medium knowledge segment responses were again significantly lower at between 4.3 and 5.3. Irrespective of their level of wine knowledge, consumers were aware that wines exhibiting blackcurrant or vanilla aromas did not actually contain blackcurrant or vanilla; albeit the high knowledge segments were more strident in their responses (1.8 and 1.9/9) than the low and medium knowledge segments (3.5–3.9/9).
When it came to consumers’ attitudes toward what constitutes wine, wine products and organic wine, even knowledgeable consumers’ responses were less confident. There was no significant difference between wine knowledge segment responses to statements that “Wines are always made from grapes” (4.5–4.7/9) and “Pomegranate wine is a wine” (5.6–5.7/9). The high knowledge segment response to the statement “Organic wines are free of any food additives, including preservatives” was significantly lower (4.2/9) than that of low and medium knowledge segments (4.9–5.0/9), but all were considered “midpoint” responses. These results were in agreement with a previous study, which found approximately 50% of consumers were unsure of what constitutes a wine product, and as a consequence, these consumers negatively valued wine products.36
With regards to the use of additives in food (Table 3), consumers generally agreed that “Preservatives are added to food to increase shelf-life” (7.1–7.8/9) and “… to reduce spoilage” (6.9–7.6/9), in agreement with previous research.37 Consumers also agreed that “Food additives are represented by a numbering system” (6.5–6.9/9) and “Natural food additives are less harmful than artificial additives” (5.6–6.3/9), but relatively neutral responses (ie, responses ranging from 4.7 to 5.9) were observed for other statements. While significant differences were observed between wine knowledge segment responses, these were not considered meaningful, because mean responses only varied by ≤0.8. These results indicated the wine consumers surveyed had similar opinions regarding the use of additives in food, regardless of their knowledge of wine.
Consumer acceptance of the use of additives in wine and food
Consumers were presented with a list of additives and then were asked to indicate their acceptance of each as a potential additive in wine (Table 4) or food production (Table 5). In the case of wine additives, this included both permitted additives, such as oak chips, tannins, and acid, and additives not currently permitted, such as artificial color, artificial flavoring, and vitamins. Low and medium knowledge segments were moderately accepting of the use of natural flavoring, natural color, and vitamins; with mean responses for these additives ranging from 5.7 to 6.4/9. This was surprising, given flavorings and vitamins are not permitted additives and only grape-derived color extracts qualify as legal winemaking additives. As expected, the high knowledge segment rated their acceptance of these additives slightly, but significantly lower (ie, between 5.3 and 5.6). Artificial color and flavoring were unanimously the least accepted additives, with mean responses ranging from 2.6 to 3.6 and from 2.5 to 3.4, respectively. Significantly, lower acceptance scores were observed for the high knowledge segment, which again might reflect this segment’s greater knowledge of wine, ie, their awareness that artificial color and flavor are not permitted wine additives. These findings were perhaps not surprising, given previous studies have found consumers generally consider natural additives to be more appealing and less of a health or environmental concern compared with artificial additives.38,39 The acceptance of conventional additives, ie, preservatives, acid, oak chips, and tannins, also tended to reflect each segments’ level of wine knowledge; with knowledgeable consumers significantly more accepting of winemaking additives (5.3–5.9/9), than low and medium wine knowledge segments (4.3–5.1/9). No significant differences in acceptance were observed between segments for grape sugar extracts, which were somewhat acceptable (5.7–5.9), or gelatin, which was somewhat unacceptable (4.2–4.4), despite both being permitted and commonly used winemaking additives.
With respect to food additives (Table 5), consumers were generally accepting of natural flavoring (6.3–6.7/9), omega 3 fatty acids (7.0–7.3/9), natural color (6.4–6.8/9), minerals (6.4–6.9/9), folate (6.2–6.5/9), and vitamins (7.0–7.5/9), ie, additives likely to be perceived to be natural and/or to afford health benefits. Significant differences were observed between wine knowledge segment responses, but again these were very slight differences (0.3–0.5) and thus not considered to be meaningful. Artificial flavor, artificial color, and monosodium glutamate were the least accepted additives, with acceptance scores ranging from 2.6 to 3.6. Artificial sweeteners were also considered to be unacceptable, with scores ranging from 3.4 to 4.1. Whereas neutral responses (ie, 4.7–4.9/9) were given to salt and thickeners, with no significant differences observed between wine knowledge segment responses.
Collectively, these results demonstrate that consumers are considerably more accepting of natural additives and additives associated with health benefits than the use of artificial additives. Importantly, the results also show that wine consumers accept the use of natural flavor additives and reject the use of artificial flavor additives, and that consumers’ wine knowledge impacts their perceptions of additives. Irrespective of their wine knowledge, consumers considered natural flavorings and colors, and additives associated with health benefits (eg, vitamins, minerals, and omega 3 fatty acids) to be acceptable food additives. In contrast, winemaking additives, even commonly used and legally permitted additives such as tartaric acid, preservatives, oak chips, and tannins, were considered far less acceptable, particularly by less knowledgeable consumers.
Consumers were also asked which of the additives listed in Table 4 should be reported on the back label of wine bottles. Consumer responses indicated that those additives with relatively low acceptance scores should be listed on wine labels, ie, preservatives, artificial flavorings, and artificial colors (data not shown). These findings were in agreement with an earlier study concerning consumer perspectives on food labeling, which found consumer support for preservatives and artificial additives to be listed as ingredients.40
Consumer flavor preferences in white and red wines
The survey concluded with an optional question asking consumers, “If you could create a wine with your favorite flavors, what would you make?” The ten most popular flavors for inclusion in white and red wines are listed in Table 6. The flavors desired by consumers in white wines (Table 6) were primarily fruit flavors, in particular lemon, citrus, apple, and mango, but vanilla and honey were also among the top ten flavors suggested. These findings correspond with previous research which reported white wine consumers prefer citrus, apricot, apple, and peach.41 Interestingly, less knowledgeable consumers, who were predominantly women (63.4%), indicated a higher preference for “sweet fruit” flavors in white wines, compared with high knowledgeable consumers. This highlights low knowledge consumers’ misuse of the term “sweet”, ie, sweetness is a technical description of taste, rather than a description of flavor, but also likely reflects this segments’ preference for sweet wine styles. This finding is in agreement with a previous study concerning the influence of sex on wine selection behavior, which found female wine consumers preferred sweeter wine styles and fruity, vanilla flavors, whereas men instead preferred oak, spice and pepper aromas.42
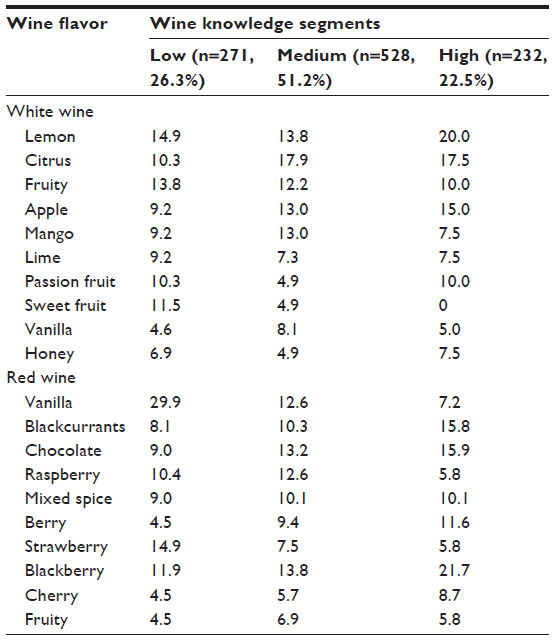 | Table 6 Consumer preferences for flavors in white and red wines |
The flavors desired by consumers in red wines were again predominantly fruit flavors, particularly berry fruits such as raspberry, blackberry, blackcurrant, and strawberry. Again, this was in agreement with previous findings that red wine consumers have strong preferences for “berry” aromas, including cherry, plum, blackberry, redcurrant, raspberry, and strawberry.42 Furthermore, attributes associated with oak maturation, ie, vanilla, chocolate, and spice, were also suggested. Responses from the low knowledge segment indicated a strong preference for vanilla, which provides valuable guidance to industry with respect to developing wine styles targeted specifically to less knowledgeable consumers.
Conclusion
Current legislation does not permit the addition of flavorings to wine, despite their routine use by other food and beverage industries to enhance aroma, flavor, and consistency. The wine industry could potentially utilize flavor additives to improve wine quality, for example in seasons where ideal fruit composition cannot be achieved without intervention and/or to tailor wine sensory attributes to meet the specific expectations and preferences of different segments of the target market. Findings from this study suggest most consumers would be more accepting of the addition of natural flavorings to wine, than of many of the additives currently used in winemaking, albeit consumers’ wine knowledge influenced their perceptions of and attitudes toward winemaking additives. Future research will investigate consumer preferences for wines made with the addition of natural flavorings. There are conflicting views regarding whether or not food additives should be used during the winemaking process.43 This study does not advocate one way or the other, but instead sought to assist the wine industry to evaluate the potential benefits that food additives might afford, so that winemakers can make more informed decisions, should legislation change. Finally, a limitation to the study should be acknowledged, ie, that the wine consumers who chose to participate in the survey may have been more interested in and involved with wine than the average Australian wine consumer and that therefore, they possessed a higher level of wine knowledge.
Acknowledgments
The authors gratefully acknowledge Marie Adam for technical assistance; PureProfile for data collection; the wine consumers who participated in the survey; and Renata Ristic for helpful discussions and encouragement. Yaelle Saltman thanks the Australian Grape and Wine Authority for provision of a research scholarship.
Disclosure
The authors report no conflicts of interest in this work.
References
Fennema OR. Food additives – an unending controversy. Am J Clin Nutr. 1987;46(1):201–203. | |
Ross RP, Morgan S, Hill C. Preservation and fermentation: past, present and future. Int J Food Microbiol. 2002;79(1):3–16. | |
Branen AL, Davidson PM, Salminen S, Thorngate J. Food Additives. 2nd ed. New York: Marcel Dekker; 2002. | |
Grunert KG. Food quality and safety: consumer perception and demand. Eur Rev Agric Econ. 2005;32(3):369–391. | |
Lück E, Lipinski GW. Foods, 3. Food additives. In: Bellussi G, Bohnet M, Bus J, Drauz K, Greim H, Jäckel KP, Karst U, Kleemann A, Kreysa G, Laird T, Meier W, Ottow E, Röper M, Scholtz J, Sundmacher K, Ulber R, Wietelmann U, editors. Ullmann’s Encyclopedia of Industrial Chemistry. Weinheim: Wiley-VCH; 2000:671–673. | |
Food Standards Australia New Zealand. Food Standards Codes 2.7.4 and 4.5.1. Available from: http://www.foodstandards.gov.au/. Accessed October 31, 2014. | |
McCutcheon E, Bruwer J, Li E. Region of origin and its importance among choice factors in the wine-buying decision making of consumers. Int J Wine Bus Res. 2009;21(3):212–234. | |
Phillips R. Wine and adulteration. History Today. 2000;50(7):31. | |
Holmberg L. Wine fraud. Int J Wine Res. 2010;2:105–113. | |
Kester E. Wine: antifreeze scandal ‘was the best thing that happened’. Financial Times. 2010 Oct 21. Available from: http://www.ft.com. Accessed June 6, 2005. | |
Lechmere A. KWV sacks winemakers in additive scandal: Decanter. December 10, 2004. Available from: http://www.decanter.com/wine-news. Accessed June 6, 2005. | |
Stone K. Winery fined $4000; Kingston Estate’s guilty plea over chemical additive. The Advertiser. 2001 Jan 19. | |
Speedy B. Fosters has sales strategy in a very fruity wine. The Australian. 2010 Sept 30. | |
Piggott JR. Understanding flavour quality: difficult or impossible? Food Qual Pref. 1994;5(1–2):167–171. | |
van Kleef E, van Trijp H, Luning P. Consumer research in the early stages of new product development: a critical review of methods and techniques. Food Qual Pref. 2005;16(3):181–201. | |
Famularo B, Bruwer J, Li E. Region of origin as choice factor: wine knowledge and wine tourism involvement influence. Int J Wine Bus Res. 2010;22(4):362–385. | |
Johnson TE, Bastian SEP. A preliminary study of the relationship between Australian wine consumers’ wine expertise and their wine purchasing and consumption behaviour. Aust J Grape Wine Res. 2007;13(3):186–197. | |
Lockshin L, Jarvis W, d’Hauteville F, Perrouty J-P. Using simulations from discrete choice experiments to measure consumer sensitivity to brand, region, price, and awards in wine choice. Food Qual Pref. 2006; 17(3–4):166–178. | |
Lockshin L, Hall J. Consumer purchasing behaviour for wine: what we know and where we are going. Paper presented at the: International Wine Marketing Colloquium; July 26–27, 2003; Adelaide, Australia. | |
King ES, Johnson TE, Bastian SEP, Osidacz P, Francis LI. Consumer liking of white wines: segmentation using self-reported wine liking and wine knowledge. Int J Wine Bus Res. 2012;24(1):33–46. | |
Frøst MB, Noble AC. Preliminary study of the effect of knowledge and sensory expertise on liking for red wines. Am J Enol Vitic. 2002;53(4):275–284. | |
Park CW, Mothersbaugh DL, Feick L. Consumer knowledge assessment. J Consum Res. 1994;21(1):71–82. | |
Flynn LR, Goldsmith RE. A short, reliable measure of subjective knowledge. J Bus Res. 1999;46(1):57–66. | |
Dodd TH, Laverie DA, Wilcox JF, Duhan DF. Differential effects of experience, subjective knowledge, and objective knowledge on sources of information used in consumer wine purchasing. J Hosp Tour Res. 2005;29(1):3–19. | |
Veale R. Sensing or knowing? Investigating the influence of knowledge and self-confidence on consumer beliefs regarding the effect of extrinsic cues on wine quality. Int J Wine Bus Res. 2008;20(4):352–366. | |
Lockshin L, Lawrence S. Using product, brand and purchasing involvement for retail segmentation. J Ret Consum Ser. 1997;4(3):171–183. | |
Barber N, Taylor C, Strick S. Wine consumers’ environmental knowledge and attitudes: influence on willingness to purchase. Int J Wine Res. 2009;1:59–72. | |
Williams PG, Stirling E, Keynes N. Food fears: a national survey on the attitudes of Australian adults about the safety and quality of food. Asia Pac J Clin Nutr. 2004;13(1):32–39. | |
Worsley A, Scott V. Consumers’ concerns about food and health in Australia and New Zealand. Asia Pac J Clin Nutr. 2000;9(1):24–32. | |
Quester PG, Smart J. The influence of consumption situation and product involvement over consumers’ use of product attribute. J Consum Mark. 1998;15(3):220–238. | |
Mueller S, Lockshin L, Saltman Y, Blanford J. Message on a bottle: the relative influence of wine back label information on wine choice. Food Qual Pref. 2010;21(1):22–32. | |
Australian Bureau of Statistics. Census QuickStats. Available from: http://www.abs.gov.au/census Accessed July 7, 2013. | |
Pallant J. SPSS Survival Manual. 5th ed. Berkshire: McGraw-Hill Education; 2013. | |
Weijters B, Cabooter E, Schillewaert N. The effect of rating scale format on response styles: the number of response categories and response category labels. Int J Res Mark. 2010;27(3):236–247. | |
Garland R. The mid-point on a rating scale: is it desirable? Market Bull. 1991;2:66–70. | |
Mueller, SC, Umberger, WJ. Are consumers indeed misled? Congruency in consumers’ attitudes towards wine labeling information versus revealed preferences from a choice experiment. Paper presented at: Annual Meeting of the Agricultural and Applied Economics Association; July 25–27; 2010; Denver CO. | |
Gregory NG. Consumer concerns about food. Outlook Agric. 2000; 29(4):251–257. | |
Devcich DA, Pedersen IK, Petrie KJ. You eat what you are: modern health worries and the acceptance of natural and synthetic additives in functional foods. Appetite. 2007;48(3):333–337. | |
Rozin P. The meaning of “natural”. Psychol Sci. 2005;16(8):652–658. | |
Wandel M. Food labelling from a consumer perspective. Brit Food J. 1997;99(6):212–219. | |
Lesschaeve I. Wine consumer flavour preferences, in Chassagne D (ed.), 1st Wine Active Compounds Symposium. Beaune, France, OenoPluri Media. 2008:71–74. | |
Pineau B, Barbe JC, Van Leeuwen C, Dubourdieu D. Examples of perceptive interactions involved in specific “red-” and “black-berry” aromas in red wines. J Agric Food Chem. 2009;57(9):3702–3708. | |
Carey R. The art of oak. It starts with the science of oak compounds; part 1 of 2. Wines Vines. 2009;90(4):20–30. |
 © 2015 The Author(s). This work is published and licensed by Dove Medical Press Limited. The full terms of this license are available at https://www.dovepress.com/terms.php and incorporate the Creative Commons Attribution - Non Commercial (unported, v3.0) License.
By accessing the work you hereby accept the Terms. Non-commercial uses of the work are permitted without any further permission from Dove Medical Press Limited, provided the work is properly attributed. For permission for commercial use of this work, please see paragraphs 4.2 and 5 of our Terms.
© 2015 The Author(s). This work is published and licensed by Dove Medical Press Limited. The full terms of this license are available at https://www.dovepress.com/terms.php and incorporate the Creative Commons Attribution - Non Commercial (unported, v3.0) License.
By accessing the work you hereby accept the Terms. Non-commercial uses of the work are permitted without any further permission from Dove Medical Press Limited, provided the work is properly attributed. For permission for commercial use of this work, please see paragraphs 4.2 and 5 of our Terms.