")
Back to Journals » International Journal of Nanomedicine » Volume 12
ATP synthesis in the energy metabolism pathway: a new perspective for manipulating CdSe quantum dots biosynthesized in Saccharomyces cerevisiae
Authors Zhang R, Shao M, Han X, Wang C, Li Y, Hu B, Pang DW, Xie ZX
Received 18 January 2017
Accepted for publication 18 April 2017
Published 19 May 2017 Volume 2017:12 Pages 3865—3879
DOI https://doi.org/10.2147/IJN.S132719
Checked for plagiarism Yes
Review by Single anonymous peer review
Peer reviewer comments 3
Editor who approved publication: Dr Linlin Sun
Rong Zhang,1–3 Ming Shao,1–3 Xu Han,1–3 Chuan Wang,3–4 Yong Li,3–4 Bin Hu,3–4 Daiwen Pang,3–4 Zhixiong Xie1–3
1Hubei Key Laboratory of Cell Homeostasis, 2College of Life Sciences, Wuhan University, 3Key Laboratory of Analytical Chemistry for Biology and Medicine (Ministry of Education), 4College of Chemistry and Molecular Science, Wuhan University, Wuhan, People’s Republic of China
Abstract: Due to a growing trend in their biomedical application, biosynthesized nanomaterials are of great interest to researchers nowadays with their biocompatible, low-energy consumption, economic, and tunable characteristics. It is important to understand the mechanism of biosynthesis in order to achieve more efficient applications. Since there are only rare studies on the influences of cellular energy levels on biosynthesis, the influence of energy is often overlooked. Through determination of the intracellular ATP concentrations during the biosynthesis process, significant changes were observed. In addition, ATP synthesis deficiency caused great decreases in quantum dots (QDs) biosynthesis in the Δatp1, Δatp2, Δatp14, and Δatp17 strains. With inductively coupled plasma-atomic emission spectrometry and atomic absorption spectroscopy analyses, it was found that ATP affected the accumulation of the seleno-precursor and helped with the uptake of Cd and the formation of QDs. We successfully enhanced the fluorescence intensity 1.5 or 2 times through genetic modification to increase ATP or SeAM (the seleno analog of S-adenosylmethionine, the product that would accumulate when ATP is accrued). This work explains the mechanism for the correlation of the cellular energy level and QDs biosynthesis in living cells, demonstrates control of the biosynthesis using this mechanism, and thus provides a new manipulation strategy for the biosynthesis of other nanomaterials to widen their applications.
Keywords: ATP, biosynthesis, Saccharomyces cerevisiae, QDs, CdSe
Introduction
Nanomaterials,1 due to their unique properties, have been widely used in cell imaging,2,3 diagnosis,4,5 biosensing,6,7 electro-optic device,8 and so on, especially on medical imaging because of their (surface modified nanomaterials) high biocompatibility to cells. Thus, tremendous interest has arisen in the synthesis of well-dispersed and uniform-sized nanomaterials.9,10 Nanoparticles biosynthesized by organisms, without involving the toxic solvents, strict conditions, or expensive processes that are needed in chemical methods, have become a popular subject.11 Various nanoparticles are reported that are biosynthesized by bacteria,12–14 fungi,15,16 plants,17,18 mammalian cells,19 or even earthworms.20 Considering the simple culture methods, the low cost of the equipment, and the easy way to get the gradients, the biosynthesis of nanoparticles using microorganisms is the most economic and common approach.
There have been many investigations on the biosynthesis of nanomaterials, mainly concerning their applications.21 In order to obtain nanoparticles with a defined expectation in the biosynthesis, whether through optimizing the culture conditions or adjusting the concentrations of primary substrates, former studies were devoted to manipulating the biosynthesis by extrinsic factors, and few were on the intrinsic characters of the microorganisms applied in the biosynthesis. Ayano et al22 found that the optimal culture conditions to biosynthesize CdSe nanoparticles by Pseudomonas aeruginosa were when the cells were cultured at 25°C–40°C, 0.05–10 g L−1 of NaCl concentration, and neutral pH. According to Gericke and Pinches,23 the size and shape of gold nanoparticles biosynthesized by fungus could be manipulated by changing crucial growth parameters. They successfully obtained spherical, hexagonal, and triangular-shaped nanoparticles with different sizes through culturing under various pH and temperature conditions. Besides the studies of the adscititious substances and the culture conditions, there have also been some studies focused on the intrinsic metabolisms of the bioreactor used in the biosynthesis. For example, for Sb2O3 nanoparticles biosynthesized by yeast, reported by Jha et al,24 it was suggested that the membrane-bound and cytosolic oxidoreductases and quinines might be the key influential factors of the process. Phenol oxidases in the Lentinus edodes were proved to be responsible for the biosynthesis of Au nanoparticles.25 In general, current research has mostly focused on the culture conditions or the substances, while the role of energy has hardly been mentioned.
In the previous work of our laboratory, we constructed a convenient way to biosynthesize CdSe quantum dots (QDs) with baker’s yeast Saccharomyces cerevisiae26 and then promoted the QDs production by genetic modification.27 Glutathione (L-γ-glutamylcysteinylglycine, GSH) was found to be a vital compound in the biosynthesis of CdSe QDs, the intracellular content of which showed synchronized increase with the fluorescence intensities when seleniumized cells were initially incubated with CdCl2.27 Besides the substances that assisted with the biosynthesis of CdSe QDs, GO (gene ontology) analysis revealed that the proteins that encapsulated the CdSe QDs biosynthesized by yeast mostly functioned in cell energy metabolism (unpublished data); thus, this may indicate that energy has a noticeable role in the process. There may be a need for not only micromolecular polypeptides (such as GSH)27 but also cell energy to ensure the ambient temperature and strict conditions for the stable biosynthesis of CdSe QDs with good dispersal and uniformity. With its favorable biocompatibility characteristic, the system was successfully applied to construct a cell beacon using Staphylococcus aureus as a bioreactor.28
Figuring out the actual role that energy plays in the biosynthesis would be conducive to further understanding of the mechanism.26,27 The present study used the concentrations of intracellular ATP (the most commonly used direct energy resource) and fluorescence intensities as indicators to investigate the influences of energy on the biosynthesis of CdSe QDs in yeast. Intracellular Se or Cd concentrations were checked during the cell-seleniumized phase or the crystallization phase26 with inductively coupled plasma-atomic emission spectrometry (ICP-AES) and atomic absorption spectroscopy (AAS) to confirm the influences on the absorption of the substrates and the crystallization of CdSe QDs. Finally, the fluorescence intensities were improved by genetic modification of the ATP metabolism pathway. In consequence, the biosynthesis can be controlled with defined expectation and it can be used as guidance for the biosynthesis of other similar nanoparticles with yeast or other microorganisms. The present work provides a new perspective for future research on the biosynthesis mechanisms of nanomaterials and makes it easier to convert the biosynthesized nanomaterials into applications.
Materials and methods
Strains and media
Saccharomyces cerevisiae BY4742 (MATα his3-Δ1 leu2-Δ0 lys2-Δ0 ura3-Δ0) (wild-type, WT) and the Δatp1, Δatp2, Δatp14, Δatp17, Δpfk1, and Δrgt2 mutant strains were obtained from the European Saccharomyces cerevisiae Archive for Functional Analysis (Bad Homburg, Germany) (all strain information is listed in Table S1). The PGAL1-ADK1 and PGAL1-SAM2 strains were constructed in this study (Table S2). Strains were cultured in 1 g L−1 yeast extract and 2 g L−1 peptone (YP), supplied with 2 g L−1 glucose (YPGlu) or YP supplied with 2 g L−1 galactose (YPGal) media. Unless otherwise indicated, the reagents used in the present work were obtained from the Sinopharm Chemical Reagent Co. (Shanghai, China).
Biosynthesis of CdSe QDs
The biosynthesis of CdSe QDs with yeast was performed according to the previous study,26 with a slight adjustment, as follows: stationary phase cells were co-incubated with Na2SeO3 at a final concentration of 2.5 mM for 24 hours to get seleniumized (hereafter referred to as seleniumized cells), and then the cells were collected by centrifugation at 3,000 g for 1 min. The cell pellets were resuspended in an equal volume of fresh medium and then co-incubated with CdCl2 at a final concentration of 1 mM to synthesize CdSe QDs (the biosynthesis procedure was presented in Figure S1). After incubation for 24 hours, the fluorescence intensity was measured. The cells were cultivated under 30°C at 200 revolutions per minute (rpm) (cells’ growing curves are shown in Figure S2).
To avoid influences of the cell biomass, all the cultures were adjusted to the same cell density (optical density [OD]600=12.0) before co-incubating with Na2SeO3.
Intracellular CdSe QD fluorescence intensity measurement
Cell samples were collected after biosynthesis for fluorescence measurement (with the OD600 of 6.0) and washed with 1 mL of 1× phosphate-buffered saline (PBS, pH 7.5) and then resuspended with 1 mL of 1× PBS (pH 7.5) before fluorescence intensity determination. The intracellular CdSe QDs fluorescence intensity was calculated by subtraction of the cellular autofluorescence (seleniumized cells) from the total fluorescence. All fluorescence spectra of the cells synthesizing QDs and seleniumized cells were acquired with a Cytation3 Multi-mode Reader from BioTek (Winooski, VT, USA), with an excitation wavelength of 400 nm and the detection emission spectrum of 450 to 700 nm.
Determination of intracellular ATP levels
Samples of 1×10⁷ cells (OD600=1.0) were harvested and washed with 200 μL sterilized ice-cold deionized water three times. Then, cell pellets were resuspended in 500 μL of ATP determination lysis solution and transferred to 2 mL snap-cap tubes with 0.5 g glass beads (425–600 μm in diameter; Sigma, St Louis, MO, USA). Cells were ruptured with a Mini-Bead beater-16 (BioSpec, Bartlesville, OK, USA) for 1 min on and 1 min pause on ice to dissipate heat, and repeated for two times. Then, the tubes were centrifuged at 16,000 g, at 4°C, for 5 min, and the supernatants were collected in new centrifuge tubes. Samples were then processed and intracellular ATP concentrations were determined as described in the protocol of the ATP Assay Kit (S0026; Beyotime, Shanghai, China) with a Cytation3 Multi-mode Reader from BioTek.
Determination of intracellular GSH levels
Samples of 1×10⁷ cells (OD600=1.0) were centrifuged and harvested, and then the pellets were washed with 200 μL of sterilized ice-cold 1× PBS (pH 7.5) two times. The cell pellets were resuspended with 160 μL of sterilized ice-cold deionized water, followed by the addition of 160 μL of sterilized ice-cold 20 mM HCl and 80 μL of sterilized ice-cold 5% (wt/vol) 5-sulfosalicylic acid. The suspensions were transferred to 2 mL snap-cap tubes with 0.5 g acid-washed glass beads, and the cells were ruptured with a Mini-Bead beater-16 (BioSpec) for 1 min on and 2 min pause on ice, and repeated once. Then, the tubes were centrifuged at 13,000 g, at 4°C, for 15 min, and the supernatants were collected in new centrifuge tubes. Samples were then processed and the intracellular GSH concentrations were measured as described in the protocol of the Total Glutathione Assay Kit (S0052; Beyotime) by a Cytation3 Multi-mode Reader from BioTek.
ICP-AES and AAS analysis
Cell suspensions (2 mL) were centrifuged at 5,000 g for 3 min, and then the supernatants were collected in centrifuge tubes before filtering with a 0.22-μm filter unit (Merck Millipore, Billerica, MA, USA). HNO3 and water (Milli-Q, 18.2 MO; Merck Millipore) were added to the solutions to get a final concentration of 1% (vol/vol), and the samples were stored at 4°C until needed. The cell pellets were collected and washed with ice-cold 1× PBS before resuspension with 500 μL of water (Milli-Q, 18.2 MO), and then transferred to polytetrafluoroethylene reactors. After 2 mL of HNO3 had been added to the samples, they were placed on a heating plate at 120°C for 2 hours and then at 90°C until the residues were around 100 μL. HNO3 (1%, vol/vol) was added to make a total volume of 1 mL and diluted to 10 mL with water (Milli-Q, 18.2 MO) prior to determination. The Se concentrations in the supernatants or inside the cells were determined with ICP-AES (IRIS II; Thermo Fisher Scientific, Fair Lawn, NJ, USA). The Cd concentrations were characterized using AAS with a ContrAA 700 high-resolution continuous light source atomic absorption spectrophotometer (Analytik Jena, Jena, Germany).
Seleno-compounds separation and characterization
A wet weight of 0.5 g seleniumized cells was collected and washed with 1× PBS (pH 7.5), and the cell pellet was then resuspended with 1× PBS (pH 7.5). Cells were disrupted with a Mini-Bead beater-16 (BioSpec) for 1 min on and 2 min pause on ice, twice. Samples were centrifuged to get the lysate, the protein concentrations of the samples were determined by the Bradford method,29 and then adjusted to the same value in all samples. Trypsin (100 mg) (Amersco, Solon, OH, USA) and TCS buffer (10×, 0.1 M Tris–Cl, pH 7.5, 10 mM CaCl2, 0.5% SDS) were added to the samples and then they were incubated at 37°C for 20 h. After centrifugation, the supernatants were collected and filtered with 0.22-μm filter units. Then, the samples were subjected to step-by-step ultrafiltration with 100 KD, 50 KD, 10 KD, and 3 KD Millipore ultrafiltration tubes at 4,500 rpm for 15 min. Then, the prepared samples were used for high-performance liquid chromatography (HPLC) with ICP mass spectrometry (MS) (HPLC–ICP-MS) measurement, which was performed on an Agilent 7500 ICP-MS system (Agilent, Santa Clara, CA, USA), coupled with a HPLC system (Shimadzu, Kyoto, Japan) equipped with a CAPCELL PAK C18 column (Shiseido, Tokyo, Japan).
Improving the biosynthesis of CdSe QDs
The promoter of gene ADK1 or SAM2 was replaced with a stronger promoter, PGAL1, through homologous recombination (details of the construction process are in Supplementary materials) to get overexpression. The modified strains were used to biosynthesize CdSe QDs cultured in YPGal medium (with galactose as an inducer of the overexpression).
Statistical analysis
All statistical analyses were performed using Origin 2016. The schematic diagram was made with Photoshop CC. Graph data are presented as means and SD. Two-sample t-tests were used on the data where appropriate.
Results
Intracellular ATP concentrations during yeast QDs biosynthesis
To confirm the influence of cellular ATP levels on the CdSe QDs biosynthesis in S. cerevisiae, cells of different processing stages of CdSe QDs biosynthesis were collected to determine the concentrations of intracellular ATP. The intracellular ATP concentrations of the WT cells were measured during a 12-hour incubation with Na2SeO3 at a final concentration of 2.5 mM; a sharp peak appeared at 2 hours after the introduction of Na2SeO3 into the culture (Figure 1A). Starting from the exponential phase, the ATP concentrations of the sample cells all sharply increased right after either Na2SeO3 or CdCl2 was added to the culture, and then rapidly reduced. The ATP concentrations of the control group remained stable, with a slight fluctuation at 24- to 48-hour cultivation; and after the cells were transformed to fresh medium at 48 hours, the concentrations decreased at first and then increased substantially. Clearly, the intracellular ATP concentrations had obvious changes during the process of QDs biosynthesis in the sample cells, while the control group had no such changes (Figure 1B).
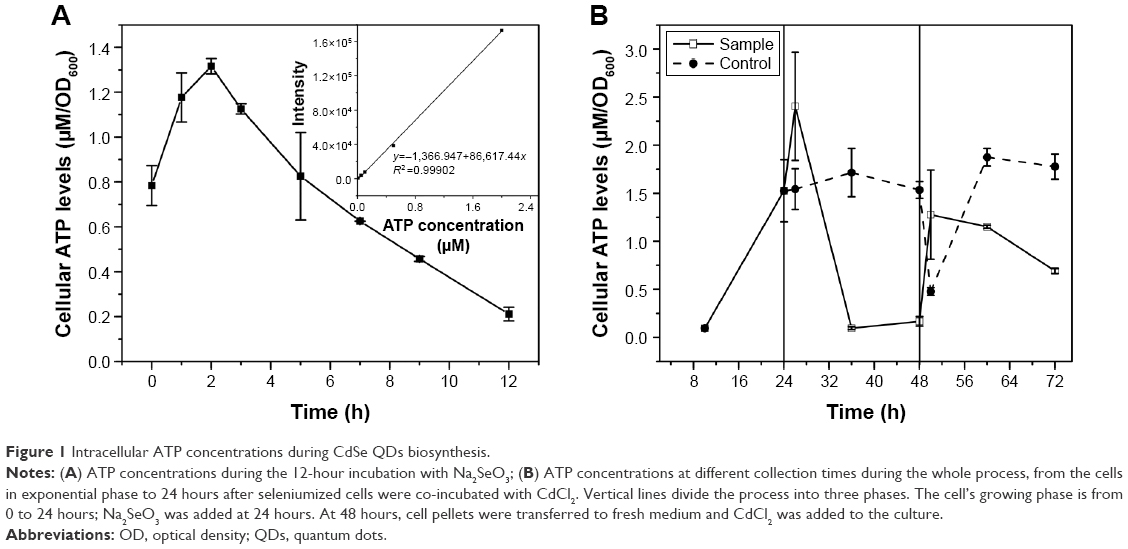 | Figure 1 Intracellular ATP concentrations during CdSe QDs biosynthesis. |
CdSe QDs biosynthesis under low ATP synthesis conditions
To inspect the relation between ATP synthesis and CdSe QDs biosynthesis, several ATP-synthesis-deficient strains were introduced. S. cerevisiae strain Δatp1 displays a complete loss of ATP synthase activity.30 The determination of the intracellular ATP concentration, with half the value of WT cells, proved that the Δatp1 strain was deficient in ATP synthesis (Figure 2). The fluorescence intensity of Δatp1 was just a quarter of that in the WT cells (Figure 2), which was consistent with the ATP concentration changes of the two strains. Other gene knock-out strains that were deficient in ATP synthesis, Δatp2,31 Δatp14,32 and Δatp17,33 were also applied in the synthesis of QDs to further confirm the results, with an outcome concurrent with that for the Δatp1 strain, namely much lower intracellular ATP concentrations and QDs fluorescence intensities than for WT cells (Figure 2C and D). The fluorescence intensities of Δatp2, Δatp14, and Δatp17 cells were 1/2, 2/5, and 1/4 (Figure 2C) of the WT cells, whereas the ATP concentrations were 1/2, 1/10, and 1/8 (Figure 2D) of the WT cells, respectively. The fluorescence intensities roughly conformed to the intracellular ATP concentrations.
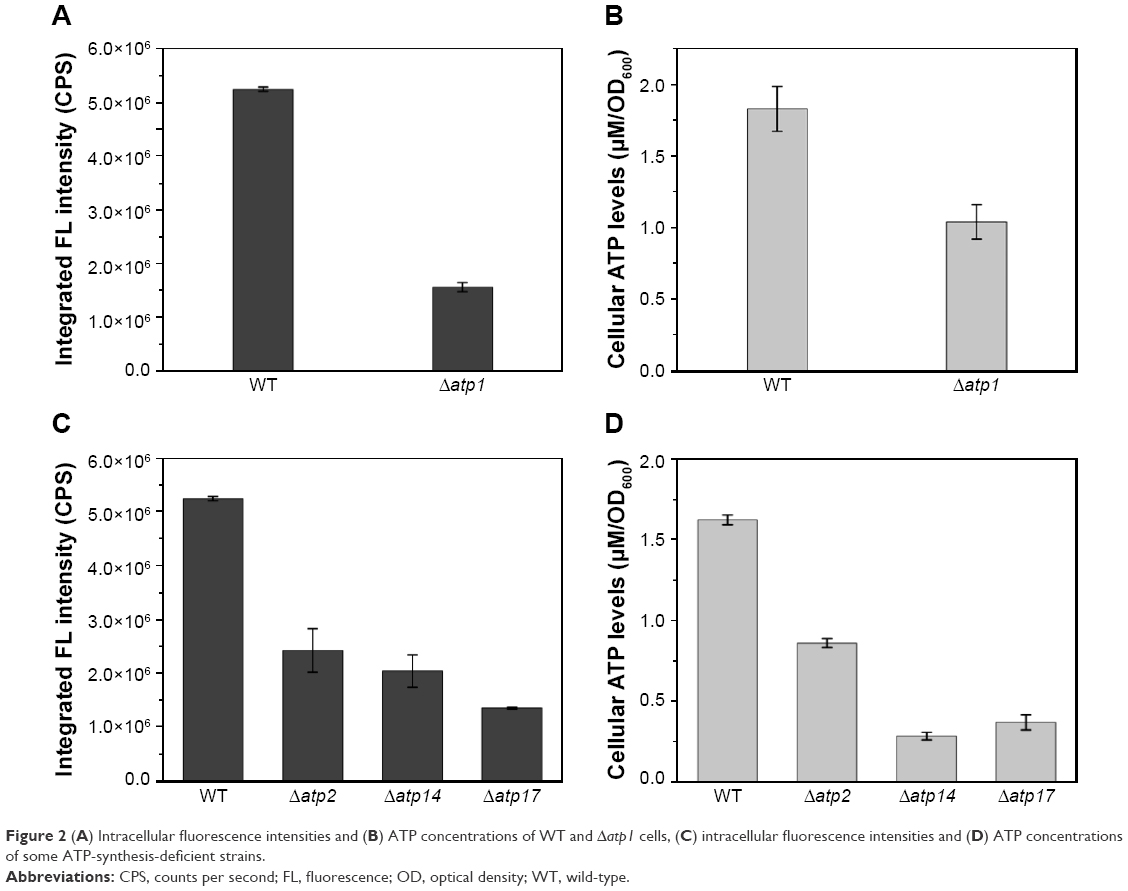 | Figure 2 (A) Intracellular fluorescence intensities and (B) ATP concentrations of WT and Δatp1 cells, (C) intracellular fluorescence intensities and (D) ATP concentrations of some ATP-synthesis-deficient strains. |
Total intracellular GSH of the Δatp1 strain and its QDs synthesis ability
As to the specific reason for the influence of ATP on QDs biosynthesis, we suspected it was due to effects on intracellular GSH synthesis. In our previous study, we found that GSH was important for the QDs biosynthesis and the intracellular GSH content showed synchronized increase with the fluorescence intensity,26,27 so the GSH contents were checked in this study too. Interestingly, when the total GSH concentrations were measured in the Δatp1 strain after seleniumized cells were treated with CdCl2, that tendency referred to above disappeared. Instead, the GSH level kept steady around a certain value (about 9 μM per 1 OD600 cells) with only a slight fluctuation, yet somehow was higher than that of WT cells (Figure 3A). At time 0, when the CdCl2 was added to the culture, GSH concentrations in Δatp1 and WT cells were 6.72 and 2.95 μM per 1 OD600 cells, respectively. Nevertheless, GSH concentrations in the WT cells presented a trend of gradual increase with culturing time for seleniumized cells incubated with CdCl2. The intracellular fluorescence intensities, however, had the same tendency of gradual increase in both WT and Δatp1 strains, but with a growing difference between them (Figure 3B).
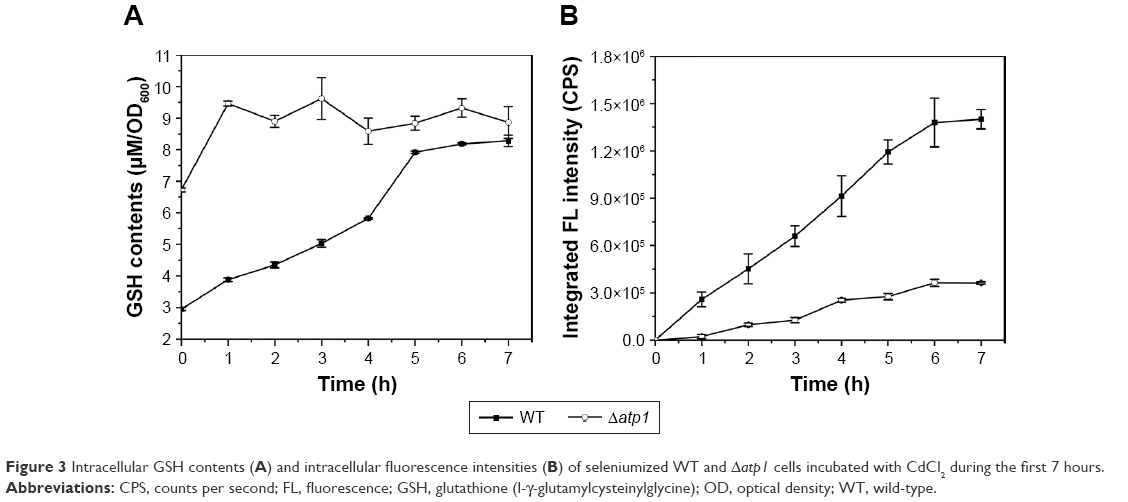 | Figure 3 Intracellular GSH contents (A) and intracellular fluorescence intensities (B) of seleniumized WT and Δatp1 cells incubated with CdCl2 during the first 7 hours. |
Se and Cd concentrations during co-incubation with yeast cells while synthesizing QDs (ICP-AES and AAS assays)
Both the intracellular and extracellular concentrations of Se and Cd were measured during the QDs biosynthesis processes of WT and Δatp1 strains. Within error, nearly all Se or Cd lost from the medium was absorbed into the cells (Figure 4). Although compared with the amount of Na2SeO3 (final concentration of 2.5 mM) or CdCl2 (final concentration of 1 mM) added to the culture (which was the optimized amount for CdSe QDs biosynthesis, data not shown), WT and Δatp1 both just took a small amount inside the cells; they did have the same trend of absorption of both compounds (Figure 4). The differences were evident between WT and Δatp1 strains. The Se uptake of WT was quite conspicuous at first and then slowed down and stabilized after incubation for 12 hours, reaching a final concentration of 0.48±0.029 mM, whereas the Se concentration inside Δatp1 cells was negligible with a concentration of 0.04±0.016 mM. The intracellular Se differences between Δatp1 and WT began to emerge 2 hours after the addition of Na2SeO3 and increased during the culturing over the following 24 hours (Figure 4A). A similar result was observed with the uptake of Cd, the increase tendency of the two strains was the same, only with a lower concentration in Δatp1 cells. The final concentration in Δatp1 cells was 0.10±0.004 mM, less than half of that in WT cells, which was 0.27±0.045 mM (Figure 4B).
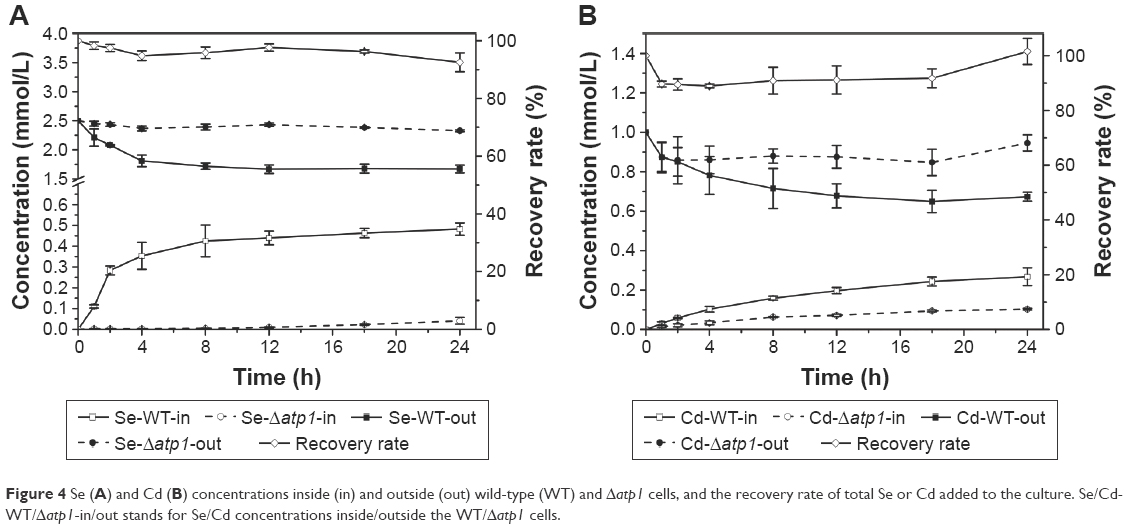 | Figure 4 Se (A) and Cd (B) concentrations inside (in) and outside (out) wild-type (WT) and Δatp1 cells, and the recovery rate of total Se or Cd added to the culture. Se/Cd-WT/Δatp1-in/out stands for Se/Cd concentrations inside/outside the WT/Δatp1 cells. |
Major seleno-amino acid determination in Δatp1 and WT cells
Seleniumized cells of WT and Δatp1 strains were collected, and their total proteins were extracted and digested to oligopeptides with trypsin to measure the main reduced Se species inside. On the basis of the previous study,26 organoSe compounds selenocystine [(Se-Cys)2], Se-methylseleno-L-cysteine (SeMC), and d,L-selenomethionine (Se-Met) were checked. HPLC–ICP-MS showed that the major seleno-amino acid (Se-Cys)2 signal in the WT sample was obviously stronger than that in the Δatp1 sample (Figure 5). The peak height of (Se-Cys)2 in Δatp1 cells was half that of WT cells.
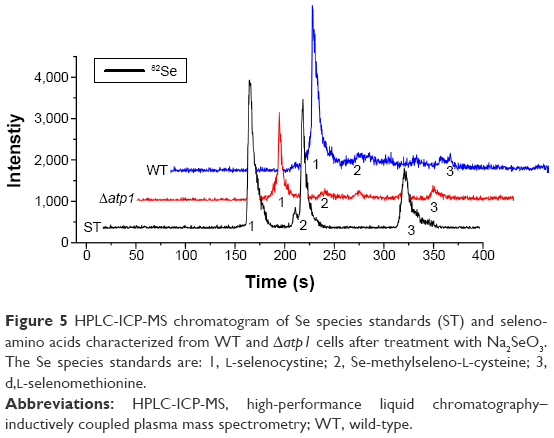 | Figure 5 HPLC-ICP-MS chromatogram of Se species standards (ST) and seleno-amino acids characterized from WT and Δatp1 cells after treatment with Na2SeO3. The Se species standards are: 1, L-selenocystine; 2, Se-methylseleno-L-cysteine; 3, d,L-selenomethionine. |
CdSe QDs biosynthesis under the influences of oxidative phosphorylation inhibitor or uncoupler
To investigate the effects of ATP on the absorption of Cd and QDs crystallization, the intracellular fluorescence intensities of cells under different concentrations of oxidative phosphorylation inhibitor (NaN3) or uncoupler (2,4-dinitrophenol, DNP), which were added to the culture during the incubation of seleniumized cells with CdCl2, were measured. The results in Figure 6A show that the intracellular fluorescence intensities decreased to less than half of the normal value along with the increase in the NaN3 concentrations from 75 to 200 mM, indicating the remarkable influence of the addition of NaN3 on QDs biosynthesis. When DNP was introduced into the culture, intracellular fluorescence intensities had a slight yet noticeable reduction (Figure 6B). At the same time, Cd concentrations of seleniumized cells incubated with CdCl2 were checked in the presence of 150 mM NaN3 or 2 mM DNP, with concentrations that had visible impacts on CdSe QDs biosynthesis (Figure 6C). Differences were not noticeable in the fluorescence intensities.
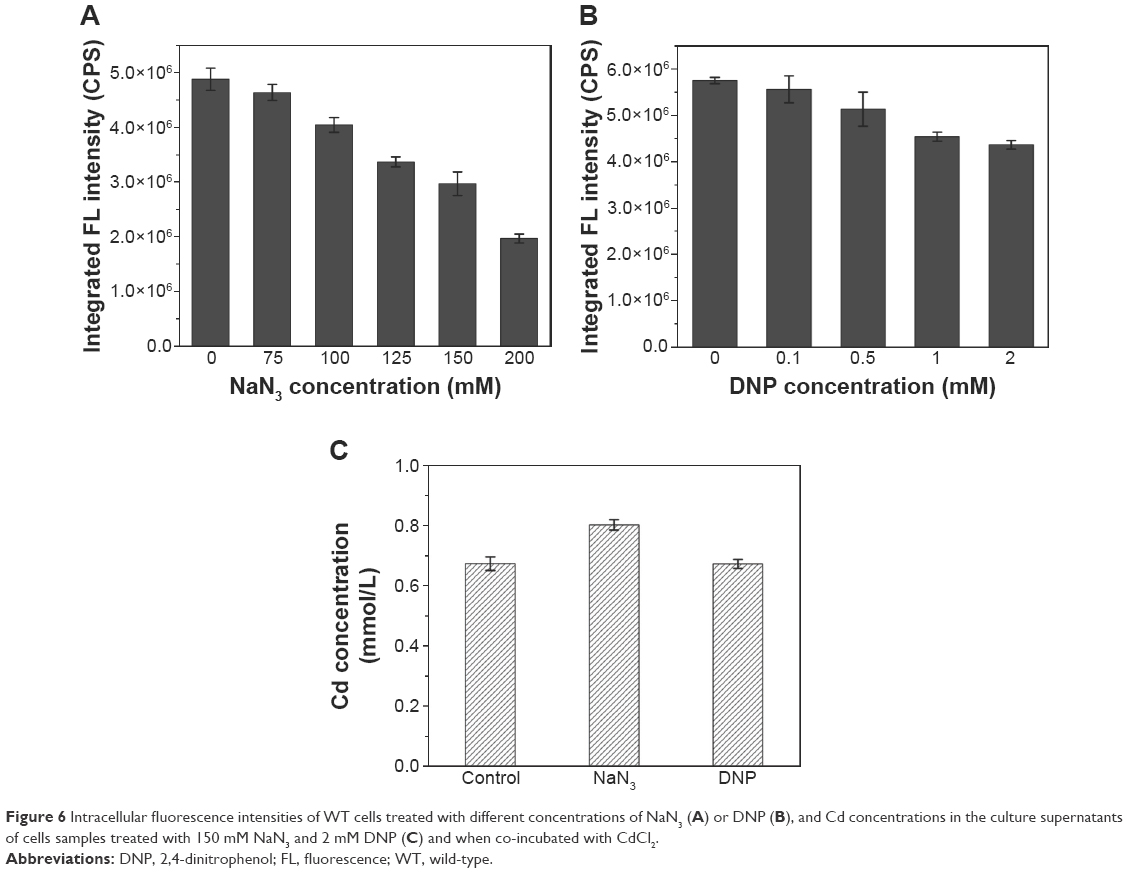 | Figure 6 Intracellular fluorescence intensities of WT cells treated with different concentrations of NaN3 (A) or DNP (B), and Cd concentrations in the culture supernatants of cells samples treated with 150 mM NaN3 and 2 mM DNP (C) and when co-incubated with CdCl2. |
QDs biosynthesis manipulation on the basis of ATP synthesis
To investigate the use of energy influence in the manipulation of biosynthesis, genetic modification of the energy metabolism pathway was introduced. Overexpression of the ADK1 gene leads to an accumulation of ATP levels inside the cells. When the promoter of ADK1 gene was replaced with a stronger promoter, the intracellular ATP concentration increased nearly two times (Figure 7A). Figure 7B shows that the intracellular fluorescence intensity was twice that in the WT cells.
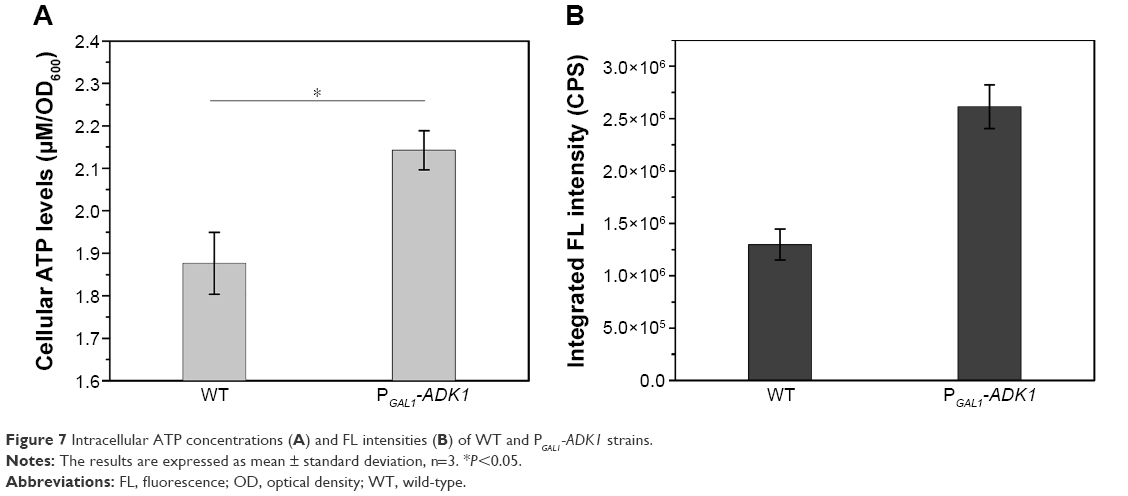 | Figure 7 Intracellular ATP concentrations (A) and FL intensities (B) of WT and PGAL1-ADK1 strains. |
Discussion
This study was approached to determine the specific influence of energy on CdSe QDs biosynthesis by yeast and took advantage of it to manipulate the biosynthesis process, for the reason that most of the proteins that encapsulated the QDs were functioned in cell energy metabolism (with the result of bioinformatics analysis, data not shown).
According to Li et al,27 the system in the present work uses “temporally–spatially coupling strategy” to biosynthesize CdSe QDs. Within this system, there are three phases: the cell-growing phase, the cell-seleniumized phase, and the CdSe QDs crystallization phase. Herein, the influence of ATP on the biosynthesis is carried out through the three crucial phases and mainly through the latter two phases.
To confirm the importance of the influence of ATP on biosynthesis, the intracellular ATP concentrations were determined. The ATP levels had significant variations not only in the cell-seleniumized phase (Figure 1A) but also in the whole procedure (Figure 1B). In contrast, the intracellular ATP concentrations of the control group (Figure 1B) were consistent with the cell growing state.34 To further confirm our suspicions, we used ATP-synthesis-deficient strains (Δatp1, Δatp2, Δatp14, and Δatp17) to biosynthesize CdSe QDs. The fluorescence intensities of the strains were as expected (Figure 2A and C). The fluorescence intensities and ATP concentrations of Δatp2, Δatp14, and Δatp17 (fermentation-related genes were not taken into consideration because cells were not undertaking fermentative metabolism to generate ATP in the cell-seleniumized phase, Figures S3 and S4) were not exactly accordant (Figure 2C and D), which may be due to other influential factors. In this case, we proposed that CdSe QDs biosynthesis by yeast cells is an energy-consuming process, besides having many other necessary conditions.27 In the quasi-biosystem referred to by Gu et al,35 they only need several substrates and co-factors to synthesize nanomaterials, but the temperature must reach at least 80°C–90°C, which was significantly higher than that for the biosynthesis. Hence, it may suggest that ATP synthesis inside the cells meets with the request of energy in the biosynthesis.
As already reported, GSH synthesis is an energy-consuming process.36 It was reasonable to hypothesize that the ATP effects may be due to its influence on the synthesis of GSH with its important role in our system.26,27 Interestingly, when the GSH contents were determined in the Δatp1 strain, the tendency of GSH levels increasing with fluorescence intensities, referred to above, did not appear (Figure 3A). The content level was higher than that of WT cells during the testing period, which may be because the addition of CdCl2 in seleniumized cells stimulated an increase of GSH.37 And because the addition of Na2SeO3 would trigger the upregulation of GSH,27 with lower intracellular Se concentration, the GSH cannot be used effectively38 and results in the higher GSH content in Δatp1 cells at time 0 than that of WT cells. These results (Figure 3A and B) attested that within the low ATP synthesis strains (such as Δatp1) mentioned, it was the utilization rather than synthesis of GSH that was impeded by the ATP levels.
With the results above, it was shown that ATP had a significant influence on CdSe QDs biosynthesis by yeast. Determining where ATP had its effects was important and urgent for its not insignificant role in the biosynthesis. Since there were two critical phases in the biosynthesis process, the influences of ATP were investigated through these two phases. Figure 4 shows the intracellular and the extracellular concentrations of the Se or Cd measured during the cell-seleniumized phase or the crystallization phase. The shortage of ATP synthesis caused an absorption deficiency of both elements constructing CdSe QDs, resulting in poor fluorescence intensity. We suspected this could be linked to the way that SeO32− or Cd2+ entered the cells, which might need ATP.39,40
Once inside the cells, Se (+4) ions are reduced to Se (−2) ions, then the Cd2+ interacts with the seleno-precursors and forms QDs crystals. The main seleno-amino acids emerging during the biosynthesis, as the previous study suggested,26 were detected by HPLC–ICP-MS.41 In Figure 5, it is shown that the major seleno-amino acid peak heights in Δatp1 and WT samples were consistent with the fluorescence intensities between them (Figure 2B). The result was proof that the accumulation of the seleno-precursor was an energy-consuming process. A similar conclusion was reached for the crystallization phase. For the reason that Δatp1 cells cannot normally accumulate seleno-precursors, the oxidative phosphorylation inhibitor and uncoupler were introduced into the system instead. Both the inhibitor and uncoupler could induce the decline of the intracellular ATP concentration, except that the uncoupler had no influence on oxidoreduction.42,43 The introduction of the DNP (uncoupler) was to ensure that the reduction of the selenite was unaffected. It turned out that NaN3 had an evident impact on the crystallization (Figure 6A), whereas DNP had a lesser yet noticeable influence (Figure 6B). Under their influence, the uptake of Cd was nearly impervious (Figure 6C) at the concentration when the intracellular ATP concentration became lower (Figure S5) (glycolysis inhibitor had been taken into consideration because the influence on ATP generation was not obvious, Figure S6). As a consequence, without altering the Cd absorption, the importance of ATP in the QDs crystallization was confirmed.
Thus, the specific influence of ATP was made clear. Figure 8 briefly describes the QDs biosynthesis process in yeast and shows the points of ATP action. It shows that ATP guarantees the uptake of the two inorganic compounds, helps with the accumulation of the seleno-precursors, and facilitates the utilization of the GSH accumulated during the crystallization phase. As the most direct energy resource in the organisms, ATP plays indispensable roles in many biological processes,44,45 but its influence in the biosynthesis of nanomaterials has often been overlooked. With the present work, we have determined the difference between the intrinsic processes and the constructed ones, thus allowing better application of the connection to bilaterally control the biosynthesis process.
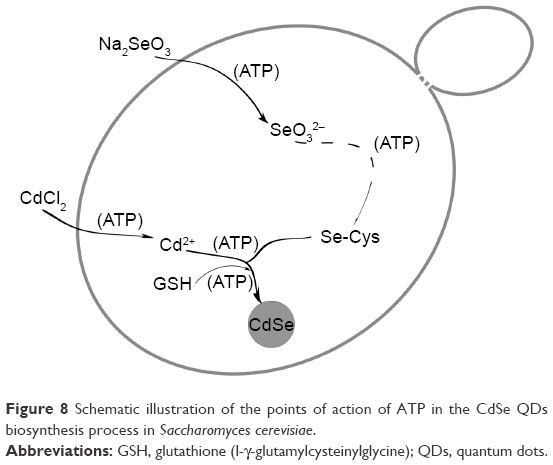 | Figure 8 Schematic illustration of the points of action of ATP in the CdSe QDs biosynthesis process in Saccharomyces cerevisiae. |
It was quite feasible that we could increase the production of the QDs through accumulation of intracellular ATP according to our findings. The overexpression of the ADK1 gene leads to the augmentation of ATP content.46 Through standard genetic techniques,47 the PGAL1-ADK1 strain was constructed (Figures S7 and S8). The phenotype was confirmed (Figure 7A), and the fluorescence intensity was consistent with the ATP levels. As it was reported, S-adenosylmethionine (SAM), one of the intermediate species of the methionine and cysteine metabolism pathway, needs methionine as a substrate and ATP for synthesis under the action of acyltransferase.48 Its seleno analog, SeAM, the synthesis of which is also affected by ATP content,38 is believed to be an important intermediate compound in the biosynthesis of CdSe QDs in yeast (unpublished data). An increase in ATP could lead to the accumulation of SAM, and under Se-rich culture, it would be SeAM. By direct overexpression of SAM2 gene to achieve the SAM accumulation, a PGAL1-SAM2 strain was successfully constructed (Figures S7 and S9A), and the intracellular SAM content was checked (Figure S9B). Figure 9 shows that the fluorescence intensity of the PGAL1-SAM2 strain was about 1.5 times of that in the WT strain, which was consistent with the results of PGAL1-ADK1 strain. In summary, it does not matter whether the ATP content was indirectly increased or an intermediate compound in the process was directly increased, as it would give the same result, namely, a prominent increase in QDs biosynthesis ability.
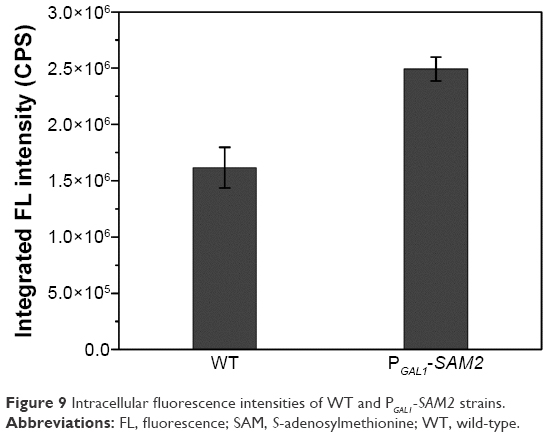 | Figure 9 Intracellular fluorescence intensities of WT and PGAL1-SAM2 strains. |
Conclusion
In summary, we have uncovered a vital role of ATP played in the biosynthesis of CdSe QDs by yeast without changing the QDs fluorescent properties (Figures S10 and S11). Through investigating the specific interaction processes, the biosynthesis could be promoted simply by genetic modification of the WT strain. With the present work, we can integrate substance flux and energy flux49 in the biosynthesis process. To the best of our knowledge, the role of energy in the biosynthesis of nanoparticles in microorganisms has not been reported yet, and this is the first study that has focused on energy influence, filling the gap in the research about its mechanism. Other than complementation of the understanding of the biosynthesis process, what’s more important is that this could offer a new perspective on the manipulation of nanoparticles biosynthesis using microorganisms aiding further applications.
Acknowledgments
This work was supported by the National Natural Science Foundation of China (21272182 and 31570090) and the National Basic Research Program of China (973 Program, number 2013CB933904). This project is partially supported by the Chinese 111 Project Grant B06018, the National Fund for Fostering Talents in Basic Sciences (J1103513), National Infrastructure of Natural Resources for Science and Technology Program of China (number NIMR-2015–8), and the Laboratory (Innovative) Research Fund of Wuhan University. We are grateful to XS Feng for ICP-AES and AAS measurement.
Disclosure
The authors report no conflicts of interest in this work.
References
Alivisatos AP. Semiconductor clusters, nanocrystals, and quantum dots. Science. 1996;271(5251):933–937. | ||
Shinchi H, Wakao M, Nagata N, et al. Cadmium-free sugar-chain-immobilized fluorescent nanoparticles containing low-toxicity ZnS-AgInS2 cores for probing lectin and cells. Bioconjug Chem. 2014;25(2):286–295. | ||
Gao X, Liu X, Lin Z, Liu S, Su X. CuInS2 quantum dots as a near-infrared fluorescent probe for detecting thrombin in human serum. Analyst. 2012;137(23):5620–5624. | ||
Liu LW, Hu R, Law WC, et al. Optimizing the synthesis of red- and near-infrared CuInS2 and AgInS2 semiconductor nanocrystals for bioimaging. Analyst. 2013;138(20):6144–6153. | ||
Yong KT, Roy I, Hu R, et al. Synthesis of ternary CuInS2/ZnS quantum dot bioconjugates and their applications for targeted cancer bioimaging. Integr Biol (Camb). 2010;2(2–3):121–129. | ||
Liu X, Ju H. Coreactant enhanced anodic electrochemiluminescence of CdTe quantum dots at low potential for sensitive biosensing amplified by enzymatic cycle. Anal Chem. 2008;80(14):5377–5382. | ||
Liu X, Cheng L, Lei J, Liu H, Ju H. Formation of surface traps on quantum dots by bidentate chelation and their application in low-potential electrochemiluminescent biosensing. Chemistry. 2010;16(35):10764–10770. | ||
Nann T, Skinner WM. Quantum dots for electro-optic devices. ACS Nano. 2011;5(7):5291–5295. | ||
Huang HH, Zhao FC, Liu LG, et al. Emulsion synthesis of size-tunable CH3NH3PbBr3 quantum dots: an alternative route toward efficient light-emitting diodes. ACS Appl Mater Interfaces. 2015;7(51):28128–28133. | ||
Penner RM. Hybrid electrochemical/chemical synthesis of quantum dots. Acc Chem Res. 2000;33(2):78–86. | ||
Mandal D, Bolander ME, Mukhopadhyay D, Sarkar G, Mukherjee P. The use of microorganisms for the formation of metal nanoparticles and their application. Appl Microbiol Biotechnol. 2006;69(5):485–492. | ||
Rodrigues AG, Ping LY, Marcato PD, et al. Biogenic antimicrobial silver nanoparticles produced by fungi. Appl Microbiol Biotechnol. 2013;97(2):775–782. | ||
Dameron CT, Reese RN, Mehra RK, et al. Biosynthesis of cadmium-sulfide quantum semiconductor crystallites. Nature. 1989;338(6216):596–597. | ||
Hnain A, Brooks J, Lefebvre DD. The synthesis of elemental selenium particles by Synechococcus leopoliensis. Appl Microbiol Biotechnol. 2013;97(24):10511–10519. | ||
Shankar SS, Ahmad A, Pasricha R, Sastry M. Bioreduction of chloroaurate ions by geranium leaves and its endophytic fungus yields gold nanoparticles of different shapes. J Mater Chem. 2003;13(7):1822–1826. | ||
Bhainsa KC, D’Souza SF. Extracellular biosynthesis of silver nanoparticles using the fungus Aspergillus fumigatus. Colloids Surf B Biointerfaces. 2006;47(2):160–164. | ||
Shankar SS, Rai A, Ahmad A, Sastry M. Rapid synthesis of Au, Ag, and bimetallic Au core-Ag shell nanoparticles using Neem (Azadirachta indica) leaf broth. J Colloid Interface Sci. 2004;275(2):496–502. | ||
Chandran SP, Chaudhary M, Pasricha R, Ahmad A, Sastry M. Synthesis of gold nanotriangles and silver nanoparticles using Aloe vera plant extract. Biotechnol Prog. 2006;22(2):577–583. | ||
Tan LJ, Wan AJ, Li HL. Synthesis of near-infrared quantum dots in cultured cancer cells. ACS Appl Mater Interfaces. 2014;6(1):18–23. | ||
Stürzenbaum SR, Höckner M, Panneerselvam A, et al. Biosynthesis of luminescent quantum dots in an earthworm. Nat Biotechnol. 2013;8(1):57–60. | ||
Xiong LH, Cui R, Zhang ZL, et al. Uniform fluorescent nanobioprobes for pathogen detection. ACS Nano. 2014;8(5):5116–5124. | ||
Ayano H, Kuroda M, Soda S, Ike M. Effects of culture conditions of Pseudomonas aeruginosa strain RB on the synthesis of CdSe nanoparticles. J Biosci Bioeng. 2015;119(4):440–445. | ||
Gericke M, Pinches A. Microbial production of gold nanoparticles. Gold bulletin. 2006;39(1):22–28. | ||
Jha AK, Prasad K, Prasad K. A green low-cost biosynthesis of Sb2O3 nanoparticles. Biochem Eng J. 2009;43(3):303–306. | ||
Vetchinkina EP, Loshchinina EA, Vodolazov IR, Kursky VF, Dykman LA, Nikitina VE. Biosynthesis of nanoparticles of metals and metalloids by basidiomycetes. Preparation of gold nanoparticles by using purified fungal phenol oxidases. Appl Microbiol Biotechnol. 2017;101(3):1047–1062. | ||
Cui R, Liu HH, Xie HY, et al. Living yeast cells as a controllable biosynthesizer for fluorescent quantum dots. Adv Funct Mater. 2009;19(15):2359–2364. | ||
Li Y, Cui R, Zhang P, et al. Mechanism-oriented controllability of intracellular quantum dots formation: the role of glutathione metabolic pathway. ACS Nano. 2013;7(3):2240–2248. | ||
Xiong LH, Cui R, Zhang ZL, et al. Uniform fluorescent nanobioprobes for pathogen detection. ACS Nano. 2014;8(5):5116–5124. | ||
Kruger NJ. The Bradford method for protein quantitation. Methods Mol Biol. 1994;34:9–15. | ||
Takeda M, Chen WJ, Saltzgaber J, Douglas MG. Nuclear genes encoding the yeast mitochondrial ATPase complex. Analysis of ATP1 coding the F1-ATPase alpha-subunit and its assembly. J Biol Chem. 1986;261(32):15126–15133. | ||
Saltzgaber-Muller J, Kunapuli SP, Douglas MG. Nuclear genes coding the yeast mitochondrial adenosine triphosphatase complex. Isolation of ATP2 coding the F1-ATPase beta subunit. J Biol Chem. 1983;258(19):11465–11470. | ||
Arselin G, Vaillier J, Graves PV, Velours J. ATP synthase of yeast mitochondria. Isolation of the subunit h and disruption of the ATP14 gene. J Biol Chem. 1996;271(34):20284–20290. | ||
Spannagel C, Vaillier J, Arselin G, Graves PV, Velours J. The subunit f of mitochondrial yeast ATP synthase. Characterization of the protein and disruption of the structural gene ATP17. Eur J Biochem. 1997;247(3):1111–1117. | ||
Weiss A, Delproposto J, Giroux CN. High-throughput phenotypic profiling of gene-environment interactions by quantitative growth curve analysis in Saccharomyces cerevisiae. Anal Biochem. 2004;327(1):23–34. | ||
Gu YP, Cui R, Zhang ZL, Xie ZX, Pang DW. Ultrasmall near-infrared Ag2Se quantum dots with tunable fluorescence for in vivo imaging. J Am Chem Soc. 2012;134(1):79–82. | ||
Kiriyama K, Hara KY, Kondo A. Oxidized glutathione fermentation using Saccharomyces cerevisiae engineered for glutathione metabolism. Appl Microbiol Biotechnol. 2013;97(16):7399–7404. | ||
Adamis PD, Mannarino SC, Eleutherio EC. Glutathione and gamma-glutamyl transferases are involved in the formation of cadmium-glutathione complex. FEBS Lett. 2009;583(9):1489–1492. | ||
Kieliszek M, Blazejak S, Gientka I, Bzducha-Wrobel A. Accumulation and metabolism of selenium by yeast cells. Appl Microbiol Biotechnol. 2015;99(13):5373–5382. | ||
McDermott JR, Rosen BP, Liu ZJ. Jen1p: a high affinity selenite transporter in yeast. Mol Biol Cell. 2010;21(22):3934–3941. | ||
Gomes DS, Fragoso LC, Riger CJ, Panek AD, Eleutherio ECA. Regulation of cadmium uptake by Saccharomyces cerevisiae. BBA Gen Subjects. 2002;1573(1):21–25. | ||
Guo XQ, He M, Nan K, Yan H, Chen BB, Hu B. A dual extraction technique combined with HPLC-ICP-MS for speciation of seleno-amino acids in rice and yeast samples. J Anal At Spectrom. 2015;31(2):406–414. | ||
Judah JD. The action of 2:4-dinitrophenol on oxidative phosphorylation. Biochem J. 1951;49(3):271–285. | ||
Stannard JN, Horecker BL. The in vitro inhibition of cytochrome oxidase by azide and cyanide. Fed Proc. 1947;6(172):599–608. | ||
Liu LM, Li Y, Du GC, Chen J. Increasing glycolytic flux in Torulopsis glabrata by redirecting ATP production from oxidative phosphorylation to substrate-level phosphorylation. J Appl Microbiol. 2006;100(5):1043–1053. | ||
Zhou J, Liu L, Chen J. Improved ATP supply enhances acid tolerance of Candida glabrata during pyruvic acid production. J Appl Microbiol. 2011;110(1):44–53. | ||
Sakai Y RT, Yonehara T, Kato N, Tani Y. High–level ATP production by a genetically–engineered Candida Yeast. Nat Biotechnol. 1994;12(3):291–293. | ||
Longtine MS, McKenzie AI, Demarini DJ, et al. Additional modules for versatile and economical PCR-based gene deletion and modification in Saccharomyces cerevisiae. Yeast. 1998;14(10):953–961. | ||
Chen H, Wang Z, Wang Z, Dou J, Zhou C. Improving methionine and ATP availability by MET6 and SAM2 co-expression combined with sodium citrate feeding enhanced SAM accumulation in Saccharomyces cerevisiae. World J Microbiol Biotechnol. 2016;32(4):1–10. | ||
Kok Sd, Kozak BU, Pronk JT, van Maris AJ. Energy coupling in Saccharomyces cerevisiae: selected opportunities for metabolic engineering. FEMS Yeast Res. 2012;12(4):387–397. |
Supplementary materials
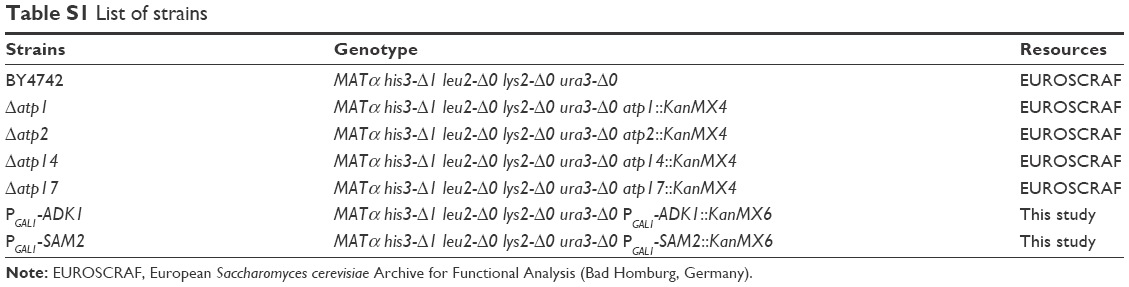 | Table S1 List of strains |
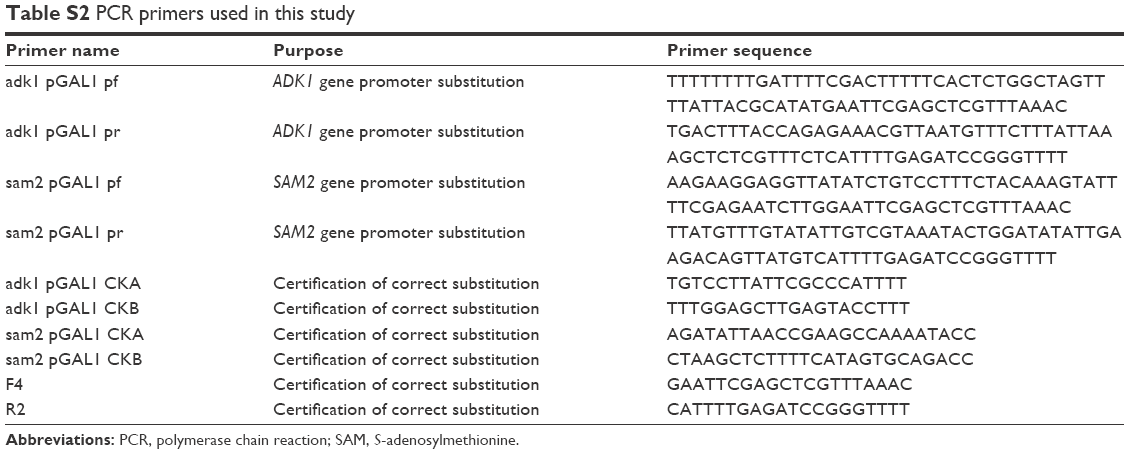 | Table S2 PCR primers used in this study |
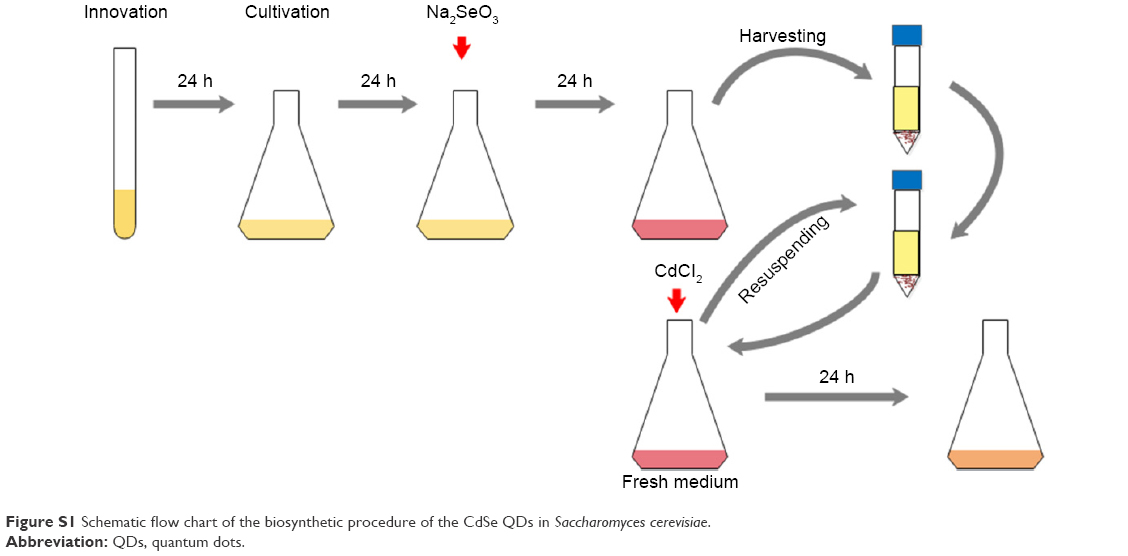 | Figure S1 Schematic flow chart of the biosynthetic procedure of the CdSe QDs in Saccharomyces cerevisiae. |
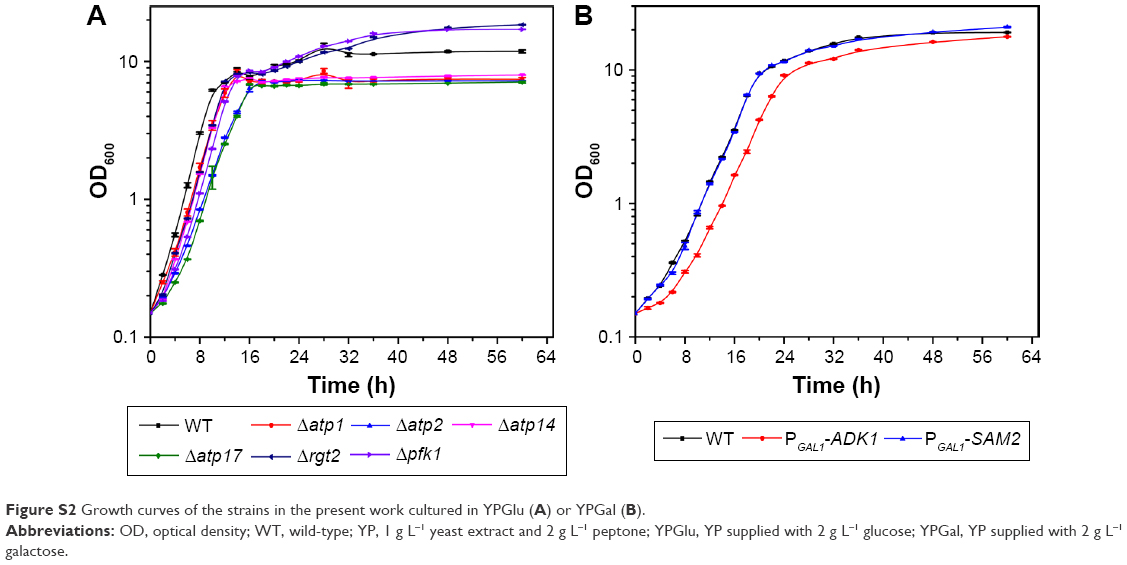 | Figure S2 Growth curves of the strains in the present work cultured in YPGlu (A) or YPGal (B). |
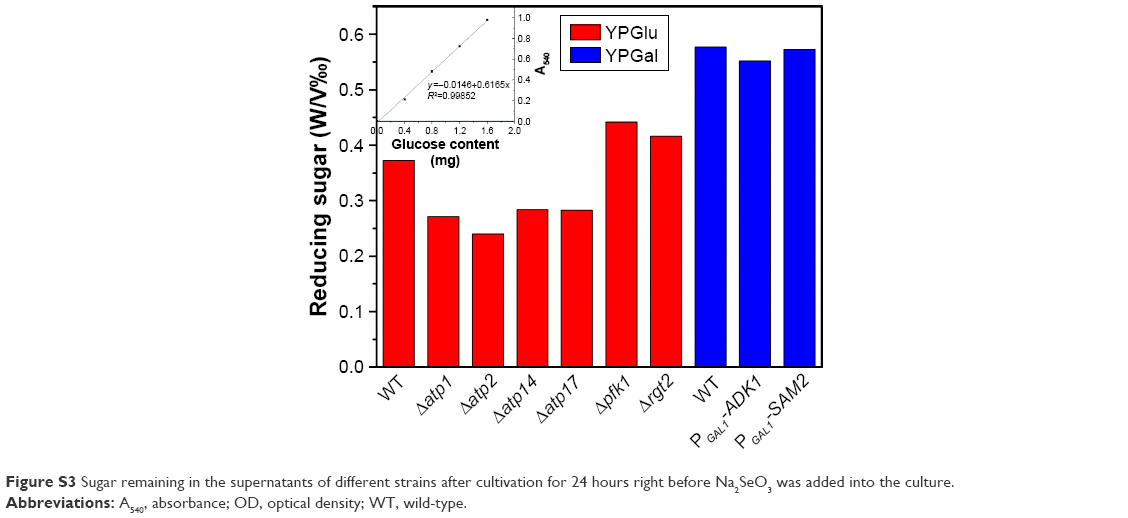 | Figure S3 Sugar remaining in the supernatants of different strains after cultivation for 24 hours right before Na2SeO3 was added into the culture. |
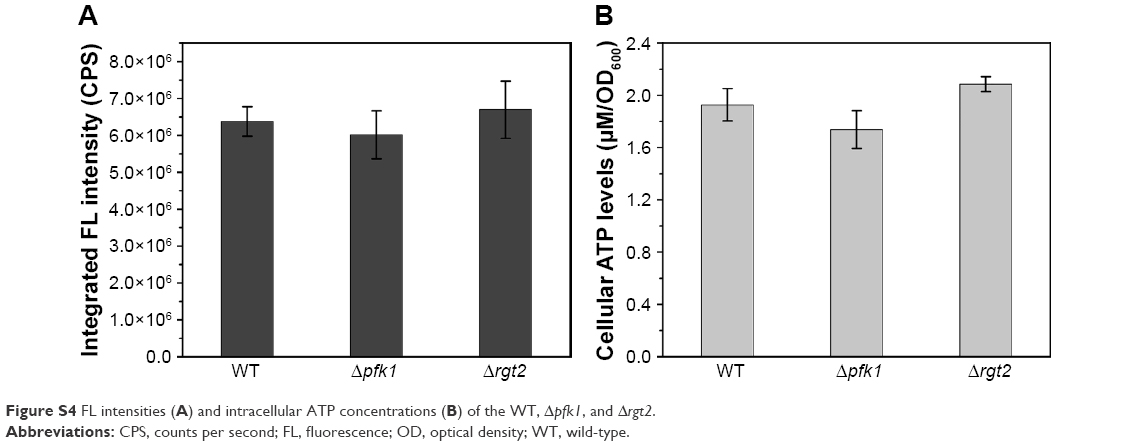 | Figure S4 FL intensities (A) and intracellular ATP concentrations (B) of the WT, Δpfk1, and Δrgt2. |
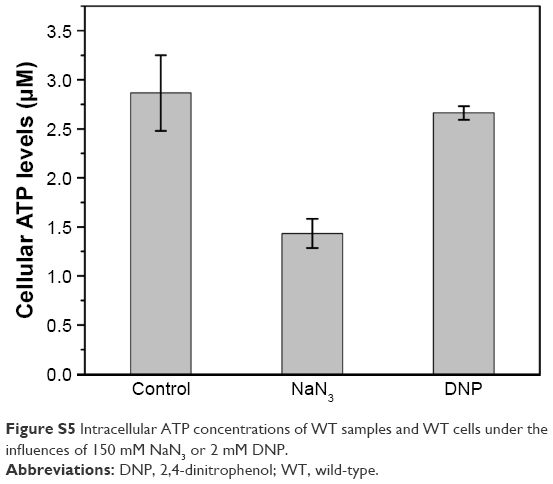 | Figure S5 Intracellular ATP concentrations of WT samples and WT cells under the influences of 150 mM NaN3 or 2 mM DNP. |
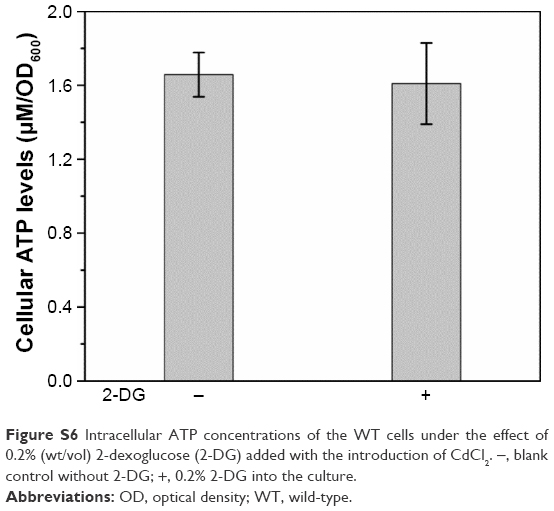 | Figure S6 Intracellular ATP concentrations of the WT cells under the effect of 0.2% (wt/vol) 2-dexoglucose (2-DG) added with the introduction of CdCl2. −, blank control without 2-DG; +, 0.2% 2-DG into the culture. |
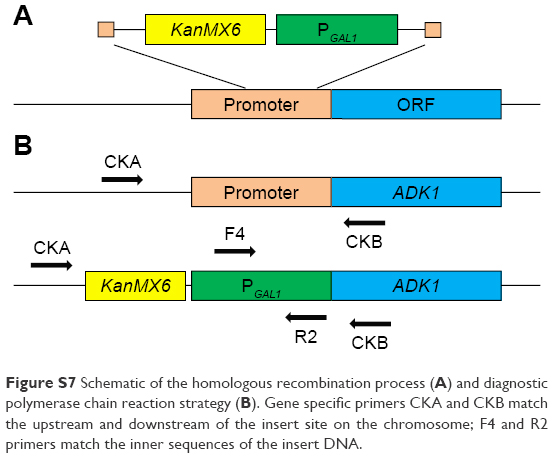 | Figure S7 Schematic of the homologous recombination process (A) and diagnostic polymerase chain reaction strategy (B). Gene specific primers CKA and CKB match the upstream and downstream of the insert site on the chromosome; F4 and R2 primers match the inner sequences of the insert DNA. |
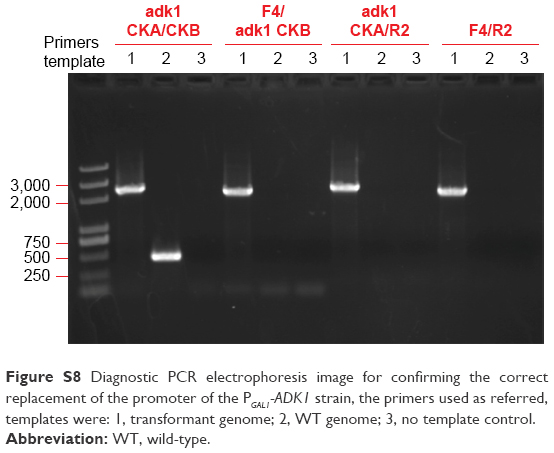 | Figure S8 Diagnostic PCR electrophoresis image for confirming the correct replacement of the promoter of the PGAL1-ADK1 strain, the primers used as referred, templates were: 1, transformant genome; 2, WT genome; 3, no template control. |
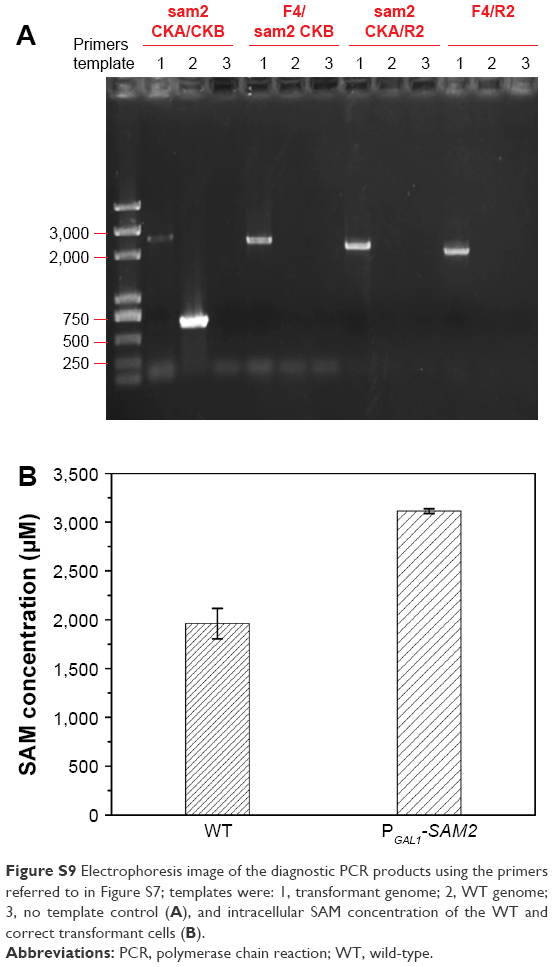 | Figure S9 Electrophoresis image of the diagnostic PCR products using the primers referred to in Figure S7; templates were: 1, transformant genome; 2, WT genome; 3, no template control (A), and intracellular SAM concentration of the WT and correct transformant cells (B). |
 | Figure S10 FL intensity of the same WT samples determined three times with a 24 hour interval. |
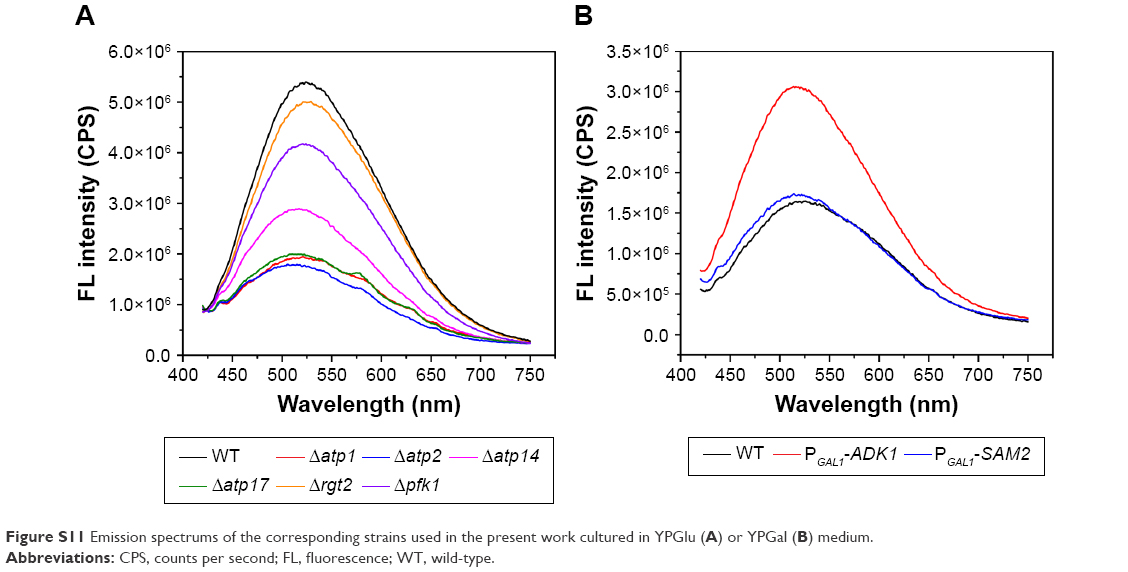 | Figure S11 Emission spectrums of the corresponding strains used in the present work cultured in YPGlu (A) or YPGal (B) medium. |
 © 2017 The Author(s). This work is published and licensed by Dove Medical Press Limited. The full terms of this license are available at https://www.dovepress.com/terms.php and incorporate the Creative Commons Attribution - Non Commercial (unported, v3.0) License.
By accessing the work you hereby accept the Terms. Non-commercial uses of the work are permitted without any further permission from Dove Medical Press Limited, provided the work is properly attributed. For permission for commercial use of this work, please see paragraphs 4.2 and 5 of our Terms.
© 2017 The Author(s). This work is published and licensed by Dove Medical Press Limited. The full terms of this license are available at https://www.dovepress.com/terms.php and incorporate the Creative Commons Attribution - Non Commercial (unported, v3.0) License.
By accessing the work you hereby accept the Terms. Non-commercial uses of the work are permitted without any further permission from Dove Medical Press Limited, provided the work is properly attributed. For permission for commercial use of this work, please see paragraphs 4.2 and 5 of our Terms.