")
Back to Journals » Journal of Inflammation Research » Volume 14
Atherosclerosis Pathways are Activated in Pericoronary Adipose Tissue of Patients with Coronary Artery Disease
Authors Konwerski M, Gromadka A, Arendarczyk A, Koblowska M, Iwanicka-Nowicka R, Wilimski R , Czub P, Filipiak KJ, Hendzel P, Zielenkiewicz P , Opolski G , Gąsecka A , Mazurek T
Received 28 June 2021
Accepted for publication 9 September 2021
Published 20 October 2021 Volume 2021:14 Pages 5419—5431
DOI https://doi.org/10.2147/JIR.S326769
Checked for plagiarism Yes
Review by Single anonymous peer review
Peer reviewer comments 3
Editor who approved publication: Professor Ning Quan
Michał Konwerski,1 Agnieszka Gromadka,2 Adam Arendarczyk,3 Marta Koblowska,2 Roksana Iwanicka-Nowicka,2 Radosław Wilimski,3 Paweł Czub,3 Krzysztof Jerzy Filipiak,1 Piotr Hendzel,3 Piotr Zielenkiewicz,2 Grzegorz Opolski,1 Aleksandra Gąsecka,1 Tomasz Mazurek1
1 1st Chair and Department of Cardiology, Medical University of Warsaw, Warsaw, Poland; 2Institute of Biochemistry and Biophysics, Polish Academy of Sciences, Warsaw, Poland; 3Department of Cardiac Surgery, Medical University of Warsaw, Warsaw, Poland
Correspondence: Tomasz Mazurek
1st Chair and Department of Cardiology, Medical University of Warsaw, Banacha Street 1a, Warsaw, 02-097, Poland
Tel +48 22 599 19 58
Fax +48 22 599 19 57
Email [email protected]
Purpose: Perivascular release of inflammatory mediators may accelerate coronary lesion formation and contribute to plaque instability. Accordingly, we compared gene expression in pericoronary adipose tissue (PCAT) in patients with advanced coronary artery disease (CAD) and non-CAD controls.
Patients and Methods: PCAT samples were collected during coronary bypass grafting from CAD patients (n = 21) and controls undergoing valve replacement surgery, with CAD excluded by coronary angiography (n = 19). Gene expression was measured by GeneChip™ Human Transcriptome Array 2.0. Obtained list of 1348 transcripts (2.0%) that passed the filter criteria was further analyzed by Ingenuity Pathway Analysis software, identifying 735 unique differentially expressed genes (DEGs).
Results: Among the CAD patients, 416 (30.9%) transcripts were upregulated, and 932 (69.1%) were downregulated, compared to controls. The top upregulated genes were involved in inflammation and atherosclerosis (chemokines, interleukin-6, selectin E and low-density lipoprotein cholesterol (LDL-C) receptor), whereas the downregulated genes were involved in cardiac ischaemia and remodelling, platelet function and mitochondrial function (miR-3671, miR-4524a, multimerin, biglycan, tissue factor pathway inhibitor (TFPI), glucuronidases, miR-548, collagen type I, III, IV). Among the top upstream regulators, we identified molecules that have proinflammatory and atherosclerotic features (High Mobility Group Box 2 (HMGB2), platelet-derived growth platelet (PDGF) and evolutionarily conserved signaling intermediate in Toll pathways (ESCIT)). The activated pathway related to DEGs consisted of molecules with well-established role in the pathogenesis of atherosclerosis (TFPI, plasminogen activator, plasminogen activator, urokinase receptor (PLAUR), thrombomodulin). Moreover, we showed that 22 of the altered genes form a pro-atherogenic network.
Conclusion: Altered gene expression in PCAT of CAD patients, with genes upregulation and activation of pathway involved in inflammation and atherosclerosis, may be involved in CAD development and progression.
Keywords: adipose tissue, inflammation, gene expression, atherosclerosis
Introduction
Obesity, particularly abdominal obesity, is one of the most important risk factors for atherosclerosis and cardiovascular events.1–3 The volume and thickness of epicardial adipose tissue (EAT) correlate with intra-abdominal fat mass and the severity of obesity4,5 and are independently associated with cardiovascular events.6 Many studies have shown that inflammation plays a key role in the development of atherosclerosis and the destabilization of atherosclerotic coronary plaques, but the exact mechanism of this phenomenon is still unknown.7–9 EAT is an active inflammatory tissue that releases cytokines and chemokines10,11 and plays a role in the pathogenesis of coronary artery disease (CAD). EAT is a part of the visceral fat that lies between the pericardium and the myocardium12 and is not separated from the myocardium and vessels by fascia, allowing paracrine or vasocrine interactions.13 Pericoronary adipose tissue (PCAT), in turn, is a part of EAT that directly neighbors coronary arteries. In patients with CAD who undergo coronary artery bypass grafting (CABG), PCAT releases higher levels of inflammatory markers than subcutaneous adipose tissue (SAT),14 which further correlates with insulin resistance. The presence of inflammatory cells in the adventitia among patients who died due to acute coronary syndrome was confirmed in autopsy studies.15 There is also a correlation between the degree of coronary artery narrowing and the degree of inflammatory infiltration in the adventitia.15 EAT volume (EATV), assessed by computed tomography (CT), is associated with the total coronary plaque burden, and there is a positive correlation between EATV and the amount of necrotic tissue in atherosclerotic plaques, evaluated using intravascular ultrasound imaging (IVUS), indicating a relationship between EATV and the vulnerability of atherosclerotic plaques.16 Qualitative assessment of PCAT using positron emission tomography/computed tomography (PET/CT) was also performed in patients with acute coronary syndrome without persistent ST-segment elevation (NSTE-ACS).17 In these patients, the inflammatory activity of PCAT, as measured by maximum fludeoxyglucose (FDG) uptake, was greater than that adipose tissue in other locations. Moreover, it correlated with the severity of atherosclerosis and the necrotic core volume of coronary plaque, as assessed by virtual histology IVUS. Similarly, in patients with stable CAD, PCAT maximum FDG uptake was greater than in healthy volunteers.18
There are many anatomical, histological, embryological and molecular features that distinguish EAT from the other fat depots.8 There are studies showing that gene expression in adipose tissue depends not only on its location in the human body19 but also on its location within the heart.20 Moreover, gene expression in adipose tissue may differ between a healthy population and patients with CAD. Currently, there are a few studies which evaluated gene expression in EAT.19–24 In one of the latest studies, it was demonstrated that the EAT transcriptome is (i) unique compared to the SAT transcriptome, and (ii) different among patients with and without CAD. Emerging data supports the participation of EAT and/or PCAT in the pathophysiology of CAD.24 Moreover, it has been postulated that EAT or PCAT may be novel therapeutic targets in obesity-related atherosclerosis.25,26 Previously, we showed that EAT/PCAT is a source of inflammatory mediators in high-risk cardiac patients.10 Here, we hypothesized that PCAT has specific gene regulation patterns in patients with CAD, compared to those without CAD, and that the dysregulated genes form specific networks. The aim of this study was to compare gene expression in PCAT samples collected during open heart surgery in patients with and without CAD.
Materials and Methods
Forty PCAT samples were collected during CABG from patients with severe, symptomatic CAD. (study group, n = 21 samples) and heart valve replacement after excluding CAD by coronary angiography (control group, n = 19 samples). Qualification for CABG was performed by the Heart Team consisting of a general cardiologist, interventional cardiologist and thoracic surgeon. All collected samples were coded with a unique number and analyzed by operators blinded to patient data. The study was conducted according to the guidelines of the Declaration of Helsinki, and approved by the Institutional Review Board (IRB) at Medical University of Warsaw (approval number: KB 91/2012) and all participants gave written informed consent.
RNA Isolation
After harvesting, tissue pieces were immediately submerged in RNAlater (Thermo Fisher, US) and stored at −20 °C. Prior to RNA purification, tissue samples were homogenized using the MagNA Lyser instrument and the MagNA Lyser Green Beads tubes, together with 100–400 μL MagNA Pure DNA tissue lysis buffer (Roche Diagnostics, Germany). After transferring the samples to the MagNA Pure Compact System, automated isolation of total RNA was performed using the MagNA Pure Compact RNA isolation kit (Roche Diagnostics, Germany). The yield and purity of the isolated RNA were calculated by measuring the absorbance at 260 nm and 280 nm with a Nanodrop spectrometer. RNA integrity checks were performed using an Agilent BioAnalyzer 2100 (Agilent, US).
Microarray Analysis
Microarray expression analysis was performed using the Affymetrix Gene GeneChip® Instrument System according to the manufacturer’s instructions (Thermo Fisher, US). A total of 10 ng of RNA that passed the initial quality control screen was then processed using the GeneChip™ WT Pico Kit, which was designed specifically to process small amounts of input RNA, according to the standard protocol provided by Affymetrix. Labeled samples were hybridized to the GeneChip™ Human Transcriptome Array 2.0. After hybridization, the arrays were washed and stained using a GeneChip Fluidics Station 450 and the Affymetrix GeneChip hybridization wash and stain kit. Microarrays were scanned on the Affymetrix GeneChip Scanner 3000 7G using Command Console Software.
Data from the microarrays were normalized and analyzed using Transcriptome Analysis Console 4.0. Apart from the tested condition difference (CAD presence), the main sources of variation included inter-subject variability and sample source, while patient sex and the protocol used were less important. However, to overcome variation driven by additional factors, additional normalization and corrections were applied (such as “batch effect” normalization for used protocol), following the TAC user guide.
The analysis of variance was performed by one-way ANOVA (CAD group vs control group), followed by false discovery rate (FDR) correction by the Benjamin–Hochberg procedure. To determine the significance of differentially expressed genes (DEGs), a cut-off for the fold change value ±1.5 and FDR < 0.05 was applied.
Downstream Analysis
The list of detected differentially expressed transcripts was analyzed by Ingenuity Pathway Analysis (IPA, version: 51963813) software to identify significant interactions and pathways.27
To quantify biological activity of pathways and main pathway regulators, the gene expression z-scores were calculated.28 Briefly, a z-score is defined as the difference between the error-weighted mean of the expression values of the genes in each pathway and the error-weighted mean of all genes in a sample after normalization. Positive and negative z-scores indicate activation or inhibition of pathways and regulators, respectively, based on the relationships with DEGs. All analyses were performed by limiting the IPA database information only to molecules and relationships where the information was experimentally observed among humans. The list of DEGs was also used to establish custom IPA networks to further reveal the connections between discovered genes (Figure 1). All analysis and corresponding plots were executed following software guide.
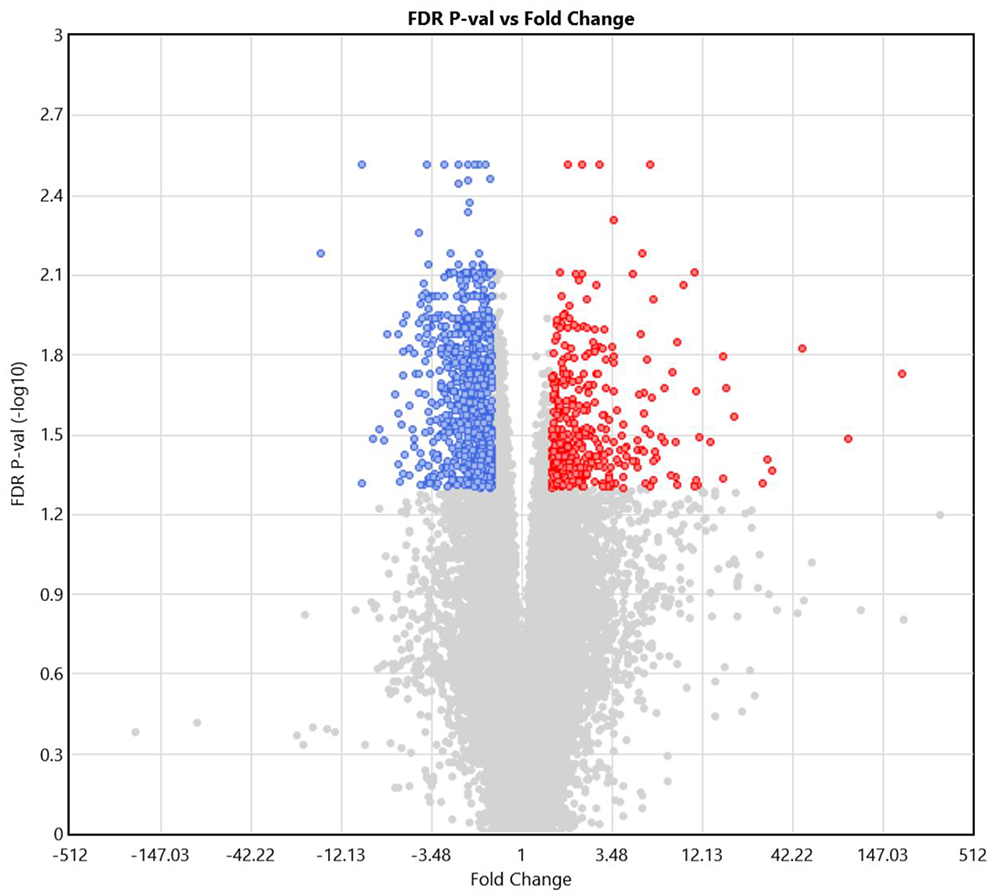 |
Figure 1 Differentially expressed genes (DEGs) in coronary artery disease (CAD) patients, compared to controls, generated using Transcriptome Analysis Console 4.1. Colored dots represents up- and down-regulated transcripts (red and blue, respectively). Grey dots represents transcripts not classified as DEGs due to either high FDR p-value (y-axis) or low fold change (FC; x-axis). The significance threshold was determined at FC > 1.5 and FDR p-value < 0.05. |
Results
Table 1 shows the baseline clinical characteristics of the study participants, which were comparable in both groups. Among 67,528 transcripts, 1348 (2%) were identified as DEGs, with 416 (30.9%) and 932 (69.1%) transcripts that were up- and downregulated, respectively, in patients versus controls. Figure 2 shows DEGs in CAD patients, compared to controls, generated using Transcriptome Analysis Console 4.1. Although the majority of DEGs were downregulated, the upregulated DEGs showed the highest difference in expression. Table 2 shows the list of top 20 upregulated genes in PCAT of patients with CAD, compared to controls. The top upregulated genes included those involved in inflammation and atherosclerosis: chemokines (CXCL8, CXCL2), interleukin (IL)-6, E-selectin, low-density lipoproteins receptor (LDL-R). The genes which were upregulated more than 20-fold in patients compared to controls were coding CXCL8 (+193 fold change, FC), selectin E (+91 FC), IL-6 (+49 FC) and ADAM metallopeptidase with thrombospondin type 1 motif 4 (ADAMTS4; +28 FC).
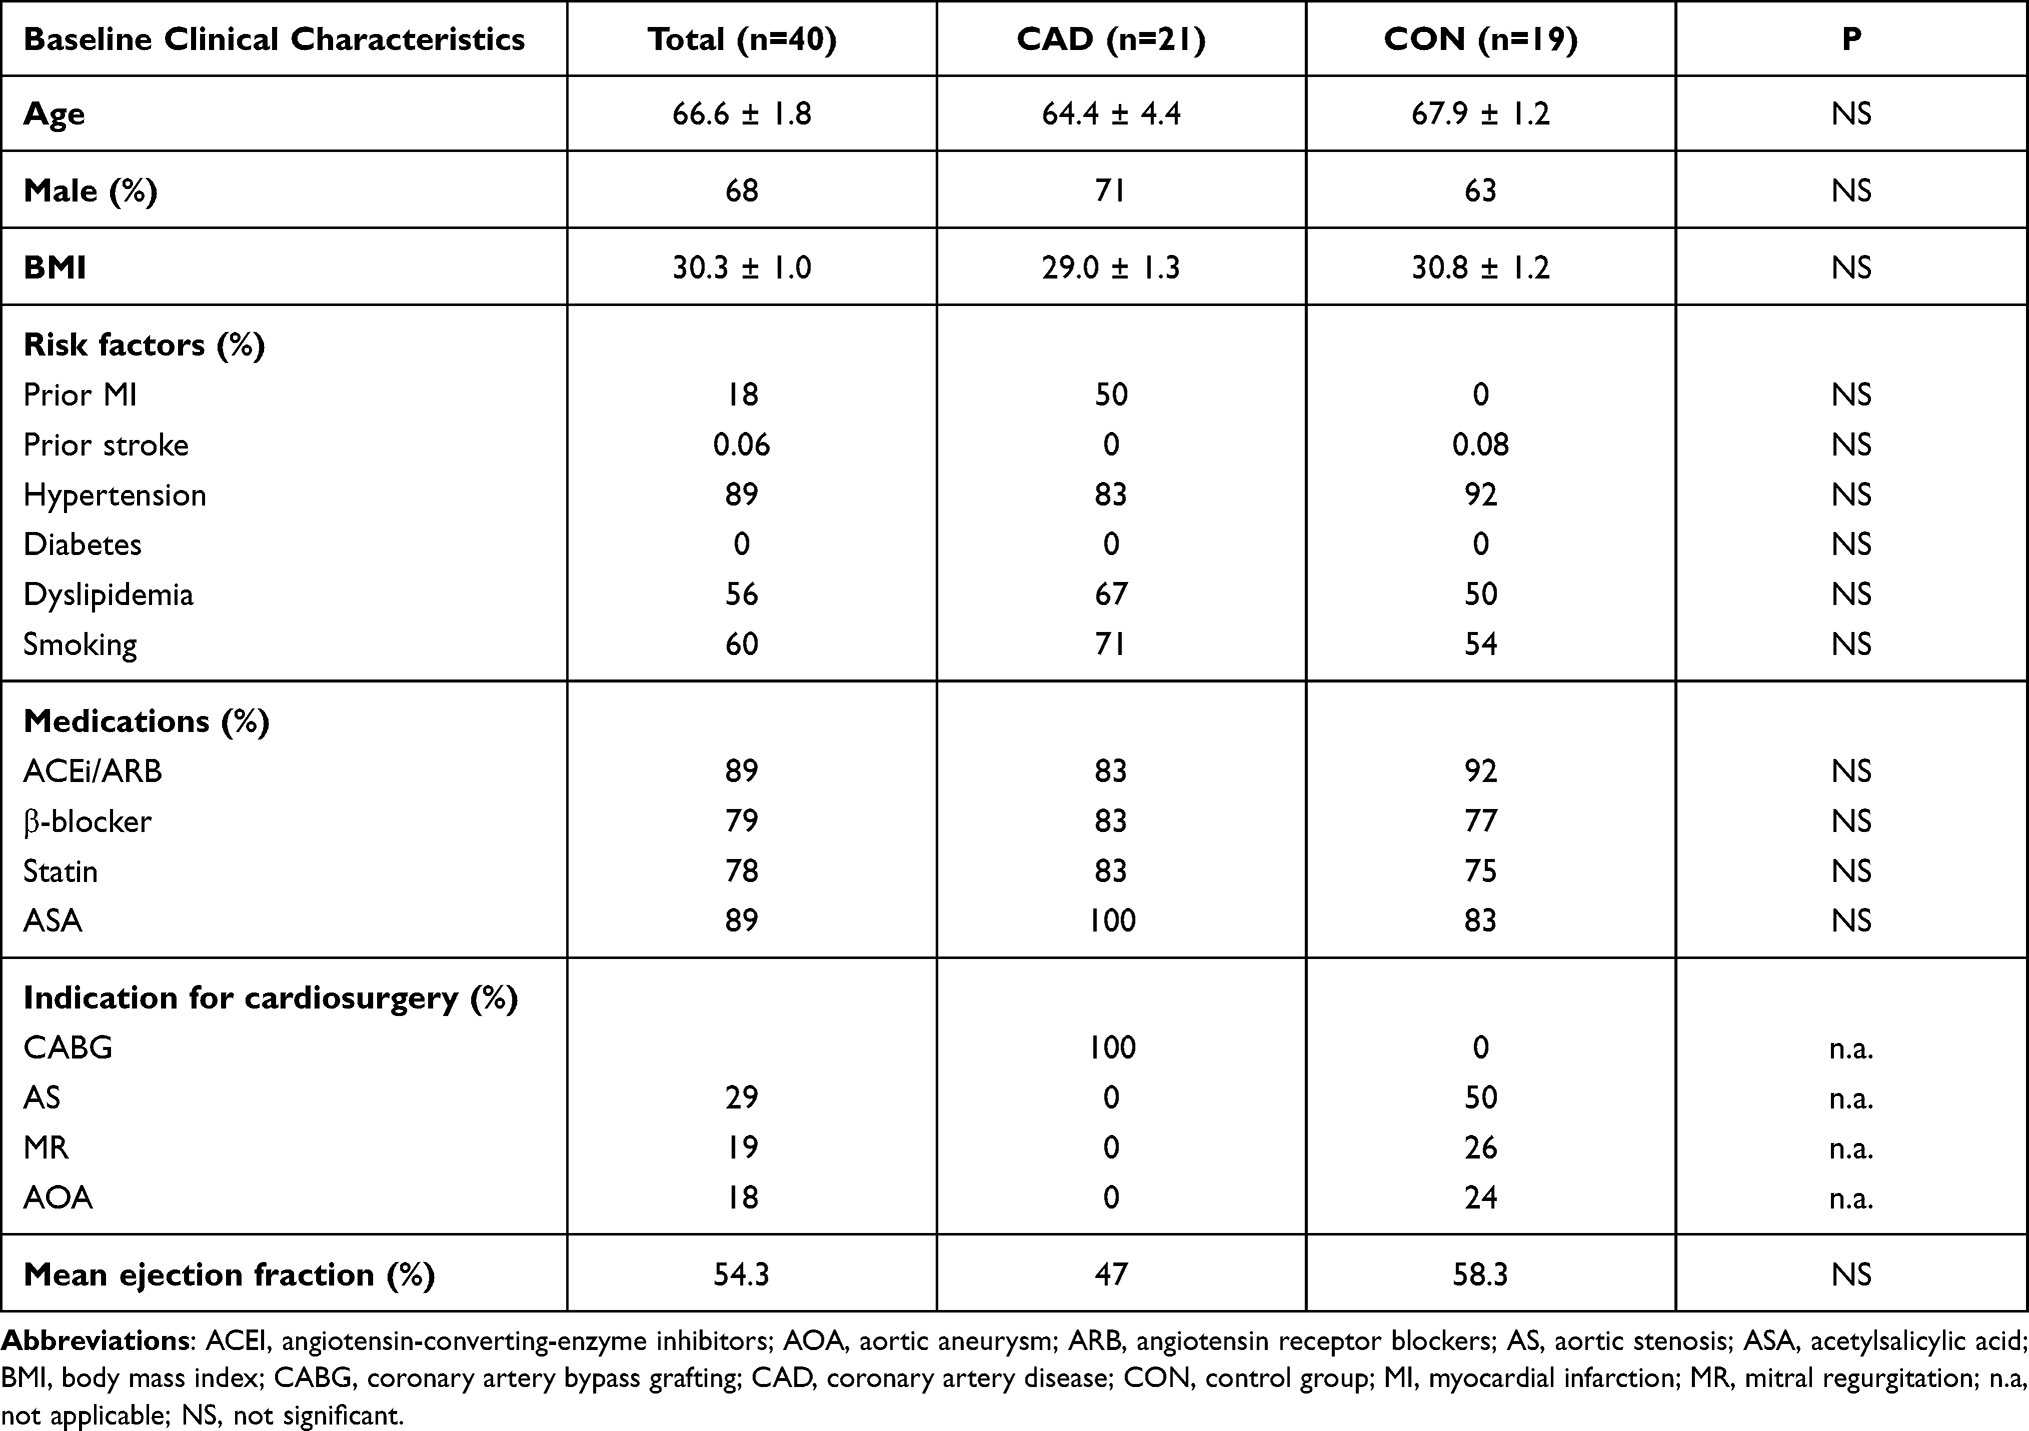 |
Table 1 Baseline Clinical Characteristics |
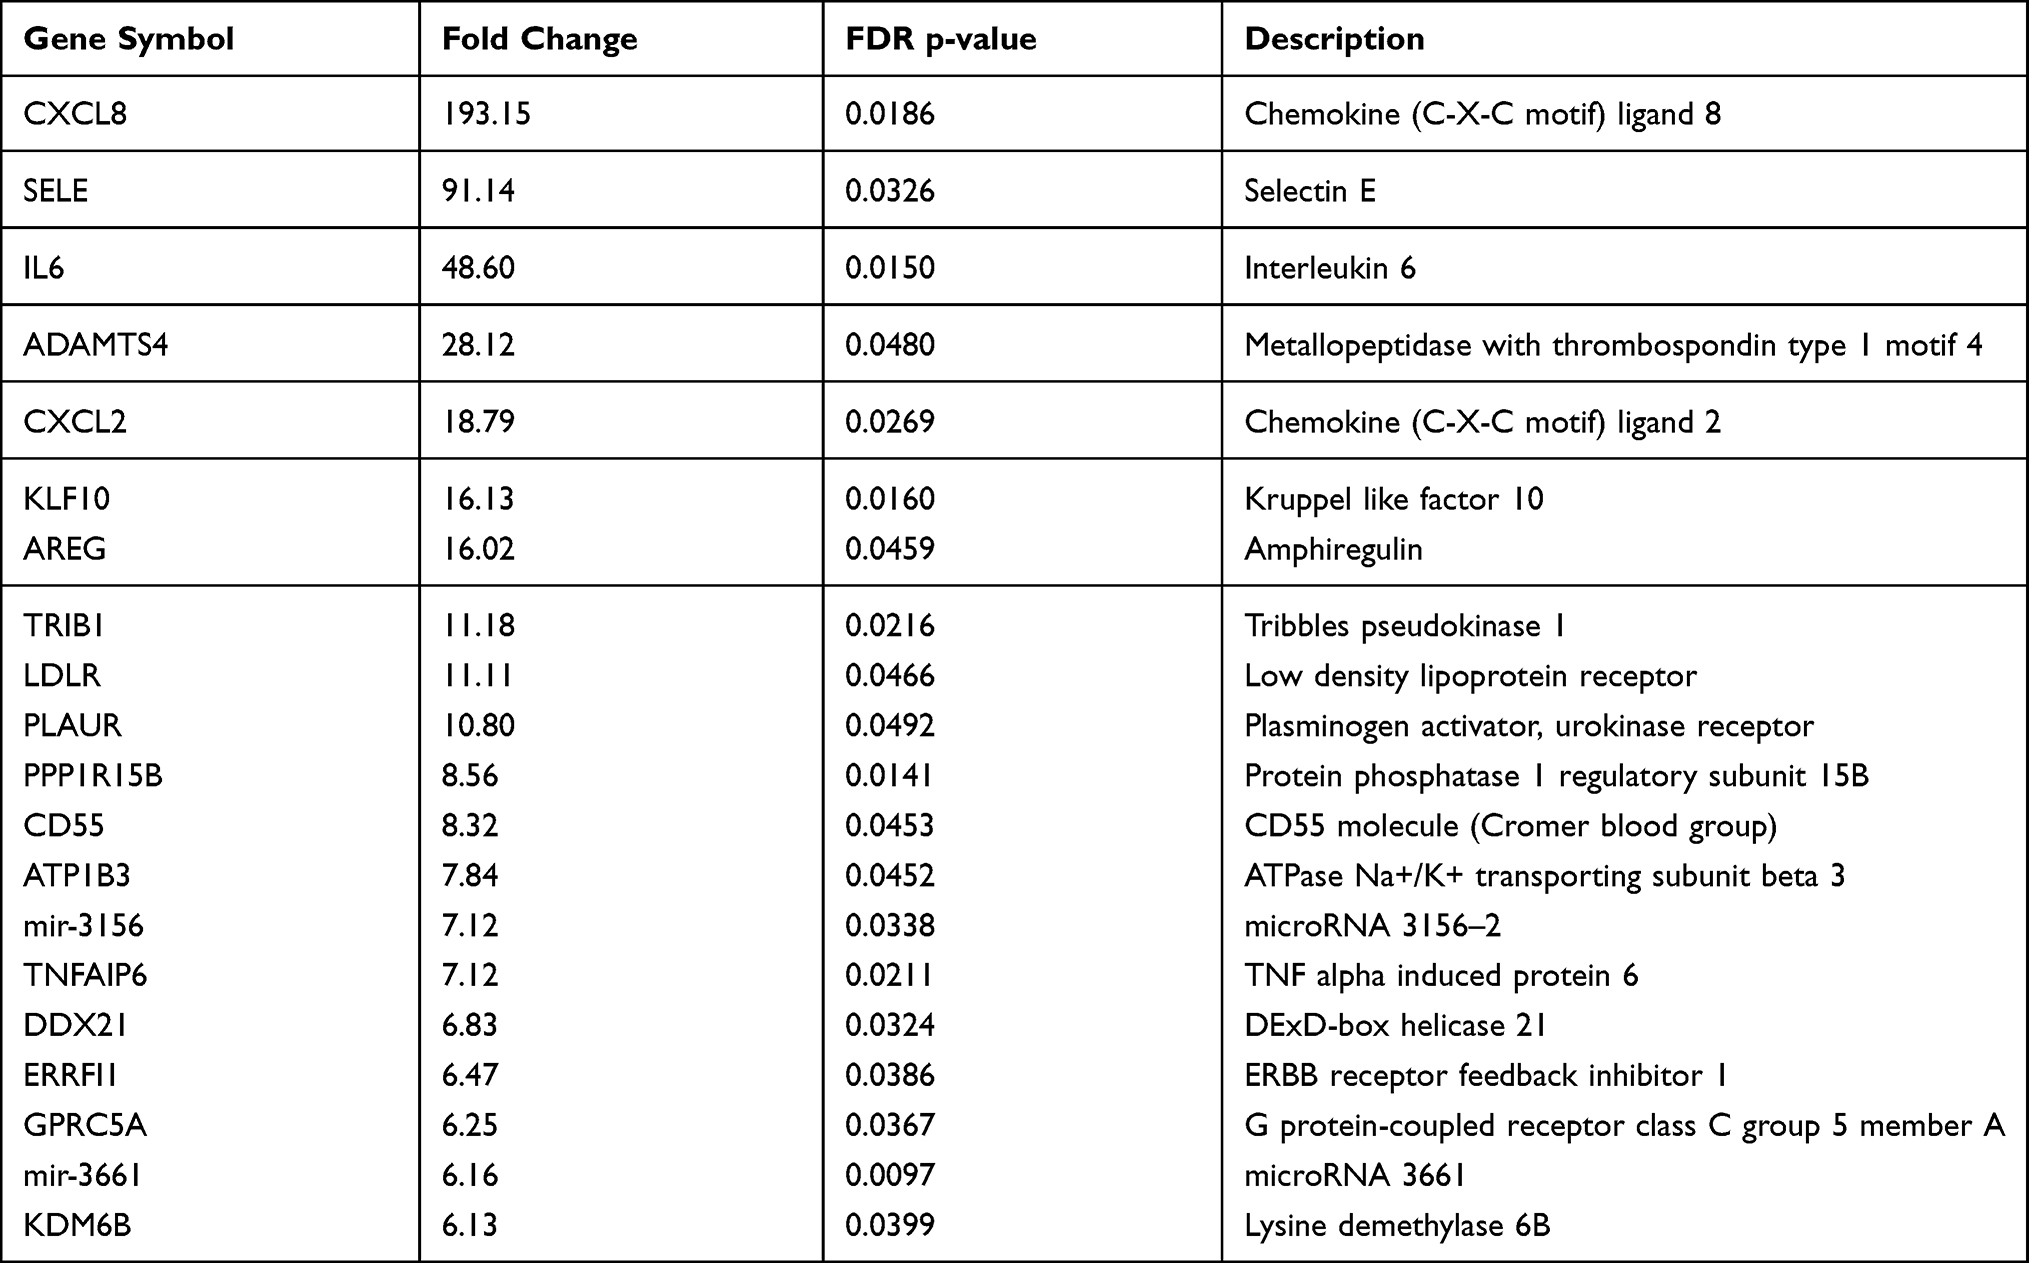 |
Table 2 Top 20 Upregulated Genes in Pericoronary Adipose Tissue of Patients with Coronary Artery Disease, Compared to Controls |
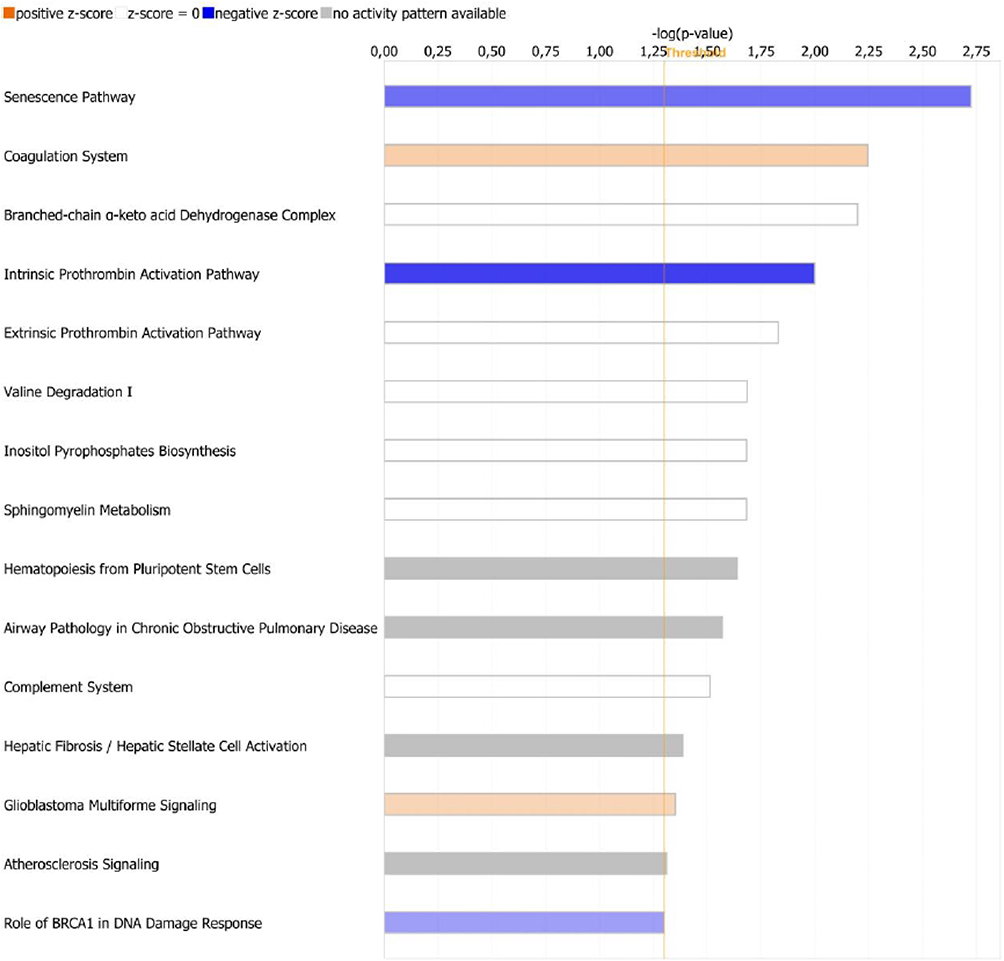 |
Figure 2 Main canonical pathways identified by Ingenuity Pathway Analysis, based on the relationships with differentially expressed genes. The pathways are ordered and listed by the -log (p-value), with threshold (orange line) representing p-value of 0.05. The colors of bar charts represent predicted dictionality described by z-score. Positive z-score indicates activation (orange bars), whereas negative z-score indicates inhibition (blue bars) of the pathway in pericoronary adipose tissue of patients with coronary artery disease, compared to controls. Bars marked as white and grey represent pathways with neutral z-score or pathways with no activity pattern available, respectively. |
Table 3 shows the list of top 20 downregulated genes in PCAT of patients with CAD, compared to controls. Among the top downregulated genes, signaling proteins (ATM serine/threonine kinase), different types of collagen (type IV, I and III), enzymes (histone acetyltransferase KANSL1, glucuronidase) and miRNAs (miR-548, miR-4524, miR-1299 and miR-3671) were found. The most downregulated genes were coding collagen type IV alpha 4 chain (−9 FC), histone acetyltransferase KANSL1 (−7 FC), miR-579 (−7 FC) and miR-4524a (−6 FC).
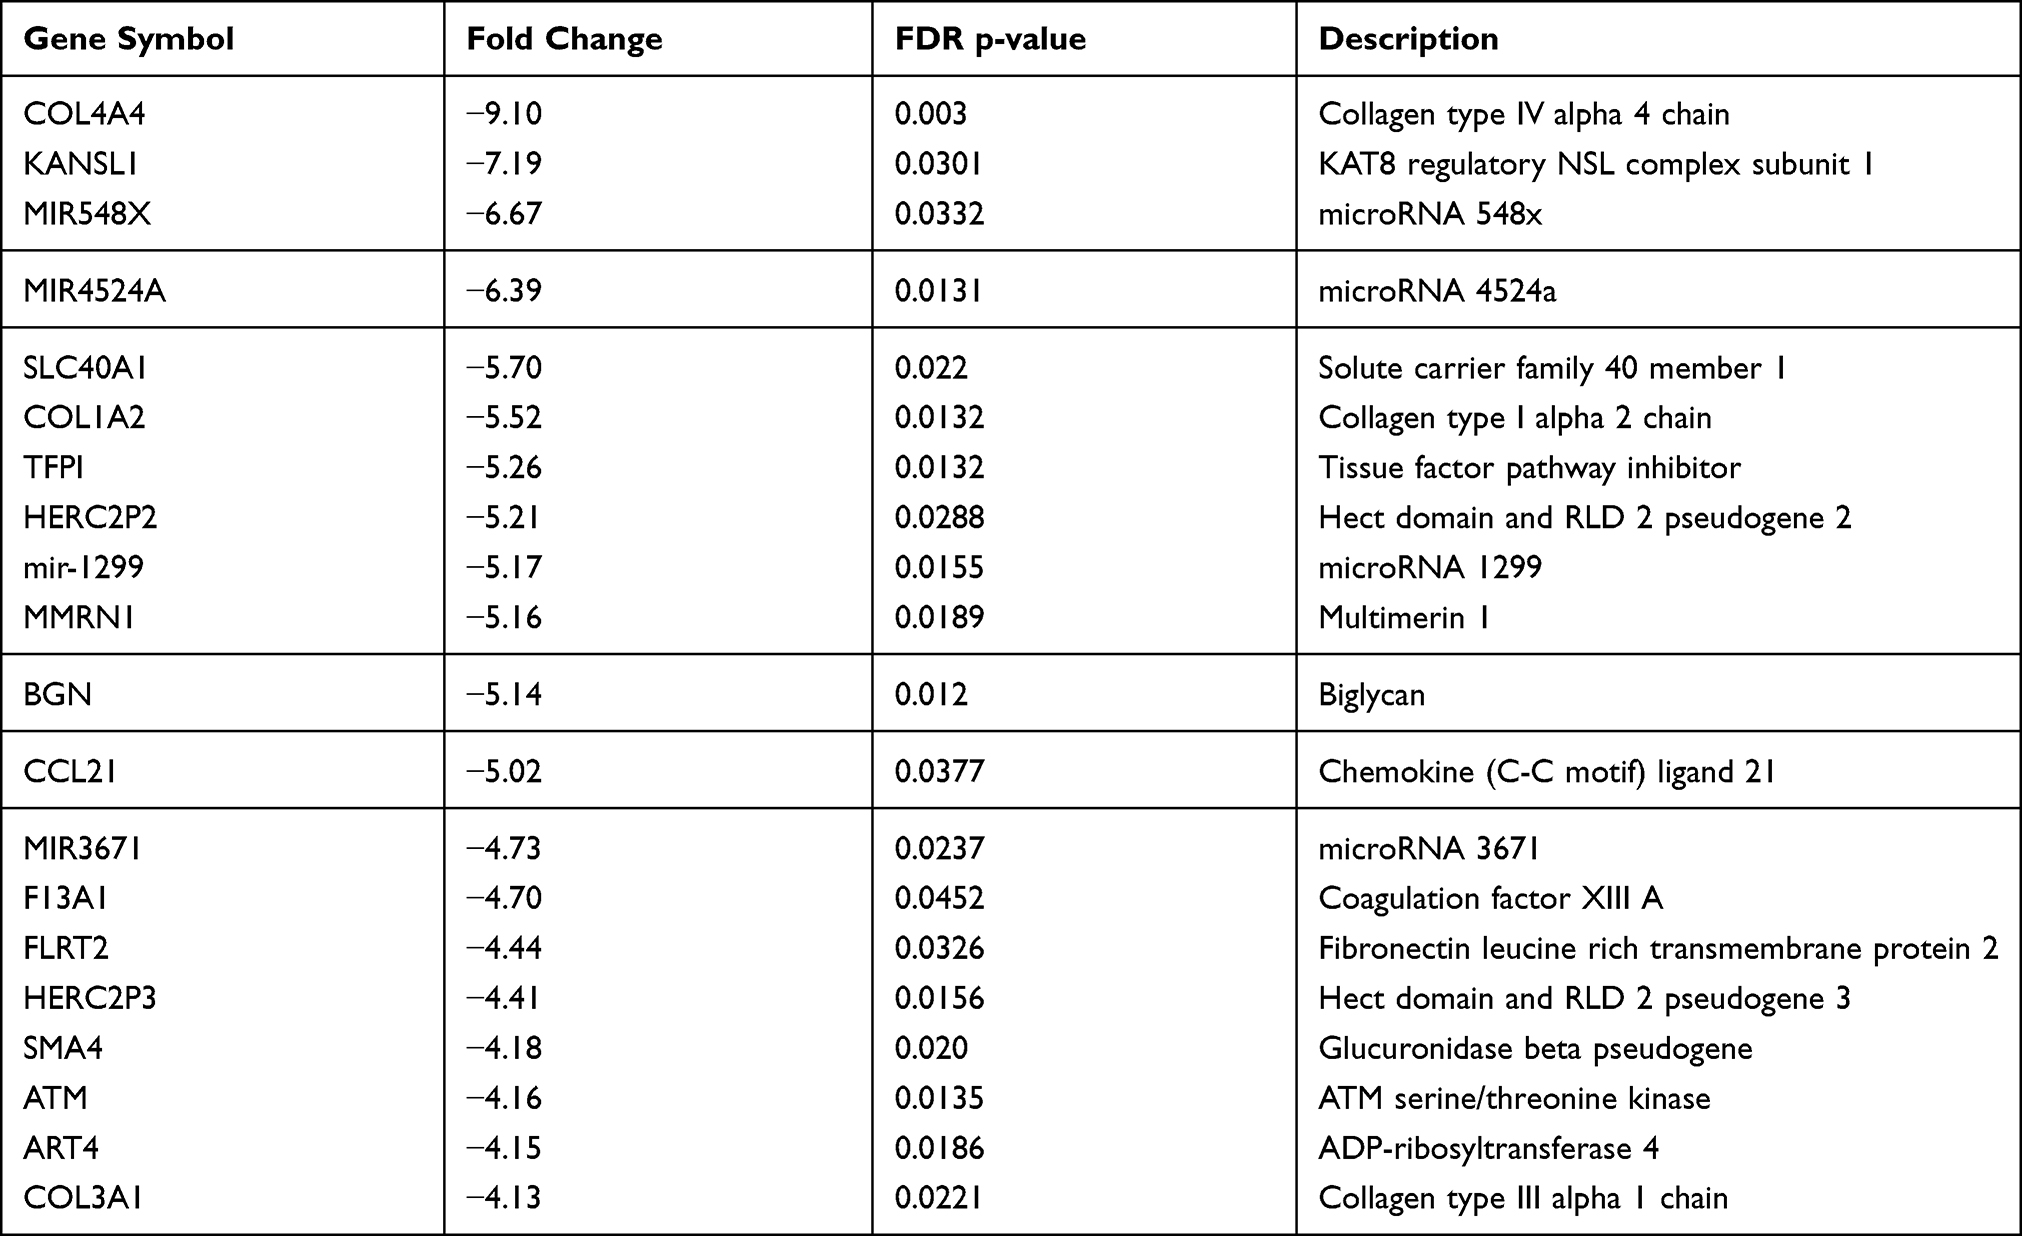 |
Table 3 Top 20 Downregulated Genes in Pericoronary Adipose Tissue of Patients with Coronary Artery Disease Compared to Controls |
Table 4 shows the list of top upstream regulators identified by IPA, based on the relationships with DEGs in PCAT of patients with CAD, compared to controls. The top upstream regulators were high mobility group box 2 (HMGB2), platelet-derived growth factor BB (PDGF BB), evolutionarily conserved signaling intermediate in Toll pathway, mitochondrial (ECSIT), cluster of differentiation (CD) 24 and cyclin-dependent kinase 9 (CDK9).
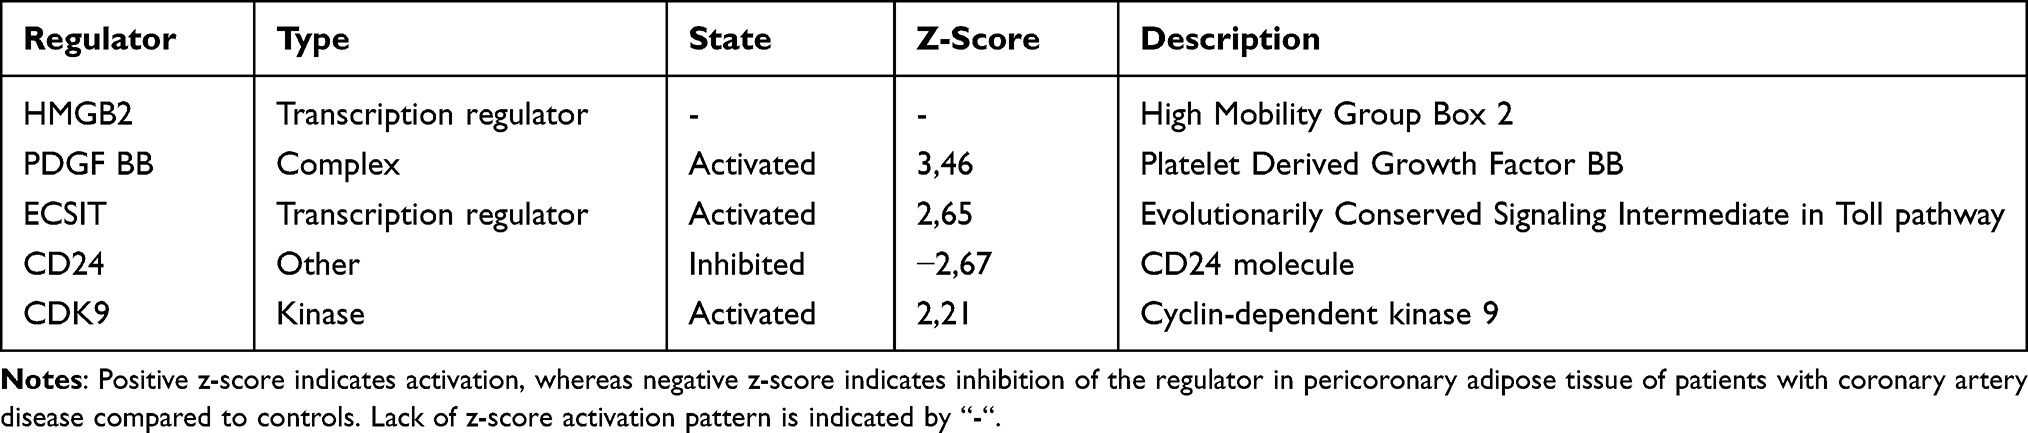 |
Table 4 Top Upstream Regulators Identified by Ingenuity Pathway Analysis, Based on the Relationships with Differentially Expressed Genes |
Figure 3 shows the main canonical pathways found by IPA, based on the relationships with DEGs. Among top canonical pathways, coagulation system pathway consisting of genes involved in atherosclerosis (tissue factor pathway inhibitor (TFPI), plasminogen activator, urokinase receptor (PLAUR) and thrombomodulin) was activated (z-score +0.45), whereas the senescence pathway and intrinsic prothrombin activation pathway (collagen type I and III, coagulation factor XIII, different types of anaphase-promoting complex subunits, calpain 7) were inhibited (z-score −1.5 and −2.0, respectively).
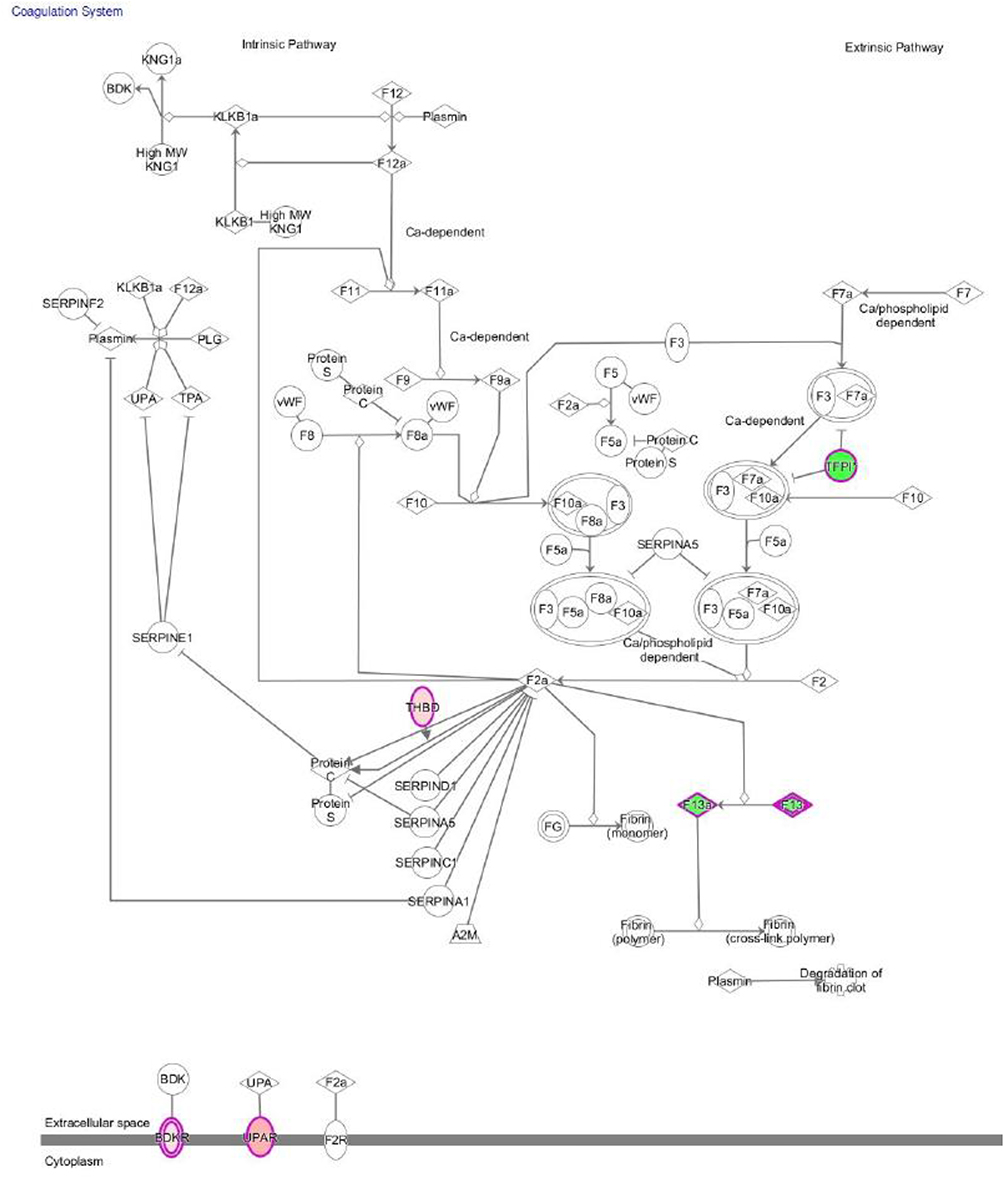 |
Figure 3 The coagulation pathway discovered by Ingenuity Pathway Analysis. The upregulated and downregulated genes are marked red and green, respectively. |
Among the most significant networks automatically identified by IPA, many were associated with the pathogenesis of atherosclerosis. Figure 4 presents an example of such pathway, termed “coagulation system” by IPA (significance score 22).
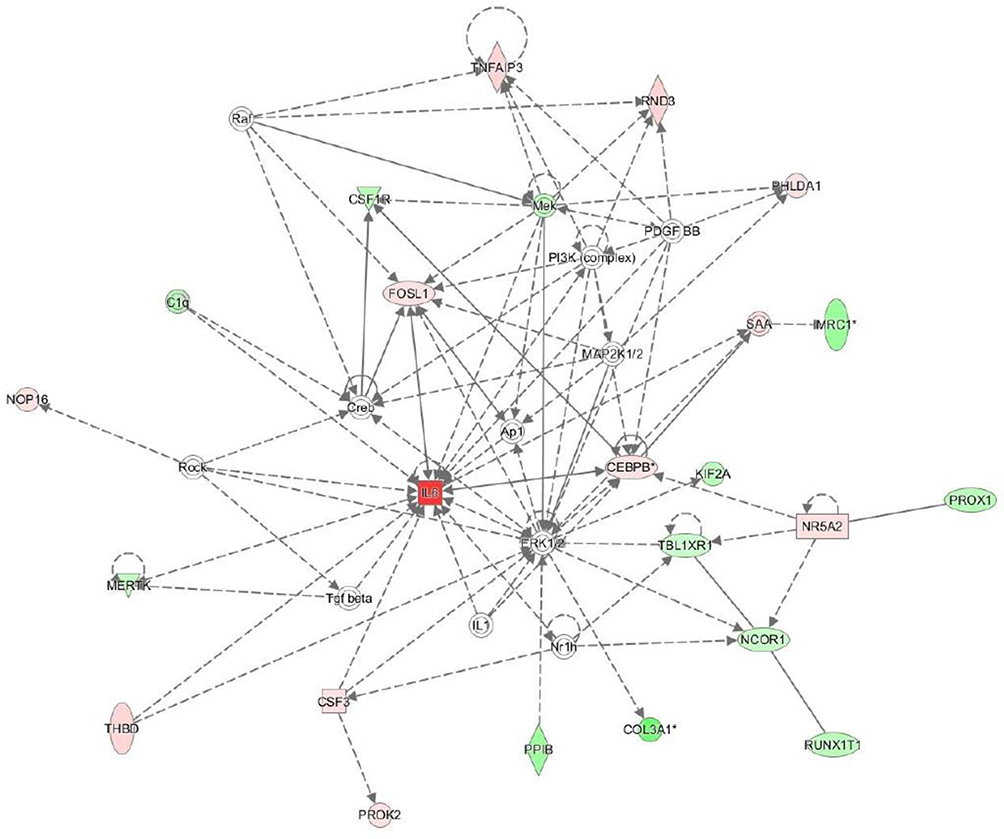 |
Figure 4 Interactions between differentially expressed genes found by Ingenuity Pathway Analysis, forming the network involved in atherosclerosis progression. The upregulated and downregulated genes are marked red and green, respectively. Grey arrows indicate the direction of regulation. |
Discussion
In this study, we compared gene expression in PCAT of patients with advanced CAD and non-CAD controls. We found that (i) the top upregulated genes in CAD are involved in inflammation and atherosclerosis,14–17 (ii) the top downregulated genes are responsible for cardiac ischaemia and remodelling,29,30 platelet function,31,32 mitochondrial function,33 obesity,34 and encode different types of collagen, and (iii) the top upstream regulators related with DEGs include molecules that have proinflammatory and atherosclerotic profile (HMGB2, PDGF and ECSIT). We identified one activated pathway related with DEGs, associated with coagulation system, and two inhibited pathways related with DEGs, associated with senescence and intrinsic prothrombin activation pathway. In addition, this is one of the first studies showing that the upregulated DEGs and activated pathways form a pro-atherosclerotic network (Figure 1) in patients with CAD, which proves the involvement of PCAT in the atherosclerosis progression.
Previously, we showed that genes coding multiple inflammatory mediators are upregulated in EAT/PCAT in patients with advanced CAD, compared to SAT.10 In line with our previous results, here we also showed the upregulation of genes coding IL-6, CXCL2 and thrombomodulin in PCAT of CAD patients. In the present study, the genes which were most upregulated in patients with CAD compared to controls were coding several proinflammatory and proatherogenic molecules, including chemokines, IL-6, selectin E and LDL-C receptor. The contribution of IL-6, selectin E and LDL-C receptor in the pathogenesis of atherosclerosis is well established.35–37 There is no doubt that IL-6 plays one of the key roles in atherosclerosis at various stages of plaque development. IL-6 stimulates the synthesis of acute-phase proteins, activates endothelial cells and hypothalamic–pituitary–adrenal axis, increased coagulation (primarily through inducing monocyte expression of tissue factor), causes lymphocyte proliferation and differentiation and intensifies the influx of inflammatory cells.35 E-selectin belongs to the Selectin family which mainly participate in the rolling adhesion of leukocytes. Activated endothelial cells express different types of molecules including E-selecting which attract lymphocytes and monocytes that bind to the endothelium and infiltrate arterial wall contributing to inflammation process.35 The LDL receptor family consists of multiple transmembrane proteins that play an important role in a wide range of biological process including lipid metabolism, thrombosis and atherogenesis. There is increasing evidence that members of this family are involved not only in lipid metabolism but also as signal transducing receptors and thus may contribute to the progression of atherosclerosis.37 We also showed increased level of expression of metalloproteinase ADAMTS4 compared to the control group. The involvement of this proteinase in the pathogenesis of CAD, especially acute coronary syndromes, has been described in both humans and mice.38–40 Very interesting results were presented by Zha et al who identified the expression level of ADAMTS4 in plasma and monocytes as a marker of plaque instability. In their observation, the ADAMTS4 level increased successively from the control group, through unstable angina, NSTEMI to STEMI.38,39 It was also showed that the release of adipokines by EAT is dysregulated in obesity and CAD, and that EAT-derived adipokines induce pathophysiological changes in human monocytes and coronary artery endothelial cells.42 Several studies showed that the immune cell phenotype in PCAT is important in the pathogenesis of CAD.43,44 Altogether, numerous studies in mouse and human models confirmed that EAT has more proinflammatory profile of gene expression compared to subcutaneous tissue, mediastinal adipose tissue or perirenal fat.10,14,19,41
The top downregulated genes included those responsible for cardiac ischaemia and remodelling (miR-3671, miR-4524a),29,30 platelet function (multimerin, TFPI),31,32 mitochondrial function (glucuronidases),33 obesity (miR-548),34 and encode different types of collagens (type I, III, IV). In line with our finding, other authors also found specific miRNA and gene signatures of EAT in CAD, with down-regulation of genes involved in mitochondrial function, lipid metabolism, nuclear receptor transcriptional activity, and up-regulation of those involved in chemokine signalling and inflammation.20 Other downregulated genes included the gene for multimerin 1 and biglycan, which are known to be involved in platelet function and in the pathogenesis of atherosclerosis, respectively.31,45 Biglycan is one the most important proteoglycans in the extracellular matrix of the vascular intima. There are many studies that directly link traditional cardiovascular risk factors such as hypertension, smoking or diabetes with increased expression of biglycan.45 TFPI also has an established position in CAD pathogenesis,32 and it seems that TFPI effect on the development of atherosclerosis may depend on the genetic polymorphism.46 Tissue factor (TF) by promoting thrombus formation, inflammation, migration and proliferation of vascular smooth muscle cells (VSMC) is directly involved in CAD pathogenesis. TFPI’s role is to inhibit these unfavorable processes. It should be emphasized that TFPI works not only by affecting the coagulation system but also by inhibiting the activity of endothelial cells, inhibiting the proliferation and migration of VSMC, promoting apoptosis of macrophages at plaques or inhibiting the secretion of proinflammatory factors.32 Thus, the decreased expression of TFPI in the group of CAD patients confirms its protective role. MiR-548, which was among the downregulated microRNAs, was recently showed to regulate the expression of HMGB1.47 HMGB1 is a nonhistone chromatin-binding protein that is involved in the regulation of transcription, DNA replication, and repair.48 HMGB1 is secreted by cells either actively, in response to stimulation by proinflammatory cytokines or endotoxins,49,50 or passively from necrotic or damaged cells.51,52 In the extracellular environment, HMGB1 induces the release of proinflammatory cytokines and chemokines and exposure of the adhesion molecules on the endothelium and macrophages, thereby taking part in the pathogenesis of CAD.53 Among the different types of downregulated types of collagen, type III was found, which facilitates platelets aggregation and plays an important role in blood clotting.54
The top upstream regulator related with DEGs were HMGB2, PDGF and ESCIT. HMGB2 is a member of HMGB family and has a similar role in atherosclerosis as HMGB1, which has been discussed before. In the extracellular compartment, HMGB2 acts as a chemokine and may promote proliferation and migration of endothelial cells.55 Overexpression of PDGF may contribute to the development of atherosclerosis.56 PDGF and its receptor are an intensively studied therapeutic target in patients with CAD.57 Especially interesting is activated status of PDGF in our study in patients with CAD. This is in the line with literature which reports that overactivity of PDGF is associated with atherosclerosis.56 Under normal conditions, its expression in arteries is low but increases after the inflammatory fibroproliferative response.56 This is confirmed by the results of animal studies, in which the use of anti-PDGF-B antibodies reduced the incidence of atherosclerosis and restenosis after angioplasty.58,59 ESCIT, activated in our study, is an adapter protein of the Toll-like and IL-1 receptor signaling pathway that is involved in the activation of nuclear factor (NF)-kappa β,60 which in turn is a pivotal mediator of inflammatory response.61 Toll-like receptor 4 (TLR4) can activate the transcription factors nuclear factor-κB leading to the production of proinflammatory cytokines.36 Activation of the NF-κB pathway has a crucial role in inflammation and can be induced by many factors including cytokines, adhesion molecules, chemokines, growth factors, and monocytes bound to the endothelium.36,61 The activation of TLR4/NF-κB pathway promotes the plaque growth and instability.62 These observations further confirm the proinflammatory gene expression profile in EAT in patients with CAD.
We identified one activated pathway related with DEGs, associated with coagulation system, and two inhibited pathways related with DEGs, associated with senescence and intrinsic prothrombin activation pathway. The pathway associated with coagulation system included TFPI, plasminogen activator, urokinase receptor (PLAUR) and thrombomodulin. The role of TFPI in the pathogenesis of CAD has been mentioned before. There are also reports in the literature about the important role of PLAUR in this process.63 For example, the functional genetic variation of the PLAUR gene may affect the susceptibility to myocardial infarction.64 The involvement of thrombomodulin in CAD pathogenesis is confirmed as well.65 Moreover, as with PLAUR, there are reports about potential association of thrombomodulin gene polymorphisms with susceptibility to atherosclerosis.66,67
Finally, to the best of our knowledge, this is one of the first studies which showed not only the altered expression of individual genes in PCAT of CAD patients but also the entire pro-atherogenic pathways and networks formed by these genes, providing a much stronger proof that PCAT is a metabolically active source of proinflammatory molecules, involved in atherosclerosis progression.
Limitations
The main limitation of the study is the lack of data validation using polymerase chain reaction, which was not feasible due to the insufficient quantity of the collected biological samples. Since the samples were collected during open-heart surgery, validation would require setting up a new study, which we are planning to do in the near future. Moreover, since our study group included patients with severe, symptomatic CAD qualified for CABG, the results cannot be extrapolated to patients with less severe CAD. Third, based on our relatively small, observatory study, it is difficult to identify one specific pathway associated with the development and progression of CAD. Although we were able to show that the DEGs and upstream regulators contribute to the entire pathways and networks, our data still should be seen as a snapshot in time based on the most recent knowledge, but will most likely be expanded by further updated of the bioinformatic database used in our study. Finally, differences in gene expression between CAD and control group does not prove the causality between DEGs and CAD, neither the mechanisms how DEGs directly contribute to CAD development and progression.
Conclusion
PCAT of CAD patients has specific gene expression pattern, with upregulation of genes involved in inflammation and atherosclerosis (chemokines, IL-6, selectin E and LDL-C receptor), and downregulation of genes involved in cardiac ischaemia and remodelling, platelet function and mitochondrial function (miR-3671, miR-4524a, multimerin, biglycan, TFPI, glucuronidases, miR-548, collagen type I, III, IV). Among the top upstream regulators, we identified molecules that have proinflammatory and atherosclerotic features (HMGB2, PDGF and ESCIT). The activated pathway related to DEGs consisted of molecules with well-established role in the pathogenesis of atherosclerosis (TFPI, plasminogen activator, PLAUR, thrombomodulin). Most importantly, we showed the presence of entire pathways and networks composed of these genes. Altogether, the proinflammatory gene expression profile in EAT in patients with CAD seems involved in CAD development and progression.
Acknowledgments
A. Gasecka and K. Filipiak acknowledge the International and Intercontinental Cardiovascular and Cardiometabolic Research Team (I-COMET).
Disclosure
The authors report no conflicts of interest in this work. This study was supported by the financial resources for maintaining research equipment and position grant (79/E-35/SPUB/SP/2019) of the Polish Ministry of Science and Higher Education.
References
1. Dwivedi AK, Dubey P, Cistola DP, et al. Association between obesity and cardiovascular outcomes: updated evidence from meta-analysis studies. Curr Cardiol Rep. 2020;22(4):25. doi:10.1007/s11886-020-1273-y
2. Mathieu P, Lemieux I, Despres JP. Obesity, inflammation, and cardiovascular risk. Clin Pharmacol Ther. 2010;87:407–416. doi:10.1038/clpt.2009.311
3. Lemieux I, Després JP. Metabolic syndrome: past, present and future. Nutrients. 2020;12(11):3501. doi:10.3390/nu12113501
4. Rabkin SW. Epicardial fat: properties, function and relationship to obesity. Obes Rev. 2007;8:253–261. doi:10.1111/j.1467-789X.2006.00293.x
5. Iacobellis G, Willens HJ, Barbaro G, et al. Threshold values of high-risk echocardiographic epicardial fat thickness. Obesity. 2008;16:887–892. doi:10.1038/oby.2008.6
6. Mahabadi A, Berg MH, Lehmann N, et al. Association of epicardial fat with cardiovascular risk factors and incident myocardial infarction in the general population. J Am Coll Cardiol. 2013;61:1388–1395. doi:10.1016/j.jacc.2012.11.062
7. Wolf D, Ley K. Immunity and Inflammation in Atherosclerosis. Circ Res. 2019;124(2):315–327. doi:10.1161/CIRCRESAHA.118.313591
8. Zhang L, Zalewski A, Liu Y, et al. Diabetes-induced oxidative stress and low-grade inflammation in porcine coronary arteries. Circulation. 2003;108:472–478. doi:10.1161/01.CIR.0000080378.96063.23
9. Virmani R, Burke AP, Farb A, et al. Pathology of the vulnerable plaque. J Am Coll Cardiol. 2006;47:C13–8.
10. Mazurek T, Zhang L, Zalewski A, et al. Human epicardial adipose tissue is a source of inflammatory mediators. Circulation. 2003;108:2460–2466. doi:10.1161/01.CIR.0000099542.57313.C5
11. Guglielmi V, Sbraccia P. Epicardial adipose tissue: at the heart of the obesity complications. Acta Diabetol. 2017;54(9):805–812. doi:10.1007/s00592-017-1020-z
12. Sacks HS, Fain JN. Human epicardial adipose tissue: a review. Am Heart J. 2007;153:907–917. doi:10.1016/j.ahj.2007.03.019
13. Iacobellis G. Local and systemic effects of the multifaceted epicardial adipose tissue depot. Nat Rev Endocrinol. 2015;11(6):363–371. doi:10.1038/nrendo.2015.58
14. Kaartinen M, Penttila A, Kovanen PT. Mast cells accompany microvessels in human coronary atheromas: implications for intimal neovascularization and hemorrhage. Atherosclerosis. 1996;123:123–131. doi:10.1016/0021-9150(95)05794-3
15. Tavora F, Kutys R, Li L, et al. Adventitial lymphocytic inflammation in human coronary arteries with intimal atherosclerosis. Cardiovasc Pathol. 2010;19(3):e61–8. doi:10.1016/j.carpath.2009.02.001
16. Yamashita K, Yamamoto MH, Igawa W, et al. Association of epicardial adipose tissue volume and total coronary plaque burden in patients with coronary artery disease. Int Heart J. 2018;59(6):1219–1226. doi:10.1536/ihj.17-709
17. Mazurek T, Kochman J, Kobylecka M, et al. Inflammatory activity of pericoronary adipose tissue may affect plaque composition in patients with acute coronary syndrome without persistent ST-segment elevation: preliminary results. Kardiol Pol. 2013;72:410–416. doi:10.5603/KP.a2013.0320
18. Mazurek T, Kobylecka M, Zielenkiewicz M, et al. PET/CT evaluation of 18F-FDG uptake in pericoronary adipose tissue in patients with stable coronary artery disease: independent predictor of atherosclerotic lesions’ formation? J Nucl Cardiol. 2017;24(3):1075–1084. doi:10.1007/s12350-015-0370-6
19. Guauque-Olarte S, Gaudreault N, Piche ME, et al. The transcriptome of human epicardial, mediastinal and subcutaneous adipose tissues in men with coronary artery disease. PLoS One. 2011;6:e19908. doi:10.1371/journal.pone.0019908
20. Vacca M, Di Eusanio M, Cariello M, et al. Integrative miRNA and whole genome analyses of epicardial adipose tissue in patients with coronary atherosclerosis. Cardiovasc Res. 2016;109(2):228–239. doi:10.1093/cvr/cvv266
21. Dutour A, Achard V, Sell H, et al. Secretory type II phospholipase A2 is produced and secreted by epicardial adipose tissue and overexpressed in patients with coronary artery disease. J Clin Endocrinol Metabol. 2010;95:963–967. doi:10.1210/jc.2009-1222
22. Du Y, Ji Q, Cai L, et al. Association between omentin-1 expression in human epicardial adipose tissue and coronary atherosclerosis. Cardiovasc Diabetol. 2016;15:90. doi:10.1186/s12933-016-0406-5
23. Miksztowicz V, Morales C, Barchuk M, et al. Metalloproteinase 2 and 9 Activity Increase in Epicardial Adipose Tissue of Patients with Coronary Artery Disease. Curr Vasc Pharmacol. 2017;15(2):135–143. doi:10.2174/1570161114666161024124244
24. McAninch EA, Fonseca TL, Poggioli R, et al. Epicardial adipose tissue has a unique transcriptome modified in severe coronary artery disease. Obesity. 2015;23(6):1267–1278. doi:10.1002/oby.21059
25. Mazurek T, Opolski G. Pericoronary adipose tissue: a novel therapeutic target in obesity-related coronary atherosclerosis. J Am Coll Nutr. 2015;34(3):244–254. doi:10.1080/07315724.2014.933685
26. Mazurek K, Zmijewski P, Krawczyk K, et al. High intensity interval and moderate continuous cycle training in a physical education programme improves health-related fitness in young females. Biol Sport. 2016;33(2):139–144. doi:10.5604/20831862.1198626
27. Krämer A, Green J, Pollard J, et al. Causal Analysis Approaches in Ingenuity Pathway Analysis. Bioinformatics. 2014;30(4):523–530. doi:10.1093/bioinformatics/btt703
28. Levine DM, Haynor DR, Castle JC, et al. Pathway and gene-set activation measurement from mRNA expression data: the tissue distribution of human pathways. Genome Biol. 2006;7:R93. doi:10.1186/gb-2006-7-10-r93
29. Chen YT, Wang J, Wee ASY, et al. Differential MicroRNA Expression Profile in Myxomatous Mitral Valve Prolapse and Fibroelastic Deficiency Valves. Int J Mol Sci. 2016;17:753. doi:10.3390/ijms17050753
30. Ward J, Kanchagar C, Veksler-Lublinsky I, et al. Circulating microRNA profiles in human patients with Acetaminophen hepatotoxicity or ischemic hepatitis. Proc Natl Acad Sci USA. 2014;111:12169–12174. doi:10.1073/pnas.1412608111
31. Jeimy SB, Tasneem S, Cramer EM, et al. Multimerin 1. Platelets. 2008;19(2):83–95. doi:10.1080/09537100701832157
32. Yuan HQ, Hao YM, Ren Z, et al. Tissue Factor Pathway Inhibitor in Atherosclerosis. Clin Chim Acta. 2019;491:97–102. doi:10.1016/j.cca.2019.01.024
33. Kawai Y. β-Glucuronidase activity and mitochondrial dysfunction: the sites where flavonoid glucuronides act as anti-inflammatory agents. J Clin Biochem Nutr. 2014;54:145–150. doi:10.3164/jcbn.14-9
34. Yang Z, Wei Z, Wu X, et al. Screening of Exosomal miRNAs Derived From Subcutaneous and Visceral Adipose Tissues: determination of Targets for the Treatment of Obesity and Associated Metabolic Disorders. Mol Med Rep. 2018;18:3314–3324.
35. Hartman J, Frishman WH. Inflammation and Atherosclerosis: a Review of the Role of interleukin-6 in the Development of Atherosclerosis and the Potential for Targeted Drug Therapy. Cardiol Rev. 2014;22:147–151. doi:10.1097/CRD.0000000000000021
36. Zhu Y, Xian X, Wang Z, et al. Research Progress on the Relationship Between Atherosclerosis and Inflammation. Biomolecules. 2018;8:80. doi:10.3390/biom8030080
37. Mineo C. Lipoprotein receptor signalling in atherosclerosis. Cardiovasc Res. 2020;116(7):1254–1274.
38. Zha Y, Chen Y, Xu F, et al. Elevated Level of ADAMTS4 in Plasma and Peripheral Monocytes From Patients With Acute Coronary Syndrome. Clin Res Cardiol. 2010;99:781–786. doi:10.1007/s00392-010-0183-1
39. Zha Y, Chen Y, Xu F, et al. ADAMTS4 level in patients with stable coronary artery disease and acute coronary syndromes. Biomed Pharmacother. 2010;64(3):160–164. doi:10.1016/j.biopha.2009.09.012
40. Kumar S, Chen M, Li Y, et al. Loss of ADAMTS4 reduces high fat diet-induced atherosclerosis and enhances plaque stability in ApoE−/− mice. Sci Rep. 2016;6:31130. doi:10.1038/srep31130
41. Chatterjee TK, Stoll LL, Denning GM, et al. Proinflammatory phenotype of perivascular adipocytes: influence of high-fat feeding. Circ Res. 2009;104:541–549. doi:10.1161/CIRCRESAHA.108.182998
42. Karastergiou K, Evans I, Ogston N, et al. Epicardial adipokines in obesity and coronary artery disease induce atherogenic changes in monocytes and endothelial cells. Arterioscler Thromb Vasc Biol. 2010;30:1340–1346. doi:10.1161/ATVBAHA.110.204719
43. Hirata Y, Tabata M, Kurobe H, et al. Coronary atherosclerosis is associated with macrophage polarization in epicardial adipose tissue. J Am Coll Cardiol. 2011;58:248–255. doi:10.1016/j.jacc.2011.01.048
44. Farias‐Itao DS, Pasqualucci CA, Nishizawa A, et al. B Lymphocytes and Macrophages in the Perivascular Adipose Tissue Are Associated With Coronary Atherosclerosis: an Autopsy Study. J Am Heart Assoc. 2019;8:e013793. doi:10.1161/JAHA.119.013793
45. Scuruchi M, Potì F, Rodríguez-Carrio J, et al. Biglycan and atherosclerosis: lessons from high cardiovascular risk conditions. Biochim Biophys Acta Mol Cell Biol Lipids. 2020;1865(2):158545. doi:10.1016/j.bbalip.2019.158545
46. Zhou H, Che Y, Fu X, et al. Interaction between tissue factor pathway inhibitor-2 gene polymorphisms and environmental factors associated with coronary atherosclerosis in a Chinese Han. J Thromb Thrombolysis. 2019;47:67–72. doi:10.1007/s11239-018-1755-6
47. Son GH, Kim Y, Lee JJ, et al. MicroRNA-548 Regulates High Mobility Group Box 1 Expression in Patients With Preterm Birth and Chorioamnionitis. Sci Rep. 2019;9:19746. doi:10.1038/s41598-019-56327-9
48. Bianchi ME, Agresti A. HMG proteins: dynamic players in gene regulation and differentiation. Curr Opin Genet Dev. 2005;15(5):496–506. doi:10.1016/j.gde.2005.08.007
49. Tang Y, Lv B, Wang H, et al. PACAP inhibit the release and cytokine activity of HMGB1 and improve the survival during lethal endotoxemia. Int Immunopharmacol. 2008;8(12):1646–1651. doi:10.1016/j.intimp.2008.07.014
50. Chen G, Li J, Ochani M, et al. Bacterial endotoxin stimulates macrophages to release HMGB1 partly through CD14- and TNF-dependent mechanisms. J Leukoc Biol. 2004;76:994–1001. doi:10.1189/jlb.0404242
51. Scaffidi P, Misteli T, Bianchi ME. Release of chromatin protein HMGB1 by necrotic cells triggers inflammation. Nature. 2002;418:191–195. doi:10.1038/nature00858
52. Degryse B, Bonaldi T, Scaffidi P, et al. The high mobility group (HMG) boxes of the nuclear protein HMG1 induce chemotaxis and cytoskeleton reorganization in rat smooth muscle cells. J Cell Biol. 2001;152:1197–1206. doi:10.1083/jcb.152.6.1197
53. Tsung A, Tohme S, Billiar TR. High-mobility group box-1 in sterile inflammation. J Intern Med. 2014;276:425–443. doi:10.1111/joim.12276
54. Kuivaniemi H, Tromp G. Type III Collagen (COL3A1): gene and Protein Structure, Tissue Distribution, and Associated Diseases. Gene. 2019;707:151–171. doi:10.1016/j.gene.2019.05.003
55. Pusterla T, de Marchis F, Palumbo R, et al. High Mobility Group B2 Is Secreted by Myeloid Cells and Has Mitogenic and Chemoattractant Activities Similar to High Mobility Group B1. Autoimmunity. 2009;42(4):308–310. doi:10.1080/08916930902831845
56. Alvarez RH, Kantarjian HM, Cortes JE. Biology of Platelet-Derived Growth Factor and Its Involvement in Disease. Mayo Clin Proc. 2006;81:1241–1257. doi:10.4065/81.9.1241
57. Papadopoulos N, Lennartsson J. The PDGF/PDGFR Pathway as a Drug Target. Mol Aspects Med. 2018;62:75–88. doi:10.1016/j.mam.2017.11.007
58. Rutherford C, Martin W, Carrier M, et al. Endogenously elicited antibodies to platelet derived growth factor-BB and platelet cytosolic protein inhibit aortic lesion development in the cholesterol-fed rabbit. Int J Exp Pathol. 1997;78(1):21–32. doi:10.1046/j.1365-2613.1997.d01-237.x
59. Rutherford C, Martin W, Salame M, et al. Substantial inhibition of neo-intimal response to balloon injury in the rat carotid artery using a combination of antibodies to platelet-derived growth factor-BB and basic fibroblast growth factor. Atherosclerosis. 1997;130(1–2):45–51. doi:10.1016/S0021-9150(96)06042-X
60. Wi SM, Moon G, Kim J, et al. TAK1-ECSIT-TRAF6 complex plays a key role in the TLR4 signal to activate NF-κB. J Biol Chem. 2014;289(51):35205–35214. doi:10.1074/jbc.M114.597187
61. Liu T, Zhang L, Joo D, et al. NF-κB signaling in inflammation. Signal Transduct Target Ther. 2017;2:215.
62. Zeng X, Guo R, Dong M, et al. Contribution of TLR4 signaling in intermittent hypoxia-mediated atherosclerosis progression. J. Transl. Med. 2018;16:106. doi:10.1186/s12967-018-1479-6
63. Long F, Wang L, Yang L, et al. Screening Hub Genes in Coronary Artery Disease Based on Integrated Analysis. Cardiol J. 2018;25(3):403–411. doi:10.5603/CJ.a2017.0106
64. Xu J, Li W, Bao X, et al. Association of Putative Functional Variants in the PLAU Gene and the PLAUR Gene With Myocardial Infarction. Clin Sci. 2010;119:353–359. doi:10.1042/CS20100151
65. Li YH, Shi GY, Wu HL. The Role of Thrombomodulin in Atherosclerosis: from Bench to Bedside. Cardiovasc Hematol Agents Med Chem. 2006;4:183–187. doi:10.2174/187152506776369953
66. Xu J, Jin J, Tan S. Association of Thrombomodulin Gene Polymorphisms With Susceptibility to Atherosclerotic Diseases: a Meta-Analysis. Ann Hum Genet. 2016;80:172–181. doi:10.1111/ahg.12148
67. Wu KK, Aleksic N, Ahn C, et al. Atherosclerosis Risk in Communities Study (ARIC) Investigators. Thrombomodulin Ala455Val Polymorphism and Risk of Coronary Heart Disease. Circulation. 2001;103:1386–1389. doi:10.1161/01.CIR.103.10.1386
 © 2021 The Author(s). This work is published and licensed by Dove Medical Press Limited. The full terms of this license are available at https://www.dovepress.com/terms.php and incorporate the Creative Commons Attribution - Non Commercial (unported, v3.0) License.
By accessing the work you hereby accept the Terms. Non-commercial uses of the work are permitted without any further permission from Dove Medical Press Limited, provided the work is properly attributed. For permission for commercial use of this work, please see paragraphs 4.2 and 5 of our Terms.
© 2021 The Author(s). This work is published and licensed by Dove Medical Press Limited. The full terms of this license are available at https://www.dovepress.com/terms.php and incorporate the Creative Commons Attribution - Non Commercial (unported, v3.0) License.
By accessing the work you hereby accept the Terms. Non-commercial uses of the work are permitted without any further permission from Dove Medical Press Limited, provided the work is properly attributed. For permission for commercial use of this work, please see paragraphs 4.2 and 5 of our Terms.