")
Back to Journals » International Journal of General Medicine » Volume 15
ATG16L1 is a Potential Prognostic Biomarker and Immune Signature for Osteosarcoma: A Study Based on Bulk RNA and Single-Cell RNA-Sequencing
Authors Qin Z , Luo K, Liu Y, Liao S, He J, He M, Xie T, Jiang X, Li B, Liu H, Huang Q, Tang H, Feng W, Zhan X
Received 27 October 2021
Accepted for publication 10 January 2022
Published 2 February 2022 Volume 2022:15 Pages 1033—1045
DOI https://doi.org/10.2147/IJGM.S341879
Checked for plagiarism Yes
Review by Single anonymous peer review
Peer reviewer comments 2
Editor who approved publication: Dr Scott Fraser
Zhaojie Qin,1,2,* Kai Luo,1,* Yun Liu,1 Shijie Liao,3 Juliang He,4 Mingwei He,3 Tianyu Xie,3 Xiaohong Jiang,5 Boxiang Li,5 Huijiang Liu,1,6 Qian Huang,6 Haijun Tang,5 Wenyu Feng,3,* Xinli Zhan1,*
1Department of Spinal Bone Disease, First Affiliated Hospital of Guangxi Medical University, Nanning, 530021, Guangxi, People’s Republic of China; 2Department of Orthopedic, The People’s Hospital of Hechi, Hechi, 547600, Guangxi, People’s Republic of China; 3Department of Trauma Orthopedic and Hand Surgery, First Affiliated Hospital of Guangxi Medical University, Nanning, 530021, Guangxi, People’s Republic of China; 4Department of Bone and Soft Tissue Surgery, Guangxi Medical University Cancer Hospital, Nanning, 530021, Guangxi, People’s Republic of China; 5Department of Orthopedic, Affiliated Minzu Hospital of Guangxi Medical University, Nanning, 530021, Guangxi, People’s Republic of China; 6Department of Orthopedics, The First People’s Hospital of Nanning, Nanning, 530021, Guangxi, People’s Republic of China
*These authors contributed equally to this work
Correspondence: Xinli Zhan
Department of Spinal Bone Disease, First Affiliated Hospital of Guangxi Medical University, Nanning, 530021, Guangxi, People’s Republic of China
, Tel +86 771-5350189
, Fax +867715350001
, Email [email protected]; Wenyu Feng
Department of Trauma Orthopedic and Hand Surgery, First Affiliated Hospital of Guangxi Medical University, Nanning, 530021, Guangxi, People’s Republic of China
, Tel +86 18277185646
, Fax +867715350001
, Email [email protected]
Background: Osteosarcoma is a common solid malignancy of the bone in children and adolescents, and its metastasis and recurrence are the principal causes of poor treatment outcomes.
Methods: Autophagy-related genes were used to cluster osteosarcoma patients by consensus clustering analysis using the GSE21257 database. Differentially expressed genes (DEGs) were identified by limma package. Multiple-gene risk signature was constructed using least absolute shrinkage and selection operator (LASSO) analysis and Cox regression analyses. Quantitative reverse transcription polymerase chain reaction (qRT-PCR) was used to determine gene expression levels. Then, single-cell RNA-sequencing dataset GSE152048 were used to identify the correlation between the DEGs and effector molecules expressed in specific tumor-infiltrating immune cells.
Results: Two clusters were identified in the consensus clustering analysis, which were confirmed by principal component analysis. Limma analysis revealed that 15 genes were related, and 9 genes were screened using protein-protein interaction network and LASSO regression analysis. Cox regression analyses identified 5 genes. Combined with survival analysis, only the autophagy related 16 like 1 gene (ATG16L1) was significant. The results of qRT-PCR showed low expression levels of ATG16L1 in tumor cells group. Immune infiltration analysis revealed significantly lower expression of CD8+ T cells in the high ATG16L1 gene expression group. ScRNA-seq revealed that in the ATG16L1+CD8+ T cell group, the expression of GZMB was lower, whereas the expression of ITGA1 was higher. These results showed that ATG16L 1 is an immune-related gene, which is associated with poor prognosis in patients with osteosarcoma.
Conclusion: ATG16L1 is a potential prognostic biomarker and immune signature and may be a therapeutic target for osteosarcoma.
Keywords: osteosarcoma, prognosis, ATG16L1, CD8+ T cell, scRNA-seq
Introduction
Osteosarcoma is a common bone tumor in children and adolescents, accounting for 15% of solid extracranial cancers in this age group.1,2 Osteosarcoma typically originates from the long bones of the limbs near the metaphyseal growth plate and shows a high propensity for metastasizing to the lungs. Use of chemotherapy in combination with surgical resection has helped improve the 5-year survival rate of patients with osteosarcoma.3 Nevertheless, in the past few decades, there has been no major improvement in the overall survival rate of these patients (5-year overall survival rate of patients with lung metastasis: 20%).4,5 Patients with metastasis and recurrence show poor response to chemotherapy and radiotherapy.
An increasing number of studies have indicated the potential value of autophagy in clinical treatment.6–8 Use of chemotherapy activates autophagy in tumor cells, which accelerates development of resistance to drug cytotoxicity and renders cancer cells insensitive to treatment.9 Use of autophagy inhibitors in combination with anti-tumor drugs can have greater anti-tumor effects by Increasing the sensitivity of osteosarcoma cells to drugs.10
Autophagy is a dynamic homeostatic mechanism that helps maintain the stability of the intracellular environment by delivering unnecessary organelles to the lysosome for degradation.11 It is a multistep regulatory event in response to cancer treatment. Autophagy can play a dual role in cancer cells. Autonomous cellular autophagy can inhibit tumorigenesis while it can promote tumorigenesis in established tumors, especially those in metastatic stages. Early deletion of autophagy-related genes (ATGs) seems to mainly inhibit the lymphatic lineage and lead to bone marrow proliferation. Autophagy is stimulated and required for peripheral T cell and effector survival and CD8+ memory T cell formation in naive T cells. CD8+ T cells play an important role in anti-tumor immunity, and autophagy is an autonomous regulator of CD8+ T cell metabolism.12
The development of high-throughput sequencing technology has allowed transcriptome analysis at the molecular level.13 Bulk RNA sequencing can help detect RNA transcripts in the tissue or mass of cells. Advances in scRNA-seq have facilitated in-depth characterization of the composition and heterogeneity of the tumor microenvironment (TME) at the single-cell level, promoting the research and development of new biomarkers and drugs. Recently, applications of scRNA-seq in the context of bone tumors and autophagy have been reported.14–19
In the present study, we explained how ATGs affect osteosarcoma by mediating CD8+ T cells through the traditional bulk RNA sequencing and scRNA-seq.
Materials and Methods
Acquisition of Gene Expression Datasets
The gene expression datasets GSE21257 and GSE152048 were downloaded from the Gene Expression Omnibus database (https://www.ncbi.nlm.nih.gov/geo/). GSE21257 includes microarrays of pre-chemotherapy biopsy of patients with osteosarcoma that metastasized within 5 years (n=34) and in patients with osteosarcoma that did not metastasize within 5 years (n=19). The data in the profiles were obtained from the GPL10295 platform. Our study was approved by the Medical Ethics Committee of the First Affiliated Hospital of the Guangxi Medical University (No. 2021KY-E-230).
Consensus Clustering Analysis
The GSE21257 dataset was clustered using the “ConsensusClusterPlus” R package (version 1.50.0). The different gene expression patterns were subsequently confirmed through principal component analysis (PCA). Then, the “survival” R package (version 3.2.3) was applied to analyze the overall survival of patients.20
CIBERSORT Analysis
The CIBERSORT algorithm is a general method to predict immune infiltration. The matrix (immune cell) was filtered based on CIBERSORT P<0.05 and then the relative expressions of 22 types of immune cells were identified in 53 osteosarcoma samples in GSE21257. “Pheatmap” and “vioplot” packages were used to visualize the corresponding results.
Identification of Differentially Expressed Genes (DEGs)
DEGs were identified using the “Limma” package (version 3.42.0)21 on the basis of the expression levels in the osteosarcoma patients. The selection criteria of DEGs were as follows: log2 fold change (FC) was greater than 2 or less than −2 and p value less than 0.05. The analysis results were visualized using “Pheatmap” package.
Protein-Protein Interaction (PPI) Network Analysis
STRING (https://string-db.org/) was conducted to predict interactions between functional proteins and establish a PPI network. The network was conducted with Cytoscape software (version 3.8.0).
Prognostic Signature Generation and Prediction
LASSO regression analysis was performed to set up a risk signature using “glmnet” package (version 4.1–3). Univariate and multivariate Cox regression analyses were used to assess the risk score by “survival” package (3.2–11). The dataset was grouped into two parts according to the median-risk score: high-risk group and low-risk group. The prognosis of the two groups were compared using Kaplan–Meier analysis and Log rank test. Then, 5-year receiver-operating characteristic (ROC) curves were established to assess the predictive accuracy of risk signatures.
Quantitative Reverse Transcription Polymerase Chain Reaction (qRT-PCR)
The human osteoblasts hFOB1.19 and human osteosarcoma cells U2, MG63, 143B were obtained from the FuHeng Cell Center (FuHeng Cell Center, Shanghai, China). The hFOB1.19 was considered as the control group. All cells were grown in Dulbecco’s modified Eagle’s medium (DMEM, Gibco, Carlsbad, CA, USA) in the presence of 10% fetal bovine serum (FBS, Gibco) and 1% streptomycin/ penicillin (Solarbio, Beijing, China) in a humidified atmosphere containing 5% CO2. The osteosarcoma cells were maintained at 37 °C, and hFOB1.19 cells were maintained at 33.5 °C. The RNA was extracted from the induced samples using Hipure Total RNA Mini kit (Magen, China). The extracted RNA was reverse transcribed into cDNA using a cDNA synthesis kit (Takara, Japan). qRT-PCR was performed to analyze the gene expression levels using SYBR Green (LightCycler® 480 SYBR Green I Master, Roche, UK). Glyceraldehyde 3-phosphate dehydrogenase (GADPH, Abcam, USA) was used as the internal control. The experiments were performed in triplicate. The primer sequences are listed in Table 1.
 |
Table 1 The Primers of ATG16L1 and GAPDH |
Analysis Based on scRNA-Seq Transcriptome Datasets
The scRNA-seq transcriptome datasets of GSE152048 were obtained from the NCBI web site (https://www.ncbi.nlm.nih.gov/geo). Seven primary osteosarcoma samples were selected for analysis. Then the “Seurat” package (version 3.1.1) was used to perform the quality control of single-cell data, which was merged via the “Merge” function.22,23 Low-quality cells were screened out in accordance with the criteria of gene number < 300 and > 5000 and those with a mitochondrial gene number > 10%. In addition, the batch effect was eliminated using “Harmony” package (version 1.0).24 Then, the “FindClusters” function of Seurat package with a resolution parameter of 0.05 was used to achieve cell clusters. T cells were acquired using the “Subset” function of the “Seurat” package for clustering, and marker genes were applied to annotate cell clusters including CD8+ T cells. Then, CD8+ T cells were clustered into two group based on the absence or presence of ATG16L1 expression namely, ATG16L1+ CD8+ T cells and ATG16L1−CD8+ T cells, to explore the relation between ATG16L1 and cytotoxic effector molecules. Gene set variation analyses (GSVA) was used to estimate the variation of pathways using the “GSVA” package (version,1.34.0).25
Statistical Analysis
All statistical analyses were carried out using R (version 3.6.3). Survival analysis was evaluated using Cox regression analysis. The risk ratio (hazard ratio [HR]) and 95% confidence interval (CI) were calculated to identify the genes associated with overall survival. Survival outcomes were computed using Kaplan–Meier method and between-group differences were assessed using the Log rank test.Two-sided P values < 0.05 were considered indicative of statistical significance.
Results
Consensus- Clustering Analysis
In the consensus- clustering analysis, according to the similarity of the gene expression, it was the optimal choice to divide the osteosarcoma samples into two clusters (Figure 1A–C). Kaplan–Meier survival analysis showed that the overall survival rate in cluster 1 was obviously higher than that in cluster 2 (Figure 1D). PCA confirmed the results (Figure 1E). This suggested that the data can be divided into two groups.
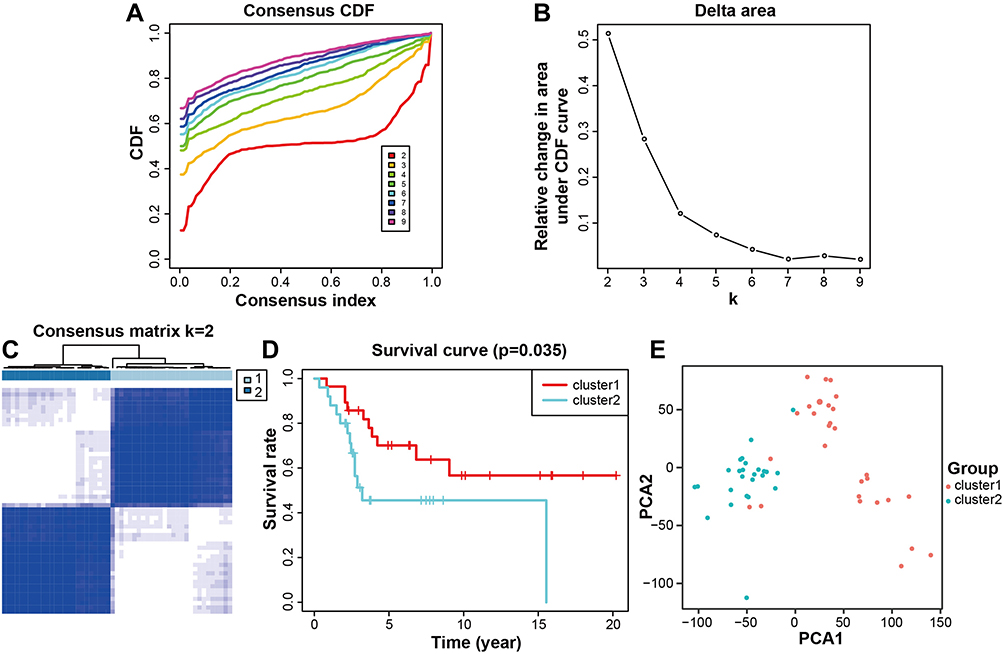 |
Figure 1 Classification of osteosarcoma patients. (A) Consensus CDF for k = 2–10. (B) Relative change in area under CDF curve (k = 2–10). (C) Osteosarcoma patients were separated into two clusters (k = 2). (D) Patients in cluster 1 group had better overall survival. (E) The clusters were confirmed by PCA. Pink represents cluster 1 and cyan represents cluster 2. P < 0.05 was considered indicative of significant difference. Abbreviations: CDF, Cumulative distributive function; PCA, principal component analysis. |
Immune Cell Fraction Estimation
The immune cell fraction was estimated in all samples (Figure 2A–D). Immune cells, except eosinophils, were counted and exhibited in the two clusters. Macrophages M0, macrophages M2, and mast resting cells accounted for the largest components of immune cells. The fraction of T cells CD8+ was apparently higher in cluster 1.
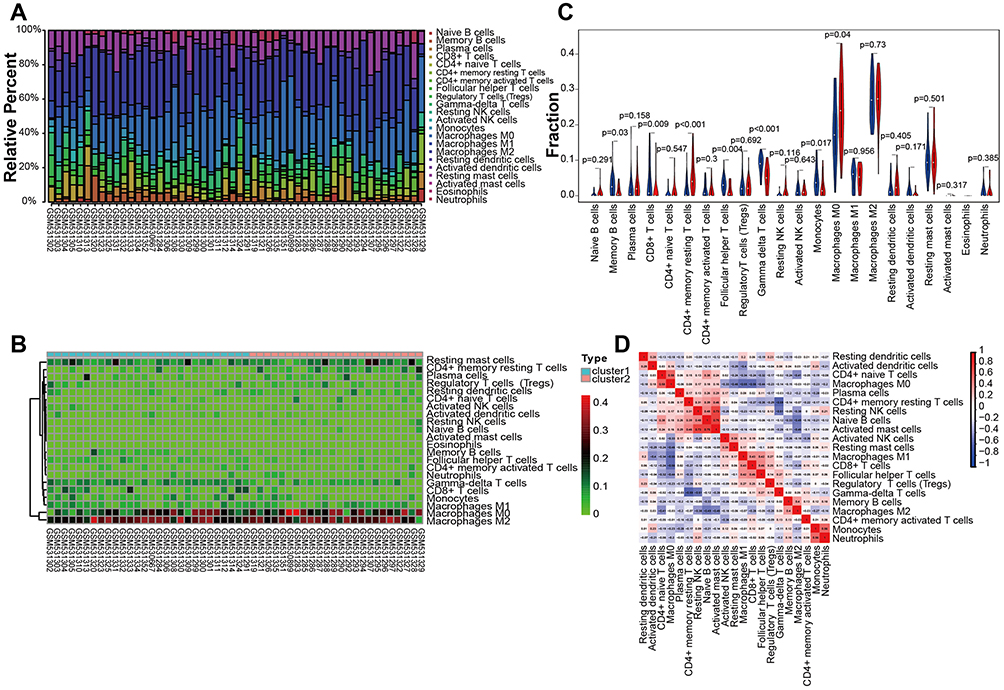 |
Figure 2 Results of immunoinfiltration analysis showing the immune cells expressed in the osteosarcoma samples. (A) Histogram showing the expression rate of the immune cells in the 53 samples. (B) Heatmap showing the comparison of the immune cells between the two clusters. (C) Identification of differentially infiltrated tumor-infiltrating immune cells between the two clusters via CIBERSORT algorithm. Blue represents cluster 1 and red represents cluster 2. (D) Pearson correlation among the immune cells. P < 0.05 was considered indicative of significant difference. |
Construction and Evaluation of DEGs
DEGs (Figure 3A) were tested to construct a prognostic prediction signature for osteosarcoma patients, and then the interaction network among the DEGs was analyzed (Figure 3B–C). The Pearson correlation among the DEGs was used (Figure 3D). Finally, the following 9 DEGs were obtained: PTPN2, PIK3R4, PARK2, LRRK2, GPR65, C9orf72, ATP6AP2, ATG16L1, and APP.
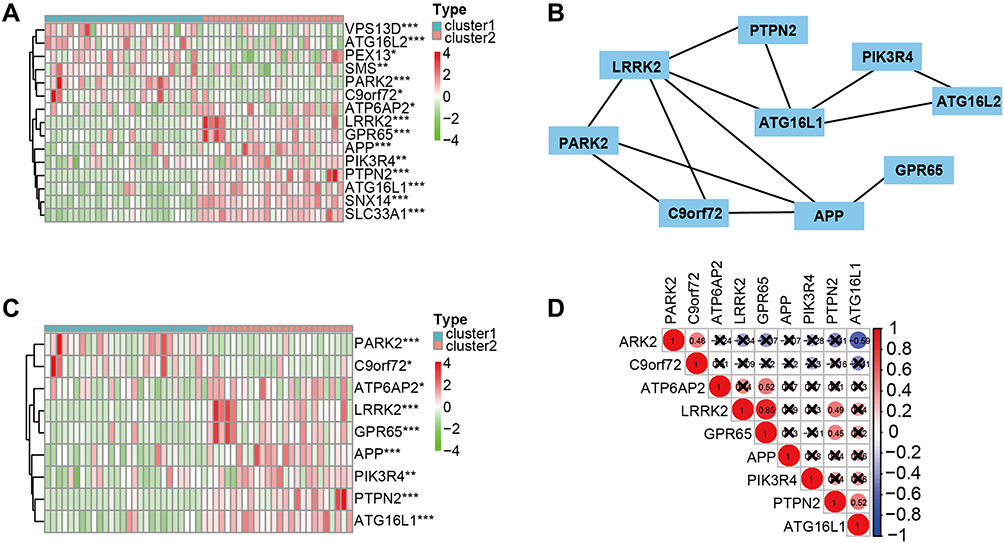 |
Figure 3 The interaction and correlation among the DEGs. (A) Heatmap of the DEGs between cluster 1 and cluster 2. (B) PPI network reduced the DEGs following STRING database. (C) Heatmap showing the DEGs between cluster 1 and cluster 2. (D) Pearson correlation among the DEGs. *P < 0.05, **P < 0.01, ***P < 0.001. P < 0.05 was considered indicative of significant difference. Abbreviation: DEGs, differentially expressed genes. |
LASSO Analysis of the Hub Genes
Nine genes were selected for lasso regression analysis to clarify the internal relationship. Finally, a risk signature of five genes was found (Figure 4A–B). Kaplan–Meier survival analysis showed that the low-risk group was associated with significantly greater osteosarcoma survival rate than the high-risk group (Figure 4C; P= 3.079×10⁻²). The area under the curve (AUC) of this risk signature was 0.749 (Figure 4D), which indicated the good sensitivity and specificity of the risk signature. Heatmaps comprising clinical information showed that in the high-risk group, the expression levels of the ATG16L1, PTPN2, PIK3R4, and APP were higher and the expression level of C9orf72 was lower (Figure 4E). Moreover, high -risk group had a larger proportion of metastatic disease. Huvos grade, gender, age, and survival status showed diffused distribution in the two groups.
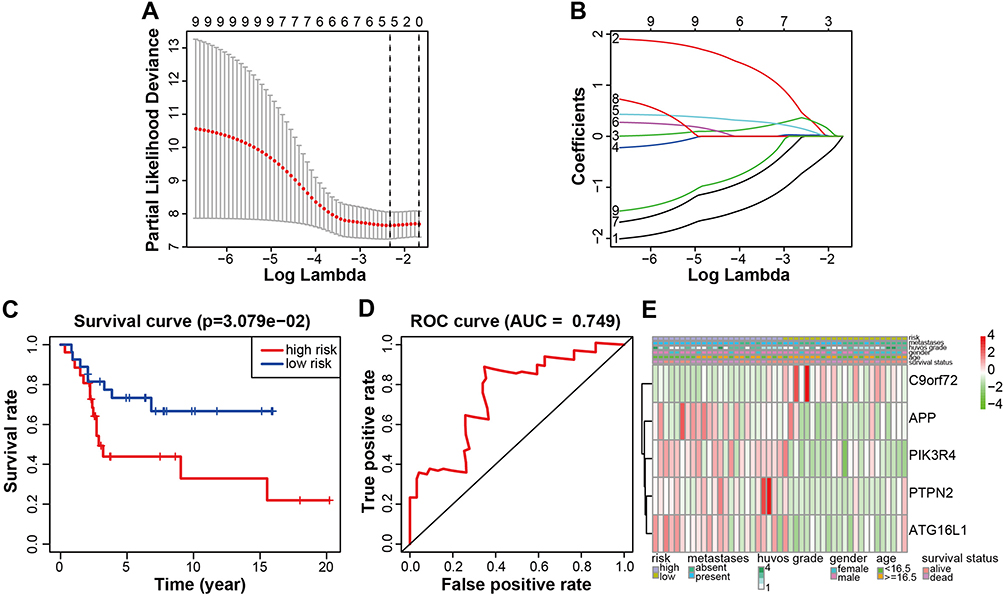 |
Figure 4 Prognosis model associated with genes. (A and B) Univariate Cox regression analysis identified the remaining 5 DEGs with LASSO coefficient profiles. (A) The partial likelihood deviance is shown against Log Lambda. (B) LASSO coefficients profiles of DEGs. (C) Kaplan-Meier survival analysis in low- or high-risk osteosarcoma patients. (D) Time-dependent ROC curve analysis indicating the sensitivity and specificity for predicting (AUC=0.749). (E) Heatmap summarizing the clinical information of low- or high-risk osteosarcoma patients. P < 0.05 was considered indicative of significant difference. Abbreviations: DEGs, differentially expressed genes; LASSO, least absolute shrinkage and selection operator; ROC, receiver-operating characteristic; AUC, area under the curve. |
Risk Score and Other Clinicopathological Characteristics
Only patients with complete survival data and clinicopathological characteristics were included. Finally, “age,” “gender,” “grade,” and the risk score were incorporated into the univariate and multivariate cox regression analyses (Figure 5A–B). Grade and risk score showed a significant correlation with overall survival (HR: 0.482; CI: 0.270–0.861; P = 0.014 and HR: 2.255; CI: 1.231–4.130; P = 0.008, respectively).
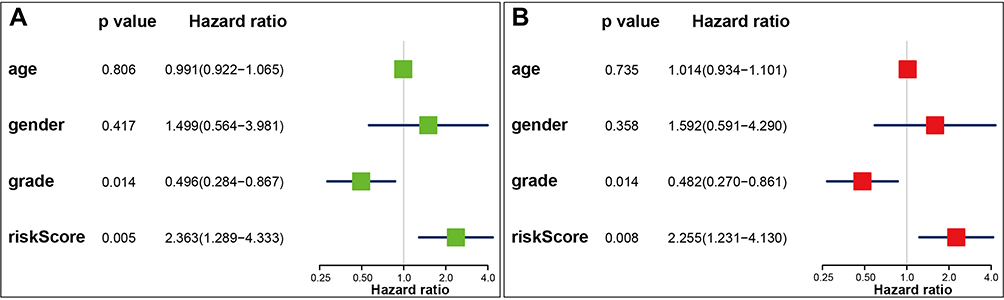 |
Figure 5 Cox regression analyses of the risk score and clinicopathological parameters to select factors significantly associated with overall survival. (A) Forest plot of univariate Cox regression analysis in osteosarcoma patients. (B) Forest plot of multivariate Cox regression analysis in osteosarcoma patients. |
Functional Analysis of ATG16L1
Survival analysis showed that only the ATG16L1 gene had significantly improved in the high-risk group (Figure 6A–E; p = 3.40×10⁻²). The AUC of the ATG16L1 gene’s ROC curve was 0.684 (Figure 6F).
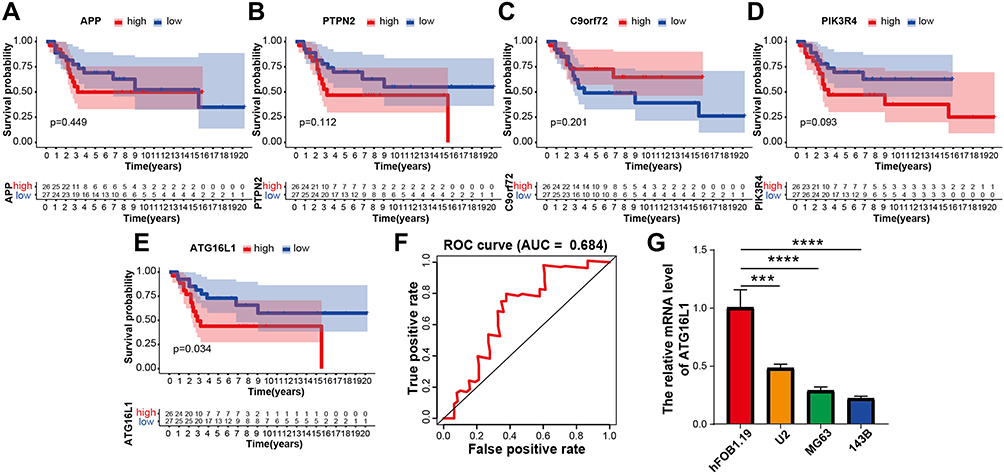 |
Figure 6 Construction of DEGs and assessment of its prognostic value. (A–E) Kaplan-Meier survival curve showing the survival outcomes in the high-risk and low-risk groups of osteosarcoma patients based on the DEGs. (F) Time-dependent ROC curve analysis (AUC=0.684). (G) Results of qRT-PCR. The expressions of ATG16L1 in three osteosarcoma cell lines were significantly lower than that in hFOB 1.19. *P < 0.05, **P < 0.01, ***P < 0.001, ****P < 0.0001. p < 0.05 was considered indicative of significant difference. Abbreviations: DEGs, differentially expressed genes; ROC, receiver-operating characteristic; AUC, area under the curve; qRT-PCR, quantitative reverse transcription polymerase chain reaction. |
The immune cell fraction (Figure 7) was estimated between the group with expression of the ATG16L1 gene (ATG16L1+ group, red) and the group without expression of the ATG16L1 gene (ATG16L1− group, green). CD8+ T cells, monocytes, and helper T cells were higher in the ATG16L1− group, whereas macrophage M0 and memory resting CD4 T cells were higher in the ATG16L1+ group. CD8+ T cells exhibit potent cytotoxic activity against cancer cells.26
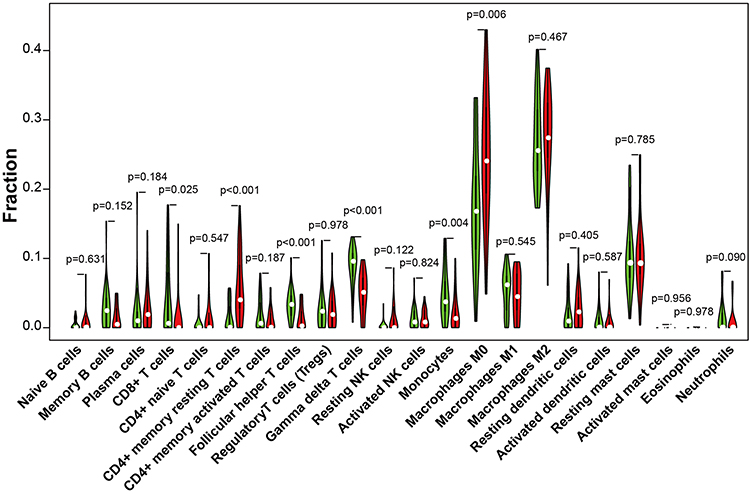 |
Figure 7 Violin plot for comparison of the immune cell fraction difference between the group with expression of the ATG16L1 gene (red) and the group without expression of the ATG16L1 gene (green). P < 0.05 was considered indicative of significant difference. |
qRT-PCR
To confirm the gene expression in osteosarcoma, we conducted in-vitro experiments. The results of qRT-PCR revealed that the expression of ATG16L1 gene was significantly lower in osteosarcoma cell lines (U2, MG63,143B) than in hFOB1. 19 (Figure 6G), which suggested that the expression of the gene was significantly lower in osteosarcoma cell lines than in normal control cells. This suggested that the gene may possibly not impact the osteosarcoma but rather the TME immune cells.
ATG16L1 Inhibited the Expression of GZMB and Promoted the Expression of ITGA1 in CD8+ T Cell
The scRNA-seq transcriptome datasets of 7 osteosarcoma cases were collected from the NCBI to investigate the effect of the ATG16L1 gene on CD8+ T cells. After normalization, PCA was used to achieve dimensionality reduction. Uniform Manifold Approximation and Projection (UMAP) analysis was performed to display the dimensional-reduced data in a 2D space, and then the cells were overlapped into 7 cell clusters (Figure 8A–B). With the existing cell types as reference, the cell clusters were annotated by marker genes (Figure 8C). Therefore, the cell types, marker genes, and proportions of these 7 cell clusters were as follows: chondroblastic cells (Runx2, Sox9, IBSP, Acan),16,27 macrophage (CD163, LYZ),28 osteoclasts (ACP5, CTSK, ATP6V0D2),16,29,30 osteoblastic cells (ALPL),31 endothelial cells (EGFL7, PLVAP),32,33 T cells (CD3D, CD3E, CD3G),34 and cancer-associated fibroblasts (PDGFRB, ACTA2).32,35 The number and proportion of these cells are shown in Figure 8B, in which the number and proportion of T cells were 3288 and 4.73%, respectively. Similarly, the data of T cells were extracted to perform UMAP analysis to obtain 3 cell clusters (Figure 8D), which were annotated by marker genes. The cell types and marker genes included CD8+ T cells (CD3E, CD3G, CD8A, CD8B),36,37 Tregs (CTLA4, TIGIT, CD4)38 and T cells (CD3D, LAG3)39 (Figure 8E). Then, CD8+ T cells were divided into the ATG16L1+ and ATG16L1– groups. The cytotoxic effector molecules of CD8+ T cells were screened, and the results revealed that the expression levels of granzyme B (GZMB) and integrin subunit alpha 1 (ITGA1) were significantly different between the groups (Figure 8F–G). In the ATG16L1+CD8+ T cell group, the expression of GZMB was lower, whereas the expression of ITGA1 was higher. GSVA revealed that the CD8 TCR Pathway, CD8 TCR Downstream Pathway, Effector VS exhausted CD8 T cell UP, PD1 high vs PD1 low CD8 T cell DN, Cancer immunotherapy by PD1 blockade, Cancer immunotherapy by CTLA4 blockade were upregulated, whereas the Naive vs EFF CD8 T cell UP, Tumor invasiveness 2D, and PD1 high vs PD1 low CD8 T cell UP were downregulated in the ATG16L1+CD8+ T cell group (Figure 8H).
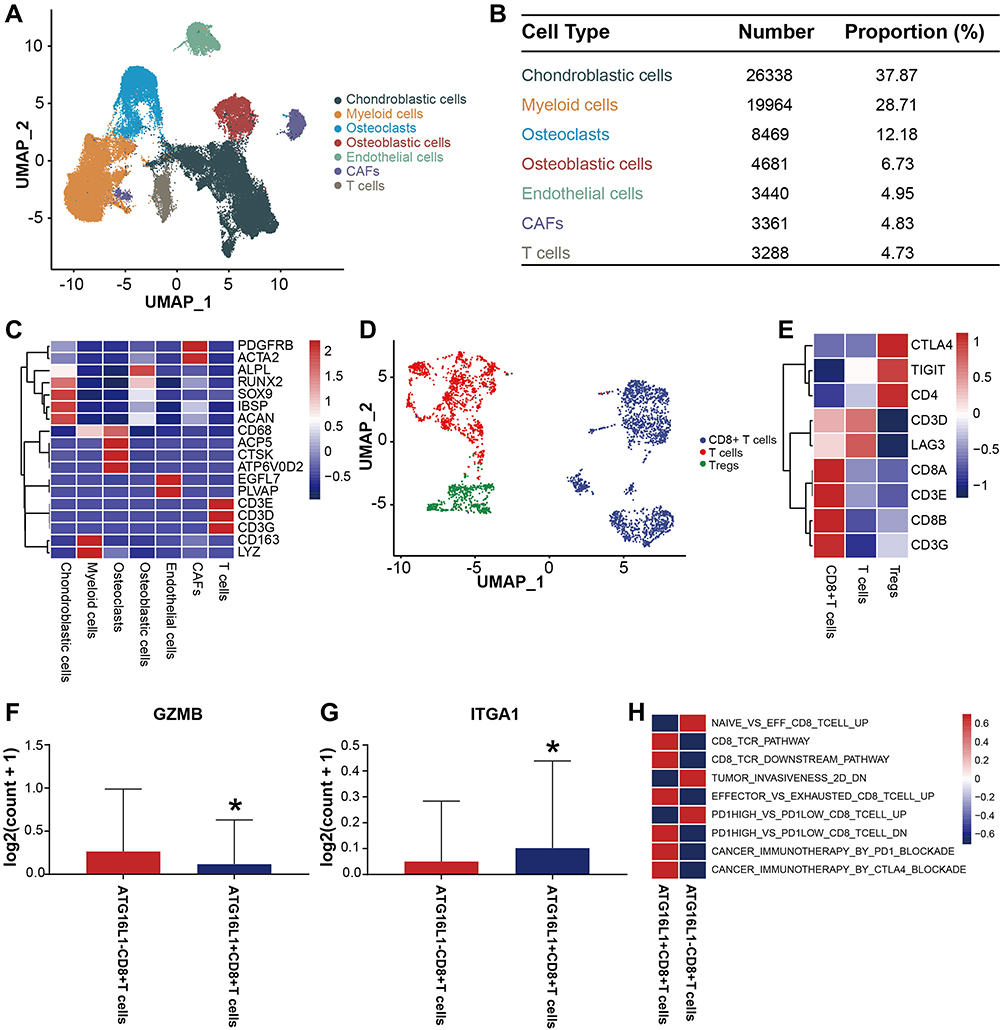 |
Figure 8 Heterogeneity of CD8+ T cell populations in osteosarcoma. (A) UMAP plot showing the cells in the TME, with the different colors representing the different cell types. (B) Composition of the cells in the TME. (C) Marker genes of cells in the TME. (D) UMAP plot showing the CD8+ T cells, T cells and Tregs, with the different colors representing the different cell types. (E) Marker genes of the CD8+ T cells, T cells, and Tregs. (F) (G) The expressions of GZMB and ITGA1 between the ATG16L1+CD8+ T and ATG16L1−CD8+ T cells groups. (H) GSVA showing the function of the ATG16L1+CD8+ T cells group and ATG16L1−CD8+ T cells group. *P < 0.05. P < 0.05 was considered indicative of significant difference. Abbreviations: UMAP, uniform manifold approximation and projection; GSVA, gene set variation analysis; TME, the tumor microenvironment. |
Discussion
The primary goal of our research was to provide a signature and therapeutic target to help improve the prognostic accuracy of osteosarcoma patients. Currently, metastasis and relapse of osteosarcoma are unavoidable risks. Lung metastasis and recurrence are the main challenge in the treatment of osteosarcoma. Most patients with osteosarcoma have locally-advanced disease or lung metastasis at the time of diagnosis.40 Advances in understanding of the genetic determinants of osteosarcoma can facilitate risk stratification of patients, which potentially can outperform the current pathological staging system.41 Osteosarcoma cells are formed in the TME, which contains a complex mixture of other cells (MSCs, fibroblasts, osteoblasts, and myeloid immune cells such as CD8+ T cells).42 This special TME environment is suitable for the development and metastasis of osteosarcoma.
At present, the common methods used for analysis of the TME include bulk and single-cell RNA sequencing. In bulk RNA sequencing, we analyzed the GSE152048 dataset, which contained microarrays of pre-chemotherapy biopsies of osteosarcoma patients. Bioinformatics analysis was used to identify the hub genes. Fifteen hub genes were identified by limma analysis, and combined with PPI network, only nine genes left (Figures 3 and 4); the ATG16L1 gene was significantly upregulated in the high-risk group. Survival analysis (Figure 5A–E) showed that only the ATG16L1 gene was highly expressed in the high-risk group. The immune cell fraction was estimated. CD8+ T cells, helper T cells, and monocytes were lower in the ATG16L1+ group (Figure 7). The results of qRT-PCR showed significantly lower expressions of ATG16L1 in osteosarcoma cells compared with that in the control group (Figure 5F). These results suggest that ATG16L1 gene may influence osteosarcoma by acting on immune cells in the TME.
In the past few years, the ability to perform single-cell expression profiles to thousands of cells in a single experiment has been demonstrated.43 ScRNA-seq offers advantages in characterizing tumor heterogeneity and functional analysis of immune cells.44,45 In the present paper, we discuss the role of ATG16L1 gene at the single-cell level. Analysis of the scRNA-seq transcriptome datasets showed that the expression levels of GZMB in the ATG16L1+CD8+ T cell group were significantly lower than those in the ATG16L1−CD8+ T cell group, and the expression levels of ITGA1 were significantly higher in the ATG16L1+CD8+ T cell group than in the ATG16L1−CD8+ T cell group (Figure 8A–H). These findings indicate that ATG16L1 can inhibit the expression of GZMB and promote the expression of ITGA1.
It has been reported that GZMB is usually expressed in immune cells, such as CD8+ T cells and NK cells. GZMB is one of the most potent cytotoxic molecules, which mainly has an anti-tumor effect in the TME.46,47 CD8+ T cells with high expression of GZMB were shown to be associated with prolonged survival of osteosarcoma patients.48 ITGA1 was shown to be is a malignant biomarker in pancreatic cancer.49 Some studies have shown that ITGA1 acts as an oncogene in the context of gastric cancer, colorectal cancer and lung cancer.50–52 Therefore, ATG16L1 can inhibit the expression of GZMB and promote the expression of ITGA1, subsequently reducing the lethality of CD8+ T cells to tumor cells.
ATG16L1 is a component of a large protein complex necessary for autophagy. Autophagy is widespread phenomenon in cells. Loss of autophagy can enhance rejection of tumors mediated by CD8+ T cells. CD8+ T cells play an essential role in anti-tumor immunity. Suppression of autophagy induces glycolytic phenotype in T cells leading to a decrease in S-adenosyl methionine. As a result, autophagy-deficient T cells transcribe and recombine immune response genes to an effector memory state. ATG16L1 plays a crucial role at various stages of autophagy.53 Mice deficient in the essential autophagy gene ATG16L1 were shown to display a dramatic impairment in the growth of syngeneic tumors. Autophagy represents a new direction in the treatment of osteosarcoma. Regulators or inhibitors of autophagy may provide a potential target for cancer treatment.26 Furthermore, ATG16L1 can prevent the activity of CD8+T cells through mediating by dendritic cells.54 Thus, the ATG16L1 gene can play an important role in the development and metastasis of osteosarcoma by mediating CD8+T cells.
Immunotherapy has become one of the most effective treatments for many tumors. Currently, there is a lack of specific immunosuppressive drugs for osteosarcoma. Immunotherapy (such as immune checkpoint inhibitor therapy) is related to T cell response. CD8+ T cells mediated by ATG16L1 may affect immune function and promote the survival of osteosarcoma.
Some limitations of our study should be acknowledged. Firstly, the bulk RNA sequencing and scRNA-seq datasets have relatively small samples; Secondly current research methods can only analyze 22 types of immune cells, but cannot determine the characteristics of uncommon immune cell populations. Third, scRNA-seq reduces the sensitivity of each cell. It may not be able to recognize subtle transcriptional differences between cells, which may affect gene expression.
Conclusion
Our results demonstrate that ATG16L1 can affect the prognosis of osteosarcoma by affecting CD8+ T cells, especially in patients with metastases. ATG16L1 is a potential prognostic biomarker and may be a novel therapeutic target for osteosarcoma.
Abbreviations
scRNA-seq, single-cell RNA-sequencing; DEGs, differentially expressed genes; LASSO, least absolute shrinkage and selection operator; qRT-PCR, quantitative reverse transcription polymerase chain reaction; ATG16L1, autophagy related 16 like 1; ATGs, autophagy-related genes; TME, the tumor microenvironment; ROC, receiver-operating characteristic; UMAP, uniform manifold approximation and projection; GSVA, gene set variation analysis; GZMB, granzyme B;, ITGA1, integrin subunit alpha.
Data Sharing Statement
The way for obtaining datasets is shown in methods.
Acknowledgment
This project was supported in part by National Natural Science Foundation of China (grant no. 81960768/82160793/81560359/ 81860393), Natural Science Foundation of Guangxi Province (grant no. 2020GXNSFAA259088), “Medical Excellence Award” Funded by the Creative Research Development Grant from the First Affiliated Hospital of Guangxi Medical University, Youth Science and Technology Project of the First Affiliated Hospital of Guangxi Medical University (grant no. 201903038).
Disclosure
The authors report no conflicts of interest in this work.
References
1. Eaton BR, Schwarz R, Vatner R, et al. Osteosarcoma. Pediatr Blood Cancer. 2021;68(Suppl 2):e28352. doi:10.1002/pbc.28352
2. Ritter J, Bielack SS. Osteosarcoma. Ann Oncol. 2010;21(Suppl 7):vii320–5. doi:10.1093/annonc/mdq276
3. Dean DC, Shen S, Hornicek FJ, Duan Z. From genomics to metabolomics: emerging metastatic biomarkers in osteosarcoma. Cancer Metastasis Rev. 2018;37(4):719–731. doi:10.1007/s10555-018-9763-8
4. Heymann D. Metastatic osteosarcoma challenged by regorafenib. Lancet Oncol. 2019;20(1):12–14. doi:10.1016/s1470-2045(18)30821-0
5. Mirabello L, Troisi RJ, Savage SA. Osteosarcoma incidence and survival rates from 1973 to 2004: data from the surveillance, epidemiology, and end results program. Cancer. 2009;115(7):1531–1543. doi:10.1002/cncr.24121
6. Niu J, Yan T, Guo W, Wang W, Zhao Z. Insight into the role of autophagy in osteosarcoma and its therapeutic implication. Front Oncol. 2019;9:1232. doi:10.3389/fonc.2019.01232
7. Ceccariglia S, Cargnoni A, Silini AR, Parolini O. Autophagy: a potential key contributor to the therapeutic action of mesenchymal stem cells. Autophagy. 2020;16(1):28–37. doi:10.1080/15548627.2019.1630223
8. Towers CG, Wodetzki D, Thorburn A. Autophagy and cancer: modulation of cell death pathways and cancer cell adaptations. J Cell Biol. 2020;219(1). doi:10.1083/jcb.201909033
9. Cascini C, Chiodoni C. The immune landscape of osteosarcoma: implications for prognosis and treatment response. Cells. 2021;10(7):1668. doi:10.3390/cells10071668
10. O’Farrill JS, Gordon N. Autophagy in osteosarcoma. Adv Exp Med Biol. 2014;804:147–160. doi:10.1007/978-3-319-04843-7_8
11. Yang Z, Klionsky DJ. Eaten alive: a history of macroautophagy. Nat Cell Biol. 2010;12(9):814–822. doi:10.1038/ncb0910-814
12. Deretic V. Autophagy in inflammation, infection, and immunometabolism. Immunity. 2021;54(3):437–453. doi:10.1016/j.immuni.2021.01.018
13. Margulies M, Egholm M, Altman WE, et al. Genome sequencing in microfabricated high-density picolitre reactors. Nature. 2005;437(7057):376–380. doi:10.1038/nature03959
14. Feng W, He M, Jiang X, et al. Single-cell RNA sequencing reveals the migration of osteoclasts in giant cell tumor of bone. Front Oncol. 2021;11:715552. doi:10.3389/fonc.2021.715552
15. Liu Y, Feng W, Dai Y, et al. Single-cell transcriptomics reveals the complexity of the tumor microenvironment of treatment-naive osteosarcoma. Front Oncol. 2021;11:709210. doi:10.3389/fonc.2021.709210
16. Zhou Y, Yang D, Yang Q, et al. Single-cell RNA landscape of intratumoral heterogeneity and immunosuppressive microenvironment in advanced osteosarcoma. Nat Commun. 2020;11(1):6322. doi:10.1038/s41467-020-20059-6
17. Brown HMG, Kuhns MM, Maxwell Z, Arriaga EA. Nonspecific binding correction for single-cell mass cytometric analysis of autophagy and myoblast differentiation. Anal Chem. 2021;93(3):1401–1408. doi:10.1021/acs.analchem.0c03211
18. Kaplan N, Wang J, Wray B, et al. Single-cell RNA transcriptome helps define the limbal/corneal epithelial stem/Early transit amplifying cells and how autophagy affects this population. Invest Ophthalmol Vis Sci. 2019;60(10):3570–3583. doi:10.1167/iovs.19-27656
19. Lefort S, Balani S, Pellacani D, et al. Single-cell analysis of autophagy activity in normal and de novo transformed human mammary cells. Sci Rep. 2020;10(1):20266. doi:10.1038/s41598-020-77347-w
20. Howie BN, Donnelly P, Marchini J. A flexible and accurate genotype imputation method for the next generation of genome-wide association studies. PLoS Genet. 2009;5(6):e1000529. doi:10.1371/journal.pgen.1000529
21. Ritchie ME, Phipson B, Wu D, et al. limma powers differential expression analyses for RNA-sequencing and microarray studies. Nucleic Acids Res. 2015;43(7):e47. doi:10.1093/nar/gkv007
22. Satija R, Farrell JA, Gennert D, Schier AF, Regev A. Spatial reconstruction of single-cell gene expression data. Nat Biotechnol. 2015;33(5):495–502. doi:10.1038/nbt.3192
23. Stuart T, Butler A, Hoffman P, et al. Comprehensive integration of single-cell data. Cell. 2019;177(7):1888–1902.e21. doi:10.1016/j.cell.2019.05.031
24. Korsunsky I, Millard N, Fan J, et al. Fast, sensitive and accurate integration of single-cell data with harmony. Nat Methods. 2019;16(12):1289–1296. doi:10.1038/s41592-019-0619-0
25. Hänzelmann S, Castelo R, Guinney J. GSVA: gene set variation analysis for microarray and RNA-seq data. BMC Bioinform. 2013;14(1):7. doi:10.1186/1471-2105-14-7
26. Seo N, Akiyoshi K, Shiku H. Exosome-mediated regulation of tumor immunology. Cancer Sci. 2018;109(10):2998–3004. doi:10.1111/cas.13735
27. Baird A, Lindsay T, Everett A, et al. Osteoblast differentiation of equine induced pluripotent stem cells. Biol Open. 2018;7(5). doi:10.1242/bio.033514
28. Sánchez-Espiridión B, Martin-Moreno AM, Montalbán C, et al. Immunohistochemical markers for tumor associated macrophages and survival in advanced classical Hodgkin’s lymphoma. Haematologica. 2012;97(7):1080–1084. doi:10.3324/haematol.2011.055459
29. Feng H, Cheng T, Steer JH, et al. Myocyte enhancer factor 2 and microphthalmia-associated transcription factor cooperate with NFATc1 to transactivate the V-ATPase d2 promoter during RANKL-induced osteoclastogenesis. J Biol Chem. 2009;284(21):14667–14676. doi:10.1074/jbc.M901670200
30. Li D, Cai L, Meng R, et al. METTL3 modulates osteoclast differentiation and function by controlling RNA stability and nuclear export. Int J Mol Sci. 2020;21(5). doi:10.3390/ijms21051660
31. Misawa A, Orimo H. lncRNA HOTAIR inhibits mineralization in osteoblastic osteosarcoma cells by epigenetically repressing ALPL. Calcif Tissue Int. 2018;103(4):422–430. doi:10.1007/s00223-018-0434-0
32. Lambrechts D, Wauters E, Boeckx B, et al. Phenotype molding of stromal cells in the lung tumor microenvironment. Nat Med. 2018;24(8):1277–1289. doi:10.1038/s41591-018-0096-5
33. Richter A, Alexdottir MS, Magnus SH, et al. EGFL7 mediates BMP9-induced sprouting angiogenesis of endothelial cells derived from human embryonic stem cells. Stem Cell Rep. 2019;12(6):1250–1259. doi:10.1016/j.stemcr.2019.04.022
34. Peng J, Sun BF, Chen CY, et al. Single-cell RNA-seq highlights intra-tumoral heterogeneity and malignant progression in pancreatic ductal adenocarcinoma. Cell Res. 2019;29(9):725–738. doi:10.1038/s41422-019-0195-y
35. Zhang S, Liu Z, Wu D, Chen L, Xie L. Single-cell RNA-seq analysis reveals microenvironmental infiltration of plasma cells and hepatocytic prognostic markers in HCC With cirrhosis. Front Oncol. 2020;10:596318. doi:10.3389/fonc.2020.596318
36. Wang M, Windgassen D, Papoutsakis ET. Comparative analysis of transcriptional profiling of CD3+, CD4+ and CD8+ T cells identifies novel immune response players in T-cell activation. BMC Genomics. 2008;9(1):225. doi:10.1186/1471-2164-9-225
37. Nakajima K, Raz A. T-cell infiltration profile in musculoskeletal tumors. J Orthop Res. 2021;39(3):536–542. doi:10.1002/jor.24890
38. Yu Y, Chen Z, Wang Y, et al. Infliximab modifies regulatory T cells and co-inhibitory receptor expression on circulating T cells in psoriasis. Int Immunopharmacol. 2021;96:107722. doi:10.1016/j.intimp.2021.107722
39. Wang Z, Chen S, Wang G, Li S, Qin X. CDCA3 is a novel prognostic biomarker associated with immune infiltration in hepatocellular carcinoma. Biomed Res Int. 2021;2021:6622437. doi:10.1155/2021/6622437
40. Bielack SS, Kempf-Bielack B, Delling G, et al. Prognostic factors in high-grade osteosarcoma of the extremities or trunk: an analysis of 1702 patients treated on neoadjuvant cooperative osteosarcoma study group protocols. J Clin Cancer. 2002;20(3):776–790. doi:10.1200/jco.2002.20.3.776
41. Chen X, Zhang Y. BMP-2 and miR-29c in osteosarcoma tissues on proliferation and invasion of osteosarcoma cells. Oncol Lett. 2019;17(6):5389–5394. doi:10.3892/ol.2019.10229
42. Yang C, Tian Y, Zhao F, et al. Bone microenvironment and osteosarcoma metastasis. Int J Mol Sci. 2020;21(19). doi:10.3390/ijms21196985
43. Zheng GX, Terry JM, Belgrader P, et al. Massively parallel digital transcriptional profiling of single cells. Nat Commun. 2017;8(1):14049. doi:10.1038/ncomms14049
44. Papalexi E, Satija R. Single-cell RNA sequencing to explore immune cell heterogeneity. Nat Rev Immunol. 2018;18(1):35–45. doi:10.1038/nri.2017.76
45. Gonzalez-Silva L, Quevedo L, Varela I. Tumor functional heterogeneity unraveled by scRNA-seq technologies. Trends Cancer. 2020;6(1):13–19. doi:10.1016/j.trecan.2019.11.010
46. Oboshi W, Watanabe T, Hayashi K, Nakamura T, Yukimasa N. QPY/RAH haplotypes of the GZMB gene are associated with natural killer cell cytotoxicity. Immunogenetics. 2018;70(1):29–36. doi:10.1007/s00251-017-1014-6
47. Arias M, Martínez-Lostao L, Santiago L, Ferrandez A, Granville DJ, Pardo J. The untold story of granzymes in oncoimmunology: novel opportunities with old acquaintances. Trends Cancer. 2017;3(6):407–422. doi:10.1016/j.trecan.2017.04.001
48. Manoharan M, Mandloi N, Priyadarshini S, et al. A computational approach identifies immunogenic features of prognosis in human cancers. Front Immunol. 2018;9:3017. doi:10.3389/fimmu.2018.03017
49. Gharibi A, La Kim S, Molnar J, et al. ITGA1 is a pre-malignant biomarker that promotes therapy resistance and metastatic potential in pancreatic cancer. Sci Rep. 2017;7(1):10060. doi:10.1038/s41598-017-09946-z
50. Yim DH, Zhang YW, Eom SY, et al. ITGA1 polymorphisms and haplotypes are associated with gastric cancer risk in a Korean population. World J Gastroenterol. 2013;19(35):5870–5876. doi:10.3748/wjg.v19.i35.5870
51. Li H, Wang Y, Rong SK, et al. Integrin alpha1 promotes tumorigenicity and progressive capacity of colorectal cancer. Int J Biol Sci. 2020;16(5):815–826. doi:10.7150/ijbs.37275
52. Liu L, Liu H, Luo S, et al. Novel genetic variants of SYK and ITGA1 related lymphangiogenesis signaling pathway predict non-small cell lung cancer survival. Am J Cancer Res. 2020;10(8):2603–2616.
53. Gammoh N. The multifaceted functions of ATG16L1 in autophagy and related processes. J Cell Sci. 2020;133(20). doi:10.1242/jcs.249227
54. Hubbard-Lucey VM, Shono Y, Maurer K, et al. Autophagy gene Atg16L1 prevents lethal T cell alloreactivity mediated by dendritic cells. Immunity. 2014;41(4):579–591. doi:10.1016/j.immuni.2014.09.011
 © 2022 The Author(s). This work is published and licensed by Dove Medical Press Limited. The full terms of this license are available at https://www.dovepress.com/terms.php and incorporate the Creative Commons Attribution - Non Commercial (unported, v3.0) License.
By accessing the work you hereby accept the Terms. Non-commercial uses of the work are permitted without any further permission from Dove Medical Press Limited, provided the work is properly attributed. For permission for commercial use of this work, please see paragraphs 4.2 and 5 of our Terms.
© 2022 The Author(s). This work is published and licensed by Dove Medical Press Limited. The full terms of this license are available at https://www.dovepress.com/terms.php and incorporate the Creative Commons Attribution - Non Commercial (unported, v3.0) License.
By accessing the work you hereby accept the Terms. Non-commercial uses of the work are permitted without any further permission from Dove Medical Press Limited, provided the work is properly attributed. For permission for commercial use of this work, please see paragraphs 4.2 and 5 of our Terms.