")
Back to Journals » Diabetes, Metabolic Syndrome and Obesity » Volume 14
Associations of Serum Uric Acid with Clustering of Cardiovascular Risk Factors and a 10-Year Atherosclerotic Cardiovascular Disease Risk Score in Jiangsu Adults, China
Authors Tian T , Wang Y, Xie W, Zhang J, Zhu Q, Peng X, Zhou Y, Dai Y
Received 8 June 2021
Accepted for publication 14 July 2021
Published 28 July 2021 Volume 2021:14 Pages 3447—3460
DOI https://doi.org/10.2147/DMSO.S323917
Checked for plagiarism Yes
Review by Single anonymous peer review
Peer reviewer comments 3
Editor who approved publication: Professor Ming-Hui Zou
Ting Tian,1,* Yuanyuan Wang,1,2,* Wei Xie,1 Jingxian Zhang,1 Qianrang Zhu,1 Xianzhen Peng,3 Yonglin Zhou,1 Yue Dai1
1Institute of Food Safety and Assessment, Jiangsu Provincial Center for Disease Control and Prevention, Nanjing, 210009, People’s Republic of China; 2Department of Nutrition and Food Hygiene, School of Public Health, Southeast University, Nanjing, 210009, People’s Republic of China; 3Department of Public Health and Preventive Medicine, Kangda College of Nanjing Medical University, Lianyungang, Jiangsu, 222000, People’s Republic of China
*These authors contributed equally to this work
Correspondence: Yonglin Zhou; Yue Dai Email [email protected]; [email protected]
Purpose: The relationship between serum uric acid (SUA) and Chinese characteristic 10-year atherosclerotic cardiovascular disease (ASCVD) risk score has not been well evaluated in Chinese populations. Aims of this cross-sectional study were to describe the correlation between SUA level and clustering of prevalent cardiovascular risk factors (CRFs) including overweight, central obesity, hypertension, diabetes and dyslipidemia, as well as the Chinese 10-year ASCVD risk score in adults from Jiangsu Province located in Eastern China.
Patients and Methods: A total of 7700 adults from 12 cities in Jiangsu Province were selected through multi-stage stratified cluster random sampling method in 2015. Face-to-face interviews, physical examinations and laboratory examinations were carried out to collect the information of the participants. Multivariate logistic analysis was used to analyze the relationship between SUA quartiles and various CVD risk factors. The nonlinear analysis was conducted to evaluate the relationship between SUA levels and the China-PAR 10-year ASCVD risk scores.
Results: The prevalence of hyperuricemia was 13.3% in all of the participants. By adjusting potential confounders, significant correlations were found between the SUA level and the overweight, central obesity, hypertension and dyslipidemia in both males and females. The clustering of CRFs was different across SUA quantiles (χ2=607.685, P< 0.001). After Gamma trend test (P < 0.001) and ordered logistic regression analysis, it was found out that with the increase of SUA quantiles, prevalent CRFs gradually gathered in both males and females. Furthermore, sex-specific difference was identified between SUA and 10-year ASCVD risk scores.
Conclusion: The accumulation of CRFs increased with elevated SUA levels, whereas it was different between genders in the relationship between SUA and 10-year ASCVD risk scores. Tailored strategies should be taken when it came to males and females in managing SUA.
Keywords: serum uric acid, cardiovascular risk factors, clustering, China-PAR risk score
Introduction
Uric acid is an end product of purine metabolism in human liver, muscle and intestinal tissues, mostly excreted through the urinary tract.1 Uric acid has a vital physiological function due to its antioxidant ability and as potent mediator of type 2 immune response.2 However, the increase of uric acid in the blood often leads to potential pathogenic consequences. It is generally recognized that hyperuricemia can cause gout.3 In addition, more results from various researches showed that there existed positive associations between hyperuricemia and hypertension, diabetes, metabolic syndrome and cardiovascular diseases.4–11 Serum uric acid (SUA) was positively associated with carotid arterial stiffness and intima-media thickening, suggesting it was the independent risk factor of early atherosclerosis.12 With varieties of different comorbidities caused by hyperuricemia, the mortality of the entire population will even rise.13,14 Besides, it has been reported that the prevalence of hyperuricemia is increasing globally and becoming a health-threatening problem. According to the America National Health and Nutrition Examination Surveys (NHANES), the prevalence of hyperuricemia increased from 19.0% in 1988–1994 to 21.5% in 2007–2008, and remained stable in the nearest decade.15 In China, the prevalence of hyperuricemia was 8.4% among Chinese adults in 2009–201016 and rose to 17.4% in 2019.17
Cardiovascular risk factors (CRFs) include age, sex, obesity (both overweight in BMI and central obesity in waist circumference), hypertension, diabetes, dyslipidemia, family history of CVDs, smoking, etc.18,19 Cardiovascular diseases (CVDs) are the leading cause of death around the world, accounting for about one-third of all deaths in 2015.20 Relations between SUA and CRFs have been extensively studied. Uric acid is positively correlated with BMI,21 waist circumference (WC),22 hypertension,23 type 2 diabetes24 and dyslipidemia.25 However, the final outcomes of CVDs are not attributable to a single CRF, but the clustering of multitudinous CRFs.
Some studies have also explored the relationship between SUA and clustering of CRFs in Chinese populations.26,27 But the relationship was not well elucidated as regards the Jiangsu Population. Moreover, the relationship between SUA and atherosclerotic cardiovascular disease (ASCVD) scores has not been well evaluated with a localized method. The 10-year ASCVD risk based on the China-PAR Project is a suitable and reliable tool to predict ASCVD in Chinese populations.28 Thus, this study aimed to analyze the relationship between SUA, clustering of CRFs and 10-year ASCVD risk score in a representative eastern Chinese population.
Methods
Study Participants
This cross-sectional study derived from the Chinese Chronic Disease and Nutrition Examination Survey which was conducted in Jiangsu, China in 2015. This is a multistage, stratified and cluster random sampling study. Chinese residents who lived in the monitoring area for 6 months or more in the year before the survey were sampled. Those individuals with cancer, hepatic disease, or autoimmune diseases or women who were pregnant or breastfeeding during the survey were excluded. For the first stage of sampling, the systematic sample method was adopted in each survey site. Twelve survey sites were randomly selected across the province: the Qinhuai District of Nanjing, Chong’an District of Wuxi, Yunlong District of Xuzhou, Wuzhong District and Zhangjiagang County of Suzhou, Rugao County of Nantong, Donghai County of Lianyungang, Jinhu County of Huai’an, Xiangshui County of Yancheng, Hanjiang District of Yangzhou, Jingkou District of Zhenjiang and Jiangyan District of Taizhou. To ensure the representativeness of the sample, two survey sites were selected in Suzhou, a city with the largest population in the province. Correspondingly, no investigation was conducted in Suqian city in the north. At the second stage, three towns/subdistricts at each survey site were randomly picked. Two communities or villages of towns/subdistricts were selected in the third stage. The fourth stage saw 45 households randomly picked among the selected communities or villages.
A total of 7992 individuals among 8100 eligible individuals participated in Jiangsu Provincial Survey of Chinese Chronic Disease and Nutrition Examination in 2015, with a 98.7% response rate. Due to missing of key data, such as demographic information, lab examination information, or anthropometric information, 292 subjects were excluded from this study. Finally, 7700 adult individuals were factored into the analysis. STROBE Statement– Checklist of items that should be included in reports of cross-sectional studies was attached as a Supplementary Material.
Ethics Approval and Consent to Participate
This study was conducted in accordance with the Declaration of Helsinki and approved by the National Health Commission of China, and the corresponding ethical approval code was [2014] NO.814. All the participants had agreed to attend this survey and signed the informed consent.
Measurements
Survey
Face-to-face interviews were conducted by uniformly trained investigators with the structured questionnaires. The information of age, gender, education levels, smoking and drinking condition, hypertension, diabetes, dyslipidemia and family history of cardiovascular related diseases were collected in the survey. Medical diagnosis results of all the participants could be referred to for a grasp of their disease conditions.
Anthropometric Measurement
After the interview, the investigator measured the height, weight, WC, blood pressure (BP) of the participants. These measurements strictly followed the standard protocol. Height and weight were measured without coat and shoes. WC was measured in the fasting states by soft ruler and the measure location was at the middle point between the bottom of the rib cage and the uppermost border of the iliac crests at the end of exhalation. The standard mercury sphygmomanometer (Product name: Yu Yue, measurement range 0–300 mmHg) was used to take BP of participants after 5 minutes’ quiet sitting. The mean of three measures of BP was recorded for analysis.
Laboratory Examination
8 mL of morning fasting blood glucose was taken from every participant for blood biochemical examinations. Triglyceride (TG), total cholesterol (TC), low-density lipoprotein cholesterol (LDL-C) and high-density lipoprotein cholesterol (HDL-C) were measured using enzyme colorimetry (Roche Cobas C701 automatic biochemical analyzer series). Fasting blood sugar (FBS) was measured using Glucokinase method (Roche P800 automatic biochemical analyzer). Glycated hemoglobin (HbA1c) was measured using high pressure liquid chromatography (TOSOH G8, Automatic hemoglobin A1c analyzer). Uric acid was measured using colorimetry (Roche C702 automatic biochemical analyzer).
Diagnostic Criteria and Definitions
Hypertension was defined as participants’ systolic BP ≥140mmHg or diastolic BP ≥90 mmHg in the study period, or those had the history of hypertension and were receiving antihypertensive treatment.29
Diabetes was defined as participants’ fasting blood-glucose ≥ 7.0 mmol/L, or those who were diagnosed diabetes previously and on hypoglycemic treatment.30
Dyslipidemia: According to the Chinese Guidelines for the Prevention and Treatment of Dyslipidemia in Adults (2016 revision), participants with TC≥5.2 mmol/L, or TG≥1.7 mmol/L, or HDL-C<1.0 mmol/L, or LDL-C≥3.4 mmol/L, or those who were diagnosed with dyslipidemia and receiving treatment, were defined as having dyslipidemia.31
Overweight: BMI≥24 Kg/m2.32
Central obesity: Male’s WC≥85cm and female’s WC≥80cm.32
Hyperuricemia: SUA ≥ 420μmol/L in male or SUA ≥360μmol/L in female or diagnosed hyperuricemia before.33
Smoking and drinking were defined as habits existing at the interviewing time.
Assessment of 10-Year ASCVD Risk Based on China-PAR Project
We assessed the ASCVD risk of each participant by the 10-year China-PAR risk scores.28 The 10-year ASCVD risk prediction equation derived from the China-PAR project using data from four Chinese cohorts with large sample size and sound design and was validated. The sex-specific equations used age, treated or untreated systolic BP (SBP), TC, HDL-C, current smoking (yes/ no) and diabetes mellitus (yes/no) as parameters. Besides the major risk factors (age, treated or untreated SBP, TC, HDL-C, current smoking, and diabetes mellitus), four additional variables, namely, WC, geographic region, urbanization, and family history of ASCVD, were added to the equation for men, and two additional variables, WC and geographic region, were added to the equation for women. This score for Chinese 10-year ASCVD risk have been proved to be consistent and validated in predicting ASCVD among Chinese.28
Statistical Analysis
All the statistical analysis was performed on the R software (Version 3.6.3). Continuous data were provided in the forms of mean±standard deviation. SUA was divided into sex-specific quartiles. Quantile 1 (Q1) was <294.1 mmol/L, Q2 (294.1–342.5) mmol/L, Q3 (342.5–394.7) mmol/L, Q4 ≥394.7 mmol/L in male. Quantile 1 (Q1) was <227.2 mmol/L, Q2 (227.2–266.5) mmol/L, Q3 (266.5–312.7) mmol/L, Q4 ≥312.7 mmol/L in female. The geographic distribution of hyperuricemia prevalence in Jiangsu Province was presented by the ArcGIS (Version 10.3). Cardiovascular related indicator values among different SUA quantiles were compared with variance analysis and trend test was also performed. Multivariate logistic analysis was used to analyze the relationship between SUA quartiles and various CVD risk factors. Adjusted ORs were presented after adjusting by age, gender, education levels, drinking and smoking. Ordinal logistic regression method was used to analyze the associations between SUA levels and the clustering of CRFs by taking the number of CRFs as dependent variables. The nonlinear analysis was conducted to evaluate the relationship of SUA levels with the China-PAR 10-year ASCVD risk scores. In both males and females, we used three models to explore the possible associations between the two variables. Model 1 was linear relationship; Model 2 was quadratic relationship and Model 3 was cubic relationship. Three models were compared by analysis of variance (anova). All statistical hypothesis tests were two-sided and P value <0.05 was considered statistically significant.
Results
Characteristics of Participants
This study included 7700 participants. Among them, 3537 (45.9%) were male and 4163 (54.1%) were female. Age, education levels, BMI categories, current smoking and drinking habits were significantly different among SUA quartiles in all participants, seen in Table S1. Table 1 shows that, among males, age, education levels, BMI categories, current smoking, drinking habits were significantly different among SUA quartiles; among female participants, age, education levels, BMI categories were significantly different. Table S2 displayed the mean values of different cardiovascular risk factors by quartiles of SUA in all participants. The height, weight, WC, BMI, SBP, diastolic blood pressure (DBP), fasting blood sugar (FBS), TG, TC, HDL and LDL of all participants featured significant differences among quartiles (All P<0.001). Participants with increased SUA had significantly higher levels of height, weight, WC, BMI, SBP, DBP, FBS, TG, TC and LDL (All P for trend<0.001). On the contrary, HDL level decreased with SUA quantiles ranging from 1.39 mmol/L to 1.29 mmol/L. In the sex stratification, the mean values of different cardiovascular risk factors in males and females are almost in the same condition as in all the participants, displayed in Table 1. It was worth noting that FBS in males was not significantly different among various SUA quartiles (P=0.093) and the rising trend vanished with SUA quantiles.
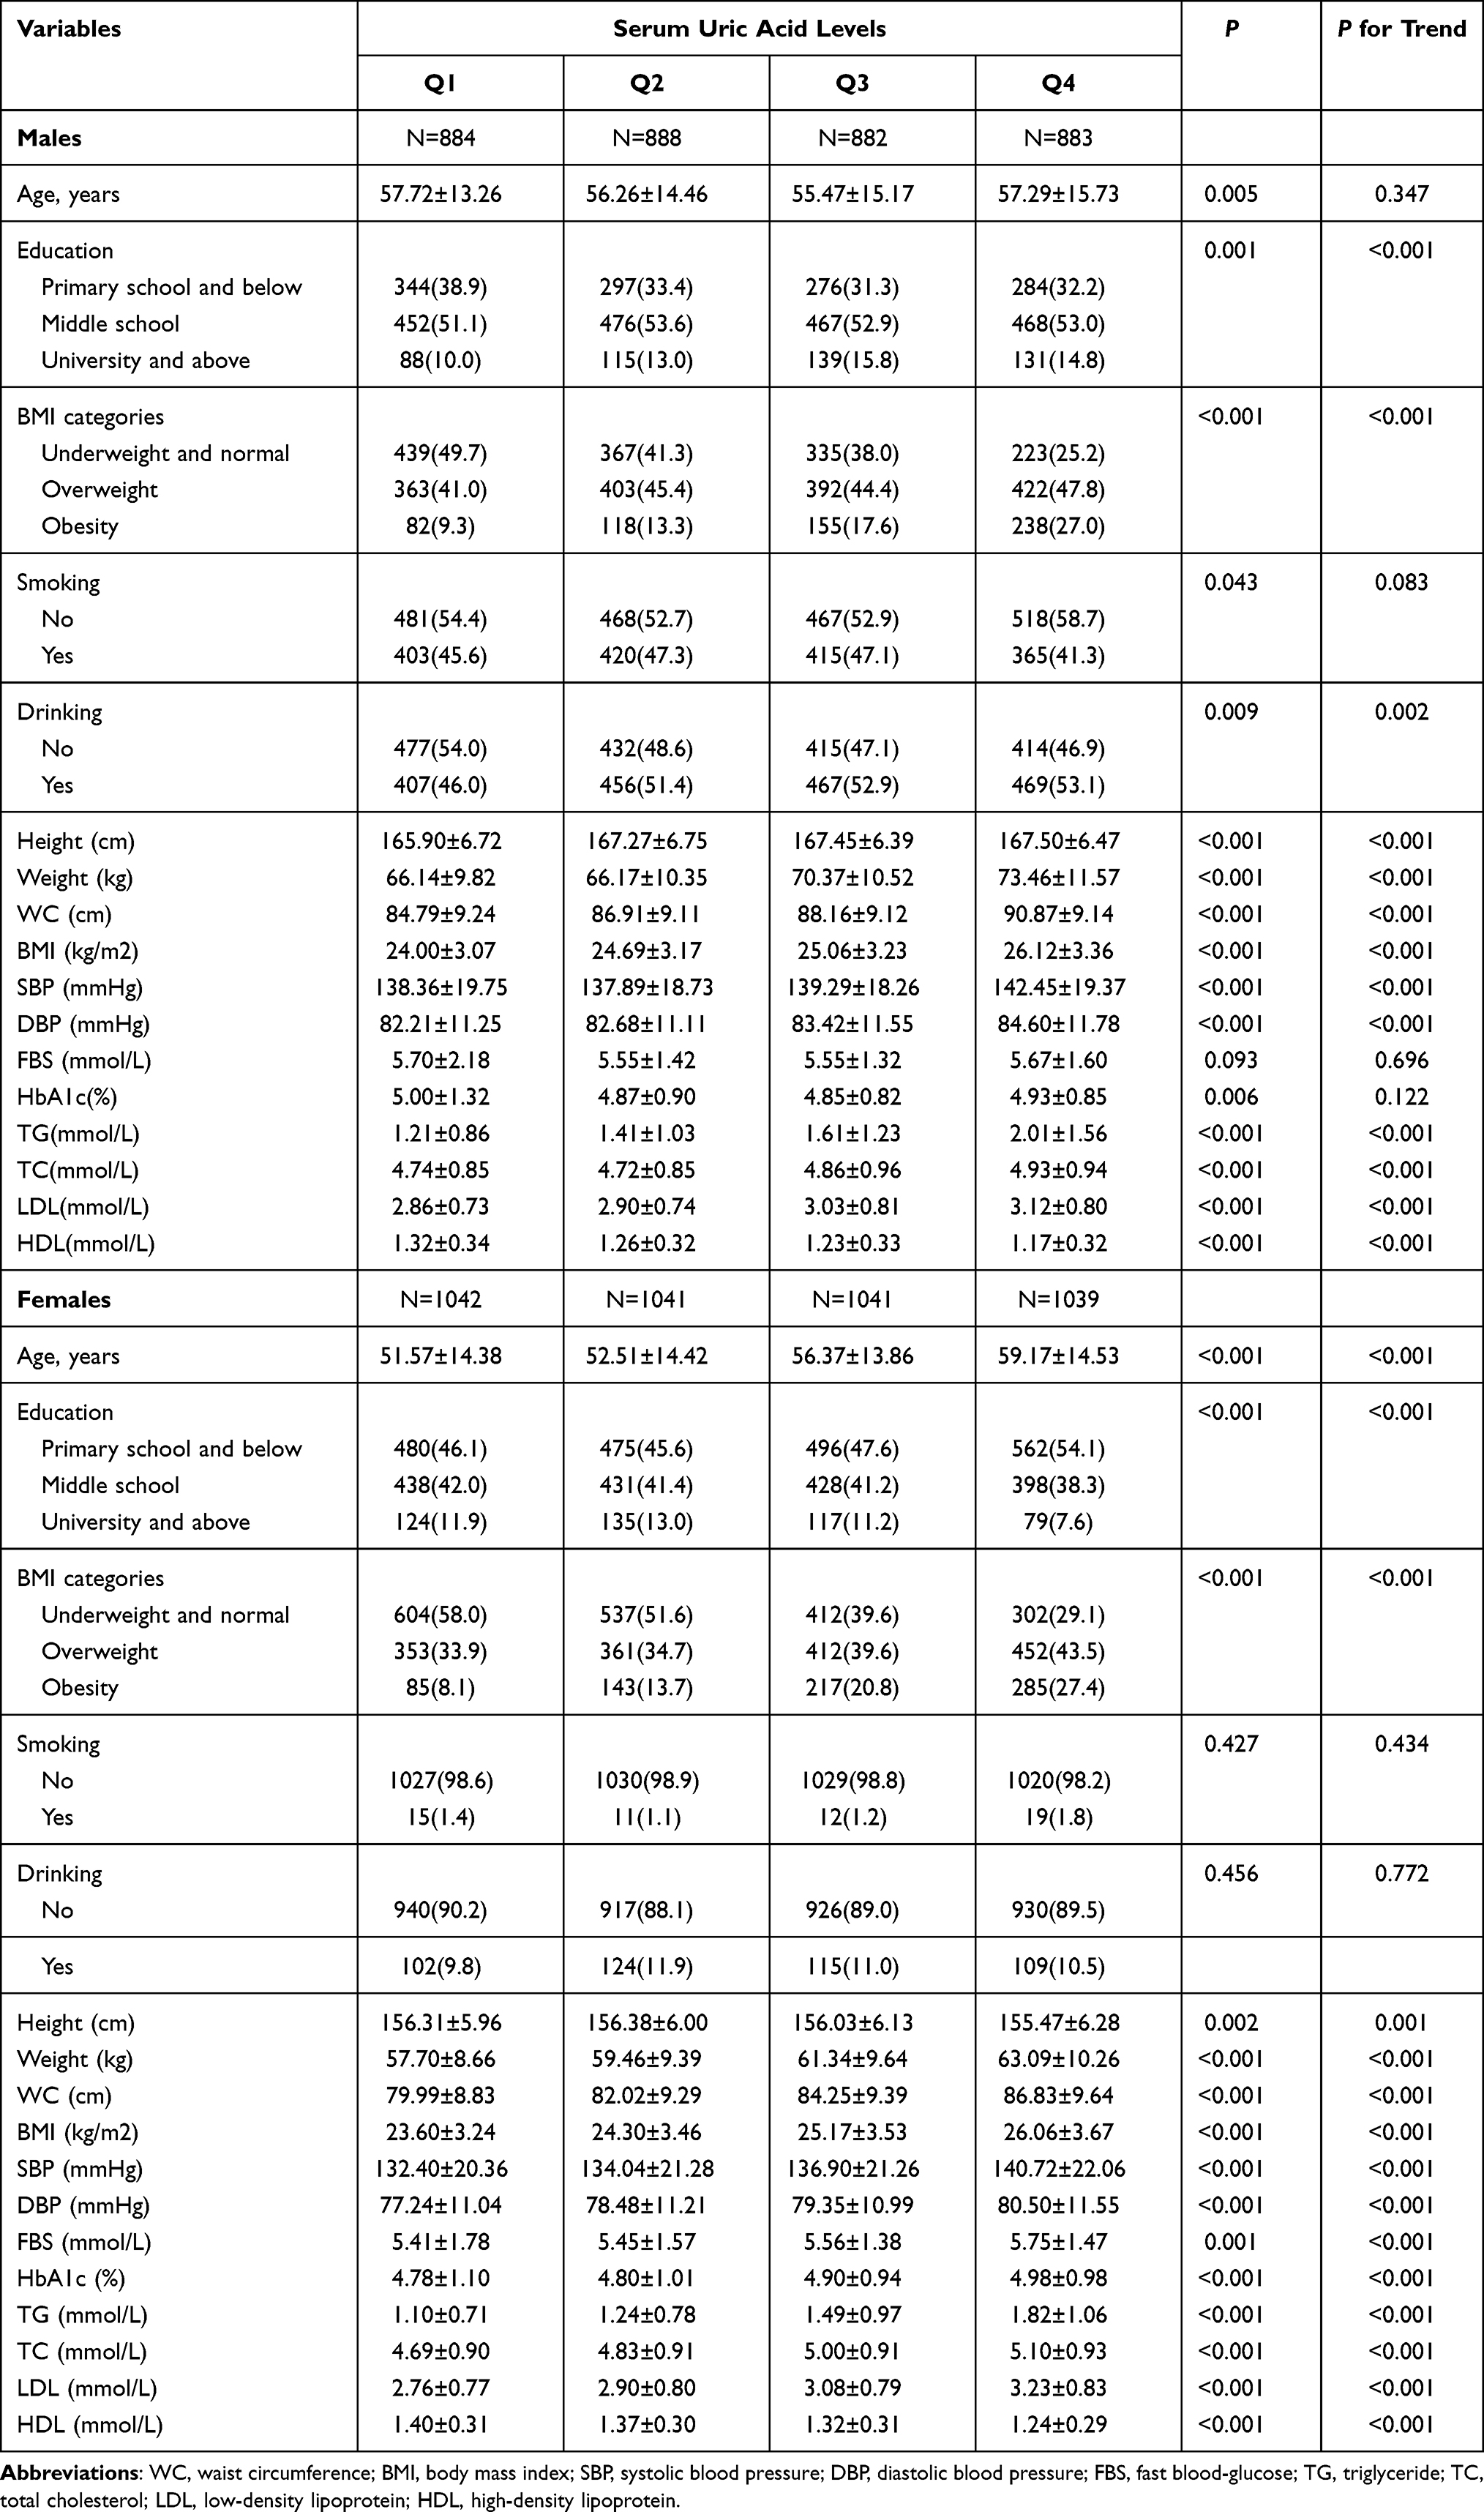 |
Table 1 Basic Information of Male and Female Participants |
Prevalence of Hyperuricemia in Each Survey Site Across Jiangsu Province
The prevalence of hyperuricemia was 13.3% in all the participants, and 16.9% and 10.3% among male and female participants respectively, while the prevalence was significantly high among males. The prevalence among participants aged over 60 years old was higher than among those who were under 60 years old (17.5% vs 10.3%). As shown in Figure 1, the prevalence of hyperuricemia in Jiangsu Province was ranging from 6.3% to 18.7%. The highest prevalence was 18.7% in Nanjing, and the lowest prevalence was 6.3% in Xuzhou.
 |
Figure 1 Prevalence of hyperuricemia in different cities of Jiangsu Province (Nanjing, 18.7%; Wuxi, 18.1%; Suzhou, 16.9%; Yangzhou, 15.6%; Huaian, 14.3%; Changzhou, 13.3%; Nantong, 12.8%; Zhenjiang, 12.4%; Taizhou, 11.4%; Yancheng, 9.4%; Lianyungang, 6.7%; Xuzhou, 6.3%; Suqian, no data). |
Association Between SUA Quartiles and Various CRFs
Our study found out that a pronounced relationship existed between SUA quartiles and different CRFs, such as overweight, central obesity, hypertension, dyslipidemia and its components in the entire population in Table S3 (all adjusted OR>1). With the increase of SUA levels, the risk of CRFs also increased significantly (all P for trend <0.001). Compared with Q1 level, the adjusted ORs of participants in Q4 level were 3.43 (95% Confidence Interval [CI]: 2.95–3.98) of overweight, 3.83 (95% CI: 3.28–4.47) of central obesity, 1.82 (95% CI: 1.57–2.12) of hypertension and 3.63 (95% CI: 3.11–4.24) of dyslipidemia. As to diabetes, the connections to SUA would disappear after the adjustment of related covariates (P=0.689).
Furthermore, we conducted stratification analysis by sex in Table 2. In the male population, SUA levels were associated with overweight, central obesity, hypertension, dyslipidemia in a dose-dependent way. With reference to the Q1 level, Q2, Q3 and Q4 level were in lower danger to be prevalent of diabetes, the adjusted ORs were 0.69 (95% CI: 0.52–0.92), 0.71 (95% CI: 0.52–0.93) and 0.72 (95% CI: 0.55–0.96), respectively. In the female population, multivariate adjusted ORs (95% CI) of prevalent overweight, central obesity, hypertension and dyslipidemia increased with SUA quartiles (all adjusted OR>1). Compared with Q1 level, Q4 had higher risk to be prevalent of diabetes, the adjusted OR 1.41 (95%: 1.06–1.87).
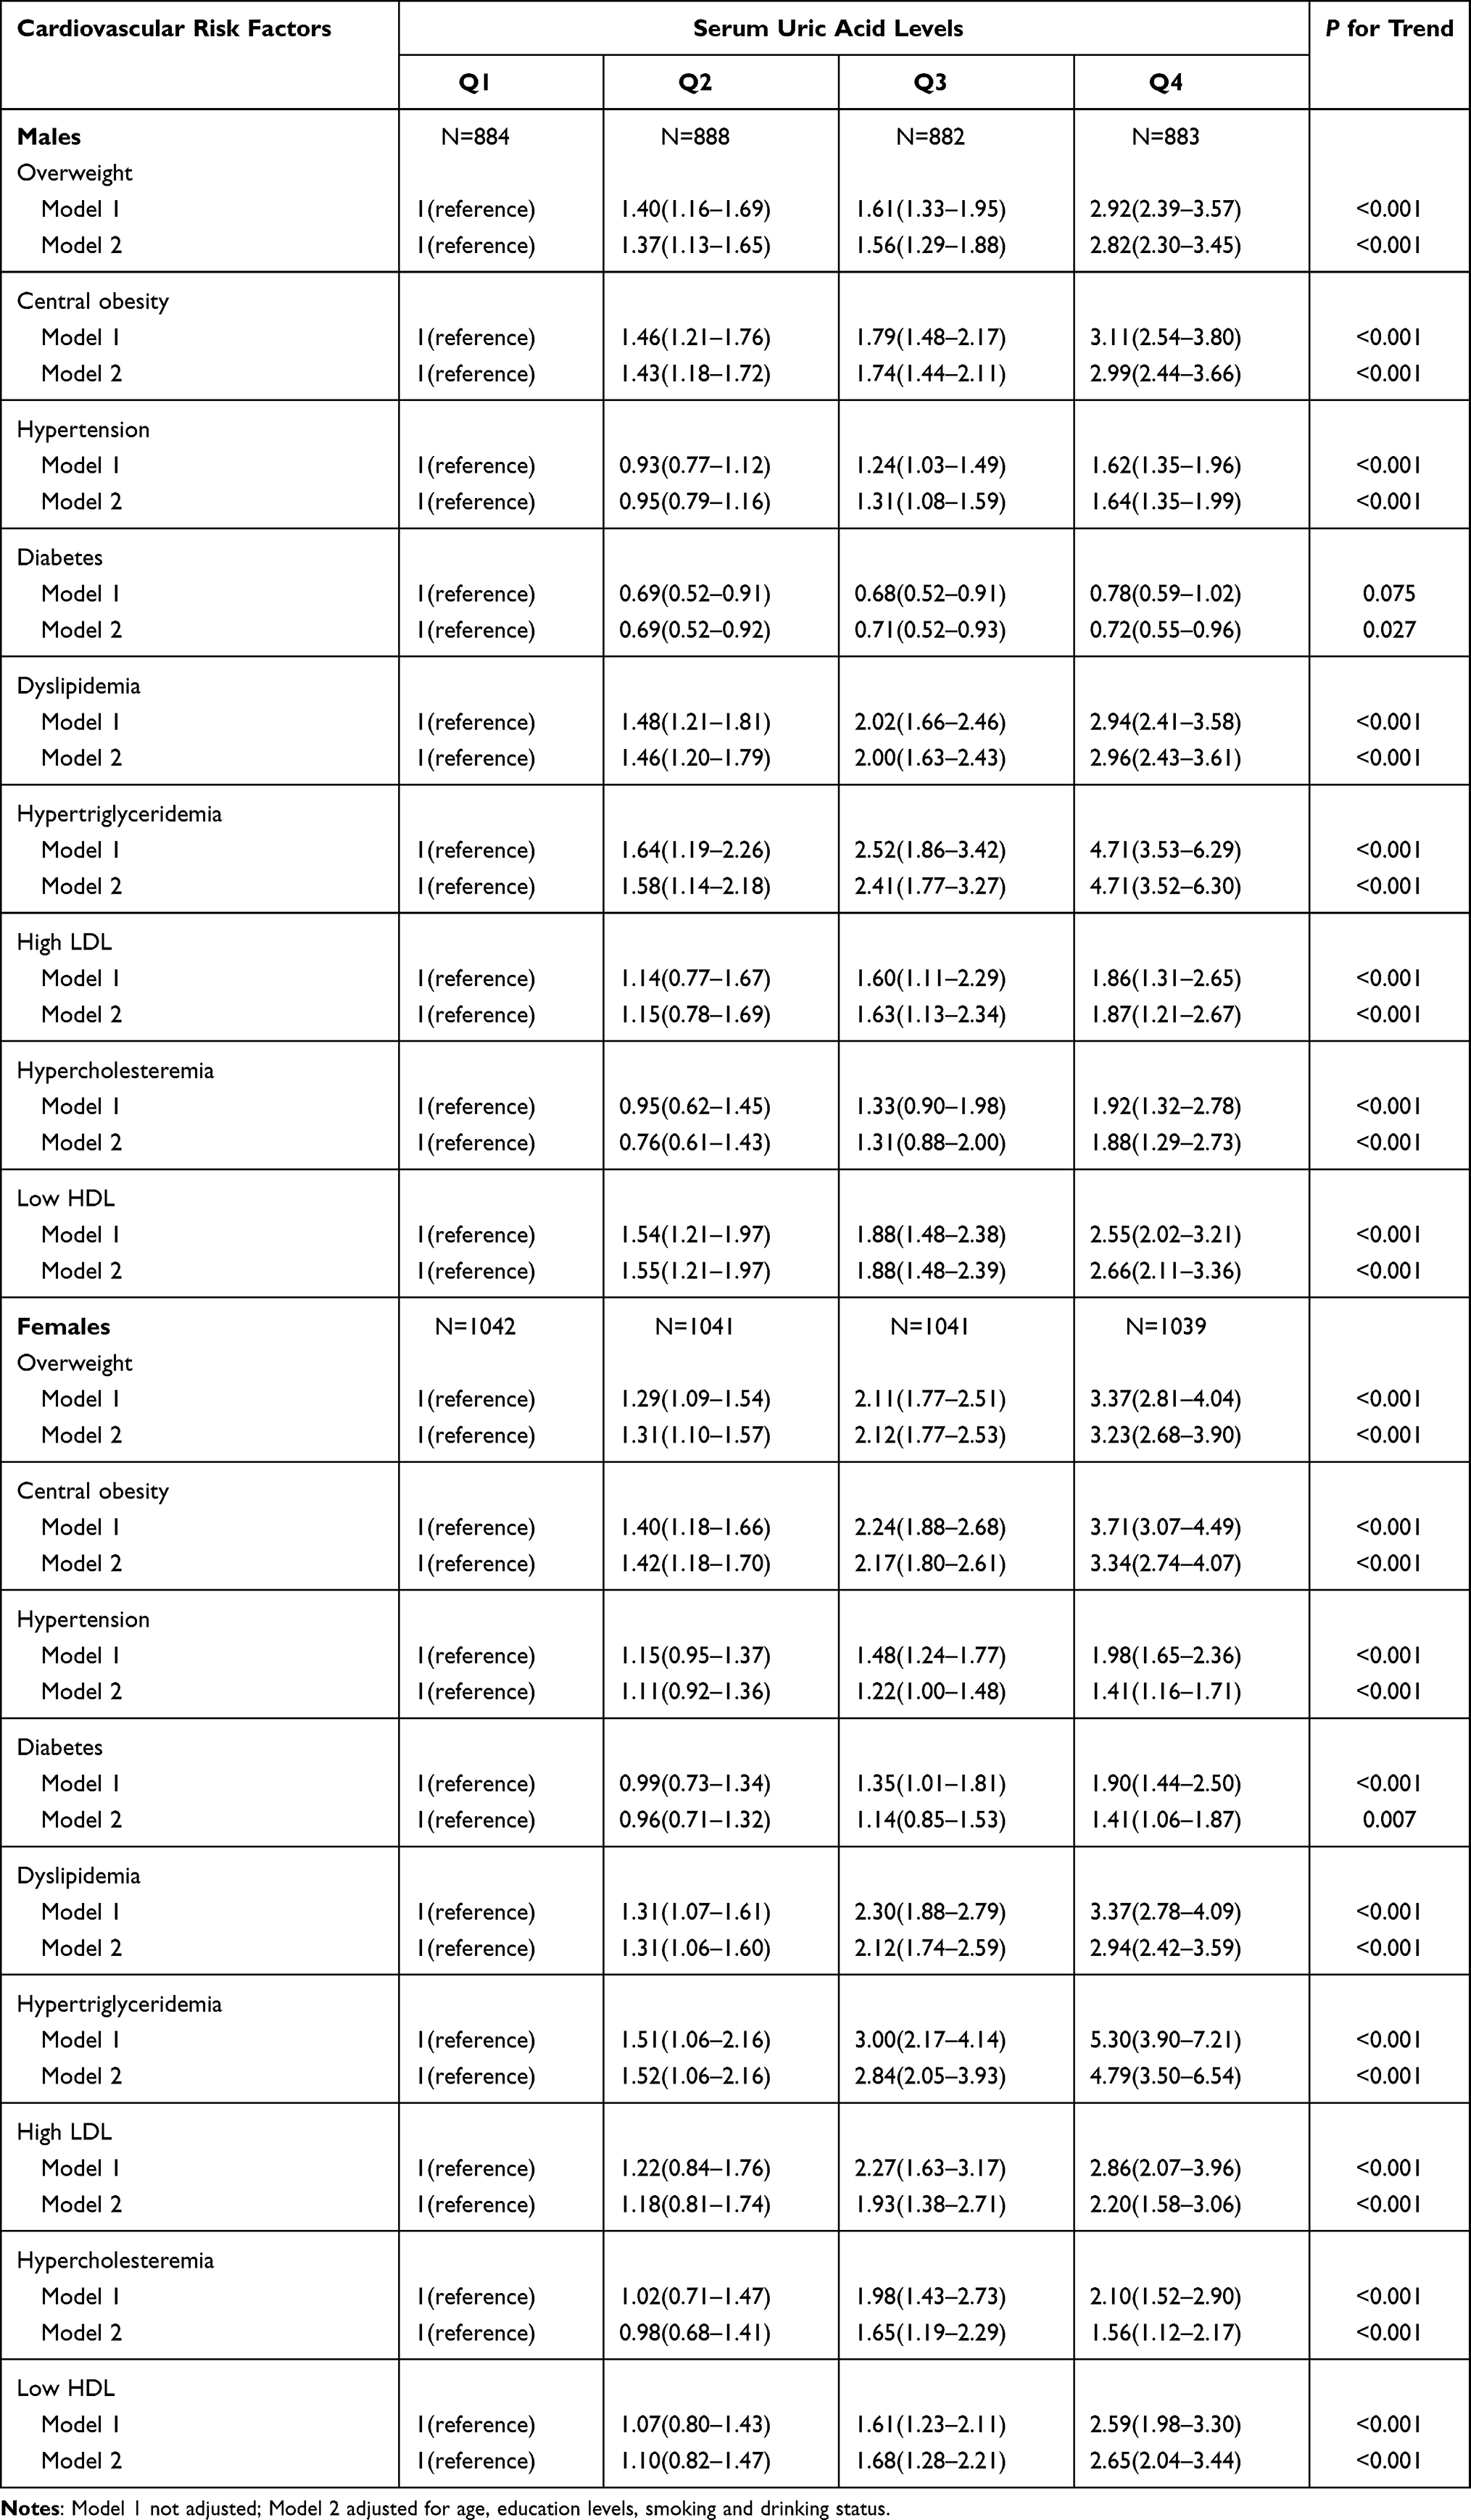 |
Table 2 Association of Cardiovascular Risk Factors and Serum Uric Acid in Logistic Regression Analysis in Males and Females |
Clustering of CRFs at Different Levels of SUA
Percentage of participants without any CRFs was only 17.1% in this study. Participants with one, two, three, four and five CRFs took up a share of 18.1%, 22.3%, 24.8%, 14.4% and 3.3% respectively. As was shown in Figure S1, the clustering of CRFs was different between SUA quartiles (χ2=606.666, P<0.001). With the increase of SUA level, the number of CRFs gradually increased in all the participants (Gamma coefficient=0.281, P for trend<0.001). The trend of CRFs gradually gathering with SUA quantile still existed in both male and female population, as shown in Figure 2 (Gamma coefficient=0.238 in male, 0.310 in female; both P for trend in male and female<0.001).
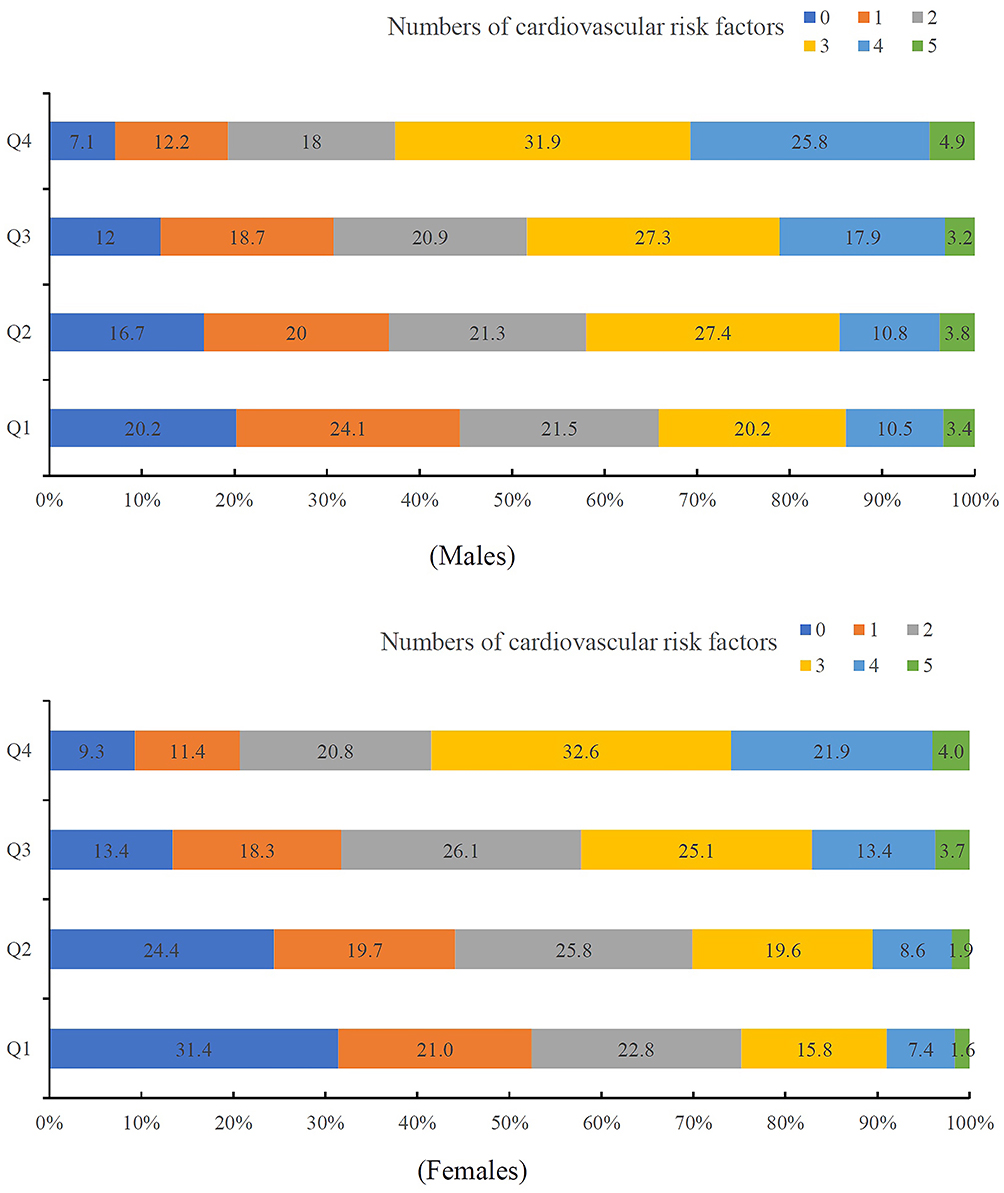 |
Figure 2 Clustering of cardiovascular risk factors at different levels of uric acid in male and female participants. |
In the ordinal logistic analysis, we took the CRFs numbers as dependent variable and the SUA quartiles as independent variable. After taking into account the ages, educational levels, smoking and drinking habits, the results indicated that compared with the Q1 group, risk of being clustered in CRFs significantly rose in the Q2 group (adjusted OR=1.37, 95% CI: 1.22–1.53), Q3 group (adjusted OR=2.10, 95% CI: 1.88–2.36) and Q4 group (adjusted OR=3.47, 95% CI: 3.09–3.90). Furthermore, we performed the sex stratification analyses and SUA levels were associated with clustering of CRFs both in male and female populations. With the increasing of SUA levels, the trend of clustering of CRFs would rise, seen from Table S4.
Association of SUA with 10-Year China-PAR ASCVD Risk Scores
The average ASCVD risk scores were 8.4% in males and 4.0% in females. Male populations had significant higher ASCVD risk scores than female populations (P<0.001). Furthermore, we conducted the curve fitting for the relationship between SUA and 10-year China-PAR ASCVD risk scores. These results in each group of men and women are presented in Table 3. In male populations, three models were compared, and the most suitable model was Model 2. In the case of men, the second equation cubic fraction was fitted as follows: (5.680×10⁻⁵)×SUA2-(3.381×10⁻²)×SUA (root mean square error [RMSE]=6.616). An approximate U-shaped association between SUA with 10-year China-PAR ASCVD risk scores in males is displayed in Figure 3. The inflection point was 341.6 μmol/L. In the case of females, three models were also compared, and the most suitable model was Model 2. The quadratic relationship was fitted as the following equation: (2.231×10⁻⁵)×SUA2 (RMSE=4.039). An approximate J-shaped association between SUA with 10-year China-PAR ASCVD risk scores was found in the female populations in Figure 3.
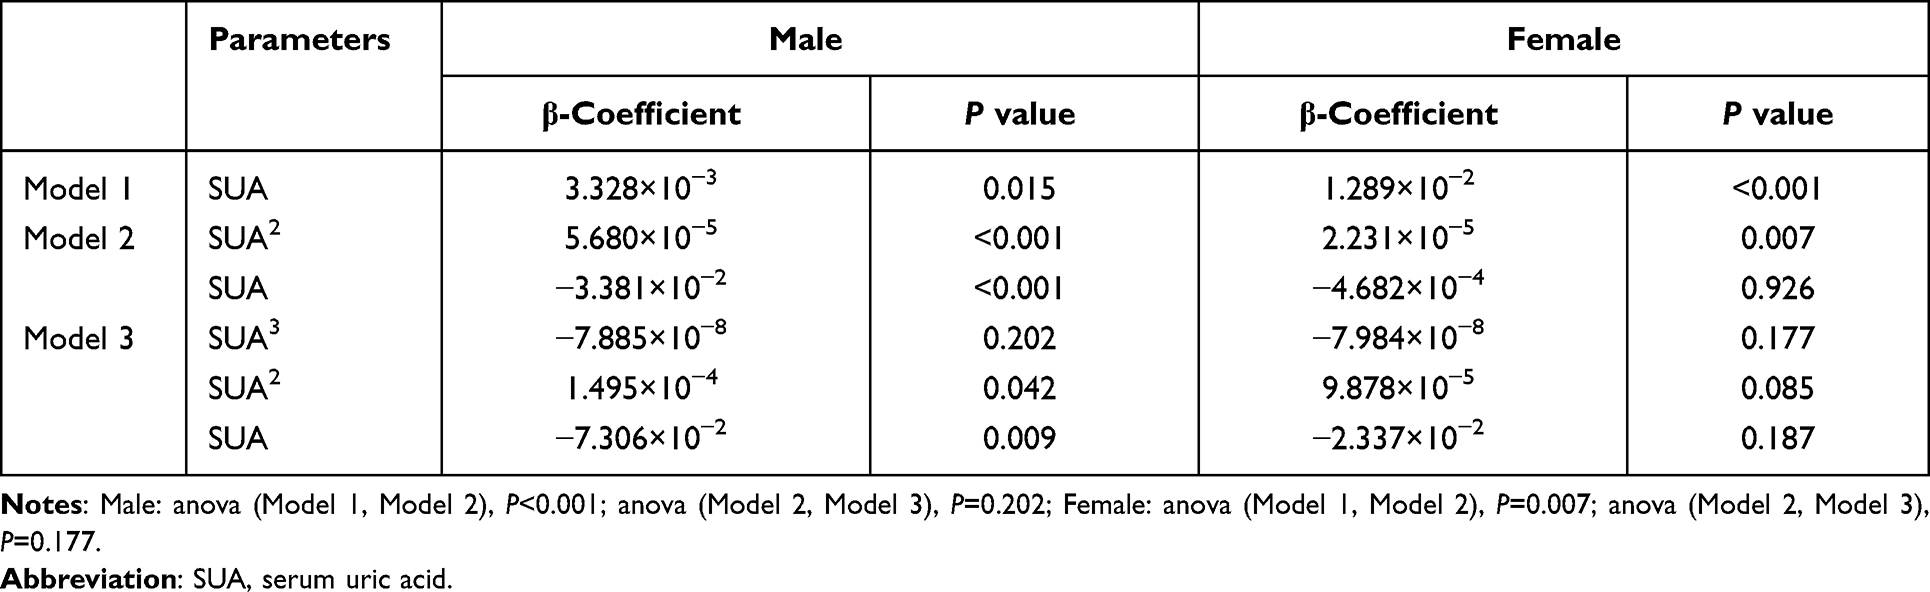 |
Table 3 Association of Serum Uric Acid with 10-Year China-PAR ASCVD Risk Scores |
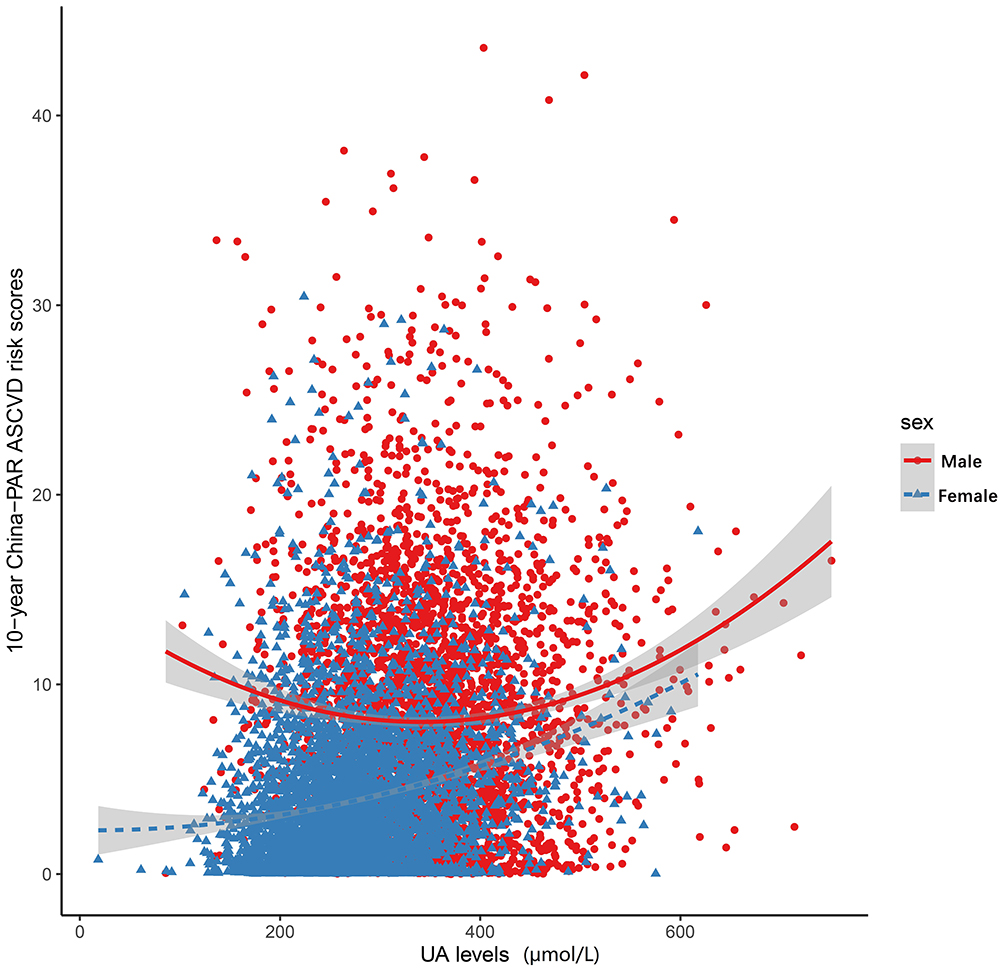 |
Figure 3 Relationship between uric acid (UA) levels and 10-year China-PAR ASCVD risk scores in male and female participants. |
Discussion
In this cross-sectional study, we found the prevalence of hyperuricemia varied in the different survey sites across Jiangsu Province in China. The height, weight, WC, BMI, SBP, DBP, TG, TC and LDL levels increased with SUA quantiles. Moreover, the HDL level decreased with SUA quantiles. In both male and female population, SUA was associated with the various CRFs. However, it showed sex-specific difference in the association between SUA and Chinese 10-year ASCVD risk scores. The U-shaped association was found in males, and J-shaped association was in females.
It turned out that the prevalence of hyperuricemia rose from north to south in Jiangsu Province of China. One study had used the national survey data in China, and found hyperuricemia was prevalent in the economically developed areas of China.16 In Jiangsu Province specifically, the south was more developed than the north. Our report indicated that economic levels might had an influence on the prevalence of hyperuricemia in Jiangsu. Along with the development of economy, the consumption of purine-rich food was also increasing from north to south.16
The trend correlation between SUA level and numerous cardiovascular risk indicator values have been revealed in many studies. One former research found weight, WC, BMI, FBS, TG, TC and LDL levels in high level SUA group were significantly higher than those in low level group.34 Similarly, in a prospective study, BMI, TG and LDL levels significantly increased in hyperuricemia group.35 Moreover, our findings indicated that SUA was associated with masses of CFRs. To be more specific, obesity is often accompanied by hyperuricemia.8 In the mouse model, adipose tissue can produce and secrete SUA through xanthine oxidase, which is enhanced when in obesity condition.36 SUA is closely related to hypertension, which has been proven as an independent risk factor in the occurrence and development of hypertension.9 Through the urate crystal mechanism and oxidative stress mechanism, SUA can cause arterial stiffness and raise the blood pressure.37 In our study results, the accumulation of CRFs increased with elevated SUA quartiles both in male and female participants. The risk of being prevalent of most CRFs also went up along with the SUA levels in both genders. It was worth noting that the inverse associations of diabetes and SUA levels were found in males and females. In the female population, FBS level increased with female-specific SUA quantiles, and Q4 level female participants were more prone to have diabetes than Q1 level in the multivariate logistic regression analysis after adjusting covariates (adjusted OR=1.41, 95% CI: 1.06–1.87). However, the relationship of SUA with diabetes showed gender differences. The positive correlation between FBS level and SUA level did not exist in the male population. Adjusted by covariates, the male-specific SUA Q2, Q3 and Q4 level participants were less likely to have diabetes than Q1 group (adjusted OR=0.69, 0.71 and 0.72 respectively). Results regarding the relationship between SUA and diabetes had been revealed in several studies.1,7 A positive linear correlation was found between FBS and SUA in females, but a negative linear relationship was found in males.38 Recently, a study also showed a negative correlation between SUA and glycosylated hemoglobin levels in men and a positive correlation between SUA levels and glycosylated hemoglobin levels in women.39 We further performed the linear correlation between SUA and glycosylated hemoglobin in both genders, and the results were consistent with the former research (β=−0.035, P=0.037 in males; β=0.079, P<0.001 in females). Dyslipidemia is a major risk factor for CVD and related diseases. One meta-analysis in Chinese indicated that SUA was significantly associated with dyslipidemia and its components, and hyperuricemia increased the likelihood of dyslipidemia.40 Our results were in accordance with this meta-analysis. Based on our data, SUA levels had a remarkable association with CRFs, and with the increase of SUA level, the clustering degree of cardiovascular risk factors also increased in both genders. The same results could be observed in other studies.27
A number of studies have reported that SUA levels are associated with a variety of cardiovascular diseases, including stroke, heart failure, atrial fibrillation, and even death risk.41,42 However, there are few researches on UA level and specific risk of cardiovascular disease in Chinese population. Thus, we analyzed the relationship between SUA and 10-year ASCVD risk scores derived from the China-PAR project. An approximate U-shaped association between SUA and 10-year China-PAR ASCVD risk scores was found in males, and an approximate J-shaped association was in the female populations. The sex-specific differences in CVD risk in the presence of low SUA had been described in other studies. In the Koreans, U-shaped and J-shaped associations were also observed in males and females between SUA and 10-year CVD risk score derived from the Framingham Heart Study.43 Besides, U-Shaped association of SUA with all-cause and cause-specific mortality was confirmed in different populations.44,45 On the one hand, the sex difference in females can be explained by the change of estrogen. Owing to the estrogen’s protective effect against CVD, the younger women with sufficient levels of estrogen had a lower risk of CVD.46 On the other hand, FBS and HbA1c levels also showed sex-specific difference. In males, FBS and HbA1c levels were higher in both low and high SUA levels. In females, FBS and HbA1c levels increased linearly with SUA quantiles. Thus, we doped out that the sex hormone and blood glucose caused the sex-specific difference associations between SUA and 10-year China-PAR ASCVD risk scores.
This study had some limitations. First, this was a cross-sectional design and restricted the ability to access the causality, and the reasons need to be explained by caution. Second, we acknowledged that these findings were valid for the Chinese ethnicity, and in particular for our region, and further confirmation should be made in a larger population. Third, we did not compare the dietary factors that might have effects on the results. We would further keep on finding the effects of dietary patterns on SUA levels. Nevertheless, this study did have certain strengths. Through scientific sampling methods, this study selected regional representative samples. Besides, strict quality control procedures and good compliance of participants ensured the quality of this research. Furthermore, this is the first time to analyze the relationships of SUA levels with CVD risk by applying the 10-year China-PAR ASCVD risk scores in Chinese populations.
Conclusion
SUA was associated with the various CRFs, and the risk of clustering of CRFs increased with SUA quartiles in both genders. It showed sex-specific difference in the association between SUA levels and 10-year ASCVD risk scores. Thus, in the prevention and control of cardiovascular events, sex-specific SUA management and intervention strategies may be essential.
Data Sharing Statement
The datasets used and/or analyzed during the current study are available from the corresponding author on reasonable request.
Patient and Public Involvement
Patients or the public were not involved in the design, or conduct, or reporting, or dissemination plans of our research.
Acknowledgments
The authors are grateful to the Chinese Center for Disease Control and Prevention for the support in study design and field work.
Author Contributions
All authors made substantial contributions to conception and design, acquisition of data, or analysis and interpretation of data; took part in drafting the article or revising it critically for important intellectual content; agreed to submit to the current journal; gave final approval of the version to be published; and agreed to be accountable for all aspects of the work.
Funding
The Chinese Chronic Disease and Nutrition Examination Survey was funded by the Chinese Center for Disease Control and Prevention, Beijing, China.
Disclosure
The authors declare no conflict of interest.
References
1. Lima WG, Martins-Santos ME, Chaves VE. Uric acid as a modulator of glucose and lipid metabolism. Biochimie. 2015;116:17–23. doi:10.1016/j.biochi.2015.06.025
2. El Ridi R, Tallima H. Physiological functions and pathogenic potential of uric acid: a review. J Adv Res. 2017;8(5):487–493. doi:10.1016/j.jare.2017.03.003
3. Bardin T, Richette P. Definition of hyperuricemia and gouty conditions. Curr Opin Rheumatol. 2014;26(2):186–191. doi:10.1097/BOR.0000000000000028
4. Ali N, Miah R, Hasan M, et al. Association between serum uric acid and metabolic syndrome: a cross-sectional study in Bangladeshi adults. Sci Rep. 2020;10(1):7841. doi:10.1038/s41598-020-64884-7
5. Hong JW, Noh JH, Kim DJ, Cho SK. Association between serum uric acid and spirometric pulmonary function in Korean adults: the 2016 Korea National Health and Nutrition Examination Survey. PLoS One. 2020;15(10):e0240987. doi:10.1371/journal.pone.0240987
6. Huang XB, Zhang WQ, Tang WW, et al. Prevalence and associated factors of hyperuricemia among urban adults aged 35–79 years in southwestern China: a community-based cross-sectional study. Sci Rep. 2020;10(1):15683. doi:10.1038/s41598-020-72780-3
7. Haque T, Rahman S, Islam S, et al. Assessment of the relationship between serum uric acid and glucose levels in healthy, prediabetic and diabetic individuals. Diabetol Metab Syndr. 2019;11:49. doi:10.1186/s13098-019-0446-6
8. Ali N, Perveen R, Rahman S, et al. Prevalence of hyperuricemia and the relationship between serum uric acid and obesity: a study on Bangladeshi adults. PLoS One. 2018;13(11):e0206850. doi:10.1371/journal.pone.0206850
9. Ali N, Mahmood S, Islam F, et al. Relationship between serum uric acid and hypertension: a cross-sectional study in Bangladeshi adults. Sci Rep. 2019;9(1):9061. doi:10.1038/s41598-019-45680-4
10. Lee CL, Tsai SF. Association between mortality and serum uric acid levels in non-diabetes-related chronic kidney disease: an analysis of the National Health and Nutrition Examination Survey, USA, 1999–2010. Sci Rep. 2020;10(1):17585. doi:10.1038/s41598-020-74747-w
11. Ali N, Rahman S, Islam S, et al. The relationship between serum uric acid and lipid profile in Bangladeshi adults. BMC Cardiovasc Disord. 2019;19(1):42. doi:10.1186/s12872-019-1026-2
12. Antonini-Canterin F, Di Nora C, Pellegrinet M, et al. Effect of uric acid serum levels on carotid arterial stiffness and intima-media thickness: a high resolution Echo-Tracking Study. Monaldi Arch Chest Dis. 2019;89(1). doi:10.4081/monaldi.2019.1007
13. Wu AH, Gladden JD, Ahmed M, et al. Relation of serum uric acid to cardiovascular disease. Int J Cardiol. 2016;213:4–7. doi:10.1016/j.ijcard.2015.08.110
14. Verdecchia P, Schillaci G, Reboldi G, et al. Relation between serum uric acid and risk of cardiovascular disease in essential hypertension. The PIUMA study. Hypertension. 2000;36(6):1072–1078. doi:10.1161/01.hyp.36.6.1072
15. Chen-Xu M, Yokose C, Rai SK, et al. Contemporary prevalence of gout and hyperuricemia in the United States and decadal trends: the national health and nutrition examination survey, 2007–2016. Arthritis Rheumatol. 2019;71(6):991–999. doi:10.1002/art.40807
16. Liu H, Zhang XM, Wang YL, et al. Prevalence of hyperuricemia among Chinese adults: a national cross-sectional survey using multistage, stratified sampling. J Nephrol. 2014;27(6):653–658. doi:10.1007/s40620-014-0082-z
17. Huang J, Ma ZF, Zhang Y, et al. Geographical distribution of hyperuricemia in mainland China: a comprehensive systematic review and meta-analysis. Glob Health Res Policy. 2020;5(1):52. doi:10.1186/s41256-020-00178-9
18. Wang TT, Lin B, Cui WX, et al. Clustering of cardiovascular risk factors and diabetes: a prospective cohort study on the inner Mongolian population in China. Biomed Environ Sci. 2018;31(10):749–756. doi:10.3967/bes2018.100
19. de Souza Filho ZA, Ferreira AA, Dos Santos J, et al. Cardiovascular risk factors with an emphasis on hypertension in the Mura Indians from Amazonia. BMC Public Health. 2018;18(1):1251. doi:10.1186/s12889-018-6160-8
20. Joseph P, Leong D, McKee M, et al. Reducing the global burden of cardiovascular disease, part 1: the epidemiology and risk factors. Circ Res. 2017;121(6):677–694. doi:10.1161/CIRCRESAHA.117.308903
21. De Pergola G, Cortese F, Termine G, et al. Uric acid, metabolic syndrome and atherosclerosis: the chicken or the egg, which comes first. Endocr Metab Immune Disord Drug Targets. 2018;18(3):251–259. doi:10.2174/1871530318666180212101548
22. Biradar MI, Chiang KM, Yang HC, et al. The causal role of elevated uric acid and waist circumference on the risk of metabolic syndrome components. Int J Obes (Lond). 2020;44(4):865–874. doi:10.1038/s41366-019-0487-9
23. Kuwabara M, Hisatome I, Niwa K, et al. Uric acid is a strong risk marker for developing hypertension from prehypertension: a 5-year Japanese cohort study. Hypertension. 2018;71(1):78–86. doi:10.1161/HYPERTENSIONAHA.117.10370
24. Du L, Ma J, Zhang X. Higher serum uric acid may contribute to cerebral infarction in patients with type 2 diabetes mellitus: a meta-analysis. J Mol Neurosci. 2017;61(1):25–31. doi:10.1007/s12031-016-0848-y
25. Son M, Seo J, Yang S, Magni P. Association between dyslipidemia and serum uric acid levels in Korean adults: Korea National Health and Nutrition Examination Survey 2016–2017. PLoS One. 2020;15(2):e0228684. doi:10.1371/journal.pone.0228684
26. Wu J, Qiu L, Cheng XQ, et al. Hyperuricemia and clustering of cardiovascular risk factors in the Chinese adult population. Sci Rep. 2017;7(1):5456. doi:10.1038/s41598-017-05751-w
27. Tao M, Pi X, Ma X, et al. Relationship between serum uric acid and clustering of cardiovascular disease risk factors and renal disorders among Shanghai population: a multicentre and cross-sectional study. BMJ Open. 2019;9(3):e025453. doi:10.1136/bmjopen-2018-025453
28. Yang X, Li J, Hu D, et al. Predicting the 10-year risks of atherosclerotic cardiovascular disease in Chinese population: the China-PAR project (prediction for ASCVD risk in China). Circulation. 2016;134(19):1430–1440. doi:10.1161/CIRCULATIONAHA.116.022367
29. Writing Group of 2018 Chinese Guidelines for the Management of Hypertension. 2018 Chinese guidelines for the management of hypertension. Chin J Cardiovasc Med. 2019;24(1):24–56.
30. Chinese Diabetes Society. The 2013 edition of the Chinese guidelines for the diagnosis and treatment of diabetes mellitus. Chin J Endocrinol Metabol. 2014;30(10):893–942.
31. Joint Committee for Developing Chinese guidelines on Prevention and Treatment of Dyslipidemia in Adults. 2016 Chinese guidelines on prevention and treatment of dyslipidemia in adults. Chin Circulat J. 2016;31(10):937–950.
32. Department of Disease Control, Ministry of Health of the People’s Republic of China. Guidelines for prevention and control of overweight and obesity in Chinese adults. 2003.
33. Endocrinology Branch of Chinese Medical Association. China expert consensus about hyperuricemia and gout treatment. Chin J Endocrinol Metabol. 2013;29(11):913–920. doi:10.3760/cma.j.issn.1000-6699.2013.11.001.
34. Baygi F, Herttua K, Sheidaei A, et al. Association of serum uric acid with cardio-metabolic risk factors and metabolic syndrome in seafarers working on tankers. BMC Public Health. 2020;20(1):442. doi:10.1186/s12889-020-08466-2
35. Rathmann W, Funkhouser E, Dyer AR, et al. Relations of hyperuricemia with the various components of the insulin resistance syndrome in young black and white adults: the CARDIA study. Coronary artery risk development in young adults. Ann Epidemiol. 1998;8(4):250–261. doi:10.1016/s1047-2797(97)00204-4
36. Tsushima Y, Nishizawa H, Tochino Y, et al. Uric acid secretion from adipose tissue and its increase in obesity. J Biol Chem. 2013;288(38):27138–27149. doi:10.1074/jbc.M113.485094
37. Kuwabara M, Kanbay M, Hisatome I. Uric acid and hypertension because of arterial stiffness. Hypertension. 2018;72(3):582–584. doi:10.1161/HYPERTENSIONAHA.118.11496
38. Cheng F, Yin X, Duan W, et al. Different-shaped curves for serum uric acid with and without diabetes: results from China health and retirement longitudinal study. J Diabetes. 2019;11(6):431–439. doi:10.1111/1753-0407.12863
39. Kawamoto R, Ninomiya D, Kasai Y, et al. Interaction between gender and uric acid on hemoglobin A1c in community-dwelling persons. J Endocrinol Invest. 2018;41(4):421–429. doi:10.1007/s40618-017-0760-5
40. Chen S, Yang H, Chen Y, et al. Association between serum uric acid levels and dyslipidemia in Chinese adults: a cross-sectional study and further meta-analysis. Medicine (Baltimore). 2020;99(11):e19088. doi:10.1097/MD.0000000000019088
41. Borghi C, Rodriguez-Artalejo F, De Backer G, et al. Serum uric acid levels are associated with cardiovascular risk score: a post hoc analysis of the EURIKA study. Int J Cardiol. 2018;253:167–173. doi:10.1016/j.ijcard.2017.10.045
42. Maiolino G, Pagnin E, Plebani M, et al. Uric acid and cardiovascular-renal disease risk. Insights from a human model opposite to hypertension. Int J Cardiol. 2016;212:18–19. doi:10.1016/j.ijcard.2016.03.036
43. Lee SY, Park W, Suh YJ, et al. Association of serum uric acid with cardiovascular disease risk scores in Koreans. Int J Environ Res Public Health. 2019;16(23):4632. doi:10.3390/ijerph16234632
44. Hu L, Hu G, Xu BP, et al. U-shaped association of serum uric acid with all-cause and cause-specific mortality in US adults: a cohort study. J Clin Endocrinol Metab. 2020;105(3):e597–e609. doi:10.1210/clinem/dgz068
45. Tseng WC, Chen YT, Ou SM, et al. U-shaped association between serum uric acid levels with cardiovascular and all-cause mortality in the elderly: the role of malnourishment. J Am Heart Assoc. 2018;7(4):e007523. doi:10.1161/JAHA.117.007523
46. Feig DI, Kang DH, Johnson RJ. Uric acid and cardiovascular risk. N Engl J Med. 2008;359(17):1811–1821. doi:10.1056/NEJMra0800885
 © 2021 The Author(s). This work is published and licensed by Dove Medical Press Limited. The full terms of this license are available at https://www.dovepress.com/terms.php and incorporate the Creative Commons Attribution - Non Commercial (unported, v3.0) License.
By accessing the work you hereby accept the Terms. Non-commercial uses of the work are permitted without any further permission from Dove Medical Press Limited, provided the work is properly attributed. For permission for commercial use of this work, please see paragraphs 4.2 and 5 of our Terms.
© 2021 The Author(s). This work is published and licensed by Dove Medical Press Limited. The full terms of this license are available at https://www.dovepress.com/terms.php and incorporate the Creative Commons Attribution - Non Commercial (unported, v3.0) License.
By accessing the work you hereby accept the Terms. Non-commercial uses of the work are permitted without any further permission from Dove Medical Press Limited, provided the work is properly attributed. For permission for commercial use of this work, please see paragraphs 4.2 and 5 of our Terms.