")
Back to Journals » Nature and Science of Sleep » Volume 12
Associations of OSA and Nocturnal Hypoxemia with Strength and Body Composition in Community Dwelling Middle Aged and Older Men
Authors Stevens D , Appleton S , Vincent AD , Melaku Y , Martin S, Gill T , Hill C , Vakulin A, Adams R , Wittert G
Received 13 August 2020
Accepted for publication 13 October 2020
Published 10 November 2020 Volume 2020:12 Pages 959—968
DOI https://doi.org/10.2147/NSS.S276932
Checked for plagiarism Yes
Review by Single anonymous peer review
Peer reviewer comments 3
Editor who approved publication: Dr Steven A Shea
David Stevens,1 Sarah Appleton,1– 3 Andrew D Vincent,4,5 Yohannes Melaku,1 Sean Martin,3,4 Tiffany Gill,4 Catherine Hill,4,6 Andrew Vakulin,1,7 Robert Adams,1,2,8 Gary Wittert2,3,5
1Adelaide Institute for Sleep Health, College of Medicine and Public Health, Flinders University, Adelaide, SA, Australia; 2The Health Observatory, Adelaide Medical School, University of Adelaide, Adelaide, SA, Australia; 3Freemason Foundation Centre for Men’s Health, Adelaide Medical School, University of Adelaide, Adelaide, SA, Australia; 4Adelaide Medical School, University of Adelaide, Adelaide, SA, Australia; 5Centre of Nutrition and Gastrointestinal Diseases, Nutrition Theme, South Australian Health and Medical Research Institute, Adelaide, SA, Australia; 6Rheumatology Unit, The Queen Elizabeth Hospital and the Royal Adelaide Hospital, Central Adelaide Local Health Network, Adelaide, SA, Australia; 7Sleep and Circadian Research Group, Woolcock Institute of Medical Research, University of Sydney, Sydney, NSW, Australia; 8Respiratory and Sleep Services, Southern Adelaide Local Health Network, Adelaide, SA, Australia
Correspondence: David Stevens
Adelaide Institute for Sleep Health, College of Medicine and Public Health, Flinders University, Level 2a, 5 Laffer Drive, Bedford Park, Adelaide, SA 5042, Australia
Tel +61 8 7221 8306
Email [email protected]
Purpose: Reduced hand grip strength (HGS) is associated with poorer health in chronic conditions, yet there has been little research examining the association with hand grip strength and obstructive sleep apnea (OSA). Further, these studies have not examined, nor adjusted, for muscle mass. The aim of this study was to determine associations between OSA indices, HGS, muscle mass, and fat mass.
Participants and Methods: A total of 613 participants (age range 41– 88, BMI 28.6 ± 4.3) from the population-based Men Androgen Inflammation Lifestyle Environment and Stress Study underwent in-home overnight polysomnography, assessment of dominant and non-dominant HGS, and dual x-ray absorptiometry to determine whole body muscle mass and fat mass. Linear models determined cross-sectional associations of polysomnographic-derived OSA indices with hand grip strength, muscle mass, and fat mass, whilst adjusting for lifestyle information (income, smoking status, diet, self-reported physical activity), blood sample derived testosterone and systemic inflammation (C-reactive protein), cardiometabolic health (cardiovascular disease, hypertension, type 2 diabetes), and depression.
Results: In adjusted models, reduced dominant HGS was associated with lower oxygen nadir (unstandardised β [B] = 0.19, 95% confidence interval [CI] 0.08 to 0.29), greater time spent below 90% oxygen saturation (B = − 0.08, 95% CI − 0.14 to − 0.02), and increased apnea duration (B = − 0.3, 95% CI − 0.23 to − 0.02). By contrast, there were no associations between HGS and both AHI and REM AHI. Fat mass was consistently associated with worsening OSA indices, whereas muscle mass demonstrated no associations with any OSA index.
Conclusion: Our findings suggest impairments in HGS may be related to fat infiltration of muscle, hypoxemia-induced reductions in peripheral neural innervation, or even endothelial dysfunction, which is a common outcome of hypoxemia. Longitudinal data are needed to further examine these hypotheses and establish if reduced grip strength in patients with OSA is associated with long-term adverse health outcomes.
Keywords: grip strength, muscle mass, intermittent hypoxemia, myosteatosis
Introduction
Reduced hand grip strength (HGS) is associated with increased severity of a range of chronic conditions, including cardiometabolic disease1,2 and chronic obstructive pulmonary disease.3 Furthermore, recent studies indicate lower HGS predicts mortality in different chronic conditions.4,5
Obstructive sleep apnea (OSA), a condition where the airway recurrently collapses during sleep leading to partial (hypopnea) or complete (apnea) cessation of breathing, results in intermittent hypoxemia and cortical arousals from sleep. Importantly, OSA is associated with a range of cardiometabolic diseases, including hypertension, type 2 diabetes, and cardiovascular disease.6–10 OSA is common, with recent large cohort studies indicating moderate to severe OSA present in 50% of men and 23% of women.11,12
A previous study in patients with OSA found that reduced HGS was associated with intermittent nocturnal hypoxemia.13 By contrast, there was no association found between AHI and HGS.13,14 Neither study, however, accounted for muscle mass, which is an important determinant of HGS.15 This is especially pertinent for Dam et al, whose participants were all over 65 (average age 76.4±5.5) at the time of testing.13 There is a high likelihood that many of their participants were experiencing sarcopenia, which is the decline in muscle mass with aging. We, therefore, extend the work these previous studies by adjusting for muscle mass, multiple demographic, anthropometric, socio-economic and health confounders that may impact on associations with grip strength that were not previously accounted for. This is important given the shared comorbidities that are associated with OSA and grip strength. Furthermore, we examine relationships in a younger population.
The relationship between OSA and muscle mass remains unclear. One study showed increased AHI was associated with decreased muscle mass. When stratified by severity, patients with severe OSA (AHI more than 30 events and hour[/h]), but not those with mild or moderate OSA, had significantly less muscle mass compared to non-OSA controls.16 By contrast, another study showed no differences in muscle mass regardless of OSA severity.17 Neither study, however, examined muscle strength, as determined by HGS or other methods.
As HGS is an important indicator of chronic disease severity, but has been scarcely studied in OSA, this study examined associations between polysomnography (PSG)-derived OSA indices with HGS, muscle mass, and fat mass from participants in the Men, Androgen, Inflammation, Lifestyle, Environment and Stress (MAILES) cohort study.
Methods
Participants
The MAILES Study is comprised of 2563 randomly-selected, community-dwelling men who were aged at least 35 years at baseline (2002–2006) and were living in the northern and western suburbs of Adelaide, South Australia.18 The MAILES Study consists of two concurrent prospective cohorts: the Florey Adelaide Male Ageing Study (FAMAS)19 which originally recruited 1195 participants, and aged-matched men from the North West Adelaide Health Study (NWAHS)20 which originally recruited 1368 participants. Both cohorts used the same sampling and testing methods. Initial recruitment occurred by a random selection of phone numbers from the electronic telephone directory. Through a combination of computer assisted telephone interviews (CATI), self-completed health questionnaires, and clinical assessment, detailed demographic (eg, age, income), co-morbidities (eg, cardiovascular disease, metabolic disorders), and lifestyle behaviours (eg, smoking status, alcohol consumption) information was collected.
The study was conducted in accordance with the Declaration of Helsinki. The study was approved by both the North West Adelaide Health Service institutional ethics committee (approval number 2010054) and the Royal Adelaide Hospital institutional ethics committee (approval number 02305H). All subjects gave written informed consent prior to the commencement of the study.
Polysomnography
In 2010, a computer assisted telephone interview asked 1629 MAILES participants “Have you ever been diagnosed with obstructive sleep apnea with a sleep study?”, with 184 participants responding “Yes”. These participants, whilst remaining part of the MAILES cohort study, were excluded from any further aspect of the sleep health research. This is because a main aspect of this study was to examine the effect of undiagnosed OSA on health, as well as the effect of any subsequent treatment. There was a strong possibility that the 184 participants may have, at some stage, received treatment. The remaining 1445 participants who responded “No” were invited to undergo a sleep study. Participants underwent in-home polysomnography (PSG) (Embletta X100, Embla Systems, Colorado), measuring electroencephalography, electrooculography, chin electromyography, nasal pressure, thoracic and abdominal effort, peripheral pulse oximetry, and body position. Trained staff visited study participants in their homes to set-up the sleep study. Failed studies were repeated if possible. Staff also completed measurements of height and weight.
A single experienced sleep technician, who was blinded to all other survey and biomedical data, performed manual scoring of PSGs according to 2007 American Academy of Sleep Medicine (alternate) criteria,21 which is recommended for use in prospective epidemiological studies. Studies were considered acceptable with 3.5 hours of sleep and 5.5 hours of total-recorded study time with good respiratory and electroencephalography signals for the duration of recording. Apneas were defined as complete cessations of airflow, measured using nasal pressure, lasting ≥10 seconds. Hypopneas were defined as a >50% decrease in nasal pressure with an associated ≥3% oxygen desaturation or an EEG arousal. OSA was defined as an apnea hypopnea index (AHI) ≥10/h of sleep, with further categorization: mild, AHI of 10–19/h; moderate, 20–29/h; and severe, ≥30/h. These OSA severity cut-offs were chosen as they are the equivalent AHIs if scored according to the “recommended” AASM scoring criteria (mild, AHI 5–15/h; moderate, 15–30/h; severe, ≥30/h).22
At the conclusion of the study period, 857 PSGs had been attempted, including 40 repeats, with 827 PSGs with valid data. A further 214 participants did not undergo body composition measurements, leaving 613 participants for analysis (Figure 1).
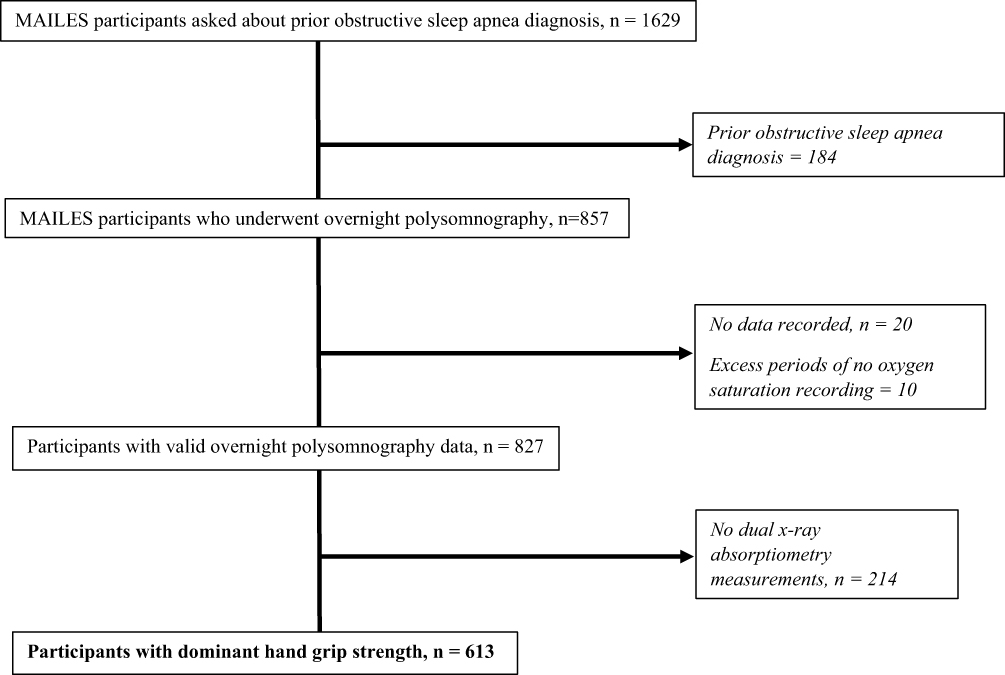 |
Figure 1 Consort diagram showing number, and reasons, for exclusion from analysis. |
Body Composition Outcome Measures
Dual x-ray absorptiometry (DXA) was used in part to determine body composition and offered to all FAMAS participants, and NWAHS participants over 50 years old. DXA was assessed using default settings on either a pencil-beam (DPX+, Lunar software v4·7) or fan-beam (Prodigy DF+ 14,759, Encore software v9·15) densitometer. Both machines were from GE Lunar (Madison, WI), which provide similar results.23 DXA calculated lean muscle mass (g), fat mass (g), and bone mineral mass (g) for the whole body, as well as individually for the arms, legs, and trunk. These values were converted to kg. For assessment of non-lean soft tissue in the abdominal region, the top of the lumbar vertebrae L2 to the bottom of L4 and extending outwards to a vertical line touching the inner edges of the rib cage was adopted as the customised anatomical setting.24
Hand Grip Measurement
HGS was measured using the Smedley analogue hand dynamometer (Stoelting Corporation, Wood Dale, Il., USA) for the FAMAS cohort, and a Jamar analogue hand dynamometer (Lafayette Instrument Company, Lafayette, In., USA) for the NWAHS cohort. To account for any systematic differences in measurements between the types of dynamometers, cohort group was included as a covariate in the analysis. HGS was the average of three measures recorded on both hands.
Statistical Analyses
The cohort was stratified by OSA severity into none, mild, moderate, and severe by the cutoffs described previously. Differences in HGS, whole body muscle mass, and whole body fat mass were determined by one-way analysis of variance (ANOVA).
Unadjusted and covariate adjusted linear regression models were used to determine the associations between HGS, whole body muscle mass, and whole body fat mass as outcomes with OSA indices, being AHI (/h), AHI during REM sleep (REM AHI), percent time below 90% oxygen saturation (T90%), and lowest oxygen saturation (%), and mean apnea and hypopnea duration (seconds). To determine the adjustments for each linear model involving HGS, muscle mass, and fat mass, known or suspected determinants for each outcome were examined for potential confounding in univariate models. Covariates with p <0.10 were included for adjustment in the model for that specific outcome. Details on collection methods of known or suspected confounders, and results from the univariate models, including unstandardised β (B), 95% confidence interval (CI), and p values, are presented Supplementary S1. This resulted in different groups of adjustments for HGS, muscle mass, and fat mass linear models, respectively.
For HGS, two models were performed. Model 1 adjusted for the following; age, income, alcohol consumption, diabetes status, hypertension status, arthritis status, cancer treatment within the last 5 years, cardiovascular disease status, depression status, whole body muscle mass, whole body fat mass, and cohort groups. Model 2 removed whole body fat mass as an adjustment to address concerns about potential collinearity with muscle mass. For whole body muscle mass, the following adjustments were made; age, income, diabetes status, whole body fat mass, testosterone, and inflammation. For whole body fat mass, the follow adjustments were made; smoking status, dietary patterns, self-reported physical activity, diabetes status, hypertension status, whole body muscle mass, testosterone, and inflammation. Participants with missing data for any of the confounder variables were not included that particular analysis. All models were assessed for linearity and homoscedasticity (residual vs fitted plots and scale-location plots), normal distribution of residuals (Q-Q plot), and influential values (Cooks D > 0.5).
All statistical analyses were calculated in R (v3.1.0, R Foundation for Statistical Computing, Vienna, Austria), and utilised the “LSR” package. A p-value of less than 0.05 was considered significant.
Results
Participants’ Characteristics
Participant cohort characteristics are outlined in Table 1. The median age was 63 years (range 41–88 years old). Mean body mass index was 28.6 (± 4.3) kg/m2. Mean AHI was 16.2 (± 14.6) events/h.
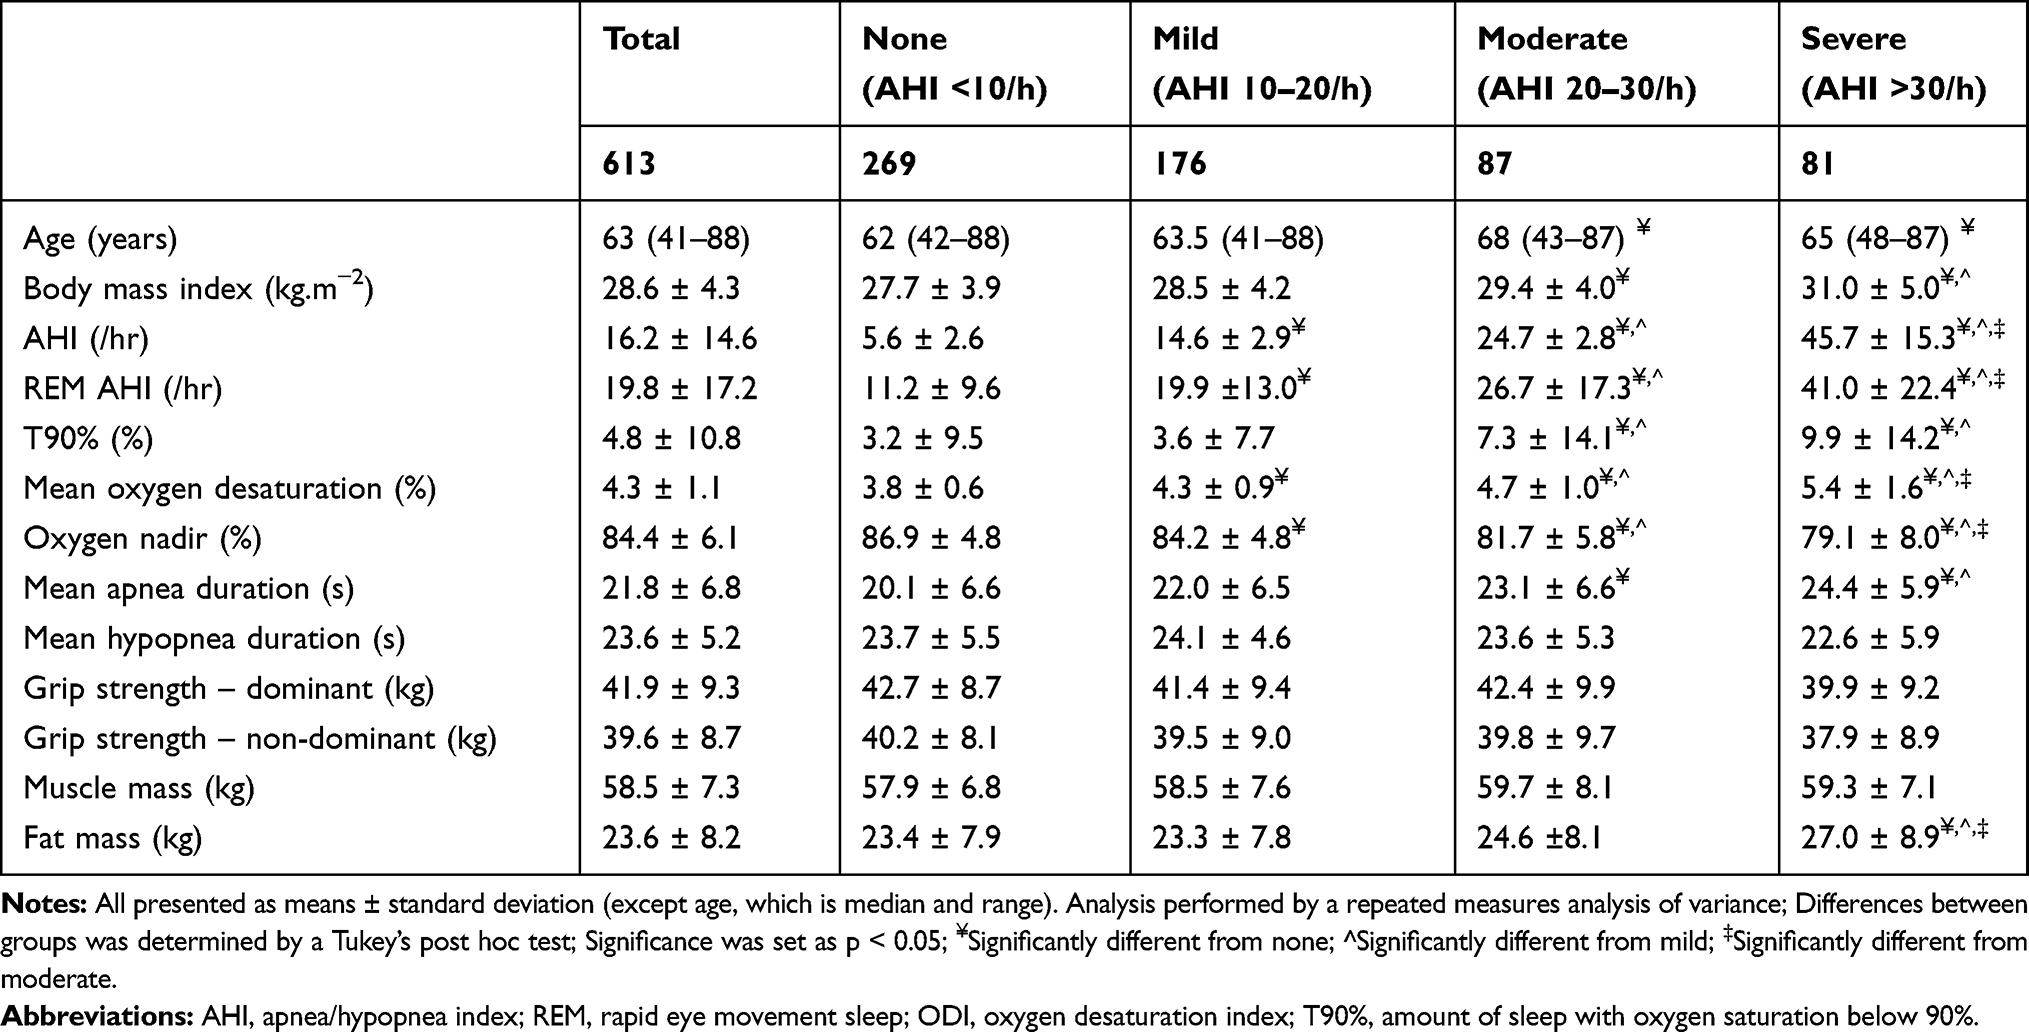 |
Table 1 Polysomnographic Characteristics and Body Composition of Study Participants Characteristics, Based on OSA Severity Classification |
Grip Strength
One-way ANOVAs (Table 1) showed no significant differences in either dominant HGS (p = 0.12) or non-dominant HGS (p = 0.12) by OSA severity category. Results for unadjusted and adjusted associations for both the dominant and non-dominant HGS are shown in Table 2. In unadjusted models for both dominant and non-dominant HGS, reduced HGS was associated with lower oxygen nadir, greater T90%, increased mean desaturation, and greater duration in both apneas and hypopneas. In Model 1, reduced HGS in both the dominant and non-dominant hand was associated with a lower oxygen nadir, greater T90%, whilst increased duration of apneas was associated with reduced HGS in the dominant hand only. In Model 2, the same associations were present for both dominant and non-dominant HGS, with the addition of the association between reduced HGS with increased mean desaturation.
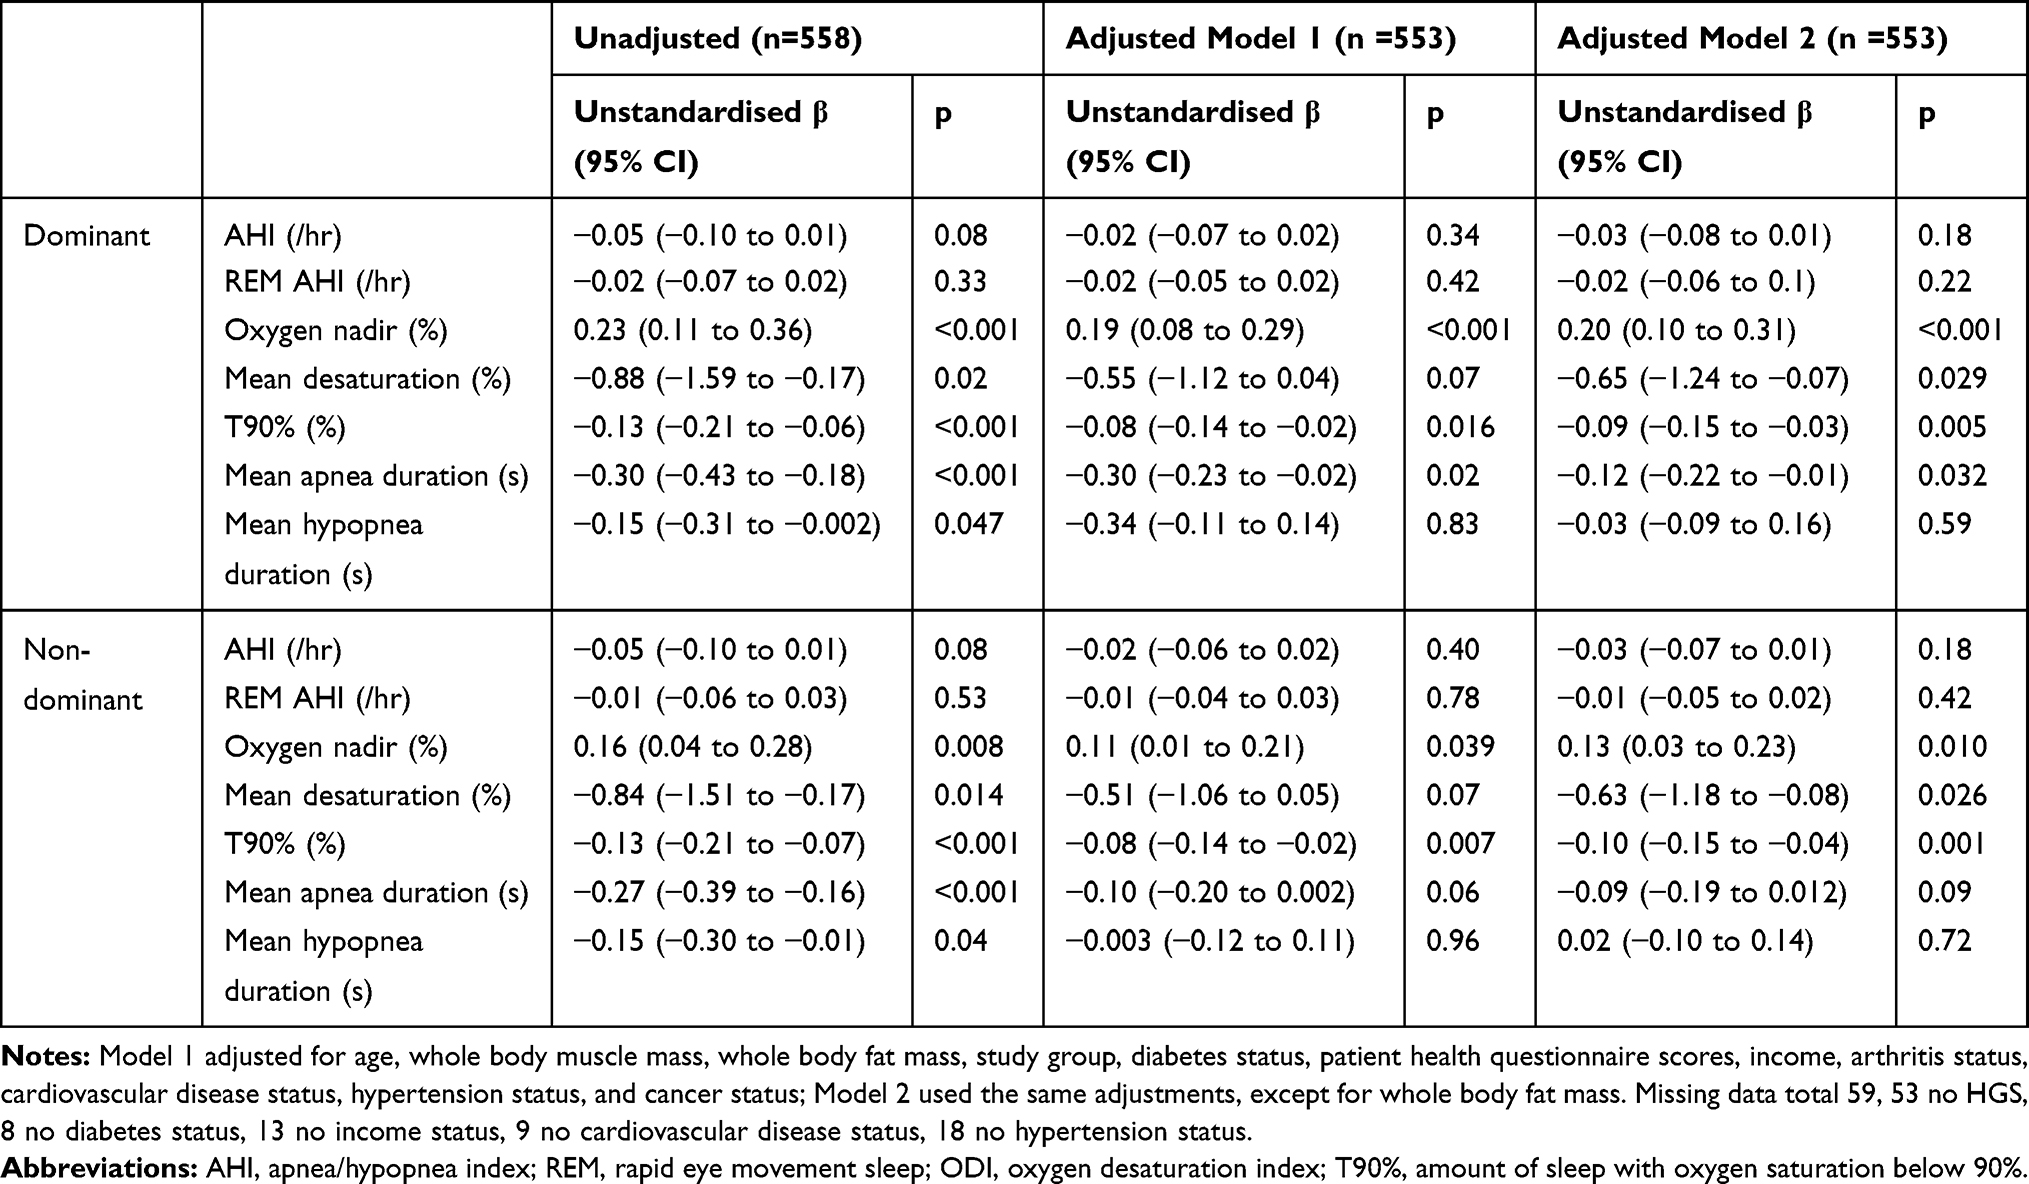 |
Table 2 Associations Between OSA Indices and Hand Grip Strength |
Muscle Mass
One-way ANOVA (Table 1) showed no significant differences in whole body muscle mass by OSA severity category (p = 0.16). Results for unadjusted and adjusted associations with whole body muscle mass are shown in Table 3. In unadjusted models, increased muscle mass was associated with increased AHI, and REM AHI, lower oxygen nadir, and increased duration of hypopneas. After adjustment, however, the associations between OSA and muscle mass were no longer significant.
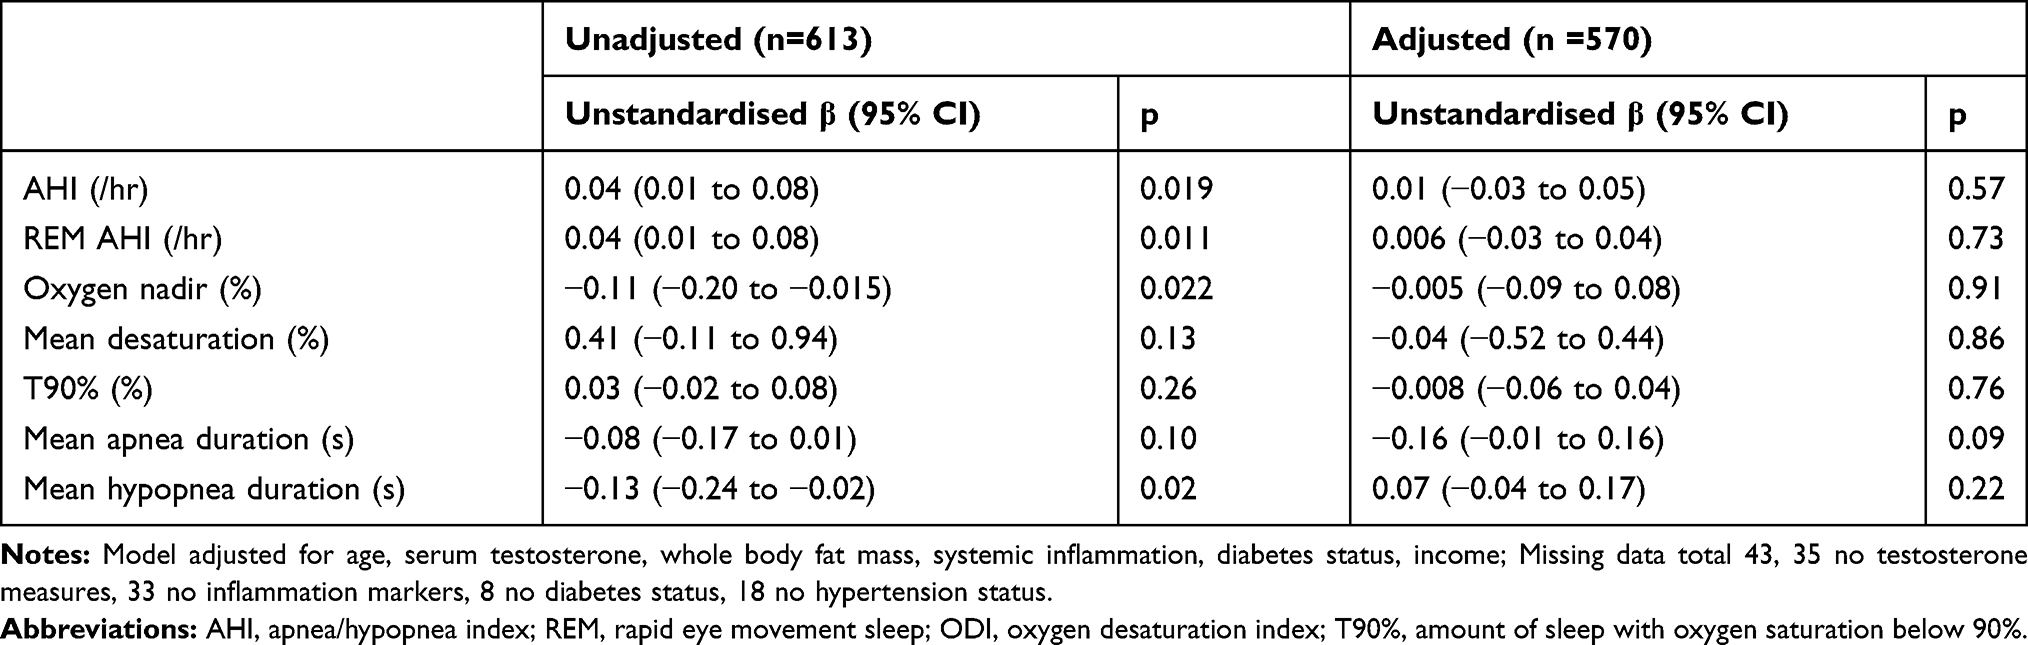 |
Table 3 Associations Between OSA Indices and Whole Body Muscle Mass (kg) |
Fat Mass
One-way ANOVA (Table 1) showed significant differences in whole body fat mass by OSA severity category (p < 0.001). Results for unadjusted and adjusted associations with whole body fat mass are shown in Table 4. In both the unadjusted and adjusted models, increased fat mass was associated with worsening OSA severity indices (increased AHI, REM AHI, mean oxygen desaturation, T90%, lower oxygen nadir, and increased duration of apneas and hypopneas).
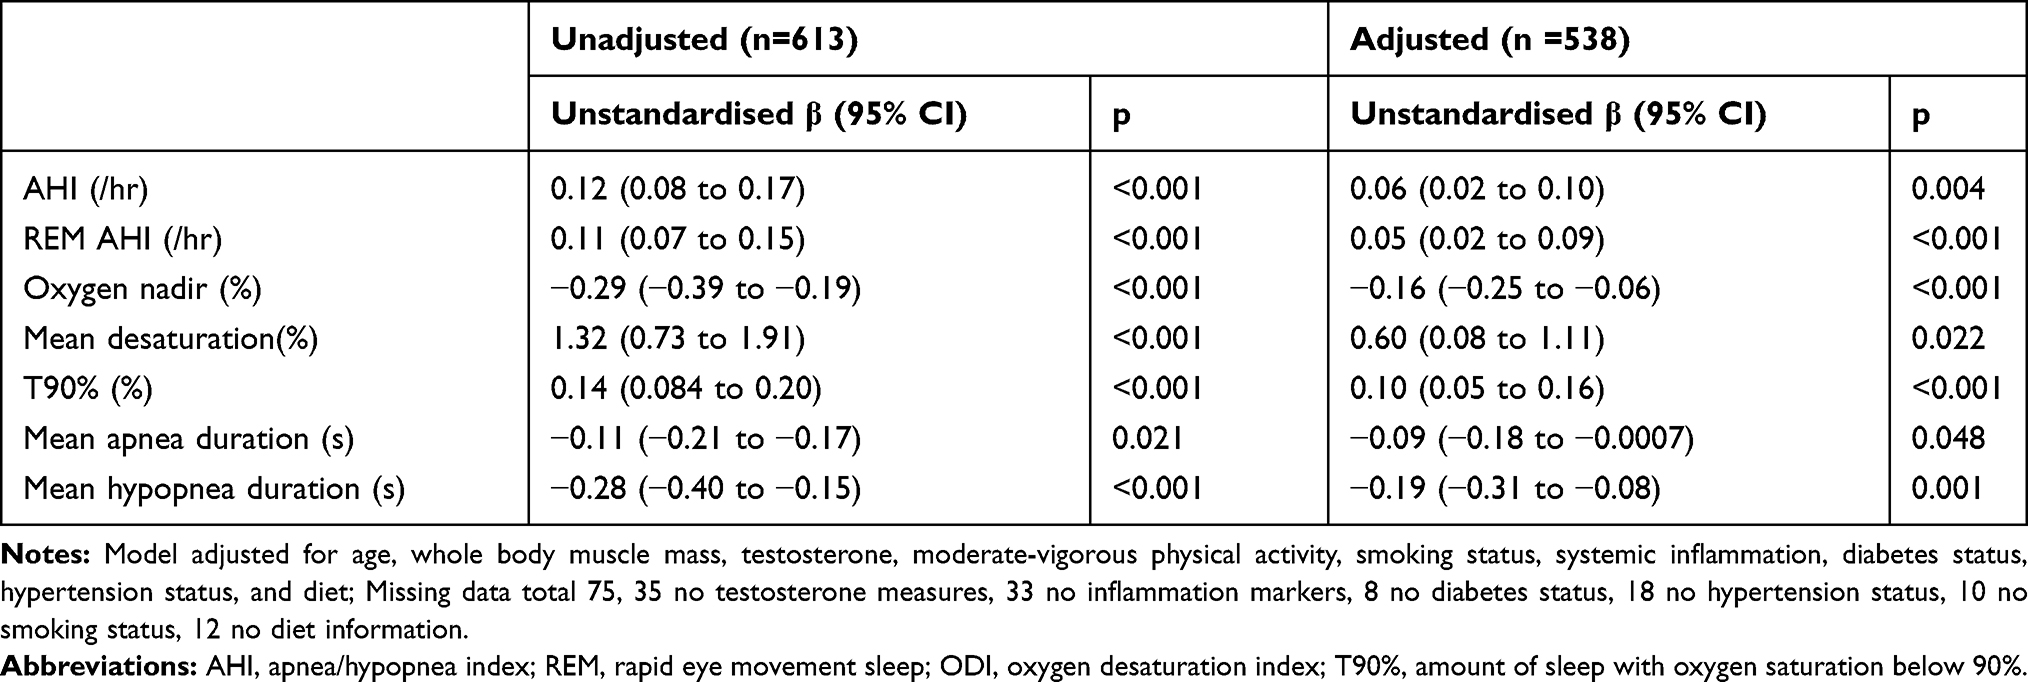 |
Table 4 Associations Between OSA Indices and Whole Body Fat Mass (kg) |
Additional Analyses
Further results of associations between HGS, muscle mass, and fat mass with non-respiratory sleep measures, including total sleep time, sleep efficiency, percent stages of sleep, arousal index, and excessive daytime sleepiness, measured by the Epworth Sleepiness Scale (ESS), are presented in Supplementary S2.
Discussion
In a study of over 600 community dwelling men, intermittent nocturnal hypoxemia and increased apnea duration, but not AHI or REM AHI, was associated with reduced HGS in both dominant and non-dominant hands. No associations were detected between any measured OSA indices and whole body muscle mass. By contrast, all measured OSA indices were associated with increased whole body fat mass.
The finding of an association between fat mass and all OSA indices, along with significant differences in fat mass between OSA severity groups, is in line with previous studies. Fat mass, especially around the neck and abdomen, contribute to increased AHI and worsening hypoxemia.25,26
The associations between reduced HGS in both dominant and non-dominant hands and worsening hypoxemia indices, being T90% and O2 nadir, with the addition of mean desaturation when whole body fat mass is not adjusted for, confirms previous finding showing those who spent more than 1% of the night with oxygen saturation below 90% had significantly weaker grip strength compared to those who did not.13 Likewise, no association was detected between HGS and AHI, which is also in line with previous studies.13,14 This was further evidenced by the lack of an observed difference of HGS between OSA severity groups. A novel finding of this study was the association between increased apnea duration and reduced HGS, however, as increased apnea duration results in worse hypoxemia,27 this association is not surprising. A further novel finding was the inability to detect a difference between HGS and REM AHI, given REM AHI is associated with cardiometabolic disorders.28,29 Importantly, our analysis extends on previous work by adjusting for muscle mass, which has not been done in previously, as well as demonstrate these associations in a younger population. Considering that reduced HGS in other chronic conditions is associated with increased severity and mortality, our findings suggest that OSA-induced hypoxemia, but not AHI, may also be associated with worsening health and mortality. Indeed, a recent analysis of two cohort studies showed OSA-induced hypoxemia, but not AHI, predicted cardiovascular disease mortality.30
This study did not detect associations between and OSA indices and muscle mass, after adjustments. Similarly, there were no significant differences in muscle mass between OSA severity groups. Kuźnar-Kamińska et al showed no differences in muscle mass between OSA severity groups, however, they did not examine for associations between AHI and muscle mass.17 Kosacka et al showed an inverse association between AHI and muscle mass, however, their models were unadjusted for determinants of muscle mass.16 Our unadjusted models also showed inverse associations between AHI and both dominant and non-dominant HGS, but these association were attenuated in the adjusted models. Kosacka et al conceded that comorbidities, which were not reported, may have influenced their results.16 Furthermore, they demonstrated patients with severe OSA had significantly lower muscle mass compared to those without OSA, but did not undertake any comparison for patients with mild or moderate OSA. Their study had lower numbers compared to ours, yet their patients with severe OSA made over half their cohort (n = 67/137). This was most likely to their participants, including their non-OSA controls, being recruited from a clinical service. These methodological differences made further comparison of results difficult.
Due to the cross-sectional nature of this study, causality between hypoxemia and reduced HGS cannot be established. Nevertheless, as reduced HGS occurred independent to muscle mass, we speculate this may be due to fat infiltration of the muscle, known as myosteatosis, which has been shown to reduce muscle strength.31 Matsumoto et al demonstrated that increased AHI was associated with increase muscle cross-sectional area at the third lumbar vertebra, but was also associated with increased myosteatosis.32 As worsening OSA was associated with increased fat mass, it is reasonable that participants in this study may have experienced myosteatosis. Alternatively, the association between hypoxemia and reduced HGS may be due to hypoxemia-induced reductions in peripheral neuronal axons conduction.33,34 This would result in decreased muscle fibres recruitment. Longitudinal data are needed to explore these speculations. A further possibility may be endothelial dysfunction, which has been shown in a single study in elderly women to be associated with lower grip strength.35 Endothelial dysfunction is a common outcome of OSA-induced hypoxemia in males,36 it is reasonable to assume that endothelial dysfunction in men may also result in reduced grip strength. Nevertheless, to explore these potential mechanisms longitudinal data are needed.
The association between hypoxemia and reduced muscle strength may have implications on genioglossus function in patients with OSA. The genioglossus, in response to reductions in pharyngeal pressure, activates to maintain upper airway patency,37 however, in some patients there is minimal-to-no activation of the genioglossus in non-REM sleep during these pressure reductions.38 The genioglossus is skeletal muscle like the upper arm muscles tested in HGS, and has been shown in patients with OSA to have significantly higher fat mass compared to patients without OSA.39 Thus it is possible that the reductions in the genioglossus activation could also be due to myosteatosis and/or reduced peripheral innervation. Again, further research is needed to examine this hypothesis.
Hypoxemia, but not AHI, is linked with self-report and objectively measured excessive daytime sleepiness.40,41 Yet, excessive daytime sleepiness, measured by the Epworth Sleepiness Scale (ESS), was not associated with HGS, muscle mass, nor fat mass, in either the unadjusted and adjusted analyses (Supplementary S2). A single previous study showed an ESS score above 15, coupled with self-report snoring or apneic events, is associated with reduced HGS, after adjusting for various confounders.42 Given the differences in assessment of OSA, as well as not adjusting for muscle mass, diabetes status, systemic inflammation, and testosterone, further comparisons are difficult.
The only non-respiratory sleep metric to show significant associations were reduced wake after sleep onset associated with increased non-dominant HGS (Supplementary S2). The only other study, to our knowledge, examining associations between PSG-derived sleep metrics and HGS showed the lowest quartile of REM sleep had significantly lower HGS compared to all other quartiles.13 Other studies utilising self-reported and actigraphy measured sleep metrics demonstrated both inadequate and excessive sleep durations was associated with reduced HGS,43–45 and reduced muscle mass.43 The discrepant results from previous studies, coupled with a lack of studies examining associations between non-respiratory sleep metrics with HGS, muscle mass, and fat mass, indicates further research is needed in this area.
This is the first study, to our knowledge, to examine associations between PSG measured OSA indices with HGS, muscle mass, and fat mass within the same cohort. Furthermore, this is the first study to examine associations between all PSG-derived OSA indices (AHI, REM AHI, mean oxygen desaturation, lowest oxygen saturation, and T90%) with HGS, muscle mass, and fat mass. A strength of this study was the large non-clinical community sample population, representative of an adult male population of men aged 40 years and over.
There are some weaknesses of this study. As mentioned, the cross-sectional design of this study means causality cannot be established. Furthermore, all participants were male, meaning the results may not be generalised to women. Indeed, despite a population cohort study indicating 23% of females had moderate to severe OSA,11 there has been no study examining associations between OSA, HGS, and muscle mass in women.
Future studies should, therefore, undertake longitudinal PSG to allow for examination of potential mechanisms to explain the findings of this study. Likewise, females should be included in future studies. As lower HGS predicts mortality in different chronic conditions,4,5 future studies could determine if muscle strength and body composition predict adverse health outcomes in an OSA population.
Conclusion
This study demonstrated that worsening OSA severity indices, specifically lowest oxygen saturation and time spent below 90% oxygen saturation, were independently associated with impaired grip strength and increased whole body fat mass, but not whole body muscle mass, in a large sample of middle-aged, urban-dwelling males. Given that impaired HGS is indicative of poor health outcomes in other chronic conditions, the findings of this study suggest that OSA also has a negative impact on health. More research is needed to further explore the relationship between OSA, body composition, and HGS.
Acknowledgments
GW is a Chief Investigator for the FAMAS study. RA is a Chief Investigator for the NWAHS study.
Author Contributions
All authors made substantial contributions to conception and design, acquisition of data, or analysis and interpretation of data; took part in drafting the article or revising it critically for important intellectual content; agreed to submit to the current journal; gave final approval of the version to be published; and agree to be accountable for all aspects of the work.
Robert Adams and Gary Wittert are co-senior authors.
Funding
This study has received funding from the Australian National Health and Medical Research Foundation (APP 627227), the Hospital Research Foundation (South Australia, Australia), and the ResMed Foundation (United States).
Disclosure
DS has received funding from the Flinders Foundation (Australia) and the CRC for Alertness, Safety, and Productivity (Australia), and reports grants from National Health and Medical Research Council, the Hospital Research Foundation, and the ResMed Foundation, during the conduct of the study; and grants from Flinders Foundation, outside the submitted work. RA, GW, and TG have received funding from the National Health and Medical Research Council (Australia). RA has received non-financial support from Embla Systems and reports grants from the National Health and Medical Research Council, The Hospital Research Foundation, and ResMed Foundation, during the conduct of the study. GW has received research funding from Bayer Schering, Eli Lilly, and Lawley Pharmaceuticals; has received funding from Eli Lilly, Bayer Schering, Sanofi, Novo Nordisk, Astra Zeneca, I-Nova, and Elsevier; has served on the International Advisory Boards for Eli Lilly, and Novo Nordisk. RA, GW, and SA have received funding from the ResMed Foundation (USA) and the Sleep Health Foundation (Australia). RA, SA, YAM, and TG have received funding from the Hospital Research Foundation (Australia). TG has received funding from Arthritis Australia. None declared for AV and CH. The authors report no other potential conflicts of interest for this work.
References
1. Pavasini R, Serenelli M, Celis-Morales CA, et al. Grip strength predicts cardiac adverse events in patients with cardiac disorders: an individual patient pooled meta-analysis. Heart. 2019;105(11):834–841. doi:10.1136/heartjnl-2018-313816
2. Mainous AG, Tanner RJ, Anton SD, Jo A. Grip strength as a marker of hypertension and diabetes in healthy weight adults. Am J Prev Med. 2015;49(6):850–858. doi:10.1016/j.amepre.2015.05.025
3. Han CH, Chung JH. Association between hand grip strength and spirometric parameters: Korean national health and nutrition examination survey (KNHANES). J Thorac Dis. 2018;10(11):6002–6009. doi:10.21037/jtd.2018.10.09
4. Celis-Morales CA, Welsh P, Lyall DM, et al. Associations of grip strength with cardiovascular, respiratory, and cancer outcomes and all cause mortality: prospective cohort study of half a million UK Biobank participants. Br Med J. 2018;361:k1651.
5. Leong DP, Teo KK, Rangarajan S, et al. Prognostic value of grip strength: findings from the prospective urban rural epidemiology (PURE) study. Lancet. 2015;386(9990):266–273. doi:10.1016/S0140-6736(14)62000-6
6. Appleton SL, Vakulin A, McEvoy RD, et al. Nocturnal hypoxemia and severe obstructive sleep apnea are associated with incident type 2 diabetes in a population cohort of men. J Clin Sleep Med. 2015;11(6):609–614. doi:10.5664/jcsm.4768
7. Tkacova R, McNicholas WT, Javorsky M, et al. Nocturnal intermittent hypoxia predicts prevalent hypertension in the European sleep apnoea database cohort study. Eur Respir J. 2014;44(4):931–941. doi:10.1183/09031936.00225113
8. Torres G, Sanchez-de-la-Torre M, Barbe F. Relationship between OSA and hypertension. Chest. 2015;148(3):824–832. doi:10.1378/chest.15-0136
9. Loke YK, Brown JW, Kwok CS, Niruban A, Myint PK. Association of obstructive sleep apnea with risk of serious cardiovascular events: a systematic review and meta-analysis. Circ Cardiovasc Qual Outcomes. 2012;5(5):720–728.
10. Dong JY, Zhang YH, Qin LQ. Obstructive sleep apnea and cardiovascular risk: meta-analysis of prospective cohort studies. Atherosclerosis. 2013;229(2):489–495. doi:10.1016/j.atherosclerosis.2013.04.026
11. Heinzer R, Vat S, Marques-Vidal P, et al. Prevalence of sleep-disordered breathing in the general population: the HypnoLaus study. Lancet Respir Med. 2015;3(4):310–318. doi:10.1016/S2213-2600(15)00043-0
12. Adams R, Appleton S, Taylor A, McEvoy D, Wittert G. Are the ICSD-3 criteria for sleep apnoea syndrome too inclusive? Lancet Respir Med. 2016;4(5):e19–20. doi:10.1016/S2213-2600(16)00109-0
13. Dam TTL, Ewing S, Ancoli-Israel S, Ensrud K, Redline S, Stone K. Association between sleep and physical function in older men: the osteoporotic fractures in men sleep study. J Am Geriatr Soc. 2008;56(9):1665–1673. doi:10.1111/j.1532-5415.2008.01846.x
14. Hongyo K, Ito N, Yamamoto K, et al. Factors associated with the severity of obstructive sleep apnea in older adults. Geriatr Gerontol Int. 2017;17(4):614–621. doi:10.1111/ggi.12768
15. Hayashida I, Tanimoto Y, Takahashi Y, Kusabiraki T, Tamaki J. Correlation between muscle strength and muscle mass, and their association with walking speed, in community-dwelling elderly Japanese individuals. PLoS One. 2014;9(11):e111810. doi:10.1371/journal.pone.0111810
16. Kosacka M, Korzeniewska A, Jankowska R. The evaluation of body composition, adiponectin, C-reactive protein and cholesterol levels in patients with obstructive sleep apnea syndrome. Adv Clin Exp Med. 2013;22(6):817–824.
17. Kuznar-Kaminska B, Grabicki M, Trafas T, et al. Body composition, anthropometric indices and hydration status of obstructive sleep apnea patients: can cachexia coexist with obesity? In: Pokorski M, editor. Clinical Research and Practice. Vol. 1020. Cham, Switzerland: Springer;2017:43–51.
18. Grant JF, Martin SA, Taylor AW, et al. Cohort profile: the men androgen inflammation lifestyle environment and stress (MAILES) study. Int J Epidemiol. 2014;43(4):1040–1053.
19. Martin S, Haren M, Taylor A, Middleton S, Wittert G. Cohort profile: the Florey Adelaide male ageing study (FAMAS). Int J Epidemiol. 2007;36(2):302–306. doi:10.1093/ije/dyl279
20. Grant JF, Taylor AW, Ruffin RE, et al. Cohort profile: the North West Adelaide health study (NWAHS). Int J Epidemiol. 2009;38(6):1479–1486. doi:10.1093/ije/dyn262
21. Iber C, Ancoli-Israel S, Chesson A, Quan S. The AASM Manual for the Scoring of Sleep and Associated Events: Rules, Terminology and Technical Specifications. Westchester, IL: American Academy of Sleep Medicine; 2007:4849.
22. Ruehland WR, Rochford PD, O’Donoghue FJ, Pierce RJ, Singh P, Thornton AT. The new AASM criteria for scoring hypopneas: impact on the apnea hypopnea index. SLEEP. 2009;32(2):150–157. doi:10.1093/sleep/32.2.150
23. Mazess RB, Barden HS. Evaluation of differences between fan-beam and pencil-beam densitometers. Calcif Tissue Int. 2000;67(4):291–296. doi:10.1007/s002230001147
24. Atlantis E, Martin SA, Haren MT, Taylor AW, Wittert GA. Inverse associations between muscle mass, strength, and the metabolic syndrome. Metabolism. 2009;58(7):1013–1022. doi:10.1016/j.metabol.2009.02.027
25. Li Y, Lin N, Ye J, Chang Q, Han D, Sperry A. Upper airway fat tissue distribution in subjects with obstructive sleep apnea and its effect on retropalatal mechanical loads. Respir Care. 2012;57(7):1098–1105. doi:10.4187/respcare.00929
26. Saint Martin M, Roche F, Thomas T, Collet P, Barthelemy JC, Sforza E. Association of body fat composition and obstructive sleep apnea in the elderly: a longitudinal study. Obesity. 2015;23(7):1511–1516. doi:10.1002/oby.21121
27. Kulkas A, Duce B, Leppänen T, Hukins C, Töyräs J. Severity of desaturation events differs between hypopnea and obstructive apnea events and is modulated by their duration in obstructive sleep apnea. Sleep Breath. 2017;21(4):829–835. doi:10.1007/s11325-017-1513-6
28. Acosta-Castro P, Hirotsu C, Marti-Soler H, et al. REM-associated sleep apnoea: prevalence and clinical significance in the HypnoLaus cohort. Eur Respir J. 2018;52(2):1702484. doi:10.1183/13993003.02484-2017
29. Appleton SL, Vakulin A, Martin SA, et al. Hypertension is associated with undiagnosed OSA during rapid eye movement sleep. Chest. 2016;150(3):495–505. doi:10.1016/j.chest.2016.03.010
30. Azarbarzin A, Sands SA, Stone KL, et al. The hypoxic burden of sleep apnoea predicts cardiovascular disease-related mortality: the osteoporotic fractures in men study and the sleep heart health study. Eur Heart J. 2019;40(14):1149–1157. doi:10.1093/eurheartj/ehy624
31. Reinders I, Murphy RA, Brouwer IA, et al. Muscle quality and myosteatosis: novel associations with mortality risk: the age, gene/environment susceptibility (AGES)-Reykjavik study. Am J Epidemiol. 2016;183(1):53–60. doi:10.1093/aje/kwv153
32. Matsumoto T, Tanizawa K, Tachikawa R, et al. Associations of obstructive sleep apnea with truncal skeletal muscle mass and density. Sci Rep. 2018;8(1):6550. doi:10.1038/s41598-018-24750-z
33. Lüdemann P, Dziewas R, Sörös P, Happe S, Frese A. Axonal polyneuropathy in obstructive sleep apnoea. J Neurol Neurosurg Psychiatry. 2001;70(5):685–687. doi:10.1136/jnnp.70.5.685
34. Mayer P, Dematteis M, Pepin JL, et al. Peripheral neuropathy in sleep apnea. A tissue marker of the severity of nocturnal desaturation. Am J Respir Crit Care Med. 1999;159(1):213–219. doi:10.1164/ajrccm.159.1.9709051
35. Yoo JI, Kim MJ, Na JB, et al. Relationship between endothelial function and skeletal muscle strength in community dwelling elderly women. J Cachexia Sarcopenia Muscle. 2018;9(6):1034–1041. doi:10.1002/jcsm.12340
36. Budhiraja R, Parthasarathy S, Quan SF. Endothelial dysfunction in obstructive sleep apnea. J Clin Sleep Med. 2007;3(4):409–415.
37. Cori JM, O’Donoghue FJ, Jordan AS. Sleeping tongue: current perspectives of genioglossus control in healthy individuals and patients with obstructive sleep apnea. Nat Sci Sleep. 2018;10:169–179. doi:10.2147/NSS.S143296
38. Eckert DJ, White DP, Jordan AS, Malhotra A, Wellman A. Defining phenotypic causes of obstructive sleep apnea. Identification of novel therapeutic targets. Am J Respir Crit Care Med. 2013;188(8):996–1004. doi:10.1164/rccm.201303-0448OC
39. Kim AM, Keenan BT, Jackson N, et al. Tongue fat and its relationship to obstructive sleep apnea. SLEEP. 2014;37(10):1639–1648. doi:10.5665/sleep.4072
40. Kainulainen S, Duce B, Korkalainen H, et al. Severe desaturations increase psychomotor vigilance task-based median reaction time and number of lapses in obstructive sleep apnoea patients. Eur Respir J. 2020;55:4.
41. Kainulainen S, Töyräs J, Oksenberg A, et al. Severity of desaturations reflects OSA-related daytime sleepiness better than AHI. J Clin Sleep Med. 2019;15(8):1135–1142.
42. Cao X, Gu Y, Fu J, et al. Excessive daytime sleepiness with snoring or witnessed apnea is associated with handgrip strength: a population-based study. QJM. 2019;112(11):847–853. doi:10.1093/qjmed/hcz178
43. Auyeung TW, Kwok T, Leung J, et al. Sleep duration and disturbances were associated with testosterone level, muscle mass, and muscle strength-a cross-sectional study in 1274 older men. J Am Med Dir Assoc. 2015;16(7):
44. Chen HC, Hsu NW, Chou P. The association between sleep duration and hand grip strength in community-dwelling older adults: the Yilan study, Taiwan. SLEEP. 2017;40(4). doi:10.1093/sleep/zsx021
45. Wang TY, Wu Y, Wang T, Li Y, Zhang D. A prospective study on the association of sleep duration with grip strength among middle-aged and older Chinese. Exp Gerontol. 2018;103:88–93. doi:10.1016/j.exger.2018.01.009
 © 2020 The Author(s). This work is published and licensed by Dove Medical Press Limited. The full terms of this license are available at https://www.dovepress.com/terms.php and incorporate the Creative Commons Attribution - Non Commercial (unported, v3.0) License.
By accessing the work you hereby accept the Terms. Non-commercial uses of the work are permitted without any further permission from Dove Medical Press Limited, provided the work is properly attributed. For permission for commercial use of this work, please see paragraphs 4.2 and 5 of our Terms.
© 2020 The Author(s). This work is published and licensed by Dove Medical Press Limited. The full terms of this license are available at https://www.dovepress.com/terms.php and incorporate the Creative Commons Attribution - Non Commercial (unported, v3.0) License.
By accessing the work you hereby accept the Terms. Non-commercial uses of the work are permitted without any further permission from Dove Medical Press Limited, provided the work is properly attributed. For permission for commercial use of this work, please see paragraphs 4.2 and 5 of our Terms.