")
Back to Journals » Diabetes, Metabolic Syndrome and Obesity » Volume 14
Associations of Metabolic/Obesity Phenotypes with Insulin Resistance and C-Reactive Protein: Results from the CNTR Study
Authors Liao C, Gao W, Cao W, Lv J, Yu C, Wang S, Pang Z, Cong L, Wang H, Wu X, Li L
Received 23 December 2020
Accepted for publication 17 February 2021
Published 15 March 2021 Volume 2021:14 Pages 1141—1151
DOI https://doi.org/10.2147/DMSO.S298499
Checked for plagiarism Yes
Review by Single anonymous peer review
Peer reviewer comments 2
Editor who approved publication: Prof. Dr. Juei-Tang Cheng
Chunxiao Liao,1 Wenjing Gao,1 Weihua Cao,1 Jun Lv,1 Canqing Yu,1 Shengfeng Wang,1 Zengchang Pang,2 Liming Cong,3 Hua Wang,4 Xianping Wu,5 Liming Li1
1Department of Epidemiology and Biostatistics, School of Public Health, Peking University, Beijing, 100191, People’s Republic of China; 2Qingdao Center for Diseases Control and Prevention, Qingdao, 266033, People’s Republic of China; 3Zhejiang Center for Disease Control and Prevention, Hangzhou, 310051, People’s Republic of China; 4Jiangsu Center for Disease Control and Prevention, Nanjing, 210009, People’s Republic of China; 5Sichuan Center for Disease Control and Prevention, Chengdu, 610041, People’s Republic of China
Correspondence: Liming Li; Wenjing Gao
Department of Epidemiology and Biostatistics, School of Public Health, Peking University, 38 XueYuan Road, HaiDian District, Beijing, 100191, People’s Republic of China
Tel +86 10 82801528
Fax +86 10 82801528 Ext. 322
Email [email protected]; [email protected]
Background: Obesity is a heterogeneous condition in terms of metabolic status. Different obesity phenotypes have various health risks. The aim of this work was to define different subtypes of obesity and investigate their relationship with inflammatory-cardiometabolic abnormalities among Chinese adult twins.
Methods: The analyses used data from 1113 adult twins in 4 provinces (Shandong, Zhejiang, Jiangsu and Sichuan) from Chinese National Twin Registry (CNTR) which collected detailed information. We defined those with 0 or 1 metabolic syndrome (MetS) components excluding waist circumference as metabolically healthy, and those with waist circumference ≥ 90 cm (for men) and ≥ 85 cm (for women) as obese. The two-category obesity status and metabolic states are combined to generate four metabolic/obesity phenotypes. High sensitivity C reactive protein (hsCRP) was measured to assess underlying inflammation and homeostasis model assessment of insulin resistance (HOMA-IR) was calculated as surrogate measure of insulin resistance. Mixed-effect linear regression models and fixed-effect linear regression models were used to analyse the correlation between HOMA-IR, hsCRP and different metabolic/obesity phenotypes.
Results: In cross-sectional analyses of 1113 individuals (mean [SD] age, 46.6 [12.9] years; 463 obese [41.6%]), 20.3% obese twins were metabolic healthy and 64.2% non-obese twins were metabolic unhealthy. Serum HOMA-IR level was higher in metabolically unhealthy non-obesity (MUNO) (β=0.42, 95% CI: 0.21– 0.64), metabolically healthy obesity (MHO) (β=0.68, 95% CI: 0.36– 1.00) and metabolically unhealthy obesity (MUO) (β=0.69, 95% CI: 0.46– 0.91) twins, compared with their metabolically healthy non-obesity (MHNO) counterparts. HsCRP was similar between MHO and MUO, which differed significantly to metabolic healthy non-obesity (MHNO).
Conclusion: MHO and MUNO phenotypes were common in Chinese twin population. Both phenotypes were associated with elevated IR and hsCRP which may not be benign and need to be concerned.
Keywords: metabolic status, insulin resistance, chronic inflammation, twin study
Introduction
There is clear evidence of an association between obesity and various metabolic abnormalities such as insulin resistance, inflammation, metabolic syndrome (MetS), which increases the risk of type 2 diabetes mellitus (T2D), and of various cardiovascular outcomes.1,2 However, not all obese individuals entail metabolic abnormalities. These obese individuals who display a healthier phenotype have been called metabolically healthy obesity (MHO).3 In general, the risks of T2D, cardiovascular diseases (CVDs), and all-cause mortality in those with MHO are lower than people with metabolic unhealthy obesity (MUO), but greater than in those who are metabolically healthy and non-obese (MHNO),2,4–7 although inconsistent results have also been reported.8,9 Furthermore, recent studies have found that the risks of cardiovascular outcomes are directly related to the number of metabolic abnormalities,10–13 but the underlying mechanism is not clear yet.
Insulin resistance and inflammation are the potential mechanism linking obesity and cardiometabolic risk.14,15 Insulin resistance and inflammation can result in hyperglycemia, hypertension, dyslipidemia and contribute to cardiometabolic syndrome and increased CVD risk.16,17 Studies have found that insulin sensitivity is better in MHO individuals when compared to MUO individuals, but worse than those who are MHNO.18–20 To date findings have been inconsistent about the relationship between inflammation level and MHO/MUO phenotype. Some studies reported that MHO participants had significantly lower CRP levels than MUO individuals,21,22 but other studies found a similar level of CRP between the two groups.23,24 These estimates are mostly based on studies of Western populations, with little evidence from Chinese populations.
The factors responsible for the different metabolic phenotypes of obesity are not clear, but differences in potentially modifiable lifestyle factors and genetic factors associated with adipose tissue biology may play an important role. Genome wide association studies (GWAS) have identified genetic variants that are associated with both adiposity and metabolic profile.25 It was possible that the previous associations found between metabolic abnormalities and clinical characteristics were attributable to common genetic vulnerabilities. Twin design, especially monozygotic (MZ) twins who are completely matched for genetic background, have an extremely powerful ability to control genetic factors.
Therefore, it is necessary to clarify the insulin resistance and inflammation level in different metabolic/obesity groups which have profound importance in assessing and managing high-risk obesity. In this study, we aimed to define different metabolic/obesity phenotypes and investigate their relationship with insulin resistance and inflammation in a subcohort of Chinese National Twin Registry (CNTR).
Methods
Study Population
The study population was a subcohort of CNTR, which is a cross-sectional study of 1147 adult twins aged 18 to 79 years, recruited between April to December 2013 from four provinces in China (Shandong, Zhejiang, Jiangsu and Sichuan province). Details of CNTR design and survey methods have been previously described.26 All participants in this study completed an interviewer-administered questionnaire, underwent a physical examination and provided a fasting blood sample.
Twins were excluded from analyses if:1 with a definitive diagnosis of alimentary tract tumor, cardiovascular heart disease, stroke and kidney disease;2 using weight-loss drug in the last month. As a result, 34 individuals were excluded, leaving 1113 individuals (541 completed twin pairs and 31 individual twins) for this study. Among 541 twin pairs, 35 twin pairs were raised separately for an average of seven years (range 1–11 years, reared apart was defined according to SATSA’s definition as twins who had been reared apart for at least 1 year before the age of 11).
Determination of zygosity was based on the information from questionnaires during the baseline investigation conducted in 2010. This has been validated using DNA genotyping and found to be >90% accurate.27 This study was approved by Biomedical Ethics Committee at Peking University, Beijing, China. All participants provided their written informed consent.
Clinical and Biochemical Data Collection
Information on demographic characteristics, medical history, and lifestyle factors were recorded by questionnaire, including questions on tobacco smoking, alcohol drinking and exercise activities. Each participants’ occupation, transportation, daily life and leisure time exercise activities was assigned a metabolic equivalent task (MET) value28 and we calculated the total MET value in the analysis.
Each participant’s blood pressure, height, weight and percent body fat (PBF) were measured. Blood pressure was calculated as the mean of the three consecutive measurements. Body mass index (BMI) was calculated as weight in kilograms divided by height in meters squared. Waist circumference (WC) was measured three times at the level of the umbilicus and we calculated the mean value in the analyses. PBF was determined by bioelectrical impedance (Body Composition Analyzer/Scale, TANITA).
Venous serum blood samples were collected after 12h fasting for detection of serum lipid indicators including total cholesterol (TC), triglycerides (TG), high density lipoprotein (HDL) cholesterol and low density lipoprotein (LDL) cholesterol, serum glucose indicators including glucose (Glu) and serum insulin. A modified hexokinase enzymatic method was used to detect glucose (Glu) (Roche, Basel, Switzerland), and serum insulin was measured by chemiluminescence immunoassay (CLIA) on the ADVIA Centaur immunoassay system. Insulin resistance was estimated according to homeostasis model assessment (HOMA-IR): HOMA-IR = [fasting glucose (mmol/l) × insulin (U/mL)]/22.5. Serum high-sensitivity CRP (hsCRP) concentration was measured by a high-sensitivity immunoturbidimetric method using Hitachi auto-analyzer (Roche Diagnostics, Mannheim, Germany). Details of these biochemical data collection have been previously described.29
Definition of the Phenotypes
Metabolic status was defined according to ATP-III components:30 1) systolic BP ≥130 mmHg or diastolic BP ≥85 mmHg or self-reported hypertension or using antihypertensive drugs; 2) serum fasting glucose ≥5.6 mmol/L or self-reported diabetes or intake of antidiabetic drugs; 3) HDL cholesterol <1.0 mmol/L (in men) and <1.3 mmol/L (in women) or using lipid-lowering drugs; and 4) triglycerides ≥1.7 mmol/L or using lipid-lowering drugs. Participants with ≤1 abnormal component were defined as metabolically healthy (MH), with the remaining defined as metabolically unhealthy (MU). Individuals with waist circumference ≥90 cm (men) and 85 cm (women) were considered obese.31 Metabolic and obesity status were combined to create the four metabolic/obesity phenotypes: metabolically healthy non-obesity (MHNO), metabolically healthy obesity (MHO), metabolically unhealthy non-obesity (MUNO), metabolically unhealthy obesity (MUO).
Statistical Methods
We used mean ± SD or median (first quartile (Q1) – third quartile (Q3)) for continuous variables and absolute frequencies for categorical variables. We compared epidemiological and clinical characteristics between MHO and MUO twins as well as MHNO and MUNO twins. P values were corrected for the correlation between co-twins using generalized estimating equations.
We used mixed-effect linear regression models which take into account for twin clustering to assess the relationship of serum HOMA-IR and hsCRP levels with metabolic status (MH as reference group), number of MetS components, and the combined metabolic/obesity categories (MHNO as reference group), adjusting for various covariates. The first model was adjusted for age, sex, place, and zygosity; the second model was additionally adjusted for lifestyle factors (smoking status, drinking status, and METs level), and obesity indicators or serum clinical measurements were further adjusted in the third model where appropriated. Further, we repeated the analysis stratified by age (group1: age<45, group2: age≥45). To better control for shared genetic and environmental factors, we used within twin-pair fixed-effect linear regression model. Twins reared together are matched for age, genetic background, early intrauterine environment and family upbringing environment. This within twin-pair analysis approach automatically takes into account these matched factors. Fixed effect models were used to estimate the relation of serum HOMA-IR and hsCRP levels with metabolic status (MH as reference group), number of MetS components and the combined obesity-metabolic categories (MHNO as reference group) separately for DZ and MZ twins adjusted for lifestyle factors (smoking, drinking, and physical activity) and obesity indicators (BMI, PBF, WHR). Sensitivity analysis was conducted in twins reared together (excluding 35 twin pairs reared apart). The statistical analysis was performed with Stata statistical software (release 12.0; Stata Corporation, College Station, TX, USA). We logarithmic transformed all the clinical indicators in the analyses. Significance were assessed at P<0.05 (two-sided).
Results
Define the Metabolic/Obesity Phenotypes
This analysis included 1113 participants (46.55 ± 12.89 years, 65.4% men), containing 541 complete twin pairs (336 MZ twin pairs, 205 DZ twin pairs). 41.6% twins were obese with 20.3% obese twins were metabolic healthy. Among non-obese twins, 35.8% were metabolic healthy with the remaining in the MUNO group (Table 1). The MHO twins had a mean age of 40.85±12.03 years with 52.1% women. When comparing MHO to the MUO group twins, we found lower WC, WHR (p<0.0001) and lower concentrations of most biochemical characteristics except hsCRP in MHO group. Besides, the MHO group had the lowest proportion of current smokers (18.1%) and current drinkers (16.0%) and highest reported MET levels among four groups. Compared to MUNO, MHNO individuals were younger, with a higher proportion of women (48.9%), and were less likely to smoke and drink.
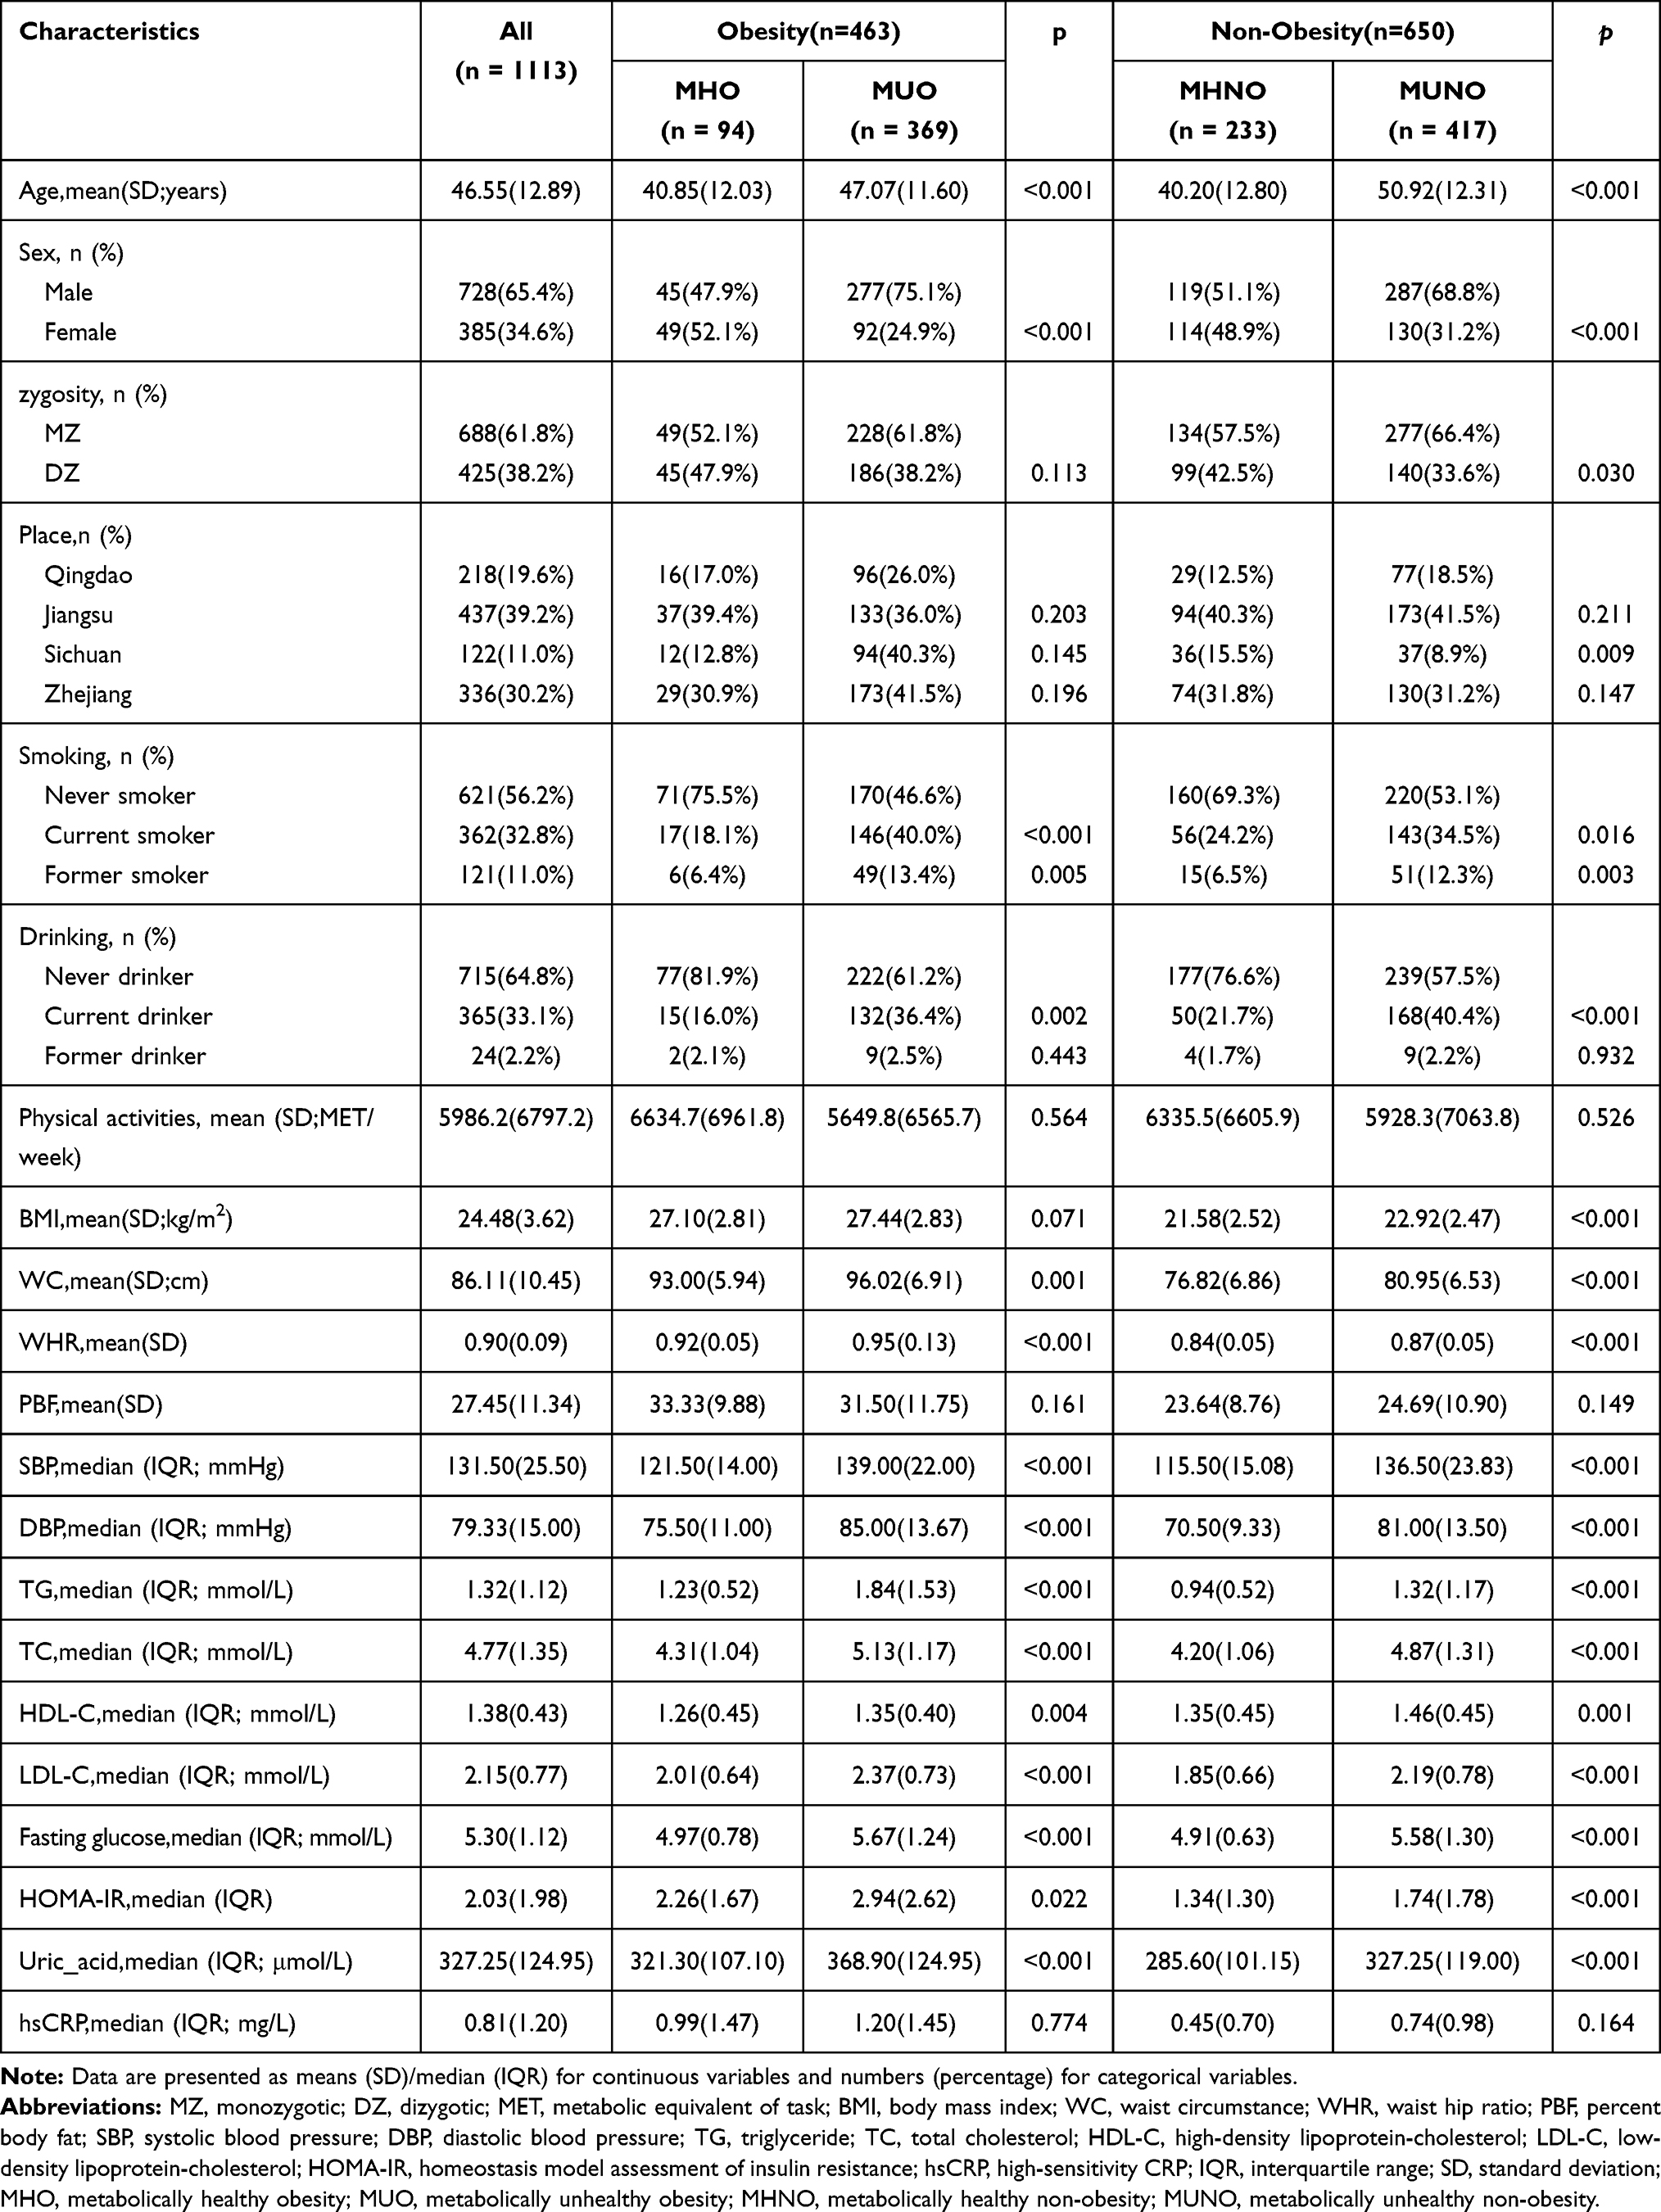 |
Table 1 Baseline Characteristics of the Study Participants (N = 1113) |
Metabolic Status with Insulin Resistance and hsCRP
The associations of serum HOMA-IR and hsCRP levels with metabolic status are shown in Table 2. In the mixed linear models adjusted for sex, zygosity, place and age, MU phenotype was associated with a higher level of serum HOMA-IR (β=0.52,95% CI: 0.43–0.62, p < 0.001) and hsCRP(β=0.34,95% CI: 0.20–0.47, p < 0.001). After adjusting for lifestyle factors (smoking, drinking, and physical activity) and obesity indicators (model 3), the associations remained significant though a slight decrease. We then repeated the analysis in obesity individuals. Compared with MHO, MUO group presented higher level of insulin resistance (β=0.32,95% CI: 0.17–0.47, p < 0.001) but similar hsCRP level (β=0.11,95% CI: −0.09–0.32, p =0.277).
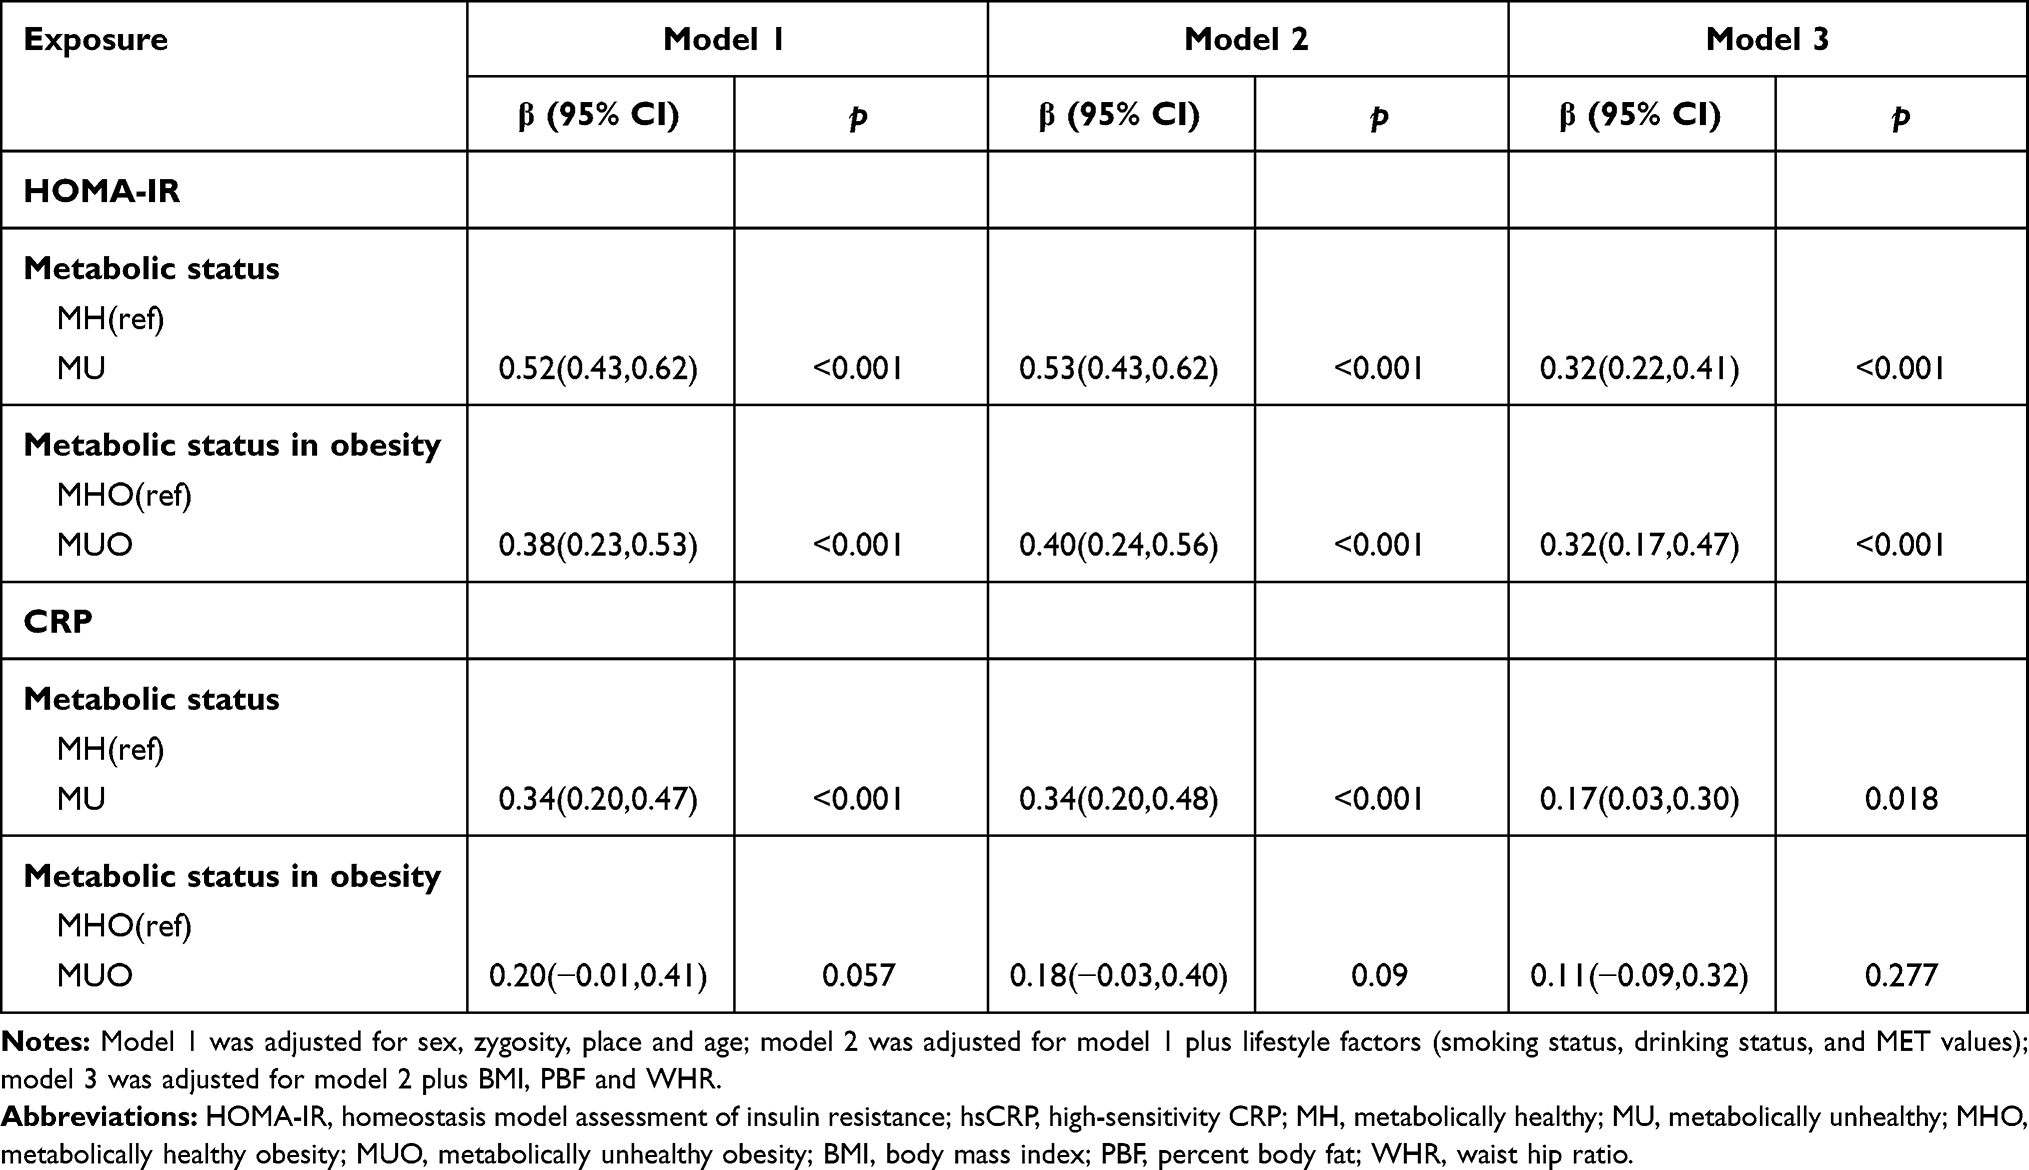 |
Table 2 Results of Mixed Linear Regression Models on the Association of Serum HOMA-IR and hsCRP Levels with Metabolic Status in All Twins |
Further, we analyzed the associations between MetS components and serum HOMA-IR and hsCRP levels. Individuals with 2 or more MetS components had a significantly higher level of HOMA-IR than normal individuals. Test for trend indicated a dose-response relation between numbers of MetS components and serum HOMA-IR (P for trend <0.001, Table S1). The association between numbers of MetS components and serum hsCRP began no more significant in the model additionally adjusted for obesity indicators. Stratified analysis according to obesity status indicated that serum hsCRP was related to number of MetS components only in obesity twins (Table S2 and S3).
Metabolic/Obesity Phenotypes with Insulin Resistance and hsCRP
When combined metabolic status with obesity status, compared to MHNO individuals, the MUO group where both obesity and metabolic abnormalities were present, was characterized with the highest measurements for both indicators, followed by the MHO group. The MUNO group was associated with the minimum increase in serum HOMA-IR and hsCRP levels. After adjusting for lifestyle factors (smoking status, drinking status, and MET values), TC and HbA1c (model 3), all the associations were still significant though there were a slight decrease (Table 3). Analysis stratified by age did not find a significant interaction between metabolic/obesity phenotypes and age (Table S4).
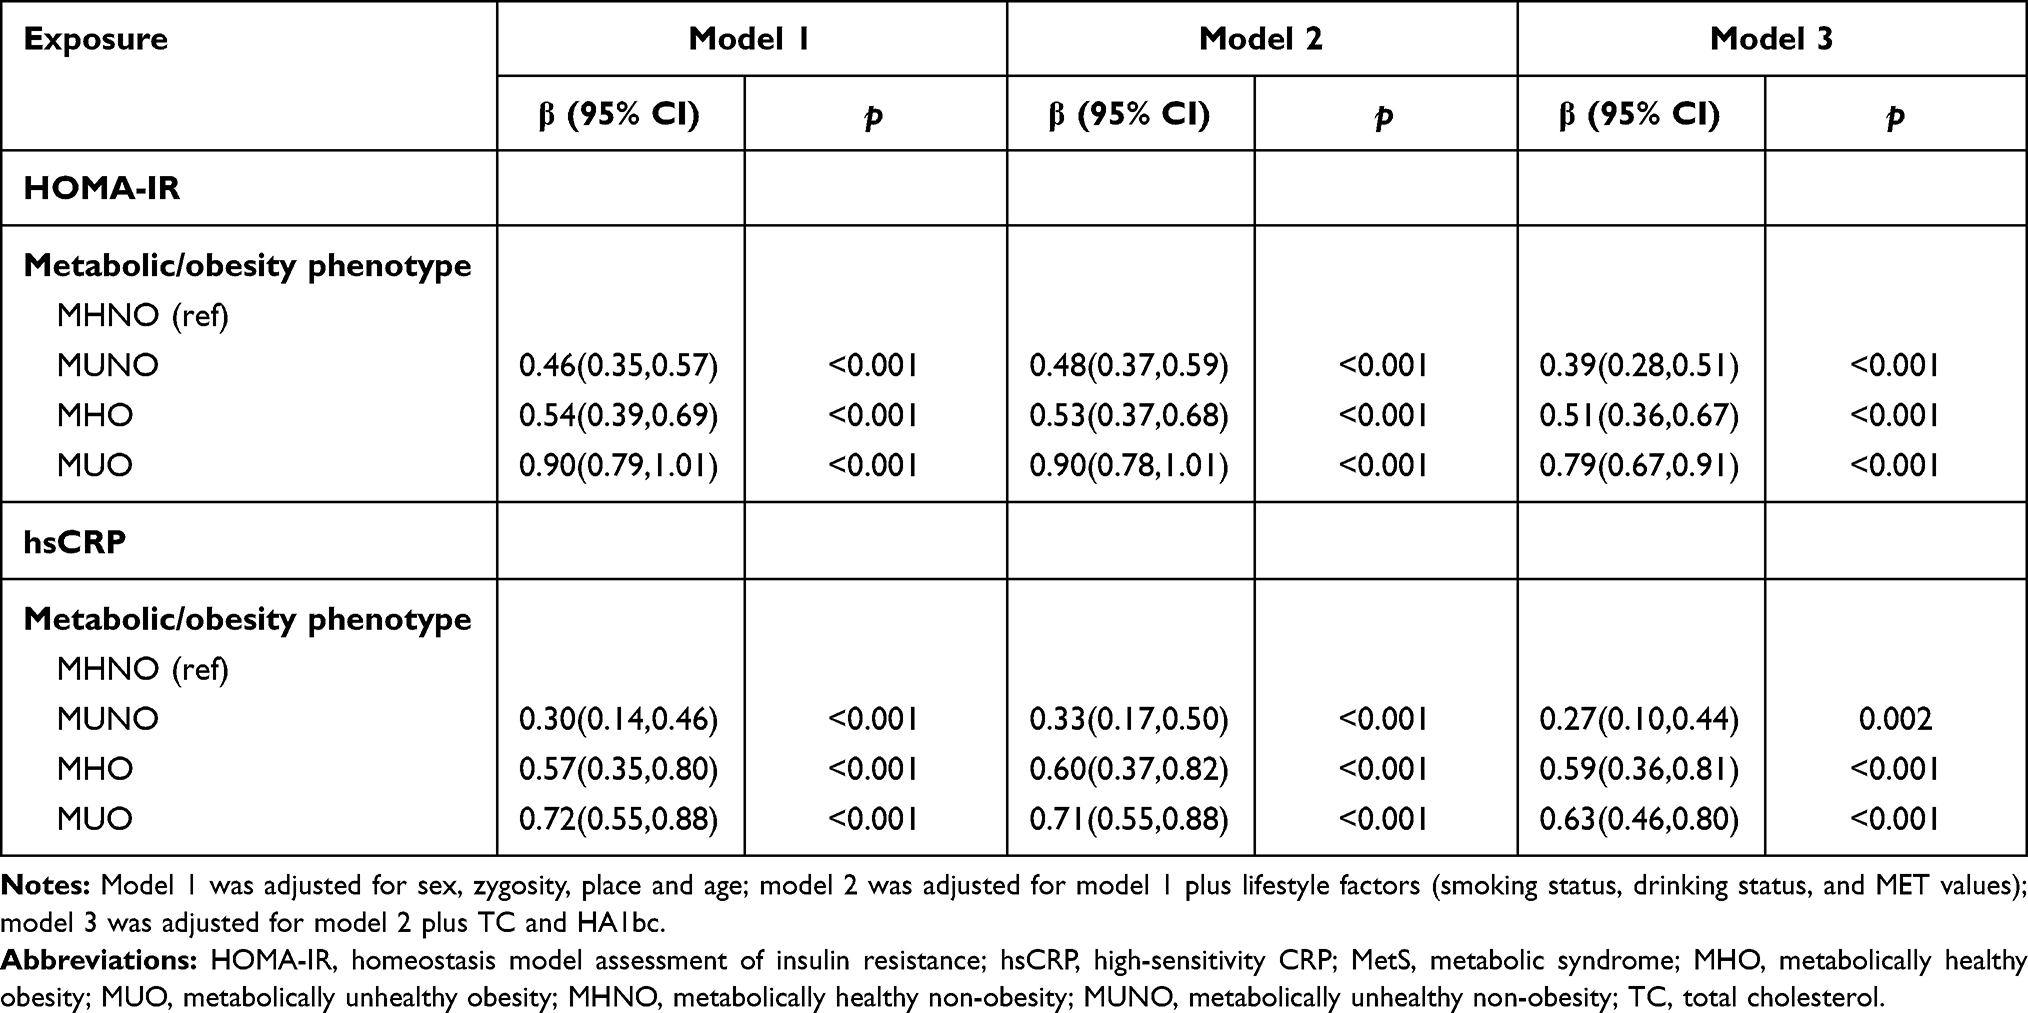 |
Table 3 Results of Mixed Linear Regression Models on the Association of Serum HOMA-IR and CRP Levels with Metabolic/Obesity Phenotypes in All Twins |
We further classified metabolic health by the number of MetS components (0, 1, 2, 3, 4) and examined the joint relation of obesity groups and MetS numbers with serum HOMA-IR and hsCRP levels (Figure 1). In multivariable-adjusted models, the levels of HOMA-IR were highest in individuals with obesity and 4 MetS components (β=1.21,95% CI: 0.95–1.47, p < 0.001), followed by non-obesity individuals with 4 MetS components (β=0.91,95% CI: 0.62–1.19, p < 0.001), and obese individuals with 3 MetS components (β=0.88,95% CI: 0.65–1.12, p < 0.001) compared with those in non-obesity without any MetS component. With respect to levels of hsCRP, compared with MHUO group, participants with obesity and any MetS component had similar higher levels of hsCRP.
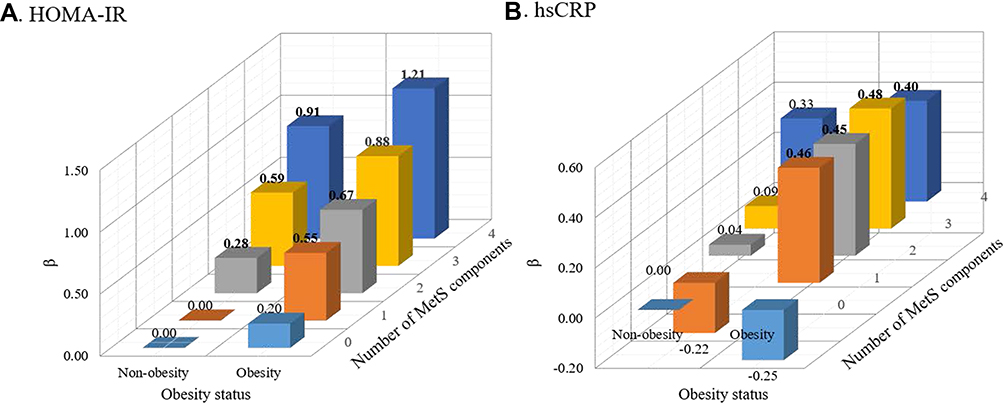 |
Figure 1 (A) Association between obesity status, number of MetS components and level of HOMA-IR. (B) Association between obesity status, number of MetS components and level of hsCRP. The bolded number means the correlation was significant at p<0.05. The adjusted covariates included sex, zygosity, place, age, lifestyle factors (smoking, drinking, and physical activity), TC and HA1bC. Abbreviations: MetS, metabolic syndrome; HOMA-IR, homeostasis model assessment of insulin resistance; hsCRP, high-sensitivity CRP. |
Within Twin-Pair Analysis
In within twin-pair analyses controlling for genetic and familial influences among 541 complete twin pairs, associations of metabolic status with serum HOMA-IR and hsCRP levels are presented in Table 4. Compared to MH group, the MU group had significantly higher levels of HOMA-IR in both MZ and DZ twin-pair analysis adjusting for obesity indicators and other covariates. With respect to serum hsCRP level, no significant associations were found between hsCPR with metabolic status in both MZ and DZ twin-pair analysis. Sensitivity analysis excluding 35 twin pairs reared apart did not change the results (Table S5).
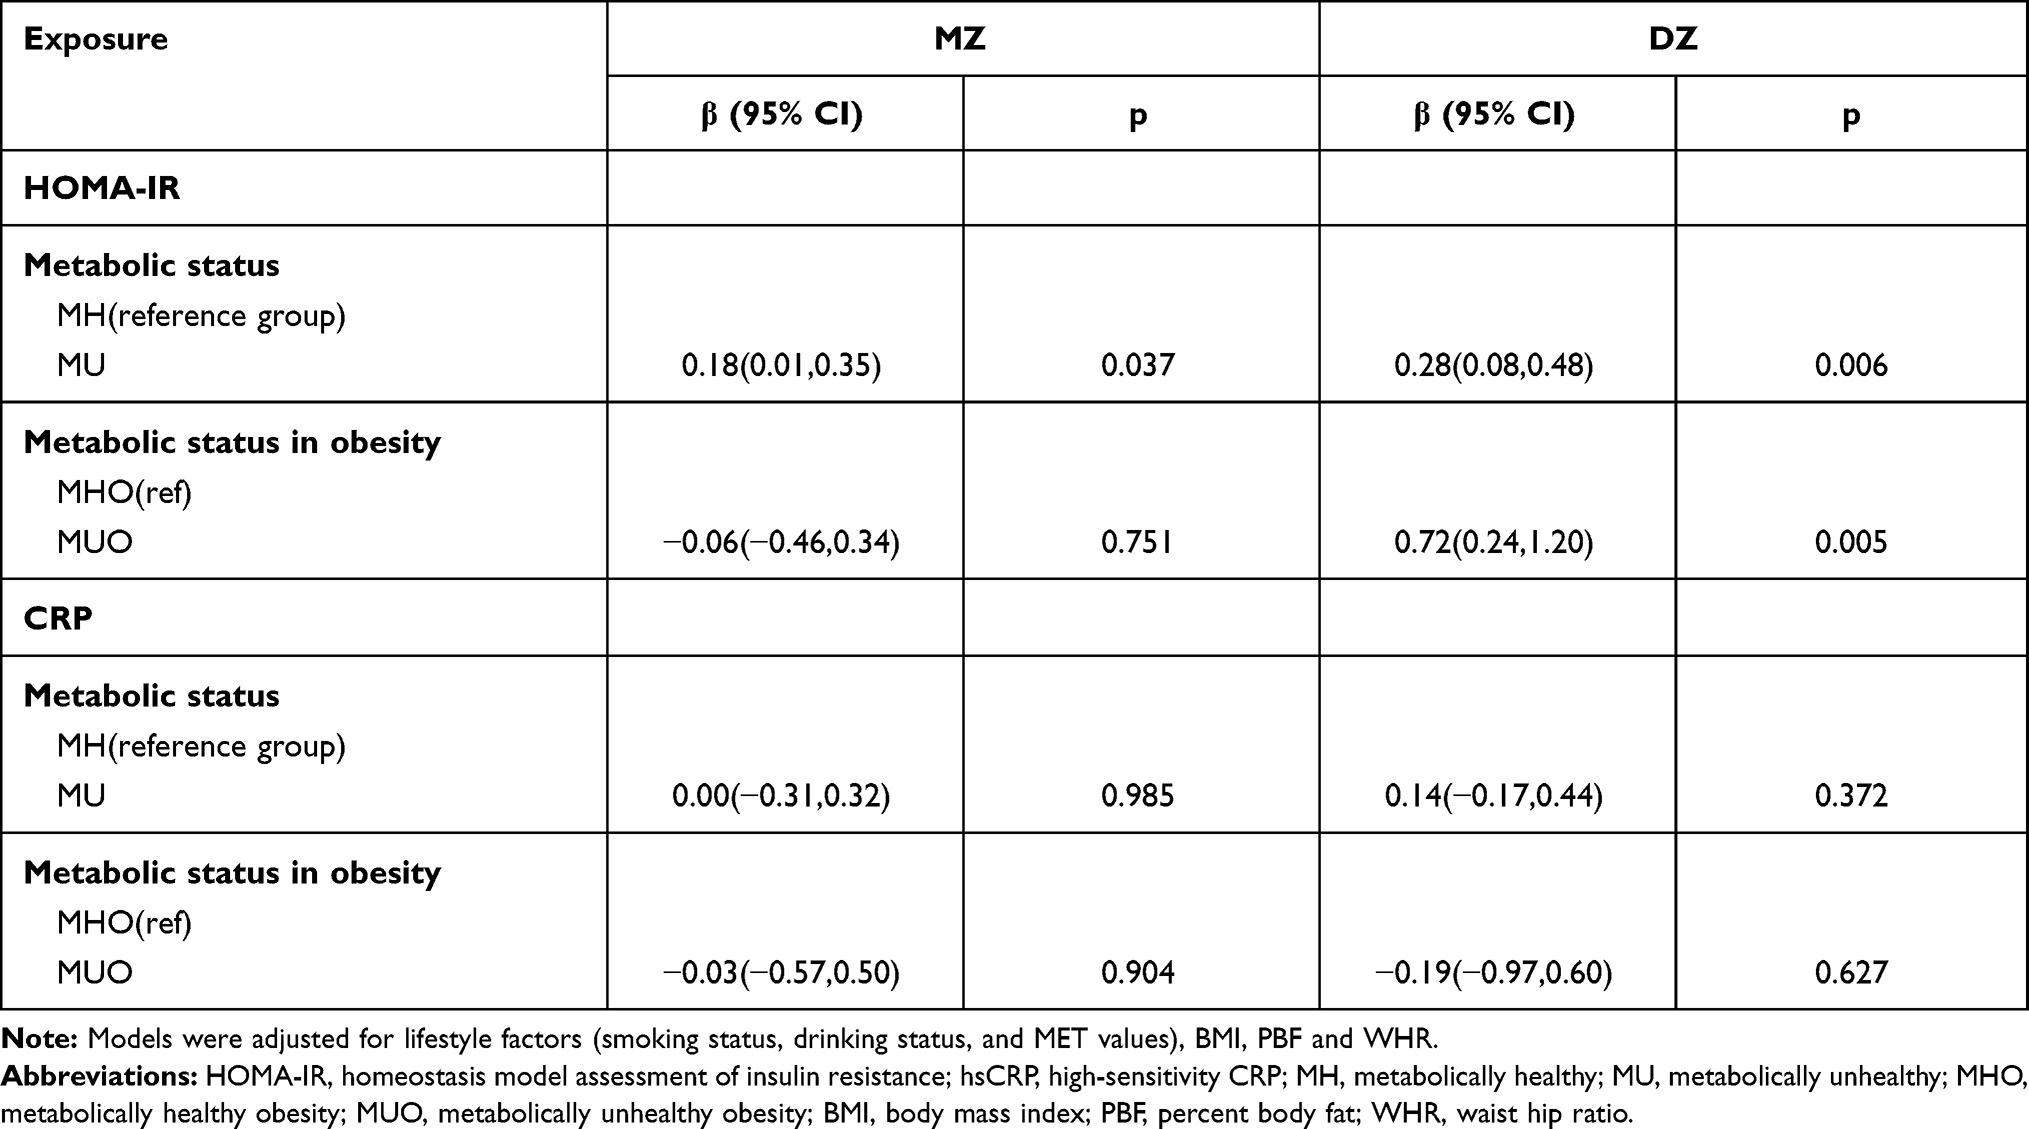 |
Table 4 Results of Fixed Linear Regression Models on the Association of Serum HOMA-IR and hsCRP Levels with Metabolic Status in Twin Pairs |
Similarly, we analyzed the associations of number of MetS components with serum HOMA-IR and hsCRP levels (Table S6). The results showed that, compared with twins without any MetS component, level of serum HOMA-IR were significantly higher in twins with 4 MetS components in both MZ and DZ twin-pair analysis. Among obesity group, when compared with obese twins without any MetS component, obese twins with 4 MetS components had significantly higher level of serum HOMA-IR (β=1.01,95% CI: 0.07–1.96, p = 0.036, Table S6). No significant associations were found between hsCPR with number of MetS components in both MZ and DZ twin-pair analysis.
Results of metabolic/obesity phenotypes with insulin resistance, and chronic inflammation level are shown in Table 5. After adjustment for lifestyle factors and shared genetic and familial factors in MZ twin-pair analysis, the level of HOMA-IR was higher in MUNO (β=0.42, 95% CI: 0.21–0.64, p <0.001), MHO (β=0.68, 95% CI: 0.36–1.00, p <0.001) and MUO (β=0.69, 95% CI: 0.46–0.91, p <0.001) twins, compared with their MHNO counterparts. Twins with MHO or MUO had a significantly higher level of hsCRP compared with their MHNO counterparts. No significant differences were observed between MUNO and MHNO twins with respect to hsCRP level. Sensitivity analysis excluding 35 twin pairs reared apart did not change the results (Table S7).
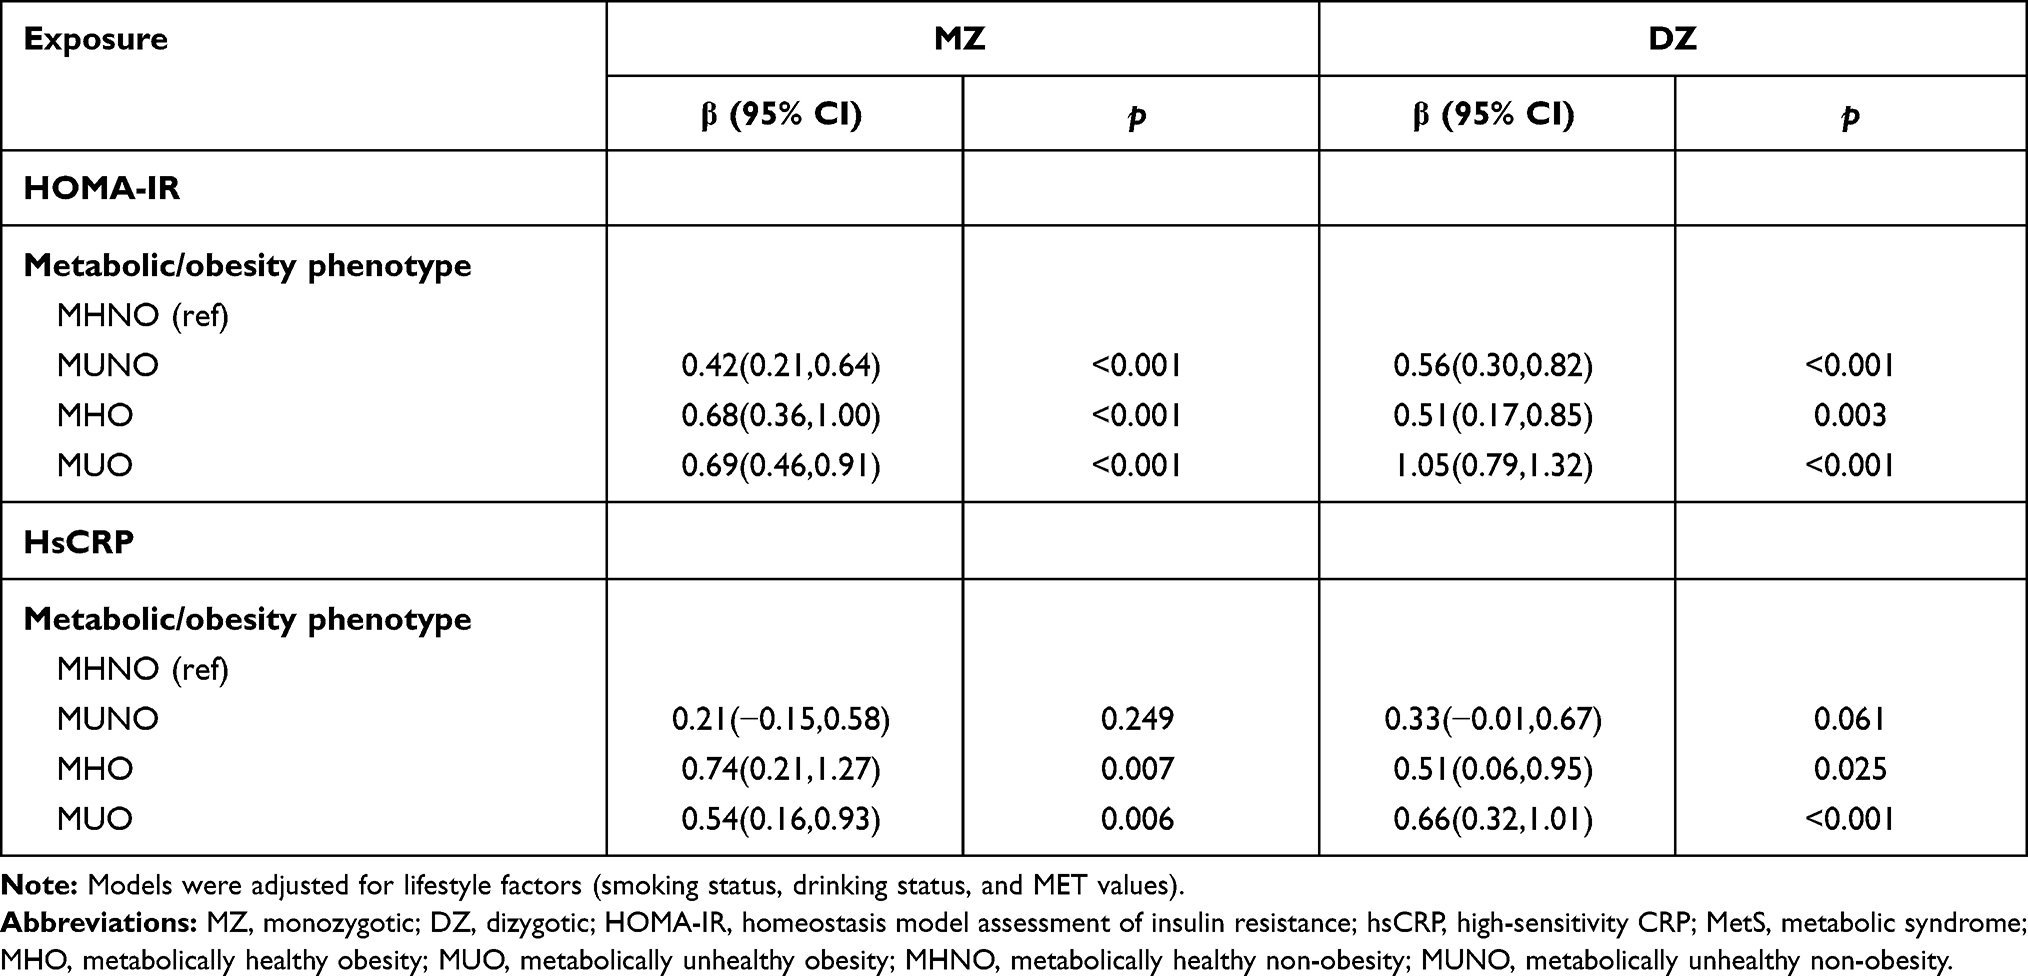 |
Table 5 Results of Fixed Linear Regression Models on the Association of Serum HOMA-IR and hsCRP Levels with Metabolic/Obesity Phenotypes in Twin Pairs |
Discussion
In this Chinese twin sample, we found that obesity is a heterogeneous condition. A certain proportion of obese individuals have a normal metabolic profile while a number of non-obese adults present with a clustering of metabolic abnormalities. Serum HOMA-IR level was higher in MUO, MHO, and MUNO as compared with MHNO group and the highest level was seen in twins with both obesity and 4 MetS components. The inflammation level, evaluated by hsCRP was similar among obese twins with various number of MetS components, which differed significantly to MHNO.
We showed that in this study, MHNO and MHO individuals were younger, with a higher proportion of women, and had lower rates of smoking and drinking than MUNO and MUO phenotype. Evidence existed that lifestyle factors might play an important role in the heterogeneity metabolic status of obesity through modulating whole-body energy metabolism and insulin sensitivity.32 The prevalence of MHO in our cohort of obese twins was 20.3% and data of different authors showed that the prevalence of this phenomenon in obese individuals varies widely from 6.0% to 38.4%.33
Significant correlation of insulin metabolism and metabolic health status was found in present study, with an obvious linear trend between the number of the MetS components and IR. Compared with MHNO phenotype, serum HOMA-IR level increased gradually in MUNO, MHO and MUO group showing the simultaneous contributions of MetS and obesity to IR. Significant results also exist in reared together MZ twin pairs where genetic background, early intrauterine environment and family upbringing environment were perfectly matched. Our findings confirm those results conducted in the general population which indicated that insulin resistance indices are elevated in MetS compared to the individuals without MetS.24,34 A cross-sectional study of 405 participants showed insulin resistance are elevated in MetS compared to the normal population.34 Obesity is a well-established risk factor for IR, and previous studies indicated IR plays a major role in the pathogenesis of cardiometabolic diseases and is a common consequence of ectopic accumulation of visceral fat and intracellular lipid.35–37 When adjusted for obesity indicators, the association between metabolic status and insulin resistance attenuated, but remained statistically significant. Besides, we found the number of MetS components correlated with IR regardless of obesity status.
In the past decade it has become increasingly clear that persons with similar fat mass may present with completely distinct clinical metabolic profiles.33,38 Similarly, we found a higher HOMA-IR levels of MUO with MHO group. This was consistent to previous studies conducted in obese adults.24,39–41 In a study of 1458 adults from two independent populations, individuals with MUO had significantly higher level of HOMA-IR than MHO group.24 Another cross-sectional study of 3844 Spanish Caucasian adults showed the same results.41 Recently, genome-wide association studies identified serval genes possibly controlling both body extra fat distribution and the metabolic profile of excess adiposity (ie, MHO or MUO).42 This was in according with our within twin-pair analysis. The difference of HOMA-IR was no longer significant between MHO and MUO phenotypes in obese MZ twin pairs but remained significant in DZ twin pairs. These observations suggested a common genetic influence existed between insulin sensitivity and MHO/MUO phenotype. Examining twins overall gives an average relationship between exposure and outcome across the twin population. If the association further persists in within MZ twin-pair comparisons we can infer that something unique to each individual twin is contributing, rather than common to both twins. On the contrary, attenuation of the association in MZ twin pairs indicated that it was confounded by genetic factors.
We found similar hsCRP levels between MHO and MUO group, which differed significantly to MHNO, and the association of numbers of MetS components with serum hsCRP began no more significant in the model additionally adjusted for obesity indicators. Studies conducted in Mitchelstown cohort participants,43 Wielkopolska general population44 and a large sample of Brazilian population23 all reported a similar level of CRP between MHO and MUO group. A study using six sets of criteria to define MHO found no significant difference of CRP with MUO subjects after multivariate analysis.45 Inconsistent findings have also been reported that MHO participants had significantly lower CRP levels than MUO.21,22,46 However, in most studies the difference in CRP levels between the two groups had no more statistical significance after adjusting for abdominal obesity or percent body fat,45,46 which was in accordance with our finding. These results suggested that abdominal obesity per se is the key role in the progress of subclinical vascular inflammation. Obesity in absence of metabolic risk factors is not entirely benign and MHO population have a higher risk of CVD and all-cause mortality than MHNO group.47
Our research has the following advantages. First, we applied a twin design to control for genetic and familial factors, and central obesity was used instead of general obesity in the analysis. Furthermore, we conducted various analyses including stratified analysis by age and excluding twins reared apart to ensure the robustness of the associations. However, our study had several limitations as well. First, the cross-sectional design restricted the ability of causal inference. Second, although WC might be a better indicator for abdominal adiposity than BMI, it cannot accurately reflect visceral fat content which is closely related to metabolic status. Finally, we did not use the gold standard for measurement of insulin resistance. However, most studies use HOMA-IR as a clinically useful surrogate measure of insulin resistance.
Conclusion
In conclusion, our findings demonstrated that obesity is a heterogeneous condition in terms of metabolic status. MHO and MUNO phenotypes are common in these Chinese twin population. Insulin resistance and inflammation level displayed various levels among different metabolic/obesity groups. MHO and MUNO phenotypes were associated with elevated IR and hsCRP and individuals with both obesity and 4 MetS components had the highest level of insulin resistance. These findings provide potential evidence for assessing and managing high-risk obesity based on metabolic status.
Data Sharing Statement
The data used to support the findings of this study are available from the corresponding author upon request.
Ethics Approval and Consent to Participate
This study was conducted in accordance with the Declaration of Helsinki. Biomedical Ethics Committee at Peking University, Beijing, China approved the study protocol. An informed consent was obtained from each participant. Data were treated with strict confidentiality and used only for scientific purposes.
Consent for Publication
Not applicable.
Acknowledgments
We thank the participants and CDC twin project staff in Jiangsu Province, Zhejiang Province, Shandong Province and Sichuan Province for their invaluable contributions to this study.
Funding
This study was supported by Special fund for Health scientific research in the public welfare (201502006, 201002007), and Key Project of Chinese Ministry of Education (310006).
Disclosure
The authors declare that they have no competing interests.
References
1. WHO. Fact sheet: Obesity and overweight. 2019.
2. Després JP. Body fat distribution and risk of cardiovascular disease: an update. Circulation. 2012;126(10):1301–1313. doi:10.1161/CIRCULATIONAHA.111.067264
3. Smith GI, Mittendorfer B, Klein S. Metabolically healthy obesity: facts and fantasies. J Clin Invest. 2019;129:3978–3989. doi:10.1172/JCI129186
4. Mongraw-Chaffin M, Foster MC, Anderson C, et al. Metabolically healthy obesity, transition to metabolic syndrome, and cardiovascular risk. J Am Coll Cardiol. 2018;71:1857–1865. doi:10.1016/j.jacc.2018.02.055
5. Zheng R, Zhou D, Zhu Y. The long-term prognosis of cardiovascular disease and all-cause mortality for metabolically healthy obesity: a systematic review and meta-analysis. J Epidemiol Community Health. 2016;70:1024–1031. doi:10.1136/jech-2015-206948
6. Bell JA, Kivimaki M, Hamer M. Metabolically healthy obesity and risk of incident type 2 diabetes: a meta-analysis of prospective cohort studies. Obes Rev. 2014;15:504–515. doi:10.1111/obr.12157
7. Gao M, Lv J, Yu C, et al. Metabolically healthy obesity, transition to unhealthy metabolic status, and vascular disease in Chinese adults: a cohort study. PLoS Med. 2020;17:e1003351. doi:10.1371/journal.pmed.1003351
8. Appleton SL, Seaborn CJ, Visvanathan R, et al. Diabetes and cardiovascular disease outcomes in the metabolically healthy obese phenotype: a cohort study. Diabetes Care. 2013;36:2388–2394. doi:10.2337/dc12-1971
9. Mørkedal B, Vatten LJ, Romundstad PR, Laugsand LE, Janszky I. Risk of myocardial infarction and heart failure among metabolically healthy but obese individuals: HUNT (Nord-Trøndelag Health Study), Norway. J Am Coll Cardiol. 2014;63(11):1071–1078. doi:10.1016/j.jacc.2013.11.035
10. Johnson W, Bell JA, Robson E, Norris T, Kivimäki M, Hamer M. Do worse baseline risk factors explain the association of healthy obesity with increased mortality risk? Whitehall II Study. Int J Obes (Lond). 2019;43:1578–1589. doi:10.1038/s41366-018-0192-0
11. Kuk JL, Rotondi M, Sui X, Blair SN, Ardern CI. Individuals with obesity but no other metabolic risk factors are not at significantly elevated all-cause mortality risk in men and women. Clin Obes. 2018;8:305–312. doi:10.1111/cob.12263
12. Hamer M, Johnson W, Bell JA. Improving risk estimates for metabolically healthy obesity and mortality using a refined healthy reference group. Eur J Endocrinol. 2017;177:169–174. doi:10.1530/EJE-17-0217
13. Caleyachetty R, Thomas GN, Toulis KA, et al. Metabolically healthy obese and incident cardiovascular disease events among 3.5 million men and women. J Am Coll Cardiol. 2017;70:1429–1437. doi:10.1016/j.jacc.2017.07.763
14. Heyn GS, Corrêa LH, Magalhães KG. The impact of adipose tissue-derived miRNAs in metabolic syndrome, obesity, and cancer. Front Endocrinol (Lausanne). 2020;11:563816. doi:10.3389/fendo.2020.563816
15. Olefsky JM, Glass CK. Macrophages, inflammation, and insulin resistance. Annu Rev Physiol. 2010;72:219–246. doi:10.1146/annurev-physiol-021909-135846
16. Ginsberg HN. Insulin resistance and cardiovascular disease. J Clin Invest. 2000;106:453–458. doi:10.1172/JCI10762
17. Lopez-Candales A, Hernández BP, Hernandez-Suarez DF, Harris D. Linking chronic inflammation with cardiovascular disease: from normal aging to the metabolic syndrome. J Nat Sci. 2017;3:4.
18. Bell JA, Hamer M, van Hees VT, Singh-Manoux A, Kivimäki M, Sabia S. Healthy obesity and objective physical activity. Am J Clin Nutr. 2015;102:268–275. doi:10.3945/ajcn.115.110924
19. Pajunen P, Kotronen A, Korpi-Hyövälti E, et al. Metabolically healthy and unhealthy obesity phenotypes in the general population: the FIN-D2D survey. BMC Public Health. 2011;11:754. doi:10.1186/1471-2458-11-754
20. Succurro E, Marini MA, Frontoni S, et al. Insulin secretion in metabolically obese, but normal weight, and in metabolically healthy but obese individuals. Obesity (Silver Spring). 2008;16(8):1881–1886. doi:10.1038/oby.2008.308
21. Karelis AD, Faraj M, Bastard JP, et al. The metabolically healthy but obese individual presents a favorable inflammation profile. J Clin Endocrinol Metab. 2005;90:4145–4150. doi:10.1210/jc.2005-0482
22. Shin MJ, Hyun YJ, Kim OY, Kim JY, Jang Y, Lee JH. Weight loss effect on inflammation and LDL oxidation in metabolically healthy but obese (MHO) individuals: low inflammation and LDL oxidation in MHO women. Int J Obes (Lond). 2006;30(10):1529–1534. doi:10.1038/sj.ijo.0803304
23. Shaharyar S, Roberson LL, Jamal O, et al. Obesity and metabolic phenotypes (metabolically healthy and unhealthy variants) are significantly associated with prevalence of elevated C-reactive protein and hepatic steatosis in a large healthy Brazilian population. J Obes. 2015;2015:178526. doi:10.1155/2015/178526
24. Iglesias MA, Penas SA, López AP, et al. Metabolically healthy obese individuals present similar chronic inflammation level but less insulin-resistance than obese individuals with metabolic syndrome. PLoS One. 2017;12:e190528.
25. Loos R, Kilpeläinen TO. Genes that make you fat, but keep you healthy. J Intern Med. 2018;284(5):450–463. doi:10.1111/joim.12827
26. Li L, Gao W, Yu C, et al. The Chinese National Twin Registry: an update. Twin Res Hum Genet. 2013;16:86–90. doi:10.1017/thg.2012.148
27. Wang B, Gao W, Yu C, et al. Determination of zygosity in adult chinese twins using the 450K methylation array versus questionnaire data. PLoS One. 2015;10:e123992.
28. Ainsworth BE, Haskell WL, Whitt MC, et al. Compendium of physical activities: an update of activity codes and MET intensities. Med Sci Sports Exerc. 2000;32:S498–504. doi:10.1097/00005768-200009001-00009
29. Liao C, Gao W, Cao W, et al. Associations of body composition measurements with serum lipid, glucose and insulin profile: a chinese twin study. PLoS One. 2015;10:e140595. doi:10.1371/journal.pone.0140595
30. Executive Summary of The Third Report of The National Cholesterol Education Program (NCEP) expert panel on detection, evaluation, and treatment of high blood cholesterol in adults (Adult Treatment Panel III). JAMA. 2001;285:2486–2497.
31. Weng J, Ji L, Jia W, et al. Standards of care for type 2 diabetes in China. Diabetes Metab Res Rev. 2016;32:442–458. doi:10.1002/dmrr.2827
32. Primeau V, Coderre L, Karelis AD, et al. Characterizing the profile of obese patients who are metabolically healthy. Int J Obes (Lond). 2011;35:971–981. doi:10.1038/ijo.2010.216
33. Iacobini C, Pugliese G, Blasetti FC, Federici M, Menini S. Metabolically healthy versus metabolically unhealthy obesity. Metabolism. 2019;92:51–60. doi:10.1016/j.metabol.2018.11.009
34. Pandit K, Mukhopadhyay P, Chatterjee P, Majhi B, Chowdhury S, Ghosh S. Assessment of Insulin resistance indices in individuals with lean and obese metabolic syndrome compared to normal individuals: a population based study. J Assoc Physicians India. 2020;68:29–33.
35. Stinkens R, Goossens GH, Jocken JW, Blaak EE. Targeting fatty acid metabolism to improve glucose metabolism. Obes Rev. 2015;16:715–757.
36. Shulman GI. Ectopic fat in insulin resistance, dyslipidemia, and cardiometabolic disease. N Engl J Med. 2014;371:1131–1141. doi:10.1056/NEJMra1011035
37. Kahn SE, Hull RL, Utzschneider KM. Mechanisms linking obesity to insulin resistance and type 2 diabetes. Nature. 2006;444:840–846. doi:10.1038/nature05482
38. Vogelzangs N, van der Kallen C, van Greevenbroek M, et al. Metabolic profiling of tissue-specific insulin resistance in human obesity: results from the Diogenes study and the Maastricht Study. Int J Obes (Lond). 2020;44(6):1376–1386. doi:10.1038/s41366-020-0565-z
39. Poggiogalle E, Lubrano C, Gnessi L, et al. The decline in muscle strength and muscle quality in relation to metabolic derangements in adult women with obesity. Clin Nutr. 2019;38:2430–2435. doi:10.1016/j.clnu.2019.01.028
40. Berezina A, Belyaeva O, Berkovich O, et al. Prevalence, risk factors, and genetic traits in metabolically healthy and unhealthy obese individuals. Biomed Res Int. 2015;2015:548734. doi:10.1155/2015/548734
41. Martínez-Larrad MT, Corbatón AA, Del PN, Ibarra RJ, Gabriel R, Serrano-Ríos M. Profile of individuals who are metabolically healthy obese using different definition criteria. A population-based analysis in the Spanish population. PLoS One. 2014;9:e106641. doi:10.1371/journal.pone.0106641
42. Yaghootkar H, Lotta LA, Tyrrell J, et al. Genetic evidence for a link between favorable adiposity and lower risk of Type 2 diabetes, hypertension, and heart disease. Diabetes. 2016;65:2448–2460. doi:10.2337/db15-1671
43. Phillips CM, Perry IJ. Does inflammation determine metabolic health status in obese and nonobese adults? J Clin Endocrinol Metab. 2013;98:E1610–9. doi:10.1210/jc.2013-2038
44. Jamka M, Krzyżanowska-Jankowska P, Mądry E, Lisowska A, Bogdański P, Walkowiak J. No difference in lactoferrin levels between metabolically healthy and unhealthy obese women. Nutrients. 2019;11(9):1976. doi:10.3390/nu11091976
45. Marques-Vidal P, Velho S, Waterworth D, Waeber G, von Känel R, Vollenweider P. The association between inflammatory biomarkers and metabolically healthy obesity depends of the definition used. Eur J Clin Nutr. 2012;66:426–435.
46. Koster A, Stenholm S, Alley DE, et al. Body fat distribution and inflammation among obese older adults with and without metabolic syndrome. Obesity (Silver Spring). 2010;18:2354–2361. doi:10.1038/oby.2010.86
47. Huang MY, Wang MY, Lin YS, et al. The association between metabolically healthy obesity, cardiovascular disease, and all-cause mortality risk in Asia: a systematic review and meta-analysis. Int J Environ Res Public Health. 2020;17.
 © 2021 The Author(s). This work is published and licensed by Dove Medical Press Limited. The full terms of this license are available at https://www.dovepress.com/terms.php and incorporate the Creative Commons Attribution - Non Commercial (unported, v3.0) License.
By accessing the work you hereby accept the Terms. Non-commercial uses of the work are permitted without any further permission from Dove Medical Press Limited, provided the work is properly attributed. For permission for commercial use of this work, please see paragraphs 4.2 and 5 of our Terms.
© 2021 The Author(s). This work is published and licensed by Dove Medical Press Limited. The full terms of this license are available at https://www.dovepress.com/terms.php and incorporate the Creative Commons Attribution - Non Commercial (unported, v3.0) License.
By accessing the work you hereby accept the Terms. Non-commercial uses of the work are permitted without any further permission from Dove Medical Press Limited, provided the work is properly attributed. For permission for commercial use of this work, please see paragraphs 4.2 and 5 of our Terms.