")
Back to Journals » Clinical Interventions in Aging » Volume 14
Associations of informant-based sleep reports with Alzheimer’s disease pathologies
Authors Shokouhi S
Received 10 May 2019
Accepted for publication 13 July 2019
Published 9 September 2019 Volume 2019:14 Pages 1631—1642
DOI https://doi.org/10.2147/CIA.S215208
Checked for plagiarism Yes
Review by Single anonymous peer review
Peer reviewer comments 2
Editor who approved publication: Dr Richard Walker
Sepideh Shokouhi
On behalf of The Alzheimer’s Disease Neuroimaging Initiative
Center for Cognitive Medicine, Department of Psychiatry and Behavioral Sciences, Vanderbilt University Medical Center, Nashville, USA
Correspondence: Sepideh Shokouhi
Department of Psychiatry and Behavioral Sciences, Vanderbilt University Medical Center, 189 B Kenner Ave, Nashville, TN 37205, USA
Tel +1 631 513 0547
Email [email protected]
Purpose: Recent studies have found associations of increased brain amyloid beta (Aβ) accumulation and several abnormal sleep-wake patterns, including shorter latency and increased fragmentation in preclinical Alzheimer’s disease (AD). There is little known about the relationship between sleep and tau. The objective of this study was to understand the associations of both tau and Aβ with early signs of sleep and night-time behavior changes in clinically normal elderly adults. Specifically, we have addressed the question of how informant-based subjective sleep reports are linked to regional [18F]flortaucipir and [18F]florbetapir uptake.
Methods: Imaging and behavioral data from 35 subjects were obtained from the Alzheimer’s Disease Neuroimaging Initiative. The Neuropsychiatric Inventory Sleep (NPI-sleep) Questionnaire was used to assess the sleep and night-time behavior changes. Regional tau-positron emission tomography (PET) (entorhinal, brainstem) and Aβ-PET (posterior cingulate, precuneus, medial orbitofrontal) uptake values were calculated. A series of linear regression analyses were used to determine the combination of sleep symptoms that built the best models to predict each pathology.
Results: Informant-based reports of abnormal night-time behavior (NPI questions k3, k5, and k8) were significantly associated with increased entorhinal tau and Aβ (all regions) accumulation. Interestingly, informant-based reports of sleep deficiencies without abnormal nigh-time activity (NPI questions k1, k2, and k6) were negatively associated with entorhinal tau burden.
Conclusion: Detection of abnormal night-time behaviors (wandering, pacing, other inappropriate activities) by family members indicates early signs of both AD pathologies and may encourage the affected individuals to seek help by health care providers for detailed cognitive/neurobehavioral assessments.
Keywords: Aβ, tau, positron emission tomography, mild cognitive impairment, sleep, neuropsychiatric inventory
Introduction
Sleep and circadian rhythm disturbances are frequent in Alzheimer’s disease (AD)1–5 and may appear before the onset of the clinical symptoms. Abnormal sleep patterns can be detected and quantitatively characterized by traditional polysomnography and motion-based actigraphy devices. An increasing number of actigraphy studies have reported associations between increased brain amyloid beta (Aβ) burden and several abnormal sleep-wake patterns, including shorter sleep latency6 and increased night-time sleep fragmentation7 as early as in clinically normal elderly adults. Self-reported and informant-based questionnaires can also help evaluate the overall sleep quality. While these subjective assessments do not provide accurate measures of sleep-wake patterns, they can be administered without the necessity of recording sleep data for a period of time. Spira et al found associations of self-reported measures of excessive daytime sleepiness/napping with elevated Aβ burden in cognitively normal community-dwelling elderly adults.8 Another study on non-demented late-middle-aged adults found that participants with self-reported sleep problems and inadequate sleep had greater amyloid burden in several AD-sensitive regions, including medial orbitofrontal cortex, cingulate gyrus, and precuneus.9 In comparison to Aβ, there is little known about the relationship between sleep and tau. The influence of tau pathology could be relevant to the sleep-wake alterations in AD, possibly due to the presence of abnormal tau accumulation in sleep-regulating regions such as brainstem.10,11
The objective of this study was to understand the associations of both Aβ and tau with early signs of changes in sleep and night-time behavior in clinically normal elderly adults. Specifically, we have addressed the question of how informant-based subjective sleep reports are linked to regional [18F]flortaucipir and [18F]florbetapir uptake. Sleep disturbances are among the major causes of patient institutionalization in AD.12 Simple sleep questionnaires that can be readily administered and evaluated by family members may play an important role in detecting early warning signs of AD and encourage the affected individuals to seek help by health care providers for cognitive/neurobehavioral assessments. Detailed characterization of subjective reports of sleep and night-time behavioral changes may render a valuable pre-screening tool for pathological prediction.
Materials and methods
Study populations
Data were obtained from the Alzheimer’s Disease Neuroimaging Initiative (ADNI) database (adni.loni.usc.edu). This study was approved by the Institutional Review Board of Vanderbilt University Medical Center (#181429). ADNI was launched in 2003 as a public–private partnership, led by Principal Investigator Michael W. Weiner, MD. The primary goal of ADNI has been to test whether serial magnetic resonance imaging (MRI), positron emission tomography (PET), other biological markers, and clinical and neuropsychological assessment can be combined to measure the progression of mild cognitive impairment (MCI) and early AD. Demographic, clinical, and imaging data for this study were collected from 35 clinically normal ADNI subjects who had Aβ PET scan, tau PET scan, and at least one abnormal sleep change in their informant-based sleep report. ADNI CN subjects have a Mini-Mental State Examination, MMSE13 memory scores of 24–30 (inclusive), a clinical dementia rating of 0, and education-adjusted score on delayed recall of paragraph A from Wechsler Memory Scale Logical Memory II (E-WMS) ≥9 for 16 or higher educational years, ≥5 for 8–15 years of education, ≥3 for 0–7 years of education. CN subjects are not diagnosed with dementia or MCI.
The Neuropsychiatric Inventory Sleep Questionnaire (NPI-sleep)
NPI is based on questions addressed to an informed caregiver to assess behavioral changes including sleep problems. The NPI-sleep questionnaire pertains to recent changes in the patient’s sleep behavior. The initial question determines the presence or absence of abnormal sleep changes. A positive answer (presence of resent sleep problems) is followed by eight questions (k1–k8) to determine the specific nature of the abnormal sleep behavior. These include difficulties in falling asleep (k1), getting up during the night (k2), pacing and wandering at night (k3), awakening the caregiver during night (k4), awaken at night or too early in the morning and thinking that it is time to start the day (k5), waking up too early in the morning (k6), excessive daytime napping (k7), and other abnormal night-time behaviors (k8). The NPI-sleep questionnaire is summarized in Table 1.
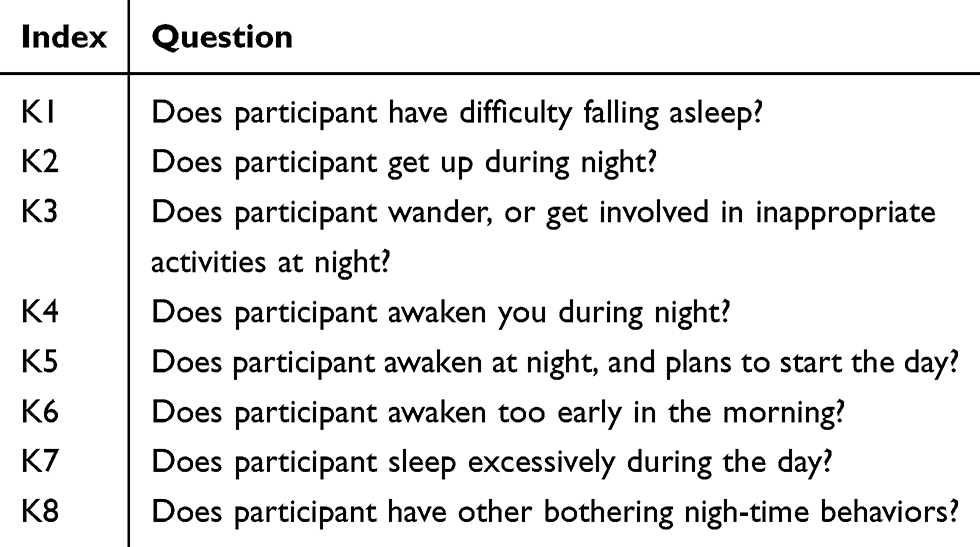 |
Table 1 NPI-sleep questions |
PET data acquisition and preprocessing
All ADNI [18F]Florbetapir (for Aβ) and [18F]Flortaucipir (for tau) scans were acquired at participating sites and followed the standardized ADNI PET protocols (adni.loni.usc.edu).
Tau PET
The PET acquisitions started with the injection of 370 MBq ±10% of [18F]Flortaucipir and followed by a 30 mins (6×5 mins frames) scan starting at 75–105 mins after the injection. All ADNI [18F]Flortaucipir images were uploaded to University of Southern California Laboratory of Neuroimaging (LONI) where they were preprocessed and the regional tracer uptakes were calculated in LONI by using Freesurfer-defined cortical regions on the subjects’ T1-weighted volumetric MP-RAGE. The Freesurfer processing of MRI volumes included skull-stripping, segmentation, and delineation of cortical and subcortical regions. Subjects’ PET frames were coregistered, averaged, and smoothed to obtain a resolution of 8 mm full width at half maximum. The regional gray matter masks were applied to PET images to extract the mean uptake values, which were divided by the cerebellar gray matter uptake to determine the standardized uptake value ratios (SUVRs). The size of these regions and their mean PET uptake values are available for download in ADNI archive. The mean regional tau PET uptake values from three regions (left and right entorhinal and brainstem) were downloaded. The entorhinal cortex was selected because it is one of the earliest affected regions by tau pathology.14 Brainstem was selected due to its importance as a sleep-regulating region.10,11
Aβ PET
The PET acquisitions started with the injection of 370 MBq ±10% of [18F]Florbetapir and followed by a and 20 mins scan starting 50 mins post-injection.15 Similar to ADNI tau acquisition and processing, all [18F]Florbetapir images were uploaded to the LONI where they were preprocessed and the regional masks were calculated by using Freesurfer-defined cortical regions on the subjects’ T1-weighted MRI volumes. We downloaded the mean regional Aβ PET uptake values from six regions (left and right posterior cingulate, left and right precuneus, left and right medial orbitofrontal) and normalized them by the whole cerebellum. These regions were selected because they are known to be affected early by the Aβ accumulation.16–18 In addition to regional Aβ uptake values, the mean Aβ tracer uptake from a cortical summary region of interest (ROI) was downloaded to determine whether a subject is Aβ-positive or Aβ-negative. The summary ROI consisted of four cortical regions (frontal, anterior/posterior cingulate, lateral parietal, lateral temporal). The weighted means of these regions were calculated and divided by the whole cerebellum mean uptake. A threshold of 1.11 was applied to determine the Aβ status.
Statistical analysis
Each NPI-sleep question (k1–k8) was scored by the informant (zero for the absence and one for the presence of each specific symptom). To determine associations between each regional Aβ/tau accumulation and informant-based sleep reports, we conducted three steps of regression analysis starting with a backward-elimination regression19 for each pathology (regional tau and Aβ SUVR values) as outcome. The sleep symptoms k1–k8 were included as categorical variables. The backward-elimination process tests the removal of each predictor using a chosen model fit criterion (Akaike information), and step-wise removing predictors with the most statistically insignificant deterioration of the fit to determine which combination of variables (from k1–k8) builds the strongest model to fit a given pathological measure. The sleep variables of the strongest model were subsequently included in a second linear regression model as predictors along with age, sex, and Apolipoprotein Ɛ4 (APOE-Ɛ4) status as covariates to determine the sign of the coefficients associated with each sleep variable for predicting each regional Aβ/tau accumulation (outcomes). A positive coefficient sign indicates that as the predictor increases, the outcome variable also increases. A negative sign indicates that as the predictor increases, the outcome variable decreases. For each regional Aβ/tau, the scores of all sleep variables with the same direction (positive or negative) of coefficient sign were added together and included as non-categorical variable (total score) in a third linear regression model to determine how these total scores predicted the corresponding regional Aβ/tau burden. Figure 1 illustrates the described statistical analyses pipeline for a single regional SUVR (example: Aβ SUVR in the posterior cingulate cortex).
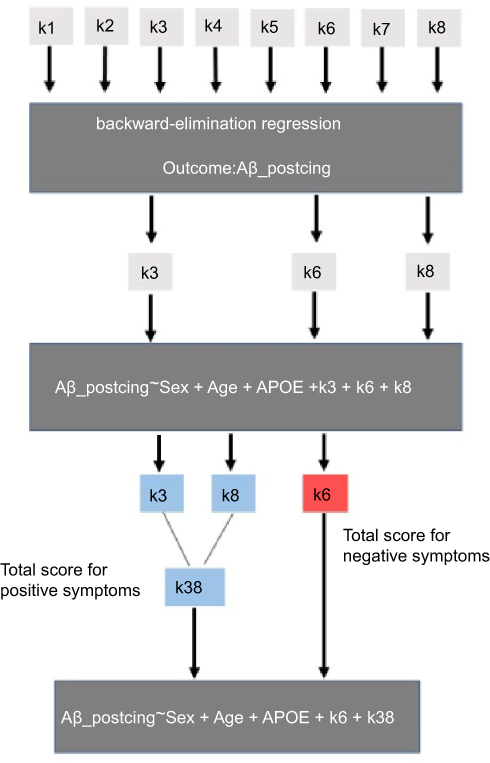 |
Figure 1 Pipeline of the statistical analyses. |
Results
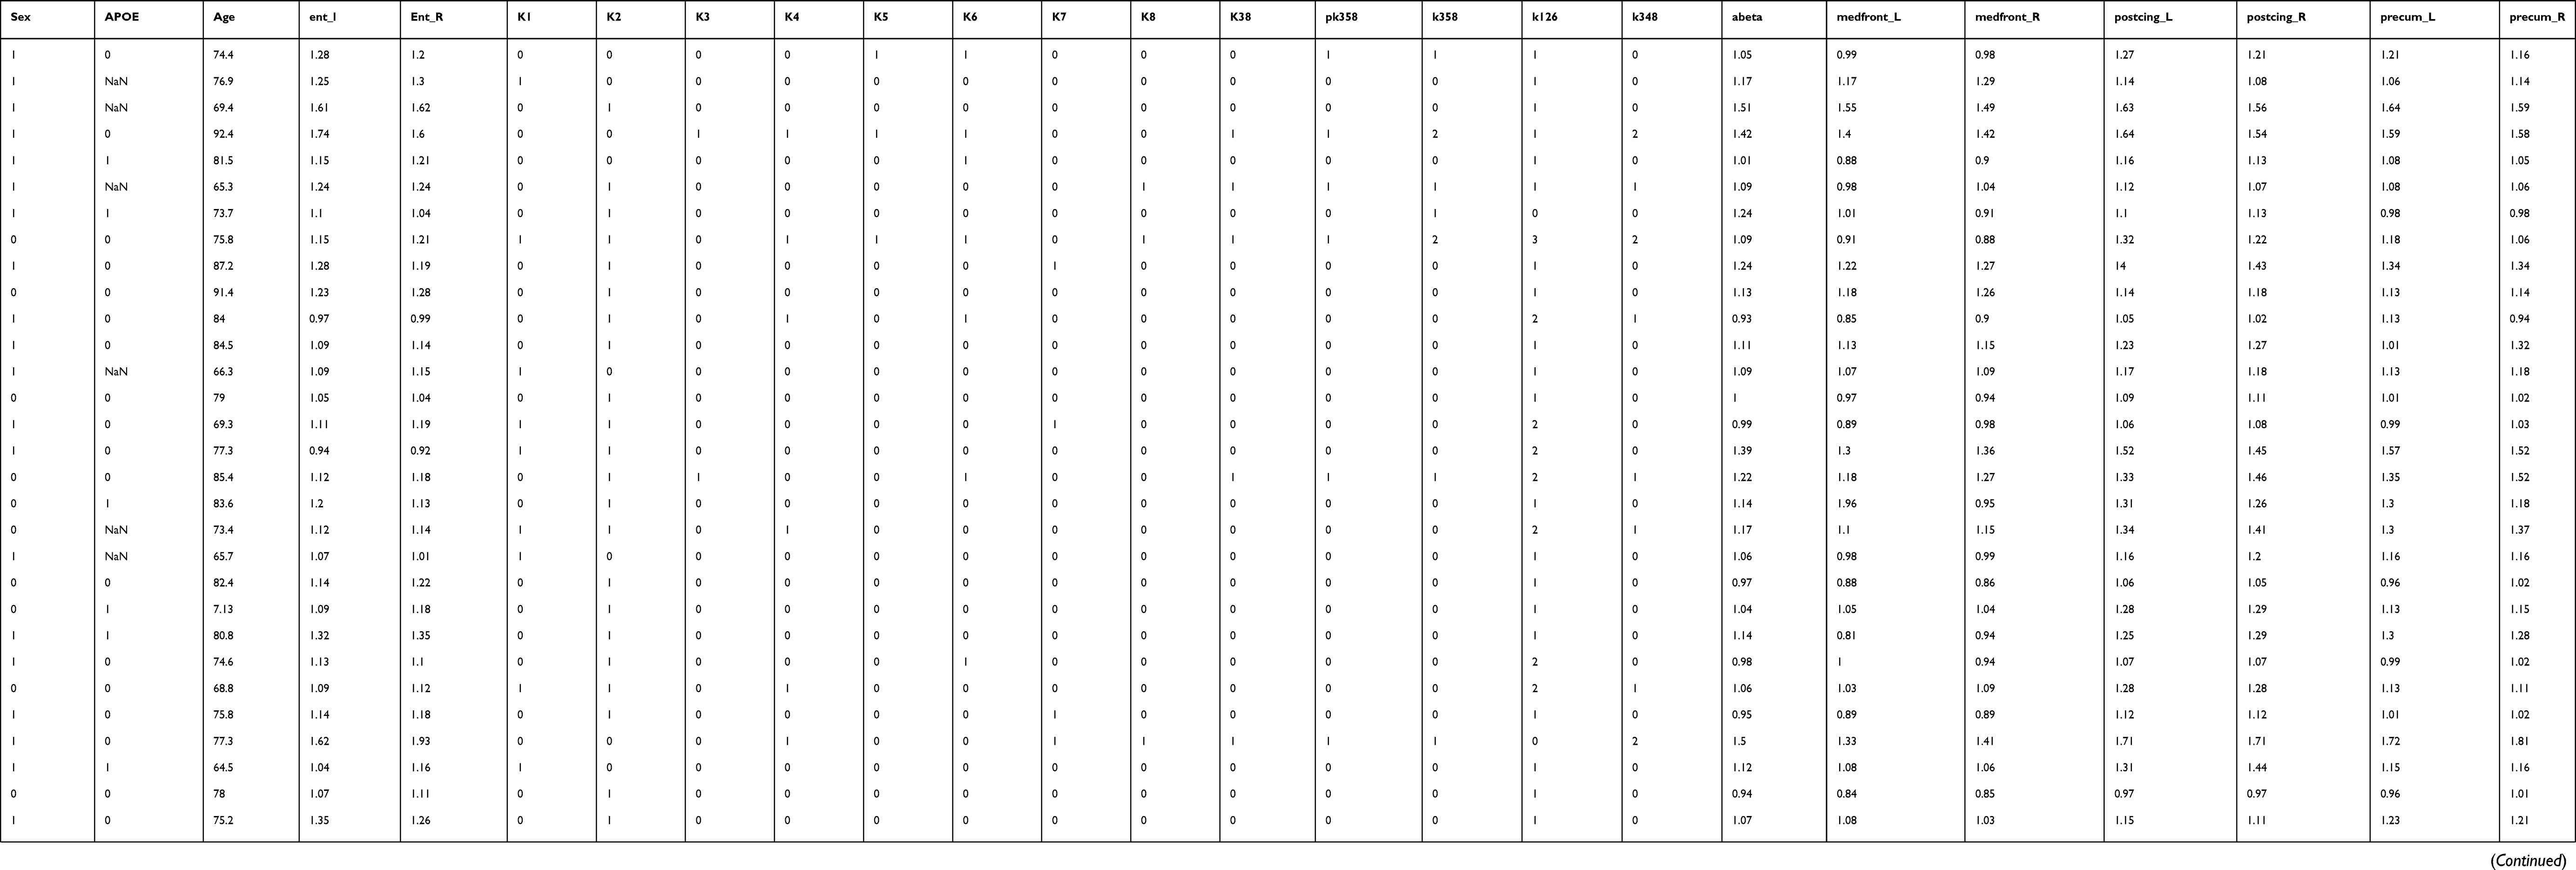
Data from 35 CN subjects were used for this study (Table 2). Approximately, half of the subjects were APOE-ε4 carriers and had Aβ-positive scans. Sixty-six percent of the subjects were women.
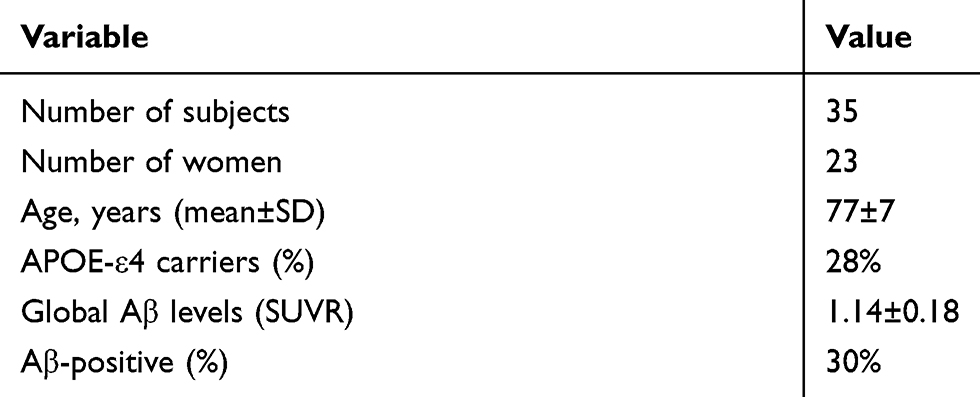 |
Table 2 Subject characteristics |
Backward-elimination regression analysis
Table 3 shows the NPI-sleep questionnaires that were selected by the backward-elimination regression process as the combination of predictors building the strongest model for predicting each regional Aβ burden (rows). The non-empty cells indicate the presence of the NPI symptom (with either positive or negative correlation) in the strongest backward elimination model. For most Aβ regions, the NPI-sleep scores k3 (abnormal wandering and pacing at night), k6 (awaken earlier than was his/her habit), and k8 (other abnormal nigh-time behavior) were present in the strongest models for predicting Aβ burden. The coefficient signs were positive for k3 and k8 but negative for k6. Excessive sleep during day (k7) was not present in any of the strongest models.
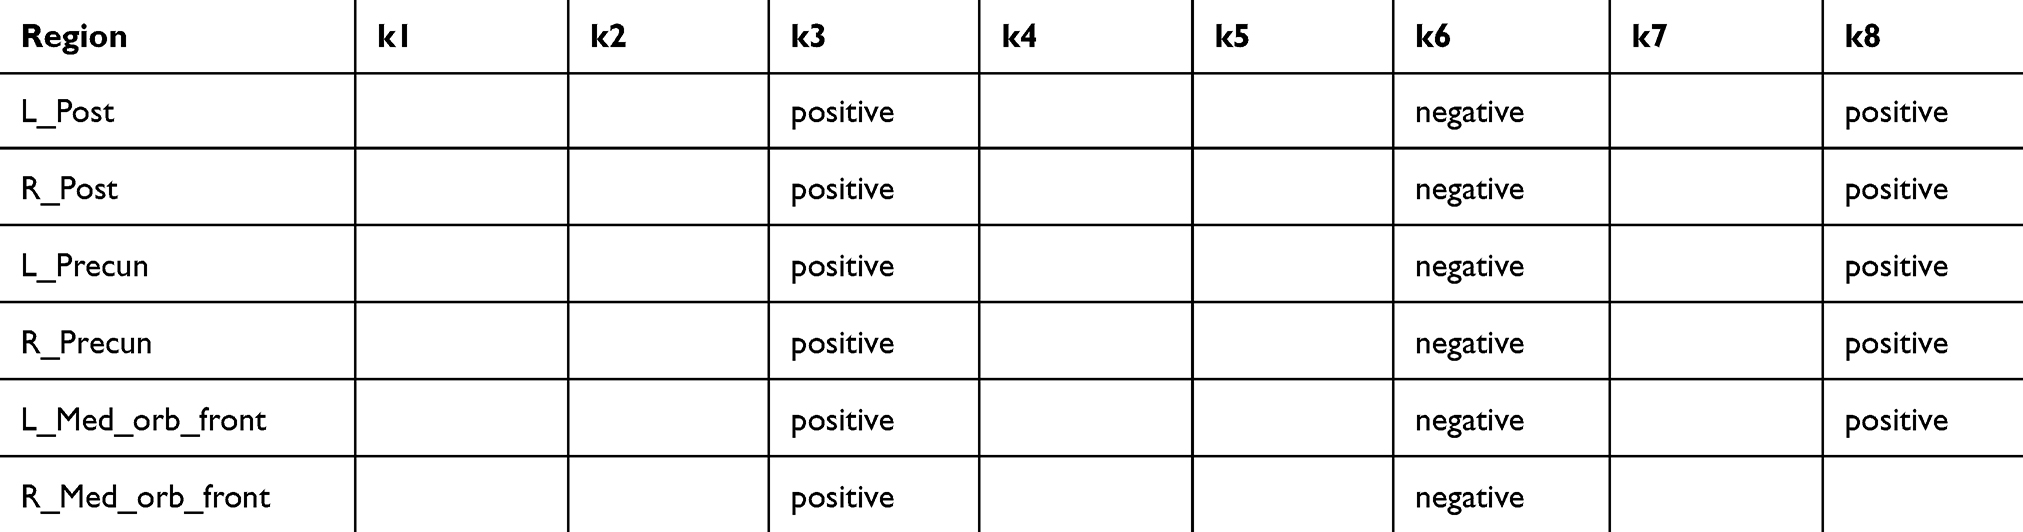 |
Table 3 NPI-sleep symptoms (columns) in the strongest models for predicting regional Aβ burden (rows). Non-empty cells indicate the presence of the symptom (positive or negative correlation) in the strongest model determined by the backward-elimination process |
Table 4 shows the NPI-sleep questionnaires that were selected by the backward-elimination regression process as the combination of predictors (both positive and negative) building the strongest model for predicting each regional tau burden (rows). In the entorhinal cortex, k1, k2, and k6 were associated with negative coefficients whereas k3, ,k4 k5, and k8 were associated with positive coefficients. The best model for brainstem did not include any of the eight symptoms. Excessive sleep during day (k7) was not present in any of the strongest models.
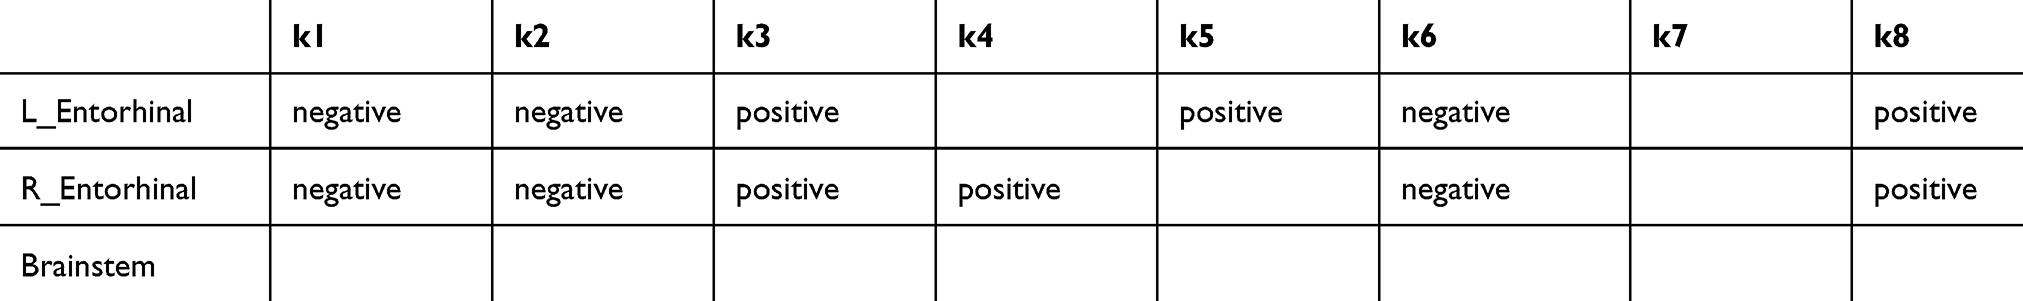 |
Table 4 NPI-sleep symptoms (columns) in the strongest models for predicting regional tau burden (rows). Non-empty cells indicate the presence of the symptom (positive or negative correlation) in the strongest model determined by the backward-elimination process |
Regression analyses with total scores
Table 5 presents the regression analyses with the total scores (regional SUVR~Age+Sex+APOE+total_score_pos+total_score_neg). For regional Aβ SUVR values, k3 and k8 appeared in the strongest models and had positive coefficients. Therefore, the total score of symptoms with positive coefficients (total_score_pos) was calculated as the sum of their scores (k38). The questionnaire k6 was the only symptom that appeared in the strongest model and was associated with a negative coefficient. For the left entorhinal SUVR value, the sleep symptoms k3, k5, and k8 appeared in the strongest models and had positive coefficients. Therefore, the total score of symptoms with positive coefficients for this region was calculated as the sum of scores from k3, k5, and k8 questions (k358). For the right entorhinal SUVR value, the sleep symptoms k3, k4, and k8 appeared in the strongest models and had positive coefficients. Therefore, the total score of symptoms with positive coefficients for this region was calculated as the sum of scores from k3, k4, and k8 (k348). The symptoms k1, k2, and k6 were associated with negative coefficients for both left and right entorhinal SUVR values. Therefore, the total score of symptoms with negative coefficients (total_score_neg) for these two regions was calculated as the sum of scores from k1, k2, and k6 questions (k126). Brainstem was left out because none of the symptoms appeared in the strongest model for this region. Age, sex, and APOE were added as other covariates. The Bonferroni-corrected P-value of 0.006 was used to adjust for multiple comparisons across regional Aβ and tau measures (left and right posterior cingulate, left and right precuneus, left and right medial orbitofrontal, left and right entorhinal). We found that the total score of symptoms with positive coefficients (k38 for Aβ, k358 for left entorhinal, k348 for right entorhinal) were significantly associated with elevated tau (both left and right entorhinal) and elevated Aβ (posterior cingulate and precuneus). For the medial orbitofrontal regions, the P-value was above the Bonferroni-adjusted threshold. The total score of symptoms with negative coefficients (k1, k2, k6) was significantly associated with both left and right entorhinal tau SUVR values. Only the left precuneus SUVR was marginally associated with k6. To show the tracer accumulation in subjects with different sleep symptoms, the subjects were roughly stratified based on the severity of each composite positive/negative sleep score (k38, k6, k358, k126). Group comparisons for global Aβ and left entorhinal tau are shown in Figure 2. AStudent's t-test was conducted to determine the group differences. The associated P-values were 0.03 for group differences in global Aβ-PET SUVR when subjects were stratified based on the positive composite score k38 (k38=0 in group 1 and k38>0 in group 2) and 0.56 when they were grouped based on the negative score k6. For entorhinal tau, the P-values were 0.047 for group differences when subjects were stratified based on the positive composite score k358 and 0.066 when they were divided based on the negative composite score k126. The subjects’ data and the script for statistical analysis can be found in supplementary materials.
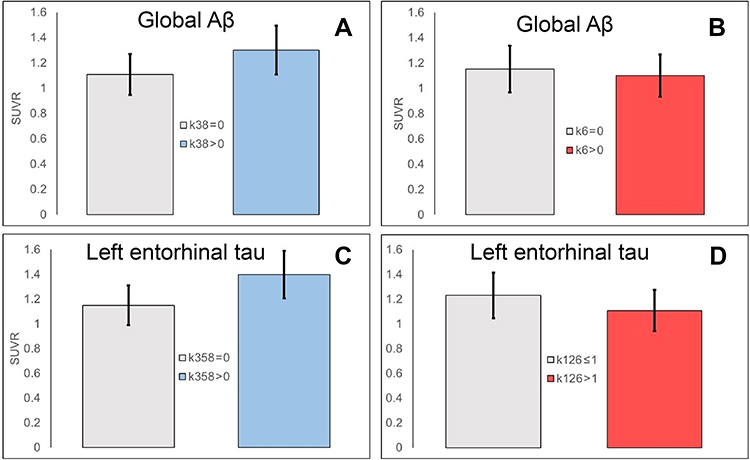 |
Figure 2 Global Aβ PET and left entorhinal tau SUVR values in subject groups stratified by the presence/absence of symptoms with positive coefficients (k35 for Aβ in A, k358 for tau in C) and negative coefficients (k6 for Aβ in B and k126 for tau in D). |
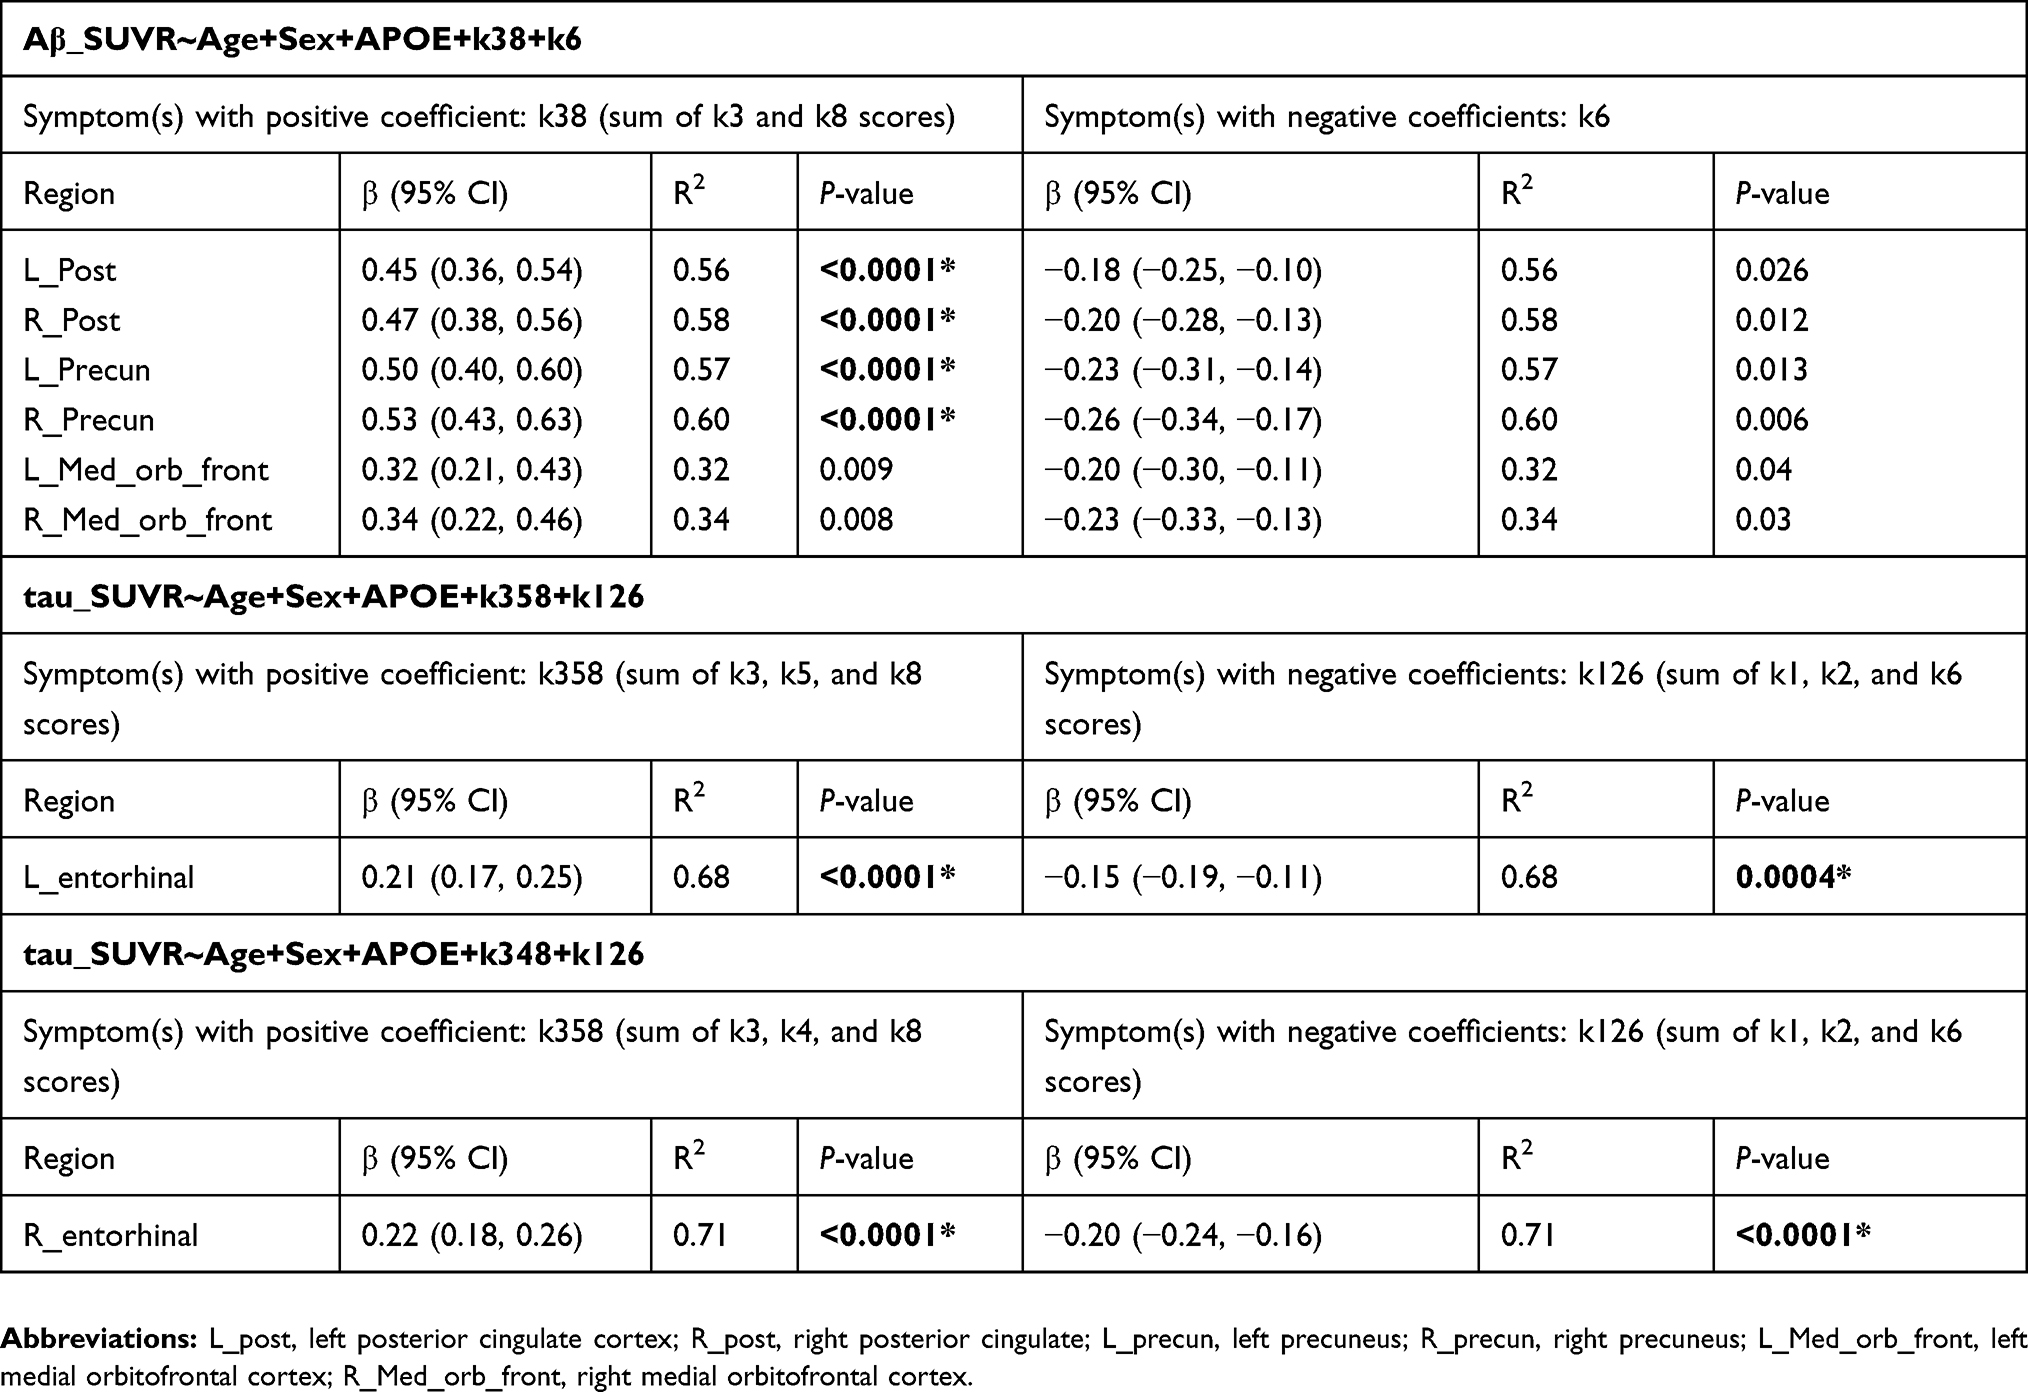 |
Table 5 Regression analyses with total scores. For regional A |
Discussion
Current sleep assessment methods can be classified based on different criteria, such as objectivity (polysomnography and actigraphy vs subjective sleep questionnaires) and need for medical assistance (administered by clinician vs self-assessment). The primary goal of this study was to understand the associations between AD pathologies (Aβ and tau) and simple sleep questionnaires that can be readily administered and interpreted by family members. Given that sleep disturbances are among the major causes of patient institutionalization in AD,12 detecting earliest abnormal signs of altered sleep patterns may motivate the caregivers and affected individuals to seek help by health care providers who can provide more detailed cognitive/neurobehavioral assessments. The findings of this study indicate the presence of two distinct sleep-related patterns reported by informants and their differential associations with AD pathologies. We found that informant-reported symptoms related to abnormal night-time behavior (k3, k4, k5, k8) were positively associated with both pathologies meaning that the presence of abnormal night-time activities and increased number of night-time behavioral symptoms (k38 for Aβ, k358 for left entorhinal tau, and k348 for right entorhinal tau) were associated with elevated levels of both Aβ and tau. Interestingly, we found that informant-reported symptoms related to sleep deficiency, difficulties falling asleep (k1), fragmented sleep (k2), awaken too early (k6), without the involvement of abnormal behavioral activities (wandering, pacing, get ready to go to work), were significantly associated with lower entorhinal tau burden (but no significant associations with Aβ). Given the previously observed relationships between self-reported sleep deficiencies and elevated Aβ levels, the lack of such associations with informant-based reports on sleep deficiency may indicate that self-reports are potentially better in detecting sleep deficiencies than informant-based reports. However, the negative associations of sleep deficiencies and entorhinal tau were somehow surprising. While a large number of previous research have established a consistent link between sleep deficiencies and elevated amyloid across human subjects7,20,21 and animal models,22 little is known about how sleep deficiencies are linked to the progression of tauopathy. Specifically, previous sleep-tau studies on animals were conducted by evoking acute sleep deprivation on animals with seeded tau in their brains.23 It remains to be explored how findings of these experimental studies on nocturnal animals (different circadian rhythm than human) can be translated into human subjects where tau deposits are also found in normal aging. Using actigraphy on a population of older cognitively normal adults, Kam et al24 reported no correlations between cerebrospinal fluid measures of total tau (t-tau) and phosphorylated (p-tau) and measures of sleep quality or habitual sleep duration. Another study by Sprecher et al25 found that worse self-reported subjective sleep quality, more sleep problems, and daytime somnolence were associated with greater AD pathology, indicated by higher t-tau/Aβ42, p-tau/Aβ42. These different findings may be explained by differences in the use of subjective versus objective measures and self-report versus informant-report of sleep used across these studies. One of the limitations of this study is the small sample size. We included only subjects who had both Aβ and tau scans. Also, due to the nature of the statistical analysis, we could only include subjects who had at least one sleep symptom (one of eight questions).
The progression of Aβ plaques starts decades before the onset of dementia. Non-demented individuals with abnormal Aβ levels show impaired cognitive performance, particularly in episodic memory,26 which is detectable but stable during a long preclinical period27 prior to the manifestation of clinical AD, thus reflecting a relatively slow progression of pathological (eg, Aβ) processes that affect the episodic memory. It is not fully understood whether sleep disorders precede episodic memory decline. Based on a group of community-dwelling participants, Spira et al8 found that sleep disorders in clinically normal subjects increased the odds (by 2.5 times) of developing Aβ accumulation 15.7±3.4 years later. Increasing evidence suggests that the glymphatic system, a recently discovered macroscopic waste clearance system, is responsible for removing metabolites and neurotoxic waste products including Aβ.28 The glymphatic system is mainly active during sleep suggesting that sleep disorders can contribute to Aβ accumulation by impairing the glymphatic function. It is possible that sleep disorders may precede episodic memory alterations that occur due to Aβ progression.
One of the limitations of this study is the small sample size. We searched for all clinically normal ADNI subjects who had both Aβ and tau PET scans and that these scans were acquired at time points close to each other and the sleep assessments. The rigid timing specifications reduced the number of available subjects. Therefore, this study should be investigated in larger research populations using informant-based or subject-based sleep reports to determine how they predict different AD biomarkers. The Neuropsychiatric Inventory Sleep Questionnaire (NPI-sleep) could be both a strength and a weakness in this study. NPI-sleep questions are simple and can be readily administered and understood by non-clinicians. Only a positive answer to the initial NPI-sleep question (presence of resent sleep problems) is followed by the eight remaining questions to characterize the nature of the sleep problem. However, without the specific and detailed questions (k1–k8), some informants may be unaware of the presence of a sleep problem. Pittsburgh Sleep Quality Index29 is a more effective sleep assessment, which consists of 19 individual items and may deem better for characterizing sleep disorders and detecting associations with AD pathologies. The NPI-sleep questionnaire pertains to recent changes in sleep behavior. However, previous studies8 suggest that specific alterations in sleep patterns (eg, excessive daytime napping) occur decades before developing Aβ accumulation. Therefore, NPI-sleep may not be a suitable test for subjects with a long history of sleep problems.
Conclusion
Detection of abnormal night-time behaviors (wandering, pacing, other inappropriate activities) by family members indicates early signs of both Aβ and tau pathologies and may encourage the affected individuals to seek help by health care providers for detailed cognitive/neurobehavioral tests.
Acknowledgment
Data collection and sharing for this project were funded by the Alzheimer’s Disease Neuroimaging Initiative (ADNI) (National Institutes of Health Grant U01 AG024904) and DOD ADNI (Department of Defense award number W81XWH-12-2-0012). ADNI is funded by the National Institute on Aging, the National Institute of Biomedical Imaging and Bioengineering, and through generous contributions from the following: AbbVie, Alzheimer’s Association; Alzheimer’s Drug Discovery Foundation; Araclon Biotech; BioClinica, Inc.; Biogen; Bristol-Myers Squibb Company; CereSpir, Inc.; Cogstate; Eisai Inc.; Elan Pharmaceuticals, Inc.; Eli Lilly and Company; EuroImmun; F. Hoffmann-La Roche Ltd and its affiliated company Genentech, Inc.; Fujirebio; GE Healthcare; IXICO Ltd.; Janssen Alzheimer Immunotherapy Research & Development, LLC.; Johnson & Johnson Pharmaceutical Research & Development LLC.; Lumosity; Lundbeck; Merck & Co., Inc.; MesoScale Diagnostics, LLC.; NeuroRx Research; Neurotrack Technologies; Novartis Pharmaceuticals Corporation; Pfizer Inc.; Piramal Imaging; Servier; Takeda Pharmaceutical Company; and Transition Therapeutics. The Canadian Institutes of Health Research is providing funds to support ADNI clinical sites in Canada. Private sector contributions are facilitated by the Foundation for the National Institutes of Health (www.fnih.org). The grantee organization is the Northern California Institute for Research and Education, and the study is coordinated by the Alzheimer’s Therapeutic Research Institute at the University of Southern California. ADNI data are disseminated by the Laboratory for Neuro Imaging at the University of Southern California. Data used in preparation of this article were obtained from the Alzheimer’s Disease Neuroimaging Initiative (ADNI) database (adni.loni.usc.edu). As such, the investigators within the ADNI contributed to the design and implementation of ADNI and/or provided data but did not participate in analysis or writing of this report. A complete listing of ADNI investigators can be found at: http://adni.loni.usc.edu/wp-content/uploads/how_to_apply/ADNI_Acknowledgement_List.pdf.
Disclosure
The author reports no conflicts of interest in this work.
References
1. Lorrain D, Petit D, Montplaisir J, Nielsen T, Gauthier S. Sleep in Alzheimer’s disease: further considerations on the role of brainstem and forebrain cholinergic populations in sleep-wake mechanisms. Sleep. 1995;18(3):145–148. doi:10.1093/sleep/18.3.145
2. Peter-Derex L, Yammine P, Bastuji H, Croisile B. Sleep and Alzheimer’s disease. Sleep Med Rev. 2015;19:29–38. doi:10.1016/j.smrv.2014.03.007
3. Ju Y-ES, Lucey BP, Holtzman DM. Sleep and Alzheimer disease pathology—a bidirectional relationship. Nat Rev Neurol. 2013;10:115. doi:10.1038/nrneurol.2013.269
4. Weldemichael DA, Grossberg GT. Circadian rhythm disturbances in patients with Alzheimer’s disease: a review. Int J Alzheimers Dis. 2010;2010:716453. doi:10.4061/2010/761571
5. Urrestarazu E, Iriarte J. Clinical management of sleep disturbances in Alzheimer’s disease: current and emerging strategies. Nat Sci Sleep. 2016;8:21–33. doi:10.2147/NSS.S76706
6. Hwang JY, Byun MS, Choe YM, et al. Moderating effect of APOE ε4 on the relationship between sleep-wake cycle and brain β-amyloid. Neurology. 2018;90(13):e1167. doi:10.1212/WNL.0000000000005560
7. Musiek ES, Bhimasani M, Zangrilli MA, Morris JC, Holtzman DM, Ju YS. Circadian rest-activity pattern changes in aging and preclinical alzheimer disease. JAMA Neurol. 2018;75(5):582–590. doi:10.1001/jamaneurol.2017.4719
8. Spira AP, An Y, Wu MN, et al. Excessive daytime sleepiness and napping in cognitively normal adults: associations with subsequent amyloid deposition measured by PiB PET. Sleep. 2018;41(10):zsy152–zsy152. doi:10.1093/sleep/zsy184
9. Sprecher KE, Bendlin BB, Racine AM, et al. Amyloid burden is associated with self-reported sleep in nondemented late middle-aged adults. Neurobiol Aging. 2015;36(9):2568–2576. doi:10.1016/j.neurobiolaging.2015.05.004
10. Saper CB, Scammell TE, Lu J. Hypothalamic regulation of sleep and circadian rhythms. Nature. 2005;437(7063):1257–1263. doi:10.1038/nature04284
11. Holth J, Patel T, Holtzman DM. Sleep in Alzheimer’s disease – beyond amyloid. Neurobiol Sleep Circadian Rhythms. 2017;2:4–14. doi:10.1016/j.nbscr.2016.08.002
12. Moran M, Lynch CA, Walsh C, Coen R, Coakley D, Lawlor BA. Sleep disturbance in mild to moderate Alzheimer’s disease. Sleep Med. 2005;6(4):347–352. doi:10.1016/j.sleep.2004.12.005
13. Folstein MF, Robins LN, Helzer JE. The mini-mental state examination. Arch Gen Psychiatry. 1983;40(7):812. doi:10.1001/archpsyc.1983.01790060110016
14. Braak H, Braak E. Frequency of stages of Alzheimer-related lesions in different age categories. Neurobiol Aging. 1997;18(4):351–357.
15. Jagust WJ, Landau SM, Koeppe RA, et al. The Alzheimer’s disease neuroimaging initiative 2 PET core: 2015. Alzheimers Dement. 2015;11(7):757–771. doi:10.1016/j.jalz.2015.05.001
16. Palmqvist S, Schöll M, Strandberg O, et al. Earliest accumulation of β-amyloid occurs within the default-mode network and concurrently affects brain connectivity. Nat Commun. 2017;8(1):1214. doi:10.1038/s41467-017-01150-x
17. Farrell ME, Chen X, Rundle MM, Chan MY, Wig GS, Park DC. Regional amyloid accumulation and cognitive decline in initially amyloid-negative adults. Neurology. 2018;91(19):e1809. doi:10.1212/WNL.0000000000005773
18. Landau SM, Horng A, Jagust WJ. Memory decline accompanies subthreshold amyloid accumulation. Neurology. 2018;90(17):e1452. doi:10.1212/WNL.0000000000005560
19. Mantel N. Why stepdown procedures in variable selection. Technometrics. 1970;12(3):621–625. doi:10.1080/00401706.1970.10488701
20. Ju Y-ES, McLeland JS, Toedebusch CD, et al. Sleep quality and preclinical Alzheimer disease. JAMA Neurol. 2013;70(5):587–593. doi:10.1001/jamaneurol.2013.2334
21. Shokri-Kojori E, Wang G-J, Wiers CE, et al. β-Amyloid accumulation in the human brain after one night of sleep deprivation. Proc Natl Acad Sci U S A. 2018;115(17):4483–4488. doi:10.1073/pnas.1721694115
22. Xie L, Kang H, Xu Q, et al. Sleep drives metabolite clearance from the adult brain. Science (New York, N.Y.). 2013;342(6156):373–377. doi:10.1126/science.1241224
23. Holth JK, Fritschi SK, Wang C, et al. The sleep-wake cycle regulates brain interstitial fluid tau in mice and CSF tau in humans. Science. 2019;363(6429):880. doi:10.1126/science.aav2546
24. Kam K, Parekh A, Sharma RA, et al. Sleep oscillation-specific associations with Alzheimer’s disease CSF biomarkers: novel roles for sleep spindles and tau. Mol Neurodegener. 2019;14(1):10. doi:10.1186/s13024-019-0309-5
25. Sprecher KE, Koscik RL, Carlsson CM, et al. Poor sleep is associated with CSF biomarkers of amyloid pathology in cognitively normal adults. Neurology. 2017;89(5):445–453. doi:10.1212/WNL.0000000000004171
26. Ciarmiello A, Tartaglione A, Giovannini E, et al. Amyloid burden identifies neuropsychological phenotypes at increased risk of progression to Alzheimer’s disease in mild cognitive impairment patients. Eur J Nucl Med Mol Imaging. 2019;46(2):288–296. doi:10.1007/s00259-018-4149-2
27. Bäckman L, Small BJ, Fratiglioni L. Stability of the preclinical episodic memory deficit in Alzheimer’s disease. Brain. 2001;124(1):96–102. doi:10.1093/brain/124.1.96
28. Jessen NA, Munk ASF, Lundgaard I, Nedergaard M. The glymphatic system: a beginner’s guide. Neurochem Res. 2015;40(12):2583–2599. doi:10.1007/s11064-015-1581-6
29. Buysse DJ, Reynolds CF, Monk TH, Berman SR, Kupfer DJ. The Pittsburgh sleep quality index: a new instrument for psychiatric practice and research. Psychiatry Res. 1989;28(2):193–213.
Supplementary materials
 |
|
library(car)
library(ggplot2)
library(Hmisc)
######################################## read data ################################################
dat = read.csv(‘C:……………../subject_data.csv’, stringsAsFactors = FALSE)
dat1n = na.omit(dat)
dat1n$k1 = as.factor(dat1n$k1)
dat1n$k2 = as.factor(dat1n$k2)
dat1n$k3 = as.factor(dat1n$k3)
dat1n$k4 = as.factor(dat1n$k4)
dat1n$k5 = as.factor(dat1n$k5)
dat1n$k6 = as.factor(dat1n$k6)
dat1n$k7 = as.factor(dat1n$k7)
dat1n$k8 = as.factor(dat1n$k8)
dat1n$sex = as.factor(dat1n$sex)
dat1n$APOE = as.factor(dat1n$APOE)
###################################### backward elimination #######################################
fit1 = lm(ent_L ~ k1 + k2 + k3 + k4 + k5 + k6 + k7 + k8, data = dat1n)
selection = step(fit1, direction = “backward”)
result_out = selection$coefficients
ouput_temp = summary(eval(selection$call))
adj_rsq = round(ouput_temp$adj.r.squared, 5)
####################### second step: linear regression (determine positive and negative coeff) #################
fit2 = lm(ent_L ~ Age + sex + APOE + k1 + k2 + k3 + k5 + k6 + k8, data = dat1n)
summary(fit2)
######################## third step: linear regression for composite scores ##############################
fit3 = lm(ent_L ~ Age + sex + APOE + k358 +k126, data = dat1n)
summary(fit3)
 © 2019 The Author(s). This work is published and licensed by Dove Medical Press Limited. The full terms of this license are available at https://www.dovepress.com/terms.php and incorporate the Creative Commons Attribution - Non Commercial (unported, v3.0) License.
By accessing the work you hereby accept the Terms. Non-commercial uses of the work are permitted without any further permission from Dove Medical Press Limited, provided the work is properly attributed. For permission for commercial use of this work, please see paragraphs 4.2 and 5 of our Terms.
© 2019 The Author(s). This work is published and licensed by Dove Medical Press Limited. The full terms of this license are available at https://www.dovepress.com/terms.php and incorporate the Creative Commons Attribution - Non Commercial (unported, v3.0) License.
By accessing the work you hereby accept the Terms. Non-commercial uses of the work are permitted without any further permission from Dove Medical Press Limited, provided the work is properly attributed. For permission for commercial use of this work, please see paragraphs 4.2 and 5 of our Terms.