")
Back to Journals » Journal of Inflammation Research » Volume 15
Associations of Inflammation with Risk of Cardiovascular and All-Cause Mortality in Adults with Hypertension: An Inflammatory Prognostic Scoring System
Authors Cheang I , Zhu X , Lu X, Yue X, Tang Y, Gao R, Liao S, Yao W, Zhou Y, Zhang H, Yiu KH, Li X
Received 22 August 2022
Accepted for publication 22 October 2022
Published 8 November 2022 Volume 2022:15 Pages 6125—6136
DOI https://doi.org/10.2147/JIR.S384977
Checked for plagiarism Yes
Review by Single anonymous peer review
Peer reviewer comments 5
Editor who approved publication: Professor Ning Quan
Iokfai Cheang,1,2,* Xu Zhu,1,* Xinyi Lu,1 Xin Yue,1 Yuan Tang,1 Rongrong Gao,1 Shengen Liao,1 Wenming Yao,1 Yanli Zhou,1 Haifeng Zhang,1,3 Kai-Hang Yiu,2,4 Xinli Li1
1Department of Cardiology, The First Affiliated Hospital of Nanjing Medical University, Jiangsu Province Hospital, Nanjing, 210029, People’s Republic of China; 2Division of Cardiology, Department of Medicine, The University of Hong Kong, Queen Mary Hospital, Hong Kong Special Administrative Region, 999077, People’s Republic of China; 3Department of Cardiology, The Affiliated Suzhou Hospital of Nanjing Medical University, Suzhou Municipal Hospital, Suzhou, 215002, People’s Republic of China; 4Division of Cardiology, Department of Medicine, The University of Hong Kong Shenzhen Hospital, Shenzhen, 518000, People’s Republic of China
*These authors contributed equally to this work
Correspondence: Xinli Li, Department of Cardiology, The First Affiliated Hospital of Nanjing Medical University, Jiangsu Province Hospital, Nanjing, 210029, People’s Republic of China, Tel +86 13611573111, Email [email protected] Kai-Hang Yiu, Division of Cardiology, Department of Medicine, The University of Hong Kong, Queen Mary Hospital, Hong Kong Special Administrative Region, 999077, People’s Republic of China, Tel +852 22553633, Fax +852 28186304, Email [email protected]
Background: Inflammation is one of the major pathways in the progression of hypertension (HTN), and the related inflammatory markers have demonstrated certain predictive values. The current study aimed to integrate these markers to construct an inflammatory prognostic scoring (IPS) system and to assess the prognostic values of IPS in patients with HTN.
Methods: A total of 9846 adult participants with HTN from NHANES 1999– 2010 were enrolled and followed up. Demographic characteristics and the related laboratory results for the 12 inflammatory markers were collected. LASSO-COX regression, Kaplan–Meier, restricted cubic spline COX regression (RCS), receiver operator characteristic curve (ROC), and random survival forests (RSF) analysis were applied to explore the values of individual and IPS parameters.
Results: At the census date of follow-up, 2387 (24.2%) were identified as all-cause deaths and 484 (4.9%) as cardiovascular deaths. All inflammatory markers showed certain prognostic values. Then, based on the LAASO analysis, LDH, ALP, LYM, NLR, MLR, SIRI, and RDW were included in the construction of the IPS system. The higher IPS had significantly worse long-term prognosis in Kaplan–Meier analysis (p log-rank < 0.001). Also, IPS remained an independent prognosticator compared to the lowest quartile (All p for trend < 0.001), and the ROC showed satisfactory values in the long-term prognosis of both cardiovascular and all-cause mortality. RCS further showed a linear association of IPS with cardiovascular mortality and all-cause mortality (p for non-linearity > 0.05). Two different algorithms of RSF, variable importance and minimal depth, to evaluate the prognostic importance showed that IPS was the best in survival prediction.
Conclusion: Our results highlight that a higher IPS (system integrating the inflammatory markers) was associated with the increased risk of cardiovascular and all-cause mortality in patients with HTN, suggesting that IPS is a useful method for risk stratification in HTN.
Keywords: hypertension, HTN, inflammation, inflammatory prognostic scoring system, prognosis, random survival forest
Introduction
Hypertension (HTN) exerts a substantial public health burden and is a major risk factor for cardiovascular disease and mortality events worldwide.1–4 The prevalence of HTN has continued to increase over the years and is estimated to increase to 1.56 billion by 2025.5,6 As one of the modifiable risk factors, there are multiple mechanical changes including metabolic and inflammatory contributing toward the pathogenesis of HTN. The occurrence and development of hypertension and damage to target organs are all closely related to vascular inflammation.7 Therefore, recognizing the inflammatory processes in the pathophysiology of HTN is important to the management of hypertension and its complications.
Numerous markers of inflammation markers have been reported to be associated with an increased risk of CVD, and the use of these biomarkers of vascular inflammation enhances risk discrimination for cardiovascular events.8 The association of circulating inflammatory biomarkers with the risk of cardiovascular events has been previously demonstrated in various studies.9,10 For example, C-reactive protein (CRP) and high-sensitivity CRP are one of the most extensively studied inflammatory markers and have shown a precise role in the assessment of cardiovascular risk.11,12 Also, there are a variety of inflammation parameters such as neutrophil-to-lymphocyte ratio (NLR), derivate neutrophil-to-lymphocyte ratio (dNLR), monocyte-to-lymphocyte ratio (MLR), and systemic inflammatory response index (SIRI) that could be incorporated into the inflammatory-related risk assessment.13,14
However, there is little evidence of the comprehensive and/or integrative analysis with multiple markers. Therefore, it is meaningful to identify the prognostic biomarkers and to develop a clinically applicable predictive model for individualized risk stratification for patients with HTN.
Herein, we hypothesized that compared to a single biomarker, a combination of all these biomarkers could provide additional information for survival prediction. The current study aimed to establish a prognostic model, the Inflammatory Prognostic Scoring System (IPS), based on these inflammatory biomarkers in hypertensive population by utilizing the data from National Health and Nutrition Examination Survey (NHANES) 1999–2010.
Methods
Study Population
The NHANES is a long-term epidemiology survey with 2-year cycles that employs a multi-stage, cluster-sampling design to ensure nationally representative samples in the United States (https://wwwn.cdc.gov/nchs/nhanes/default.aspx).
Our research examined descriptive data from continuous NHANES 1999–2010. The NHANES research protocols were approved by the NCHS Research Ethics Review Board, and all participants provided written informed consent (Protocol #98-12, Protocol #2005-06, and Continuation of Protocol #2005-06; Details on https://www.cdc.gov/nchs/nhanes/irba98.htm).15
We enrolled eligible adult participants (aged 18 years and older) with hypertension and complete data on 12 inflammation biomarkers. Exclusion criteria were as follows: 1) pregnant women, 2) participants with cancer, and 3) individuals without follow-up information.
Definition of Hypertension
After 5 minutes of inactivity, a qualified medical examiner repeated blood pressure measurements at 30-second intervals three (sometimes four) times, according to a standardized protocol. Individuals were characterized as having hypertension if they met one or more of the following criteria: 1) mean systolic blood pressure (SBP) ≥140 mmHg, 2) mean diastolic blood pressure (DBP) ≥90 mmHg, 3) currently receiving anti-hypertensive medicine, and 4) self-reported physician diagnosis of hypertension.5
Measurement of Inflammation Biomarkers and Classification
Fasting blood sample of the participants for the laboratory tests was collected by the mobile examination center phlebotomist. The NHANES laboratory manual provides the reference ranges on laboratory parameters in the form of lower and upper limits. Analysis for the complete blood count was done in the mobile examination center, and refrigerated or frozen blood samples were transported and analyzed in the central laboratories for the other parameters.
The DxC800 with lactate dehydrogenase (LDH) reagent (using lactate as substrate) utilizes an enzymatic rate method to measure LDH activity in biological fluids. The DxC600i system or DxC800 system uses a kinetic rate method using a 2-Amino-2-Methyl-1-Propanol (AMP) buffer to measure alkaline phosphatase (ALP) activity in serum or plasma. For the processing of CRP, latex-enhanced nephelometry with particle-enhanced assays was used for quantitation. These assays were performed on a Behring Nephelometer for quantitative CRP determination. The methods used to derive complete blood count (CBC) parameters (white blood cell [WBC], neutrophil [NEU], lymphocyte [LYM], monocyte count [Mno], and red cell distribution width [RDW]) are based on the Beckman Coulter method of counting and sizing, in combination with an automatic diluting and mixing device for sample processing. The Beckman Coulter MAXM instrument in the Mobile Examination Centers (MECs) produces a CBC on blood specimens. Detailed measurements are available at: https://wwwn.cdc.gov/nchs/nhanes/continuousnhanes/labmethods.aspx?Cycle=2009-2010.
The complete blood count derived inflammatory parameters include NLR, dNLR, MLR, and SIRI, which are calculated as follows:13 ①NLR = NEU (109/L)/LYM (109/L); ②dNLR = NEU (109/L)/[WBC (109/L)-NEU (109/L)]; ③LMR = LYM (109/L)/Mno (109/L); ④SIRI = NEU (109/L) × Mno (109/L)/LYM (109/L).
Outcome Variables
The National Center for Health Statistics (NCHS) has linked the data to the death certificate records of the National Death Index (NDI) and has generated the public-use linked mortality file for the NHANES 1999–2010. In addition, a small fraction of participants’ mortality records were ascertained from the Centers for Medicare & Medicaid Services and Social Security Administration. Follow-up period was computed from NHANES interview date to the registered date of death or the date of censoring (December 31, 2015). All individuals aged 18 years or older with sufficient identifying data are eligible to complete the mortality follow-up. NCHS determined underlying causes of death (UCOD) for participants based on the International Classification of Diseases (ICD), Tenth Revision. The outcomes of current study were all-cause and cardiovascular (ICD codes I00-I99) mortality.
Covariate Analysis
In NHANES, data collection was carried out using a standardized questionnaire during a household interview, two 24-hour recall interviews (for assessing energy intake), and a medical evaluation (including urine tests based on urine spot samples and blood tests). We selected the following potential confounding covariates linked to risk of mortality: age, gender, race, education level, smoking, alcohol use, poverty, body mass index (BMI), systolic blood pressure, diastolic blood pressure, physical activity, urinary albumin, high-density lipoprotein cholesterol (HDL-C), total cholesterol (TC), estimated glomerular filtration rate (eGFR), aspartate aminotransferase (AST), alanine aminotransferase (ALT), anti-hypertensive medicine use, diabetes mellitus, congestive heart failure, coronary heart disease, and stroke.
The categories for race/ethnicity were “Mexican American”, “Other Hispanic”, “Non-Hispanic White”, “Non-Hispanic Black”, and “Other”. Education levels were categorized as “below high school”, “high school”, and “above high school”. Poverty was assessed based on the poverty income ratio (PIR) and defined as PIR <1 for a family. Individuals with cotinine levels >14 ng/mL were classified as smokers.16 Individuals who consumed ≥12 alcoholic drinks in a single calendar year were considered alcohol users. Energy intake was calculated by averaging the two values from the two 24-hour recall interviews. Physical activity was classified as “active”, “insufficiently active”, or “inactive” adapted from the Global Physical Activity Questionnaire.17 HDL-C, TC, AST, ALT, and creatinine in blood samples were measured using laboratory tests. The eGFR was computed using the Chronic Kidney Disease-Epidemiology Collaboration (CKD-EPI) equation.18 Descriptions of each variable are presented at https://wwwn.cdc.gov/Nchs/Nhanes/continuousnhanes/.
Construction of Inflammatory Prognostic Scoring (IPS) System
The Pearson correlation method was adopted to calculate correlation coefficients for the above 12 inflammatory biomarkers (8 markers and 4 parameters). The optimal cut-off value for predicting the outcomes was identified. Continuous inflammatory parameters were classified as categorical variables according to their cutoff values determined by the maximally selected rank statistics using the R package “survminer“, with variables above and below the cutoff values scored as 1 and 0, respectively. Considering the possibility of multicollinearity of inflammatory biomarkers, the Least Absolute Shrinkage and Selection Operator (LASSO) analysis with 10-fold cross-validation for data dimensionality reduction and variable selection by using the R package “glmnet” was performed. The LASSO-COX regression analysis with non-zero coefficients was incorporated to construct the novel inflammatory prognostic scoring (IPS), which was calculated as follows: IPS = Sum (score of each inflammatory biomarker × corresponding regression coefficients from LASSO). IPS was also divided into four quartiles (for the categorical dependent variable analyses). A time-dependent receiver operator characteristic curve (ROC curve) was performed by the R package “timeROC” to evaluate the predictive value of IPS for cardiovascular and all-cause mortality in adults with hypertension.
Statistical Analysis
The participant characteristics are presented as median (interquartile range [IQR]) or frequency (percentage) for continuous and categorical variables, respectively. The missing data are multiply interpolated by a “mice” package based on the random forest algorithm. All statistical analyses were conducted using R Statistical Software (version 4.1.0), with two-sided p values <0.05 considered statistically significant.
The cumulative survival rate was calculated by Kaplan–Meier method, and Log rank test was used for comparison between groups. Cox proportional hazards regression was used to estimate hazard ratios (HRs) and 95% confidence intervals (CIs) of the risk of cardiovascular and all-cause mortality in relation to inflammation biomarkers. Restricted cubic spline (RCS) COX regression was utilized to investigate the dose–response relationships between IPS and the risk of cardiovascular and all-cause mortality, using three knots (10th, 50th, and 90th percentiles). In addition, we used the random survival forests (RSF) model developed by Breiman L.19 to estimate the relative importance of each inflammatory marker in predicting the risk of all-cause mortality in AHF. The rank of each variable was determined on the basis of its predictability for the risk of cardiovascular and all-cause mortality according to two predictive parameters: (1) minimal depth (MD), in which variables that have a small MD and split the tree close to the root are considered highly predictive and (2) variable importance (VIMP), computed as the difference between the out-of-bag (OOB) c-indexes from the original OOB data and from the permuted OOB data, in which variables that have greater VIMP values are the more predictive.20 Because they use different prediction algorithms, we expect the variables’ ranking to differ to some degree.
Results
Baseline Characteristics
There were a total of 13,082 participants with HTN from NHANES 1999–2010. Among them, participants with missing data on the inflammation biomarkers (n = 1561), with malignancy (n = 1558), pregnant at baseline (n = 109), and without eligible follow-up information (n = 9) were excluded. In total, 9846 patients with HTN were enrolled in further analyses (Figure S1).
The detailed baseline characteristics are shown in Table 1. The median age of the study population was 61.00 [48.00, 71.00] years old, and 49.6% were male. Median SBP was 137.14 [124.00, 150.00] mmHg and DBP was 74.00 [65.33, 83.29] mmHg. At the census date of December 31st, 2015, there were 2387 adults with hypertension identified as all-cause deaths (24.2%) and 484 as cardiovascular deaths (4.9%).
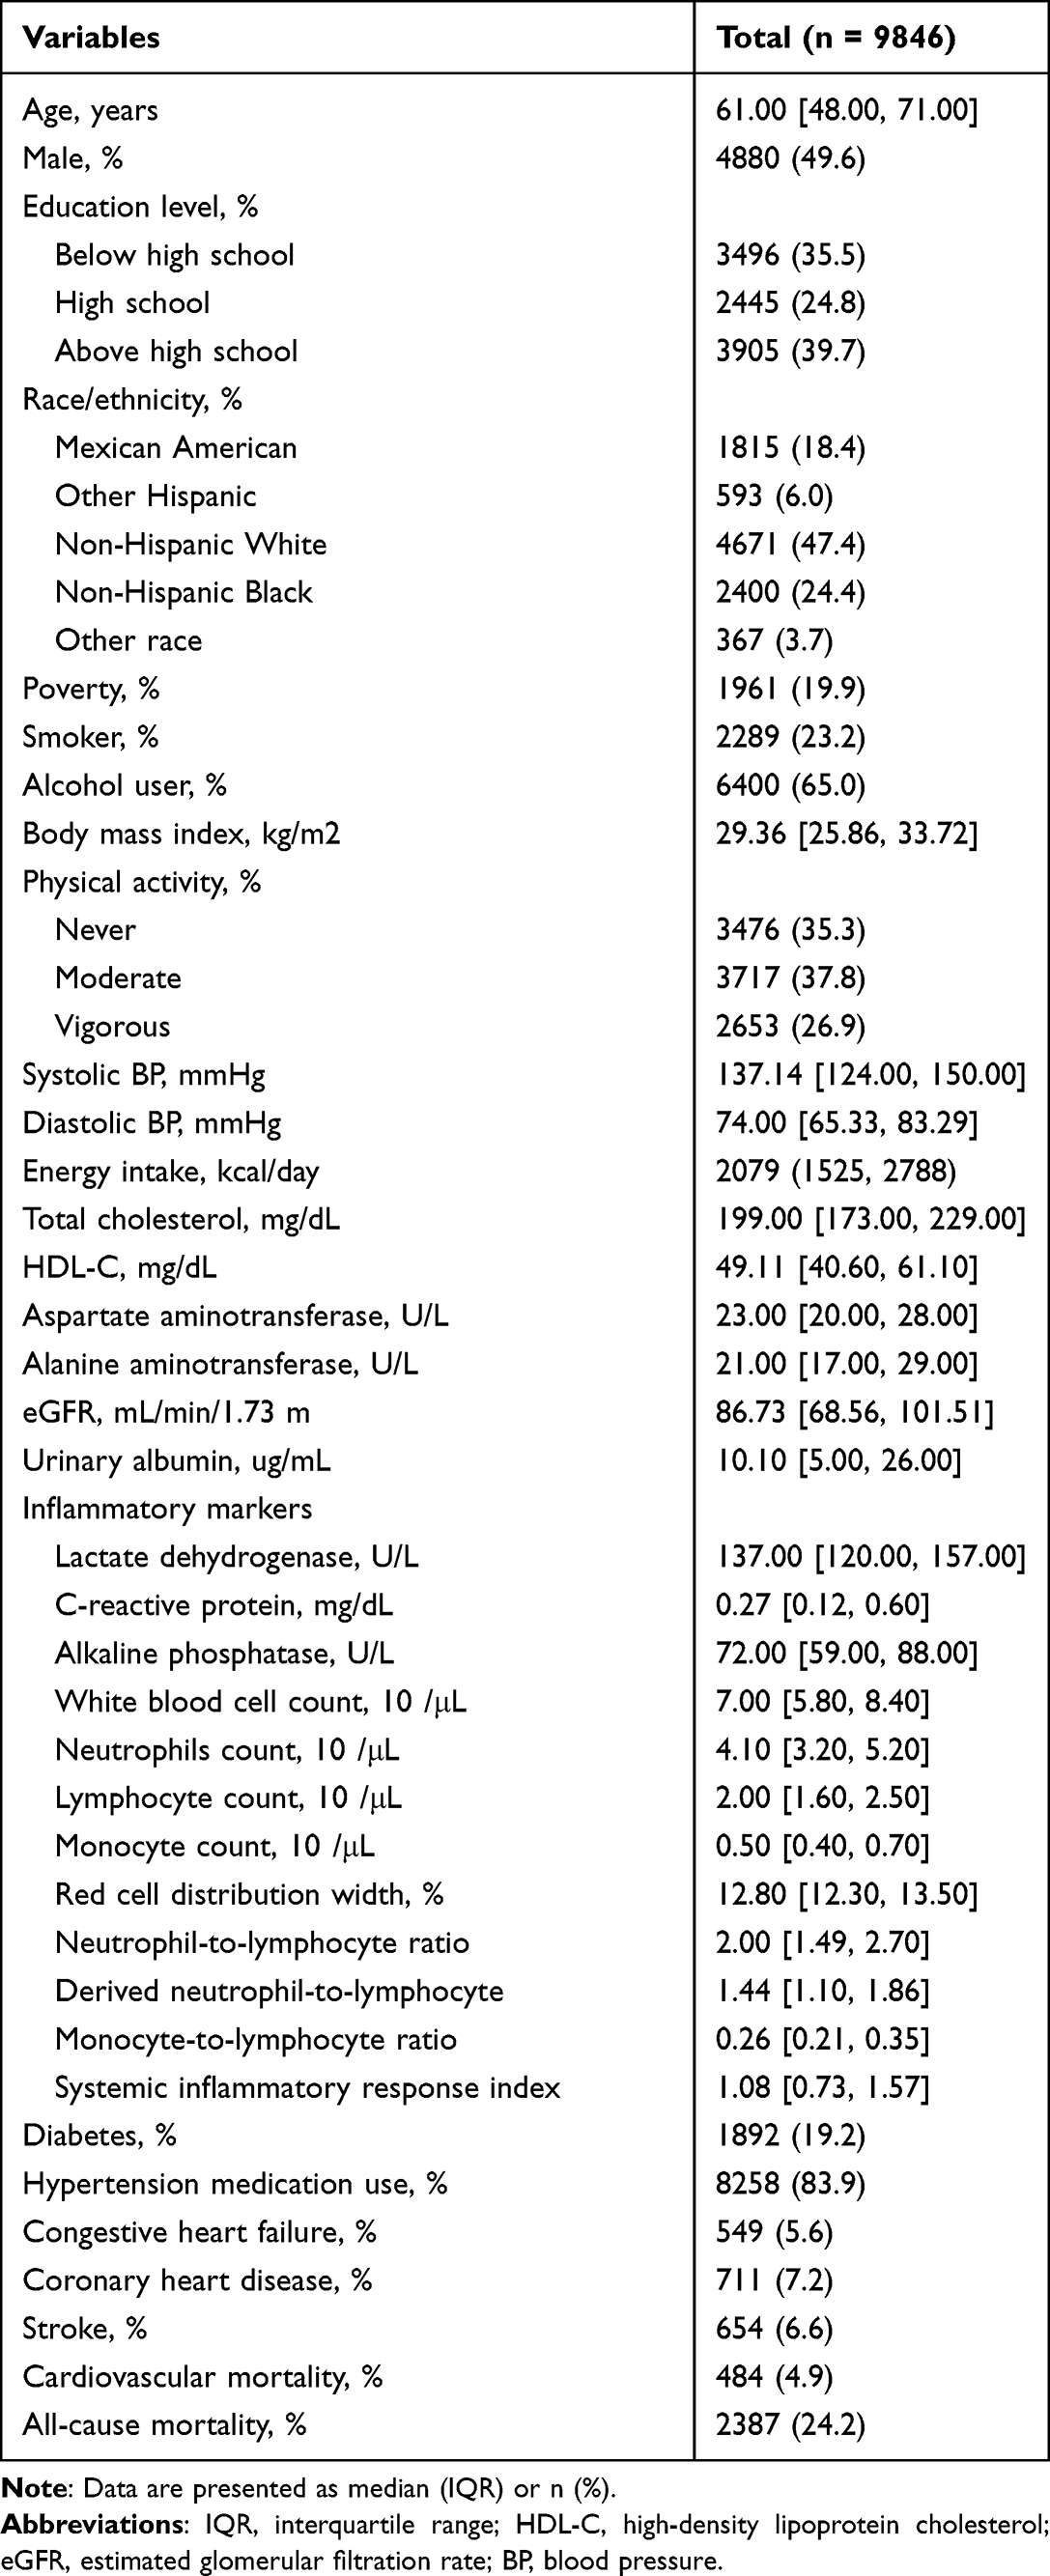 |
Table 1 Baseline Characteristics of Adults with Hypertension in NHANES 1999–2010 (n = 9846) |
Prognostic Values of the Inflammatory Markers
All 12 independent inflammatory markers were all shown certain values in characterizing the prognosis of HTN patients in both cardiovascular mortality (Figure S2) and all-cause mortality (Figure S3) in Kaplan–Meier analysis.
In the multivariate Cox regression analysis fully adjusted with the sociodemographic and health status characteristics (Table 2), LDH, CRP, ALP, NEU, LYM, RDW, NLR, dNLR, MLR, SIRI all showed statistically significant in both cardiovascular and all-cause mortality (All p<0.05), while only WBC and monocytes did not show significance in cardiovascular mortality (p>0.05).
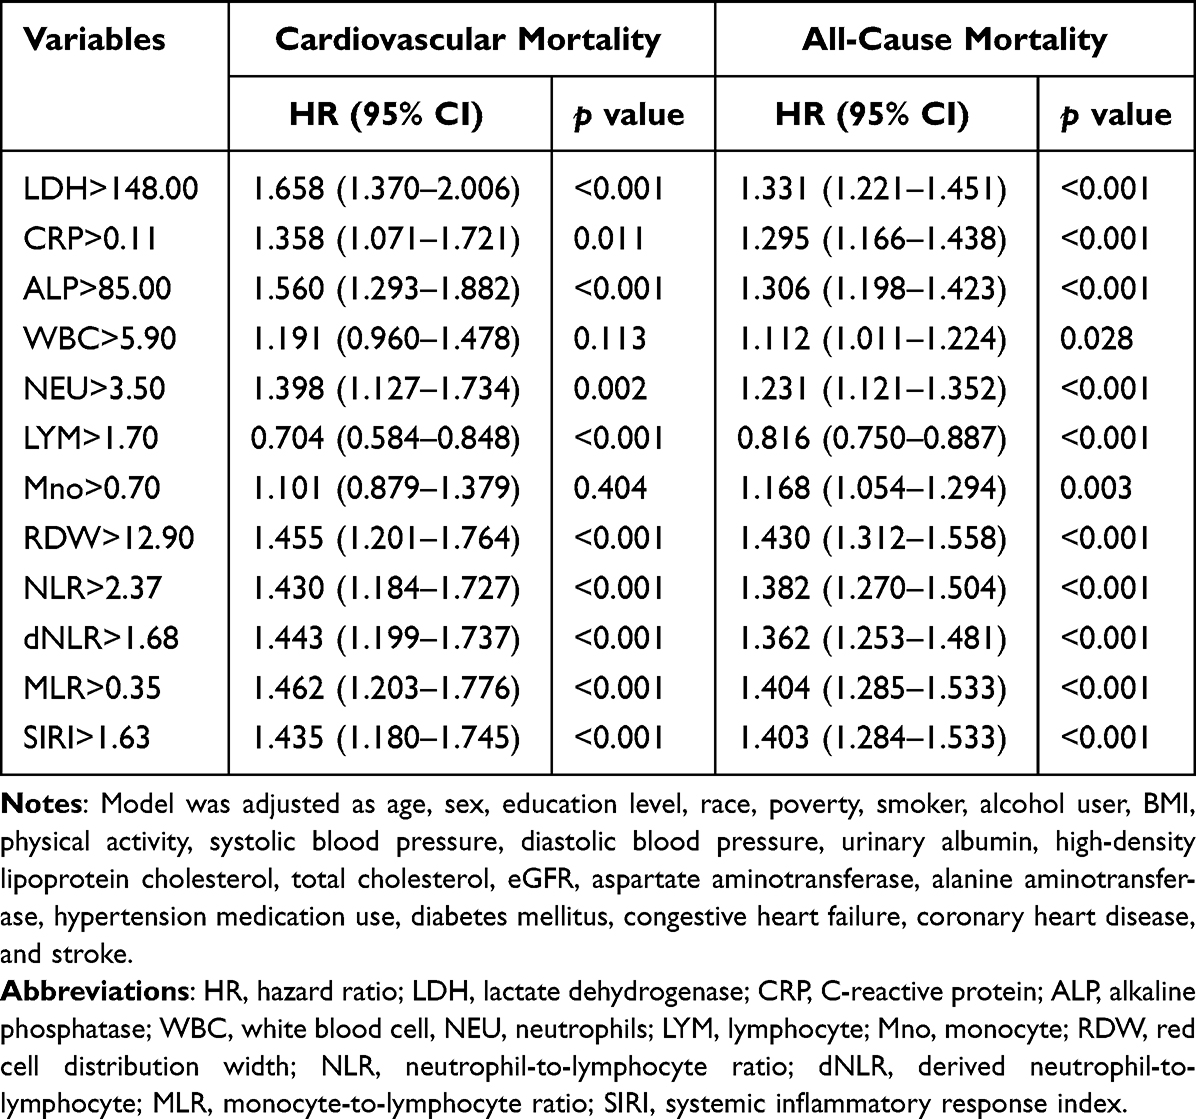 |
Table 2 Multivariate Cox Regression Analysis of Inflammatory Biomarkers for Cardiovascular and All-Cause Mortality in the Adult Population with Hypertension |
Construction of the IPS System
A statistical construction and flowchart of the IPS system are shown in Figure 1. The correlation matrix for these 12 inflammatory biomarkers (correlation coefficient R, form −1 [red] to 1 [blue]) is presented in Figure S4. Using the LASSO Cox regression model, 7 inflammatory markers including LDH, ALP, LYM, NLR, MLR, SIRI, and RDW were selected. Based on the coefficients at the optimal value (Figure 1A and B), IPS score for HTN patients was calculated as follows: IPS = LDH × 0.274 + ALP × 0.203 – LYM × 0.172 + NLR × 0.094 + MLR × 0.397 + SIRI × 0.178 + RDW × 0.446.
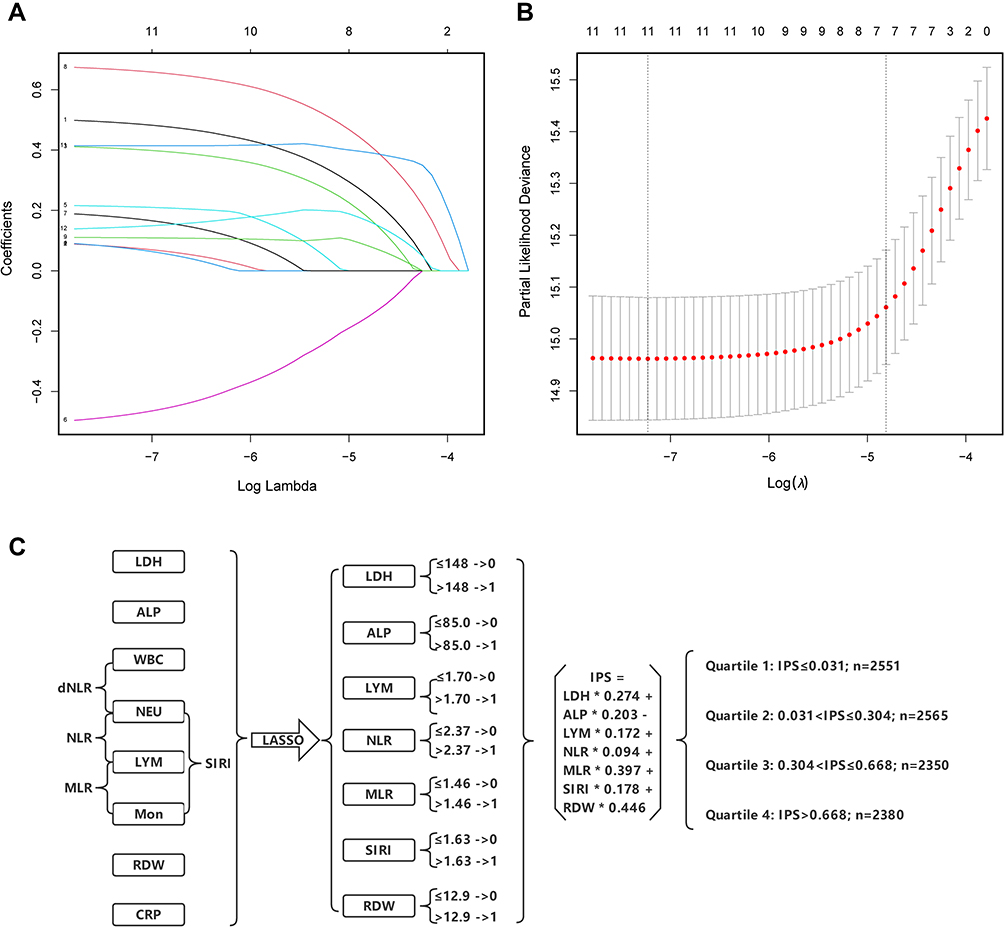 |
Figure 1 Construction of the Inflammatory Prognostic Scoring (IPS) System. (A) LASSO coefficient profiles of the 12 inflammatory biomarkers. The horizontal axis represented the log(λ) value of the independent variable, the horizontal axis represented the number of variables with non-zero coefficient, the vertical axis represented the coefficient of the independent variable, and each curve represented the variation trajectory of the coefficient of each independent variable. (B) Ten-fold cross-validation for tuning parameter selection in the LASSO model. The dotted vertical lines were drawn at the best value of log(λ) by using the minimum criteria and 1-SE criteria. Solid vertical lines represented partial likelihood deviance ± SE. The intersection point of the left dotted line and the abscissa axis (bottom) showed the optimal value of log(λ), the corresponding value in the abscissa axis showed the number of variables with non-zero coefficient identified at the optimal log(λ). (C) Process diagram for IPS system construction and risk stratification based on quartiles. Abbreviations: LDH, lactate dehydrogenase; CRP, C-reactive protein; ALP, alkaline phosphatase; WBC, white blood cell; NEU, neutrophils; LYM, lymphocyte; Mno, monocyte; RDW, red cell distribution width; NLR, neutrophil-to-lymphocyte ratio; dNLR, derived neutrophil-to-lymphocyte; MLR, monocyte-to-lymphocyte ratio; SIRI, systemic inflammatory response index. |
Then, the IPS was stratified by quartiles to further explore the prognostic values (Q1: IPS ≤ 0.031, Q2: 0.031 < IPS ≤ 0.304, Q3: 0.304 < IPS ≤ 0.668, Q4: IPS > 0.668). Kaplan–Meier curves showed that HTN patients with higher IPS had significantly worse long-term prognoses (Figure 2A: Cardiovascular mortality, p log-rank <0.001; Figure 2B: All-cause mortality, p log-rank <0.001) across the quartiles.
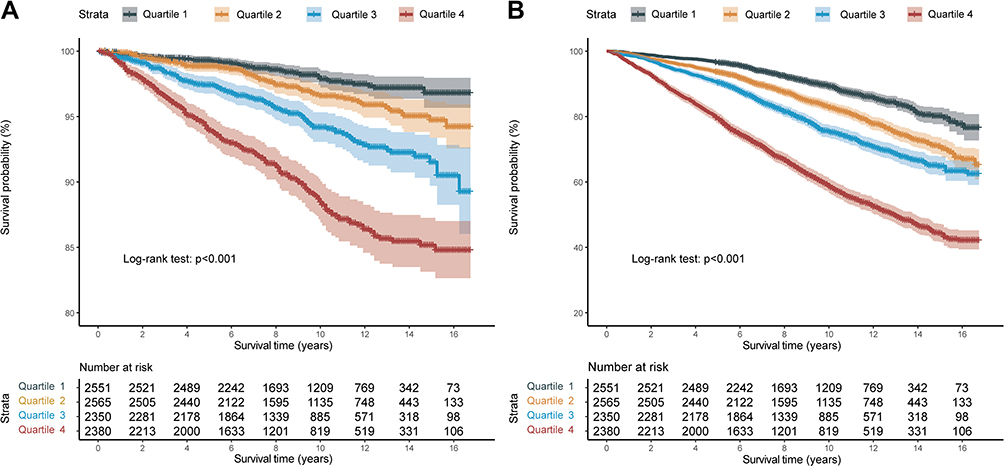 |
Figure 2 Kaplan-Meier survival curve between different quartile of the inflammatory prognostic scoring system. (A) Cardiovascular mortality; (B) All-cause mortality. |
Prognostic Values of IPS System
Furthermore, multivariate COX regression analysis (Table 3) showed that the predictive value of IPS in both cardiovascular mortality and all-cause mortality were significantly different between quartiles (All p for trend <0.001); Compared to Q1, the highest quartile (Q4) of IPS remained statistically significant after adjustment in both cardiovascular mortality (Model 3: HR = 2.528, 95% CI 1.840–3.473, p < 0.001) and all-cause mortality (Model 3: HR = 2.029, 95% CI 1.775–2.318, p < 0.001).
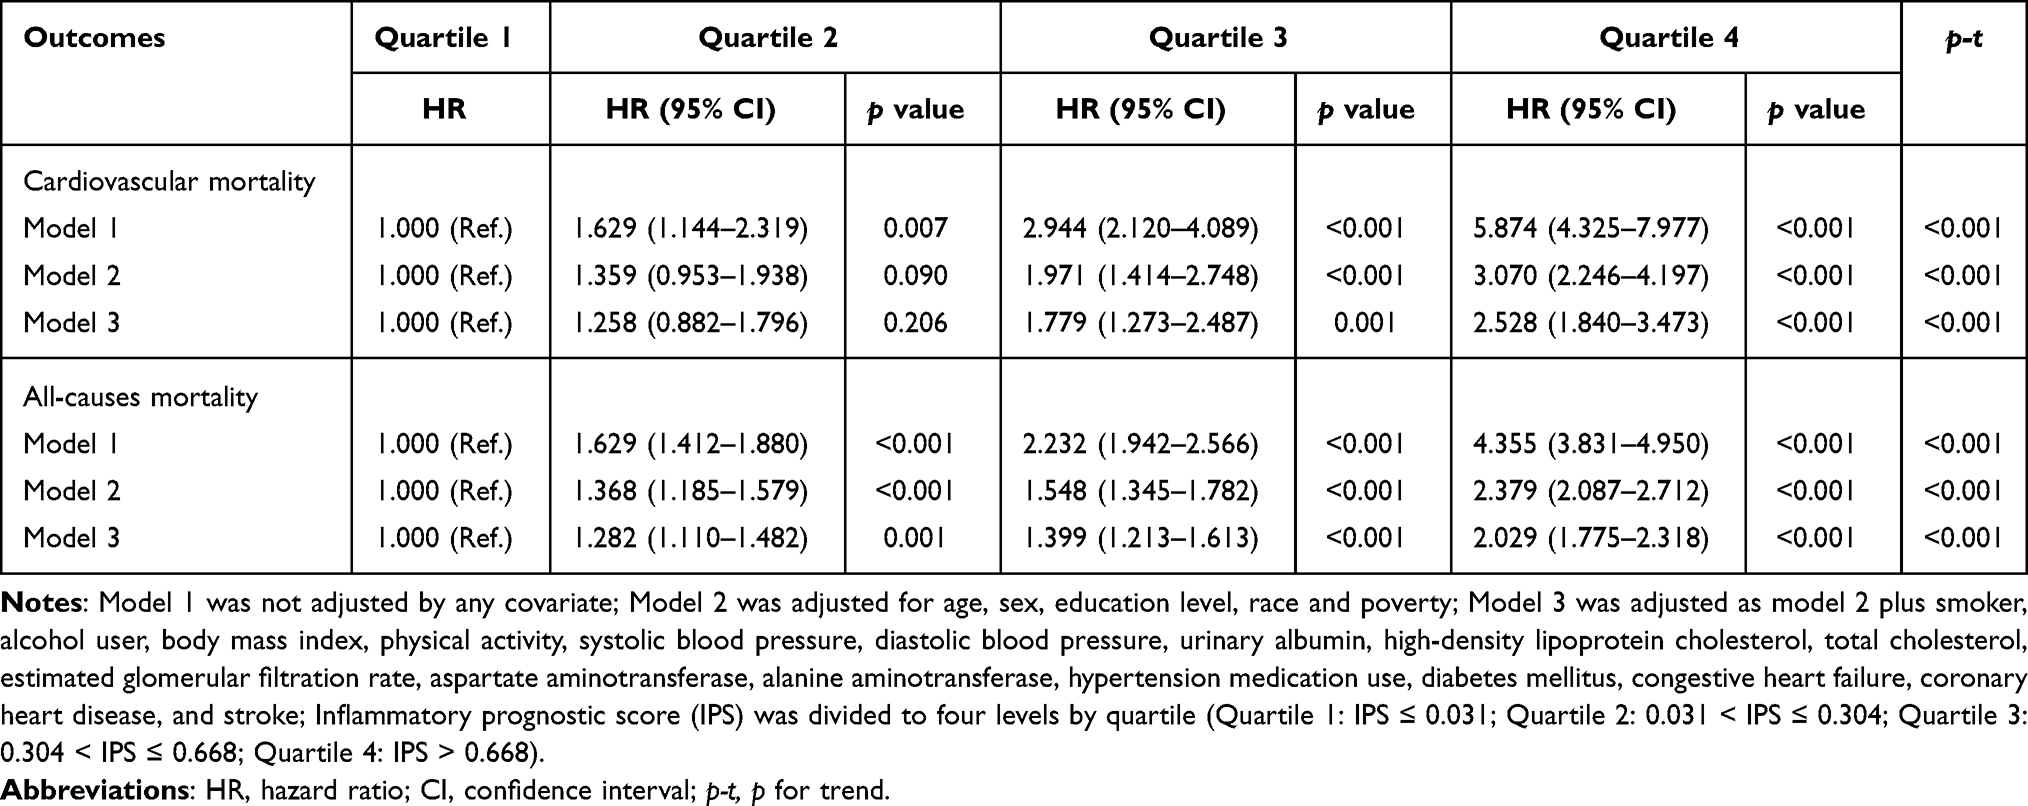 |
Table 3 Cox Regression Analysis of Inflammatory Prognostic Score (IPS) for All-Cause and Cardiovascular Mortality in the Adult Population with Hypertension |
To further evaluate the linearity between the IPS and the risk of mortality, RCS model showed a linear association with cardiovascular mortality (p for non-linearity = 0.674, Figure 3A) and all-cause mortality (p for non-linearity = 0.129, Figure 3B).
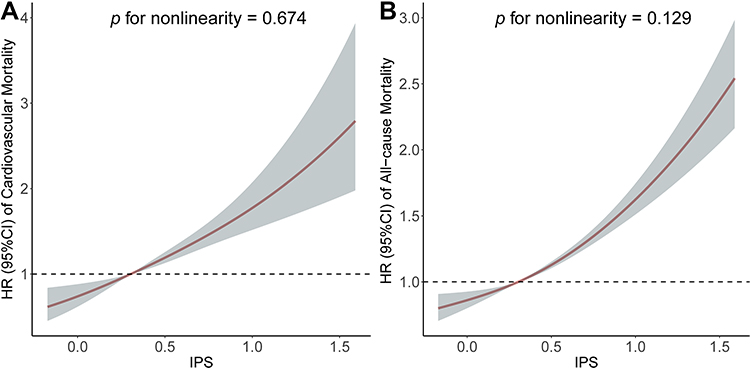 |
Figure 3 Association of the inflammatory prognostic scoring system with cardiovascular mortality and all-cause mortality. Adjusted hazard ratio of the mortality from a restricted cubic spline logistic regression model with knots at the 5th, 35th, 65th, and 95th percentiles. Adjusted for age, sex, education level, race, poverty, smoker, alcohol user, body mass index, physical activity, systolic blood pressure, diastolic blood pressure, urinary albumin, high-density lipoprotein cholesterol, total cholesterol, estimated glomerular filtration rate, aspartate aminotransferase, alanine aminotransferase, anti-hypertensive medicine use, diabetes mellitus, congestive heart failure, coronary heart disease, and stroke. The solid line and marked area represent the log-transformed hazard ratios and corresponding 95% confidence intervals. (A) Cardiovascular mortality; (B) All-cause mortality. |
Time-independent ROC analysis for the prediction of cardiovascular and all-cause mortality at different time points was performed (Figure 4). The area under the curve (AUC) demonstrated satisfactory predictive power of IPS in HTN patients. The optimal cut-off values for predicting the cardiovascular mortality were 0.482 for 5-year (sensitivity: 73.1%; specificity: 64.6%; AUC = 0.747 [0.716–0.779]), 0.402 for 8-year (sensitivity: 72.2%; specificity: 60.5%; AUC = 0.710 [0.681–0.738]), 0.402 for 10-year (sensitivity: 71.4%; specificity: 61.7%; AUC = 0.709 [0.682–0.737]), and 0.398 for 15-year (sensitivity: 67.9%; specificity: 55.6%; AUC = 0.630 [0.594–0.666]), respectively. To be noted, the prognostic values of IPS in all-cause mortality showed a similar power at these time points.
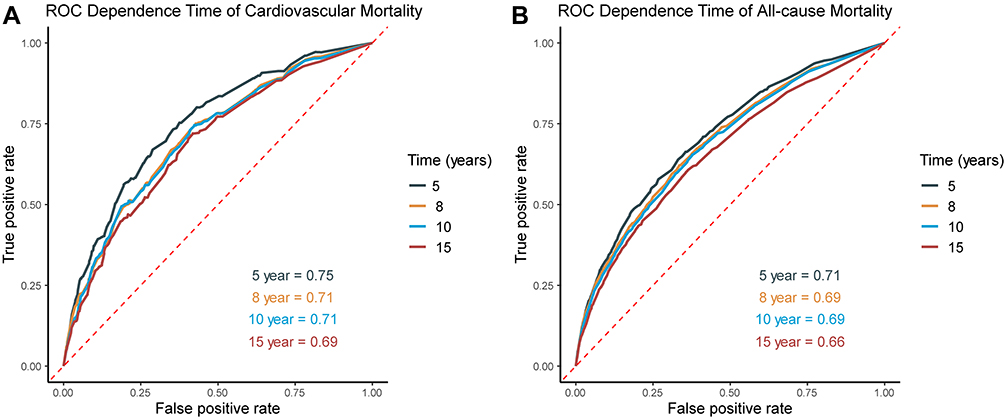 |
Figure 4 Time-dependent ROC analysis for 5-, 8-, 10- and 15-year prognostic predictions of inflammatory prognostic scoring system in adults with hypertension. (A) Cardiovascular mortality; (B) All-cause mortality. |
Random Survival Forests (RSF) Ranked Variable Importance
Further random forest VIMP and MD analysis of variables are plotted to verify its predictive value in cardiovascular mortality. Among the IPS and all 12 inflammatory markers, the IPS system remained the most predictive variable in both random forest survival models (Figure 5A and B). Furthermore, by comparing VIMP rankings and the minimal depth, IPS was the variable associated with cardiovascular mortality with the lowest VIMP rank and minimal depth value, indicating IPS was the factor most strongly associated with cardiovascular mortality in patients with HTN (Figure 5C).
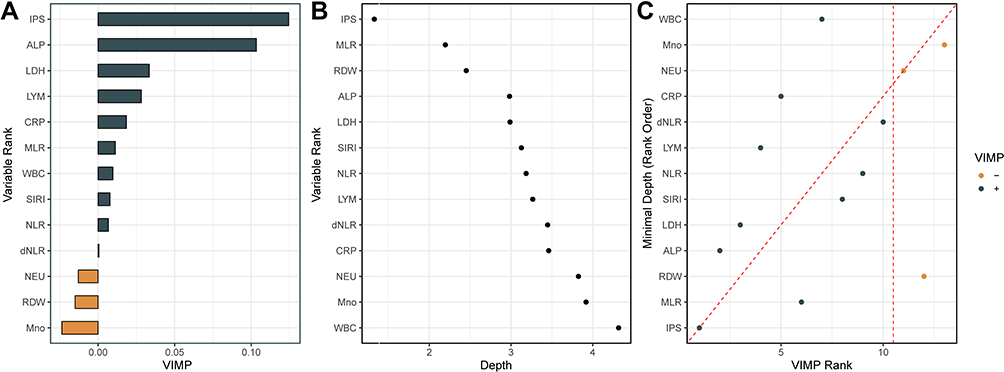 |
Figure 5 Variable importance (VIMP) and minimal depth (MD) from random survival forest analysis for cardiovascular mortality. (A) VIMP plot. Positive values indicate that including that variable in the model decreased the model’s error, whereas negative values indicate an increase in error. (B) For minimal depth, low values indicate that variable has stronger predictive value. (C) Comparison of the VIMP ranking and MD. Dashed vertical lines show the selected thresholds for variable selection. The farther the points are from the diagonal line, the more the discrepancy between measures; points above have higher VIMP ranking, indicating the variables are more sensitive to misspecification; those below have higher MD ranking, indicating they are better at dividing large portions of the population. Abbreviations: IPS, inflammatory prognostic scoring; ALP, alkaline phosphatase; LDH, lactate dehydrogenase; LYM, lymphocyte; CRP, C-reactive protein; MLR, monocyte-to-lymphocyte ratio; WBC, white blood cell; SIRI, systemic inflammatory response index; NLR, neutrophil-to-lymphocyte ratio; dNLR, derived neutrophil-to-lymphocyte; NEU, neutrophils; RDW, red cell distribution width; Mno, monocyte. |
Also, similar results regarding the outcome of all-cause mortality in HTN patients by random survival forests showed that IPS was the most predictive of the markers (Figure S5).
Discussion
In this study, we explored the prognostic values of inflammatory prognostic score (IPS) based on the baseline inflammatory markers selected by the LASSO analysis (LDH, ALP, LYM, NLR, MLR, SIRI, and RDW). According to the quartiles of IPS, the higher score group showed a significantly worse long-term outcome in cardiovascular mortality and all-cause mortality. The multivariate Cox regression analysis revealed that the high-IPS was significantly related to poorer prognosis of patients with hypertension, which showed satisfactory predictive performance in the following validation by RSF VIMP and MD analysis.
An increasing number of studies have demonstrated that vascular inflammation is related to the development, progression, and maintenance of hypertension.9,21,22 Many studies have examined the effects of these inflammatory markers. Chronic inflammation can also trigger oxidative stress, which has also been shown to associate with hypertension.23 This pathology cycle contributes to HTN patients’ adverse outcomes.22,24 Our initial analysis suggests that the measurement of circulating levels of 12 common inflammatory biomarkers such as LDH, CRP, ALP, WBC, NEU, LYM, Mno, RDW, NLR, dNLR, MLR, and SIRI, all provide certain prognostic information.
Among them, ALP could be seen increased in low-grade inflammation and essential hypertension. Evidence suggests that the mechanism might be related to the role of ALP in vascular calcification, which is recognized as a mediator between promoters and inhibitors of mineralization.25–27 Also, as a membrane-associated enzyme found in virtually all body tissues, LDH is released into the extracellular environment during cellular injury associated with inflammation.28 Multiple studies have found LDH to be a predictor of worse outcomes in patients with HTN and various conditions.29,30 In a way, both ALP and LDH are distributed in several ways and the presence of different diseases can be suspected and limited their role. Furthermore, inflammatory cells, as mediators of the inflammatory response, play a very important part in the systemic microenvironment. The corresponding biomarkers, including LYM, NLR, MLR, and SIRI, are significantly associated with survival and have been considered subclinical inflammatory markers.31–35 RDW measures the differences in the volume and size of red blood cells and can reflect the presence of chronic inflammation36 and also increased risk of cardiovascular outcomes.37–40
However, these systemic inflammatory biomarkers are nonspecific for vascular inflammation and their circulating levels could also be influenced by various systemic factors. These estimates could be affected by the complexity and diversity of error in using a single indicator. Nowadays, there are an increasing number of studies on developing risk stratification or prognostic signature based on various novel biomarkers, but most markers are limited to preclinical explorations or due to the high economic burden to implement in epidemiological screening.41 Therefore, the combined use of the biomarkers is undoubtedly a wise application in clinical practice.42
In this study, we performed the LASSO Cox regression analysis to avoid the influence of multicollinearity to some extent and identified the 7 effective valuable inflammatory indexes in the IPS system. The system integrated these related and acquirable markers that reflect systemic inflammatory status and has certain prognostic value in cardiovascular diseases.43 Our findings also indicated that the IPS of HTN patients had the highest predictive values among the study parameters, suggesting the possibility of utilization in epidemiological risk stratification in HTN population. The IPS constructed based on these markers which were accessible in practice could be used to quantify the risk of outcome in HTN patients, which is important for individualized risk stratification and early intervention to improve prognosis.
Our study has several limitations that should be properly acknowledged. First, results were based on 12 serum inflammatory markers on baseline data from the cross-sectional study design. The dynamic change of these markers on the survival outcomes of patients was poorly understood. Second, inflammation in hypertension may only be one of the potential components in myriad pathways in causing cardiovascular adverse disease. Third, although NHANES study only included the general population, the chronic inflammatory conditions (eg, autoimmune diseases) and the type of hypertension could not be sufficiently characterized. Last, the relatively low AUC for a 15-year prognosis should be noted and interpreted with caution. Therefore, the current results should be considered carefully when establishing the relationship and causality. Further prospective and interventional studies are needed to confirm the observed relationship.
Conclusion
By integrating the clinical accessible and economic inflammatory markers, current study constructed prognostic scoring system – IPS (including 7 parameters of LDH, ALP, LYM, NLR, MLR, SIRI, and RDW) in adult patients with hypertension. IPS was shown to remain an independent factor of adverse long-term outcomes in HTN patients and has an excellent predictive value for HTN risk stratification.
Data Sharing Statement
The datasets generated during and/or analyzed during the current study are available at https://wwwn.cdc.gov/nchs/nhanes/default.aspx.
Ethical Approval and Consent to Participate
The NHANES research protocols were approved by the NCHS Research Ethics Review Board and all participants provided written informed consent.
Acknowledgments
We appreciate the personnel who contributed to the NHANES data we studied.
Funding
No specific funding was received for this work.
Disclosure
The authors report no conflicts of interest in relation to this work.
References
1. Muntner P, Hardy ST, Fine LJ, et al. Trends in blood pressure control among US adults with hypertension, 1999–2000 to 2017–2018. JAMA. 2020;324(12):1190–1200. doi:10.1001/jama.2020.14545
2. Mahmood SS, Levy D, Vasan RS, Wang TJ. The Framingham Heart Study and the epidemiology of cardiovascular disease: a historical perspective. Lancet. 2014;383(9921):999–1008. doi:10.1016/S0140-6736(13)61752-3
3. Lu J, Lu Y, Wang X, et al. Prevalence, awareness, treatment, and control of hypertension in China: data from 1·7 million adults in a population-based screening study (China PEACE Million Persons Project). Lancet. 2017;390(10112):2549–2558. doi:10.1016/S0140-6736(17)32478-9
4. Hisamatsu T, Segawa H, Kadota A, Ohkubo T, Arima H, Miura K. Epidemiology of hypertension in Japan: beyond the new 2019 Japanese guidelines. Hypertens Res. 2020;43(12):1344–1351. doi:10.1038/s41440-020-0508-z
5. Unger T, Borghi C, Charchar F, et al. 2020 International Society of Hypertension global hypertension practice guidelines. J Hypertens. 2020;38(6):982–1004. doi:10.1097/HJH.0000000000002453
6. Kearney PM, Whelton M, Reynolds K, Muntner P, Whelton PK, He J. Global burden of hypertension: analysis of worldwide data. Lancet. 2005;365(9455):217–223. doi:10.1016/S0140-6736(05)17741-1
7. Savoia C, Schiffrin EL. Inflammation in hypertension. Curr Opin Nephrol Hypertens. 2006;15(2):152–158. doi:10.1097/01.mnh.0000203189.57513.76
8. Antonopoulos AS, Angelopoulos A, Papanikolaou P, et al. Biomarkers of vascular inflammation for cardiovascular risk prognostication: a meta-analysis. JACC Cardiovasc Imaging. 2022;15(3):460–471. doi:10.1016/j.jcmg.2021.09.014
9. Jayedi A, Rahimi K, Bautista LE, Nazarzadeh M, Zargar MS, Shab-Bidar S. Inflammation markers and risk of developing hypertension: a meta-analysis of cohort studies. Heart. 2019;105(9):686–692. doi:10.1136/heartjnl-2018-314216
10. Li H, Sun K, Zhao R, et al. Inflammatory biomarkers of coronary heart disease. Front Biosci. 2018;10(1):185–196. doi:10.2741/s508
11. Peters SA, Visseren FL, Grobbee DE. Biomarkers. Screening for C-reactive protein in CVD prediction. Nat Rev Cardiol. 2013;10(1):12–14. doi:10.1038/nrcardio.2012.164
12. Mozos I, Jianu D, Gug C, Stoian D. Links between high-sensitivity C-reactive protein and pulse wave analysis in middle-aged patients with hypertension and high normal blood pressure. Dis Markers. 2019;2019:2568069. doi:10.1155/2019/2568069
13. Citu C, Gorun F, Motoc A, et al. The predictive role of NLR, d-NLR, MLR, and SIRI in COVID-19 mortality. Diagnostics. 2022;12(1):122. doi:10.3390/diagnostics12010122
14. Zhang Y, Xing Z, Zhou K, Jiang S. The predictive role of systemic inflammation response index (SIRI) in the prognosis of stroke patients. Clin Interv Aging. 2021;16:1997–2007. doi:10.2147/CIA.S339221
15. Leroux A, Di J, Smirnova E, et al. Organizing and analyzing the activity data in NHANES. Stat Biosci. 2019;11(2):262–287. doi:10.1007/s12561-018-09229-9
16. Jarvis MJ, Tunstall-Pedoe H, Feyerabend C, Vesey C, Saloojee Y. Comparison of tests used to distinguish smokers from nonsmokers. Am J Public Health. 1987;77(11):1435–1438. doi:10.2105/ajph.77.11.1435
17. Pate RR, Pratt M, Blair SN, et al. Physical activity and public health. A recommendation from the Centers for Disease Control and Prevention and the American College of Sports Medicine. JAMA. 1995;273(5):402–407. doi:10.1001/jama.273.5.402
18. Levey AS, Stevens LA, Schmid CH, et al.; CKD-EPI (Chronic Kidney Disease Epidemiology Collaboration). A new equation to estimate glomerular filtration rate. Ann Intern Med. 2009;150(9):604–612. doi:10.7326/0003-4819-150-9-200905050-00006
19. Breiman L. Random Forests. Mach Learn. 2001;45(1):5–32. doi:10.1023/A:1010933404324
20. Mogensen UB, Ishwaran H, Gerds TA. Evaluating random forests for survival analysis using prediction error curves. J Stat Softw. 2012;50(11):1–23. doi:10.18637/jss.v050.i11
21. Pugh D, Dhaun N. Hypertension and vascular inflammation: another piece of the genetic puzzle. Hypertension. 2021;77(1):190–192. doi:10.1161/HYPERTENSIONAHA.120.16420
22. Madhur MS, Elijovich F, Alexander MR, et al. Hypertension: do inflammation and immunity hold the key to solving this epidemic? Circ Res. 2021;128(7):908–933. doi:10.1161/CIRCRESAHA.121.318052
23. Boos CJ, Toon LT, Almahdi H. The relationship between ambulatory arterial stiffness, inflammation, blood pressure dipping and cardiovascular outcomes. BMC Cardiovasc Disord. 2021;21(1):139. doi:10.1186/s12872-021-01946-2
24. Quarck R, Nawrot T, Meyns B, Delcroix M. C-reactive protein: a new predictor of adverse outcome in pulmonary arterial hypertension. J Am Coll Cardiol. 2009;53(14):1211–1218. doi:10.1016/j.jacc.2008.12.038
25. Jackson EK, Cheng D, Ritov VB, Mi Z. Alkaline phosphatase activity is a key determinant of vascular responsiveness to norepinephrine. Hypertension. 2020;76(4):1308–1318. doi:10.1161/HYPERTENSIONAHA.120.15822
26. Shimizu Y, Nakazato M, Sekita T, et al. Association between alkaline phosphatase and hypertension in a rural Japanese population: the Nagasaki Islands study. J Physiol Anthropol. 2013;32(1):10. doi:10.1186/1880-6805-32-10
27. Haarhaus M, Brandenburg V, Kalantar-Zadeh K, Stenvinkel P, Magnusson P. Alkaline phosphatase: a novel treatment target for cardiovascular disease in CKD. Nat Rev Nephrol. 2017;13(7):429–442. doi:10.1038/nrneph.2017.60
28. Wu Y, Lu C, Pan N, et al. Serum lactate dehydrogenase activities as systems biomarkers for 48 types of human diseases. Sci Rep. 2021;11(1):12997. doi:10.1038/s41598-021-92430-6
29. Cai X, Wang T, Ye C, Xu G, Xie L. Relationship between lactate dehydrogenase and albuminuria in Chinese hypertensive patients. J Clin Hypertens. 2021;23(1):128–136. doi:10.1111/jch.14118
30. Yan H, Vijay A, Jiang F, et al. Serum glucose, lactate dehydrogenase and hypertension are mediators of the effect of body mass index on severity of COVID-19. Endocrinol Diabetes Metab. 2021;4(2):e00215. doi:10.1002/edm2.215
31. Schillaci G, Pirro M, Pucci G, et al. Prognostic value of elevated white blood cell count in hypertension. Am J Hypertens. 2007;20(4):364–369. doi:10.1016/j.amjhyper.2006.10.007
32. Celikbilek A, Ismailogullari S, Zararsiz G. Neutrophil to lymphocyte ratio predicts poor prognosis in ischemic cerebrovascular disease. J Clin Lab Anal. 2014;28(1):27–31. doi:10.1002/jcla.21639
33. Siedlinski M, Jozefczuk E, Xu X, et al. White blood cells and blood pressure: a Mendelian randomization study. Circulation. 2020;141(16):1307–1317. doi:10.1161/CIRCULATIONAHA.119.045102
34. Skrzypczyk P, Przychodzień J, Bombińska M, Kaczmarska Z, Mazur M, Pańczyk-Tomaszewska M. Complete blood count-derived inflammatory markers in adolescents with primary arterial hypertension: a preliminary report. Cent Eur J Immunol. 2018;43(4):434–441. doi:10.5114/ceji.2018.81353
35. Haas ME, Aragam KG, Emdin CA, et al. Genetic association of albuminuria with cardiometabolic disease and blood pressure. Am J Hum Genet. 2018;103(4):461–473. doi:10.1016/j.ajhg.2018.08.004
36. Lappé JM, Horne BD, Shah SH, et al. Red cell distribution width, C-reactive protein, the complete blood count, and mortality in patients with coronary disease and a normal comparison population. Clin Chim Acta. 2011;412(23–24):2094–2099. doi:10.1016/j.cca.2011.07.018
37. Ozcan F, Turak O, Durak A, et al. Red cell distribution width and inflammation in patients with non-dipper hypertension. Blood Press. 2013;22(2):80–85. doi:10.3109/08037051.2012.707336
38. Davidson SM, Andreadou I, Barile L, et al. Circulating blood cells and extracellular vesicles in acute cardioprotection. Cardiovasc Res. 2019;115(7):1156–1166. doi:10.1093/cvr/cvy314
39. Haybar H, Pezeshki SMS, Saki N. Evaluation of complete blood count parameters in cardiovascular diseases: an early indicator of prognosis? Exp Mol Pathol. 2019;110:104267. doi:10.1016/j.yexmp.2019.104267
40. Balan R, Bălăşescu E, Ion DA. Inflammation and arterial hypertension-pathophysiological links and clinical aspects. Curr Health Sci J. 2020;46(4):383–389. doi:10.12865/CHSJ.46.04.09
41. Rather RA, Dhawan V. Genetic markers: potential candidates for cardiovascular disease. Int J Cardiol. 2016;220:914–923. doi:10.1016/j.ijcard.2016.06.251
42. Holewijn S, den Heijer M, Kiemeney LA, Stalenhoef AF, de Graaf J. Combining risk markers improves cardiovascular risk prediction in women. Clin Sci. 2014;126(2):139–146. doi:10.1042/CS20130178
43. Ambale-Venkatesh B, Yang X, Wu CO, et al. Cardiovascular event prediction by machine learning: the multi-ethnic study of atherosclerosis. Circ Res. 2017;121(9):1092–1101. doi:10.1161/CIRCRESAHA.117.311312
 © 2022 The Author(s). This work is published and licensed by Dove Medical Press Limited. The full terms of this license are available at https://www.dovepress.com/terms.php and incorporate the Creative Commons Attribution - Non Commercial (unported, v3.0) License.
By accessing the work you hereby accept the Terms. Non-commercial uses of the work are permitted without any further permission from Dove Medical Press Limited, provided the work is properly attributed. For permission for commercial use of this work, please see paragraphs 4.2 and 5 of our Terms.
© 2022 The Author(s). This work is published and licensed by Dove Medical Press Limited. The full terms of this license are available at https://www.dovepress.com/terms.php and incorporate the Creative Commons Attribution - Non Commercial (unported, v3.0) License.
By accessing the work you hereby accept the Terms. Non-commercial uses of the work are permitted without any further permission from Dove Medical Press Limited, provided the work is properly attributed. For permission for commercial use of this work, please see paragraphs 4.2 and 5 of our Terms.