")
Back to Journals » Diabetes, Metabolic Syndrome and Obesity » Volume 13
Associations Between Thyroid Hormones and Glycated Albumin in Euthyroid and Subclinical Hypothyroid Individuals: Results of an Observational Study
Authors Nie X, Shen Y, Ma X, Xu Y, Wang Y, Zhou J , Bao Y
Received 30 October 2019
Accepted for publication 12 March 2020
Published 25 March 2020 Volume 2020:13 Pages 915—923
DOI https://doi.org/10.2147/DMSO.S236698
Checked for plagiarism Yes
Review by Single anonymous peer review
Peer reviewer comments 2
Editor who approved publication: Professor Ming-Hui Zou
Xiaomin Nie,* Yun Shen,* Xiaojing Ma, Yiting Xu, Yufei Wang, Jian Zhou, Yuqian Bao
Department of Endocrinology and Metabolism, Shanghai Jiao Tong University Affiliated Sixth People’s Hospital; Shanghai Clinical Center for Diabetes; Shanghai Key Clinical Center for Metabolic Disease; Shanghai Diabetes Institute; Shanghai Key Laboratory of Diabetes Mellitus, Shanghai 200233, People’s Republic of China
*These authors contributed equally to this work
Correspondence: Xiaojing Ma; Yuqian Bao
Department of Endocrinology and Metabolism, Shanghai Jiao Tong University Affiliated Sixth People’s Hospital, Shanghai Clinical Center for Diabetes; Shanghai Key Clinical Center for Metabolic Disease; Shanghai Diabetes Institute; Shanghai Key Laboratory of Diabetes Mellitus, 600 Yishan Road, Shanghai 200233, People’s Republic of China
Tel +86-21-64369181
Fax +86-21-64368031
Email [email protected]; [email protected]
Purpose: Although overt thyroid dysfunction has been found to influence the level of glycated albumin (GA), the associations between thyroid hormones and GA in individuals with euthyroidism and subclinical hypothyroidism (SHypo) are still unknown. The present study aimed to investigate whether thyroid hormones were related to GA in euthyroid and SHypo individuals.
Methods: We recruited 685 euthyroid and 103 SHypo subjects with normal weight from communities in Shanghai. Electrochemiluminescence immunoassay was used to detect the serum levels of free triiodothyronine (FT3), free thyroxine (FT4) and thyroid stimulating hormone. GA was detected by the enzymatic method. Glycated hemoglobin (HbA1c) was detected by high-performance liquid chromatography.
Results: Among the 788 subjects (age range 31– 81 years old), 307 were men and 481 were women. In the Spearman correlation analysis and multiple stepwise regression analysis, FT3 was negatively correlated with both GA and GA/HbA1c in euthyroid subjects (all P < 0.05). The values of GA and GA/HbA1c were reduced by approximately 0.30 and 0.05, respectively, for each 0.50 pmol/L increment in FT3. In SHypo subjects, FT4 was negatively associated with both GA and GA/HbA1c (all P < 0.05). The values of GA and GA/HbA1c were reduced by approximately 0.23 and 0.03, respectively, for each 1.00 pmol/L increment in FT4.
Conclusion: In euthyroid and SHypo subjects, more attention should be paid to the potential effects of individual differences in thyroid hormones on GA.
Keywords: glycated albumin, glycated hemoglobin, free triiodothyronine, free thyroxine
Introduction
Diabetes and thyroid diseases are closely related.1 The prevalence of thyroid dysfunction in diabetic patients is about 13–37%.2–4 Approximately one-third of patients with type 1 diabetes may develop thyroid dysfunction.5 On the other hand, thyroid dysfunction not only increases the risk of diabetes,6,7 but also affects the glycemic control of diabetic patients.1
Glycated albumin (GA) is a common indicator used for glucose monitoring and therapeutic evaluation. As an important complementary indicator of HbA1c, GA is characterized by higher sensitivity to short-term glucose fluctuation and as being free of disturbance from hemoglobin (Hb). GA is generated from a nonenzymatic glycation reaction between glucose and albumin (ALB). Factors that influence the turnover rate of ALB, such as thyroid dysfunction, may also influence the level of GA.8 Koga et al found that the level of GA was significantly higher in nondiabetic subjects with hypothyroidism than in euthyroid controls, while the level of GA was significantly lower in individuals with hyperthyroidism.9 Kim et al reported that thyroid hormone replacement decreased the level of GA.10 Recently, Miyamoto et al found that, compared to nondiabetic euthyroid controls, the GA to HbA1c ratio (GA/HbA1c) was significantly higher in individuals with hypothyroidism and was significantly lower in individuals with hyperthyroidism.11
Although the manifestation of subclinical hypothyroidism (SHypo) is often silent and obscure, SHypo is related to an increased risk of fracture, cardiovascular disease and all-cause mortality.12,13 The prevalence of SHypo is much higher than that of overt hypo- or hyperthyroidism.14 However, the relationships of thyroid hormones with GA and GA/HbA1c in euthyroid and SHypo individuals have not been reported previously. Since obesity is also an influencing factor of GA and thyroid hormones,15–17 the present study aimed to investigate the relationships of thyroid hormones with GA, HbA1c and GA/HbA1c in normal-weight euthyroid and SHypo subjects.
Methods
Study Design and Participant Enrollment
Subjects were recruited from communities in Shanghai from October 2015 to July 2016. The details of participant recruitment and data collection were described in our previous study.18 All participants completed questionnaires, physical examinations and laboratory tests. The inclusion criteria included voluntary participation and normal weight. The exclusion criteria included free triiodothyronine (FT3) or free thyroxine (FT4) out of the reference range; thyroid stimulating hormone (TSH) below the lower limit of the reference range or >10 mIU/L; thyroid hormone supplement or anti-thyroid therapy; a history of diabetes or cardiovascular disease; moderate to severe anemia; hypoalbuminemia; severe kidney or liver dysfunction; malignancy; acute infection; and use of lipid-lowering drugs, hypotensive drugs, glucocorticoids, sex hormones, amiodarone or lithium. All participants written informed consent. The study was approved by the Ethics Committee of the Shanghai Jiao Tong University Affiliated Sixth People’s Hospital and was conducted in accordance with the Declaration of Helsinki.
Anthropometric and Biochemical Assessments
Height, body weight and blood pressure were measured according to standard methods described in our previous study.18 Body mass index (BMI) = body weight (kg)/height2 (m2).
All subjects underwent a 75-g oral glucose tolerance test in the morning after an overnight fast of 10 hrs. Fasting plasma glucose (FPG), 2 hr plasma glucose (2hPG), fasting insulin (FINS), triglyceride (TG), total cholesterol (TC), high density lipoprotein-cholesterol (HDL-c), low density lipoprotein-cholesterol (LDL-c), serum creatinine and C-reactive protein (CRP) were detected according to methods described previously.18 Insulin resistance was evaluated by the homeostasis model assessment of insulin resistance (HOMA-IR) with the following formula: HOMA-IR = FINS (mU/L) × FPG (mmol/L)/22.5.19
Electrochemiluminescence immunoassay was used to measure FT3, FT4 and TSH on a Cobas e601 analyzer (Roche Diagnostics GmbH, Mannheim, Germany). The intra-assay coefficients for FT3, FT4 and TSH were <7.0%, <5.0% and <3.0%, respectively. The inter-assay coefficients for FT3, FT4 and TSH were <8.0%, <7.0% and <8.0%, respectively. The thyroid stimulating hormone index (TSHI) = lnTSH (mIU/L) + 0.1345 × FT4 (pmol/L).20 The thyrotroph thyroxine resistance index (TT4RI) = FT4 (pmol/L) × TSH (mIU/L).21 Serum levels of ALB were detected by the bromocresol green method (Kehua Bio-Engineering Co., Ltd., Shanghai, China). The enzymatic method (Lucica GA-L; Asahi Kasei Pharma Corporation, Tokyo, Japan) was used to detect GA on a 7600 analyzer (Hitachi, Tokyo, Japan). The intra- and inter-assay coefficients of GA were <3.30% and <4.73%, respectively. Hb was measured by sodium dodecyl sulfonate colorimetry. High-performance liquid chromatography was used to detect HbA1c on a Variant II HbA1c analyzer (Bio-Rad Inc., Hercules, CA, USA). The intra- and inter-assay coefficients of HbA1c were <2.58% and <3.39%, respectively.
Definitions
According to the 1998 criteria of the World Health Organization,22 normal weight was defined as 18.50 kg/m2 ≤ BMI < 25.00 kg/m2. In this study, euthyroid was defined as FT3, FT4 and TSH levels within the reference range. The reference ranges of FT3, FT4 and TSH were 3.10–6.80 pmol/L, 12.00–22.00 pmol/L and 0.27–4.20 mIU/L, respectively. SHypo was defined as 0.42 mIU/L < TSH ≤ 10.00 mIU/L with FT3 and FT4 levels within the reference range.23
Statistical Analysis
The Kolmogorov–Smirnov test was used to evaluate the normality of the distribution of all continuous variables. Normally distributed variables were expressed as the mean ± standard deviation. Variables with a skewed distribution were expressed as the median (interquartile range). For normally distributed variables, independent sample T-test was used for comparisons between two groups. For skewed variables, Mann–Whitney U-test and Kruskal–Wallis H-test were used for comparisons between two groups and trend analyses, respectively. For categorical variables, the chi-square test was used for comparisons among groups. The correlations between variables were assessed by Spearman correlation analysis. To explore the independent influencing factors of GA and GA/HbA1c, multiple stepwise regression analysis was applied. SPSS version 22.0 (SPSS, Inc., Chicago, IL, USA) statistical software was used for all data analyses. A two-tailed P value < 0.05 was considered statistically significant.
Results
The Clinical Characteristics of Subjects
The clinical characteristics of the subjects are listed in Table 1. A total of 788 participants (307 men and 481 women) were included in the final database. The average age was 59 ± 7 years (range from 31 to 81 years). The medians (interquartile range) of BMI, GA, HbA1c and GA/HbA1c were 22.41 (20.83–23.56) kg/m2, 13.65 (12.97–14.52) %, 5.70 (5.40–5.90) % and 2.43 (2.27–2.60), respectively.
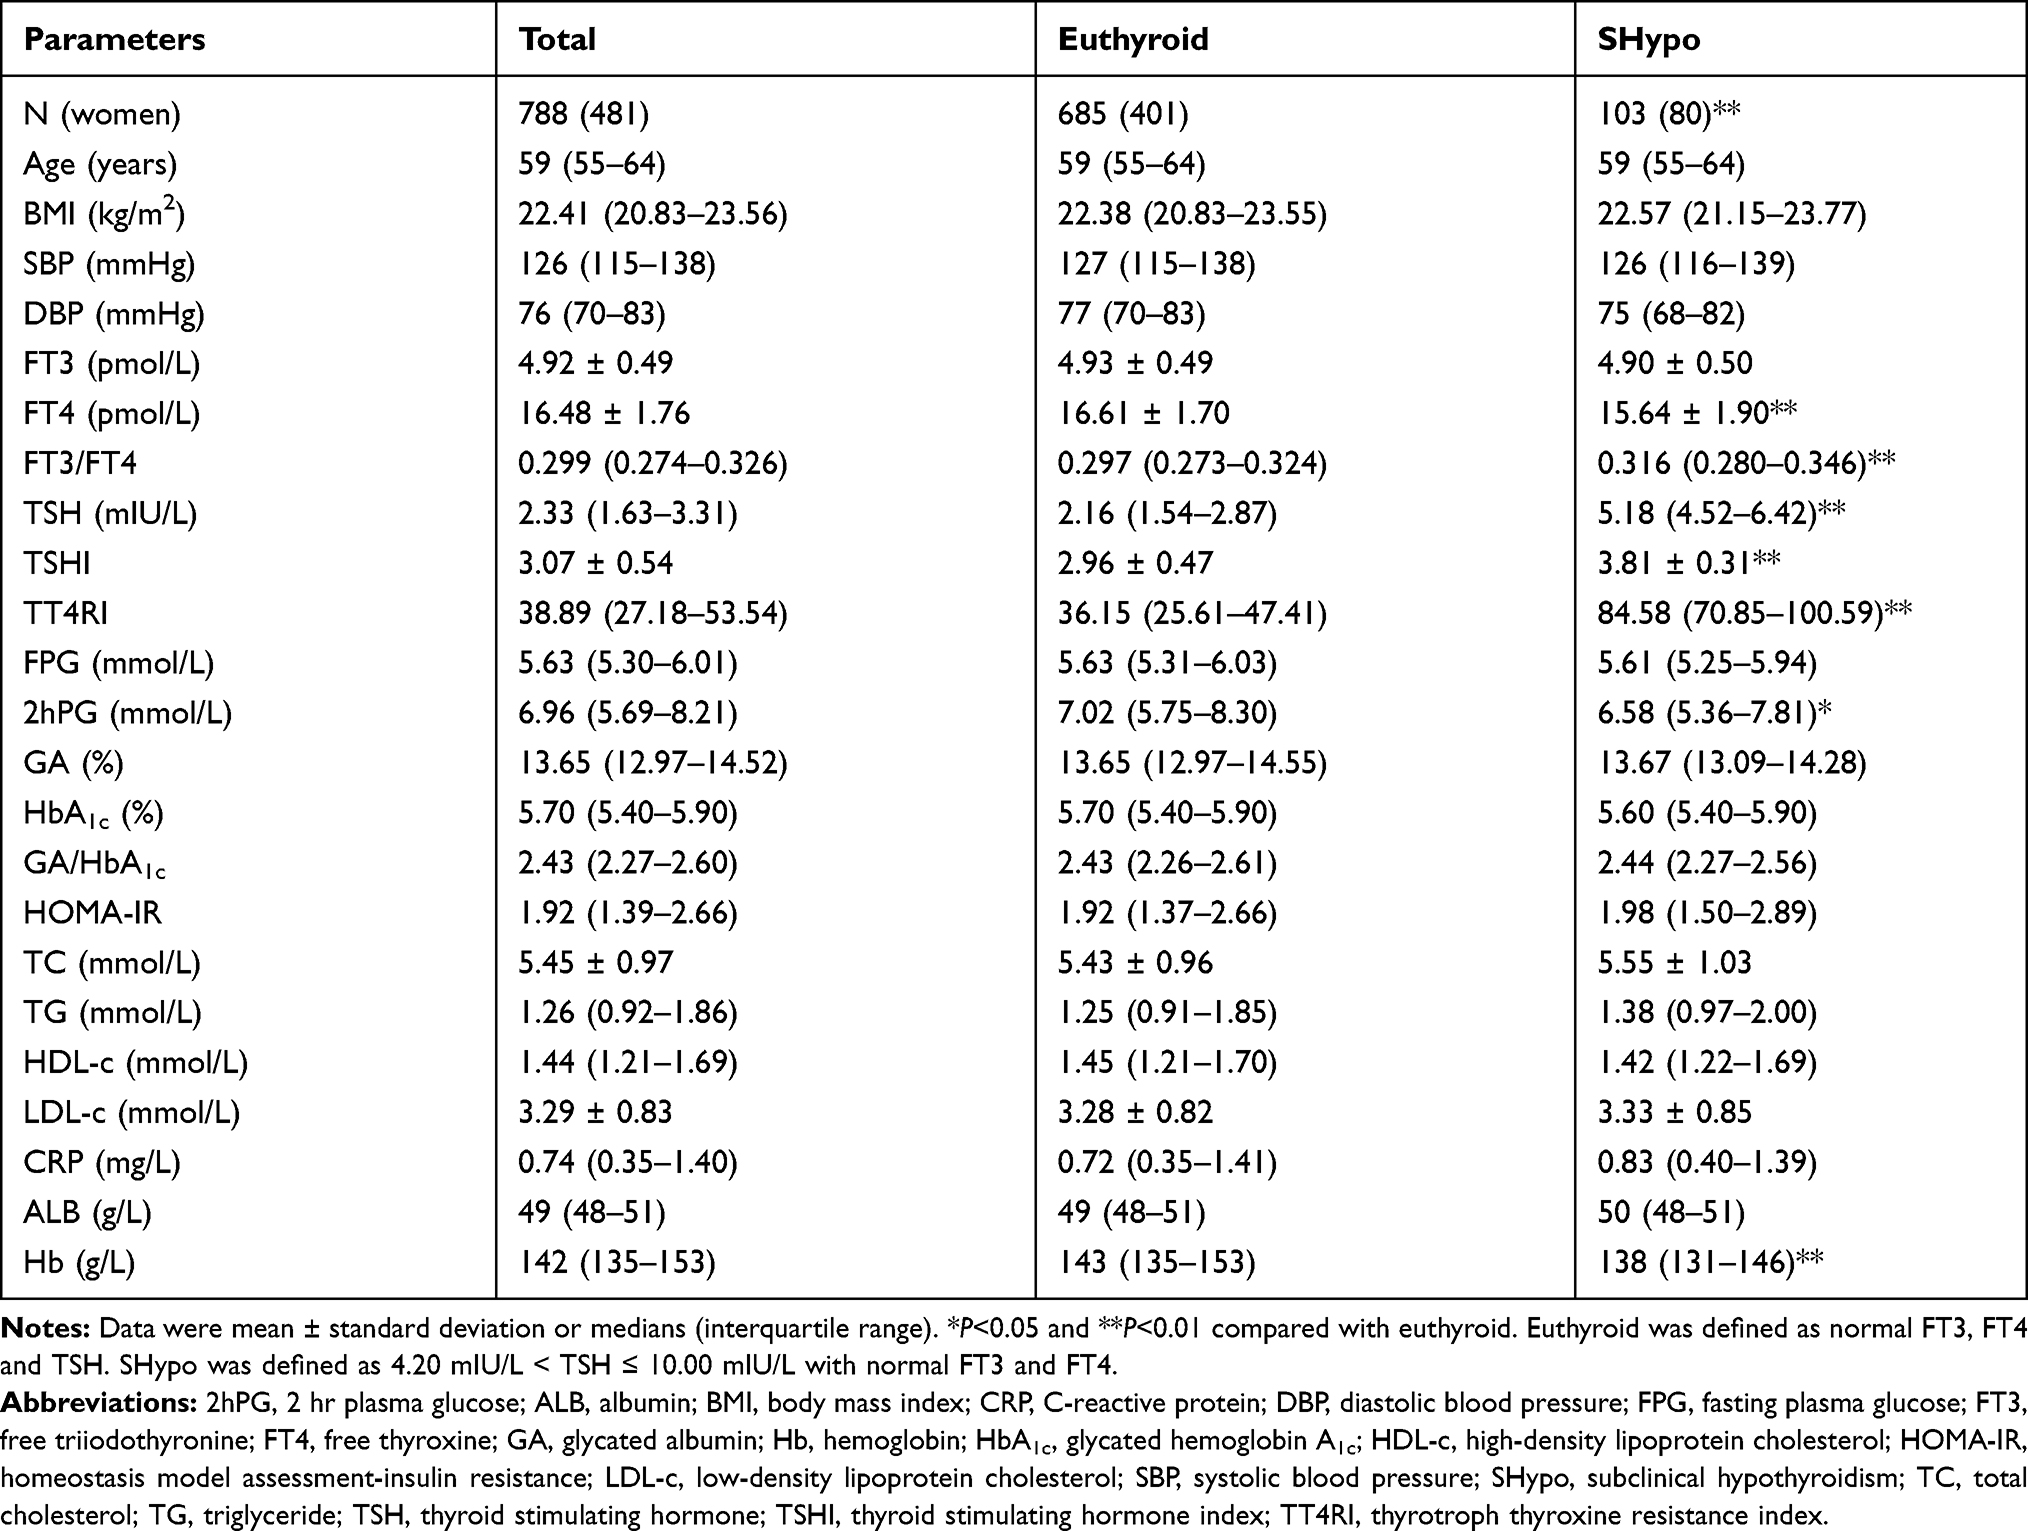 |
Table 1 Clinical Characteristics of Subjects |
Subjects were further divided into a euthyroid group (685 out of 788) and a SHypo group (103 out of 788). FT4, 2hPG and Hb in SHypo subjects were significantly lower than those in euthyroid subjects, while the percentage of women and the levels of FT3/FT4, TSH, TSHI and TT4RI were significantly higher in SHypo subjects than in euthyroid subjects (all P < 0.05). There were no significant differences between the two groups in terms of age, BMI, systolic blood pressure (SBP), diastolic blood pressure (DBP), FT3, FPG, GA, HbA1c, GA/HbA1c, HOMA-IR, TC, TG, HDL-c, LDL-c, CRP and ALB (all P > 0.05).
Covariance Analysis on the Difference of GA Between Euthyroid and SHypo Subjects
Covariance analysis was further used to evaluate the difference of GA between euthyroid and SHypo subjects (Figure 1). There was no difference in GA between euthyroid and SHypo subjects without adjustment (P = 0.311). After adjusting for gender and HbA1c, there was still no difference in GA between euthyroid and SHypo subjects (P = 0.960).
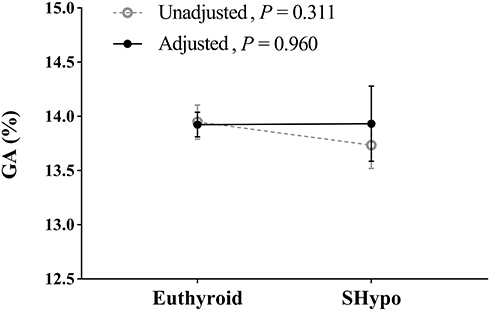 |
Figure 1 Covariance analysis on the difference of GA between euthyroid and SHypo subjects. The lines and bars indicate to the means and 95% confidence intervals. Gender and HbA1c were adjusted. Euthyroid was defined as normal FT3, FT4 and TSH levels. SHypo was defined as 4.20 mIU/L < TSH ≤ 10.00 mIU/L with normal FT3 and FT4 levels. |
Correlations of Thyroid Hormones with GA, HbA1c and GA/HbA1c
Spearman correlation analysis was used to explore the correlations of thyroid hormones with GA, HbA1c and GA/HbA1c (Table 2). In euthyroid subjects, GA and GA/HbA1c were negatively correlated with FT3 and FT3/FT4 (all P < 0.05), but were not correlated with FT4, TSH, TSHI or TT4RI (all P > 0.05). HbA1c was not correlated with FT3, FT4, FT3/FT4, TSH, TSHI or TT4RI (all P > 0.05). ALB and Hb were both positively correlated with FT3 and FT4, while ALB was also positively correlated with TSH, TSHI and TT4RI, Hb was also positively correlated with FT3/FT4 (all P < 0.05).
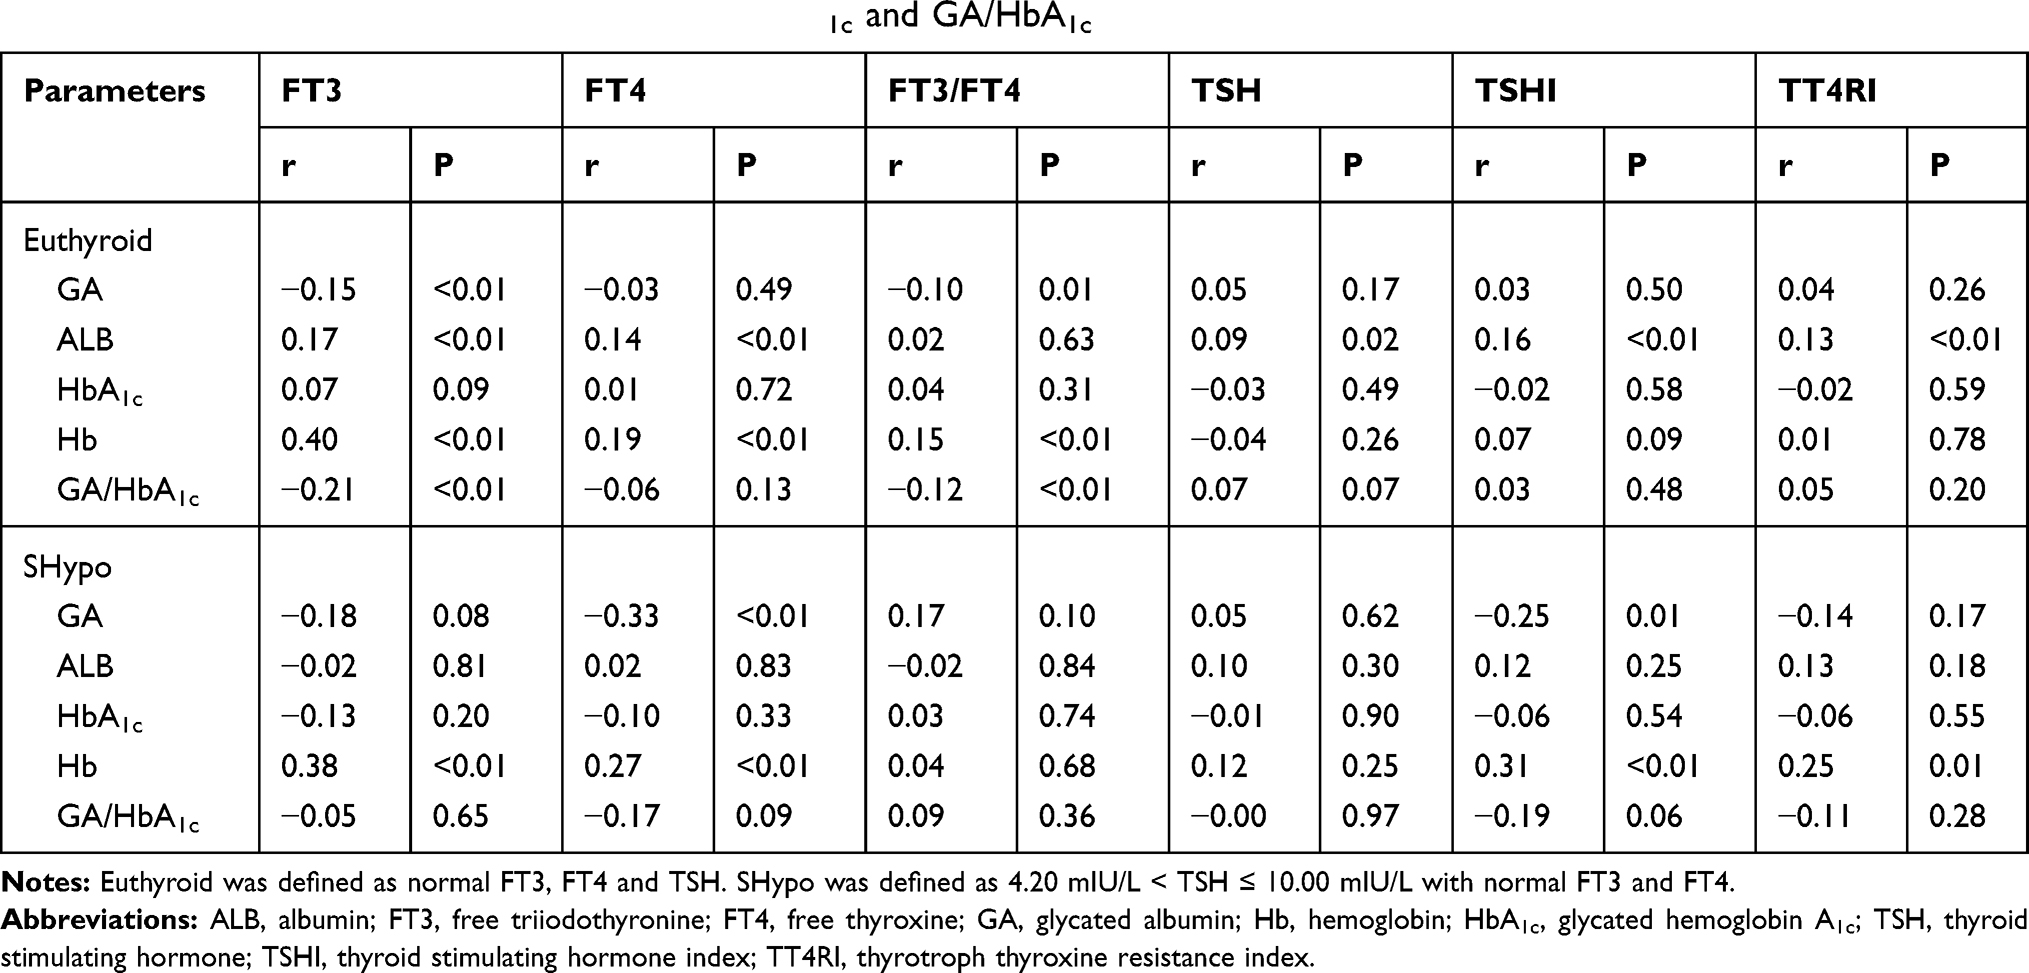 |
Table 2 Spearman Correlation Analysis for GA, HbA1c and GA/HbA1c |
In SHypo subjects, GA was negatively correlated with FT4 and TSHI (all P < 0.05), but was not correlated with FT3, FT3/FT4, TSH or TT4RI (all P > 0.05). Hb was positively correlated with FT3, FT4, TSHI and TT4RI (all P < 0.05), but was not correlated with FT3/FT4 or TSH (all P > 0.05). HbA1c, GA/HbA1c and ALB were not correlated with FT3, FT4, FT3/FT4, TSH, TSHI or TT4RI (all P > 0.05).
As shown in Figure 2, according to 0.50 pmol/L increments in FT3, euthyroid subjects were divided into 6 subgroups: 3.10–4.00 pmol/L (N = 16), 4.01–4.50 pmol/L (N = 125), 4.51–5.00 pmol/L (N = 242), 5.01–5.50 pmol/L (N = 226), 5.51–6.00 pmol/L (N = 67) and 6.01–6.80 pmol/L (N = 9). Both GA and GA/HbA1c showed significant decreasing trends with increasing FT3 (all P for trend < 0.05).
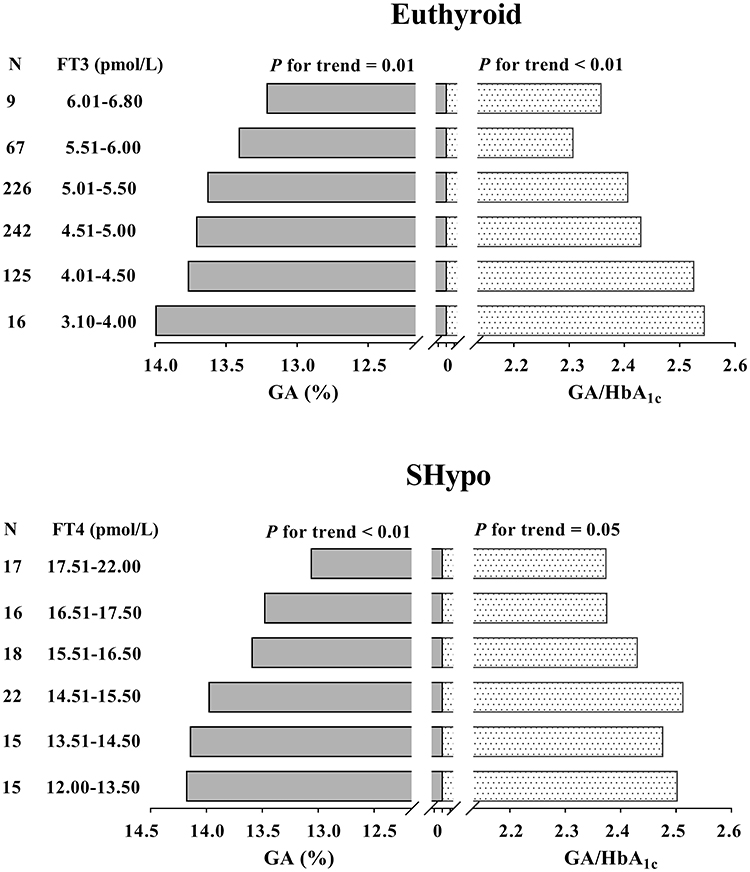 |
Figure 2 GA and GA/HbA1c levels with increasing thyroid hormones. Euthyroid was defined as normal FT3, FT4 and TSH levels. SHypo was defined as 4.20 mIU/L < TSH ≤ 10.00 mIU/L with normal FT3 and FT4 levels. |
According to 1.00 pmol/L increments in FT4, SHypo subjects were also divided into 6 subgroups: 12.00–13.50 pmol/L (N = 15), 13.51–14.50 pmol/L (N = 15), 14.51–15.50 pmol/L (N = 22), 15.51–16.50 pmol/L (N = 18), 16.51–17.50 pmol/L (N = 16) and 17.51–22.00 pmol/L (N = 17). GA showed a significant decreasing trend with increasing FT4 levels (P for trend < 0.05). However, the decreasing trend of GA/HbA1c with increasing FT4 was marginally significant (P for trend = 0.05).
Independent Influencing Factors of GA and GA/HbA1c
Multiple stepwise regression analysis was used to investigate the independent influencing factors of GA and GA/HbA1c (Table 3). The initial independent variables included gender, age, BMI, FT3, FT4, TSH, HbA1c (only for GA), SBP, DBP, TG, HDL-c, LDL-c, CRP, ALB and Hb.
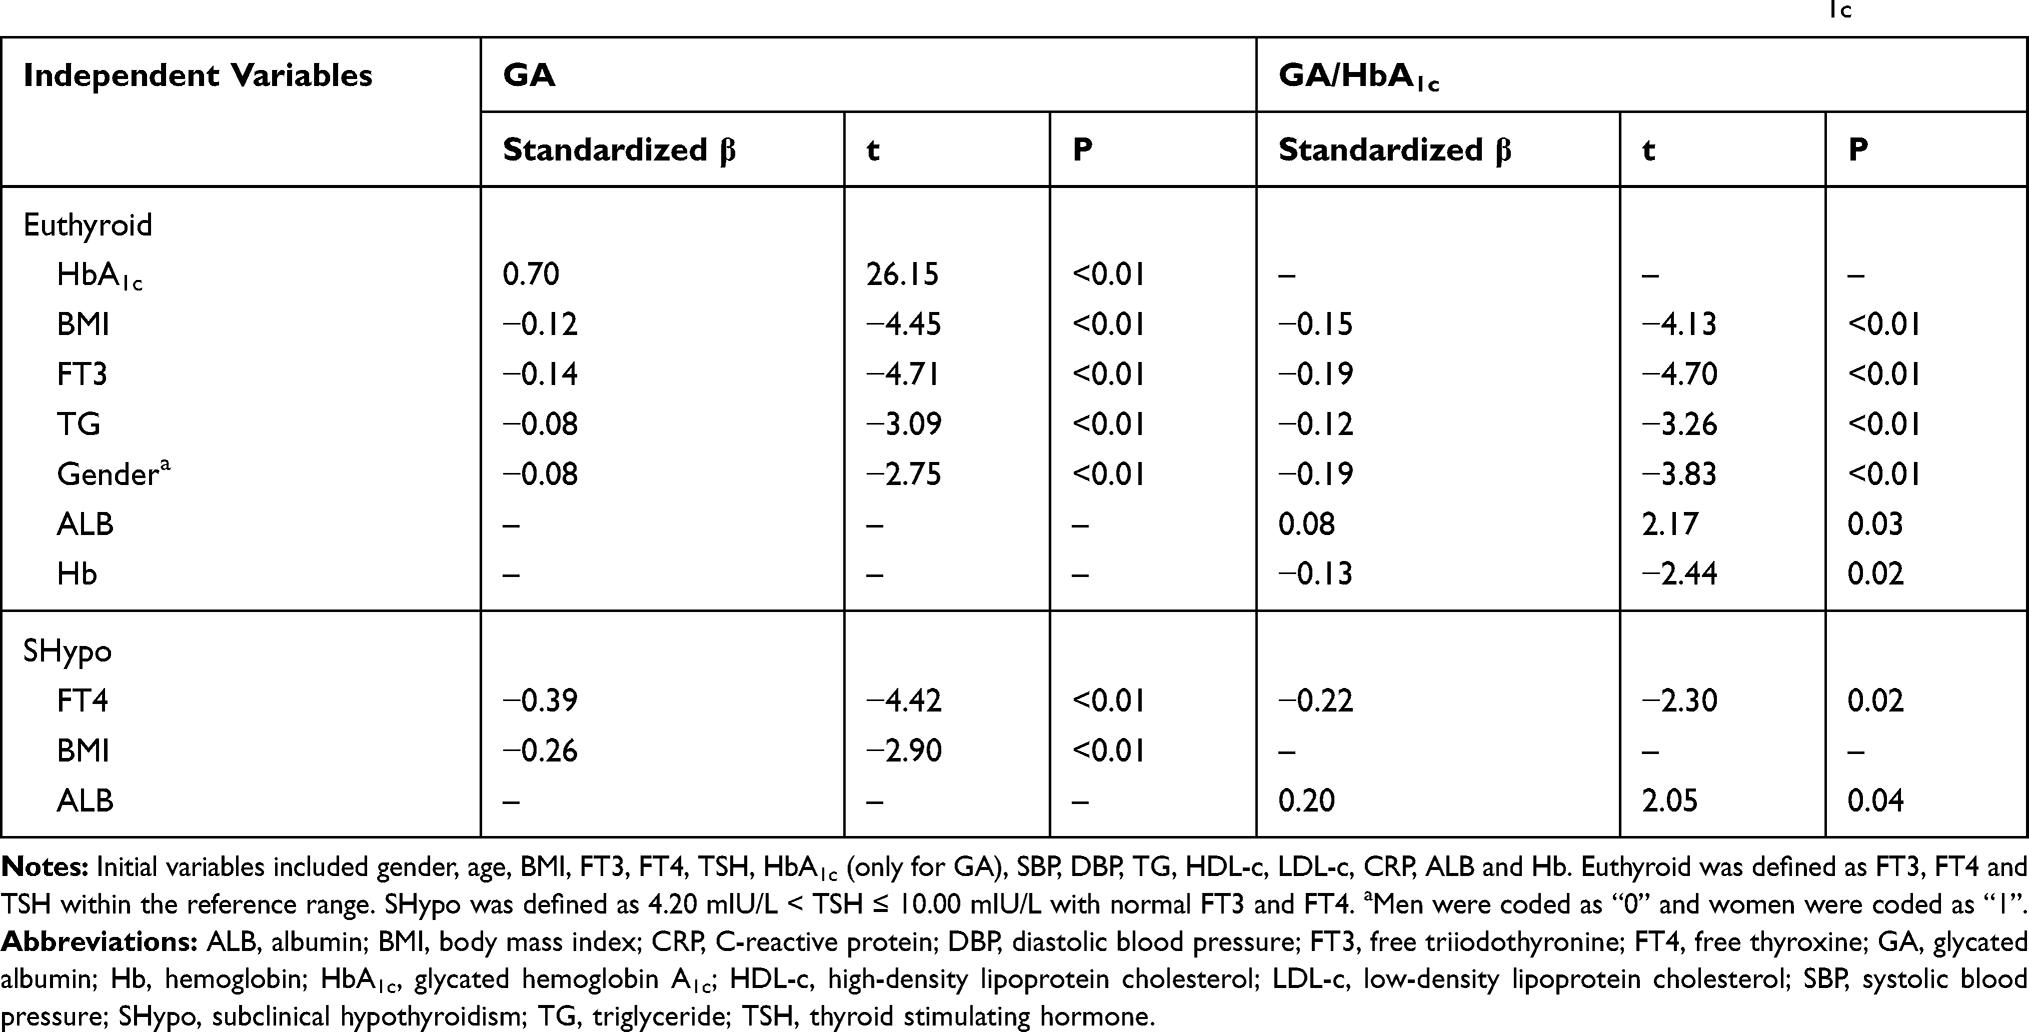 |
Table 3 Multiple Stepwise Regression Analysis Showing the Variables Independently Associated with GA and GA/HbA1c |
In euthyroid subjects, FT3 was independently and negatively correlated with both GA and GA/HbA1c (standardized β = −0.14 for GA, standardized β = −0.19 for GA/HbA1c, all P < 0.01). Moreover, HbA1c, BMI, TG and gender were independent influencing factors of GA (all P < 0.01). The independent influencing factors of GA/HbA1c also included BMI, TG, gender, ALB and Hb (all P < 0.05). Men had significantly higher GA and GA/HbA1c than women (all P < 0.01).
In SHypo subjects, FT4 was independently and negatively correlated with both GA and GA/HbA1c (standardized β = −0.39 for GA, standardized β = −0.22 for GA/HbA1c, all P < 0.05). Moreover, BMI was an independent influencing factor of GA (P < 0.01), while ALB was an independent influencing factor of GA/HbA1c (P = 0.04).
We further evaluated the extent of the influence of thyroid hormones on GA and GA/HbA1c values. In euthyroid subjects, the values (95% CI) of GA and GA/HbA1c were reduced by 0.30 (0.17, 0.42) and 0.05 (0.03, 0.07), respectively, for each 0.50 pmol/L increment in FT3. In SHypo subjects, the values (95% CI) of GA and GA/HbA1c were reduced by 0.23 (0.13, 0.33) and 0.03 (0.00, 0.05) for each 1.00 pmol/L increment in FT4 (Figure 3).
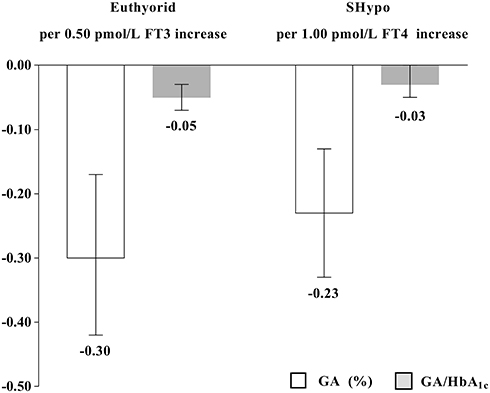 |
Figure 3 The extent of the influence of thyroid hormones on the values of GA and GA/HbA1c. The columns and bars indicate to the values and 95% confidence intervals. Euthyroid was defined as normal FT3, FT4 and TSH levels. SHypo was defined as 4.20 mIU/L < TSH ≤ 10.00 mIU/L with normal FT3 and FT4 levels. |
Discussion
The present study found that FT3 was independently and negatively related to GA and GA/HbA1c in euthyroid subjects, while FT4 was independently and negatively related to GA and GA/HbA1c in SHypo subjects. The results suggested that in euthyroid and SHypo subjects, more attention should be paid to the potential effects of individual differences in thyroid hormones on GA.
Glycation is the nonenzymatic reaction between glucose and the amino acid residues of proteins. Chronic hyperglycemia increases the concentration of glycated proteins which includes HbA1c and GA.24 Compared to HbA1c, GA is more sensitive to short-term glucose fluctuation and is not influenced by the erythrocyte lifespan or iron deficiency.25 Considering the importance of GA in clinical application, elucidating the influencing factors of GA is essential for glucose monitoring. Our previous study found that obesity was an influencing factor of GA.16 Since obesity is a factor that influences both GA and thyroid hormones,15,17 overweight and obese subjects were excluded from this study. Moreover, factors that influence the turnover rate of ALB may also influence the level of GA.
Thyroid dysfunction was reported to affect the metabolic rate of ALB.8 Previous studies have found that overt thyroid dysfunction significantly affected the level of GA. Moriyama et al reported a case of type 2 diabetes patient who had inhibited thyroid function due to overeating seaweed. The level of GA increased markedly with increasing TSH, while HbA1c and FPG remained within the normal range. After the patient stopped eating seaweed, the level of GA declined together with that of TSH. However, HbA1c remained within the normal range despite the changes in TSH and GA levels.26 Koga et al recruited 23 untreated nondiabetic patients with hypo- or hyperthyroidism and 25 subjects with euthyroid as a control. They found that GA in individuals with hypothyroidism was significantly higher than that in controls, and GA in individuals with hyperthyroidism was significantly lower than that in controls. There were no differences in HbA1c among the three groups. Furthermore, GA was positively related to TSH but negatively related to FT3 and FT4.9 In 45 nondiabetic hypothyroidism patients and 180 euthyroid subjects, Kim et al found that hypothyroidism patients had significantly higher HbA1c than controls. HbA1c and GA were also measured in 30 nondiabetic hypothyroidism patients before and after thyroid hormone replacement. Both GA and HbA1c decreased significantly after thyroid hormone replacement.10 In a recent study, Miyamoto et al recruited 92 nondiabetic hypo- or hyperthyroidism patients and 80 euthyroid controls. They found that, compared with euthyroid controls, hypothyroidism patients had significantly higher GA/HbA1c, while hyperthyroidism patients had significantly lower GA/HbA1c.11
In the basal and unstimulated condition, the thyroid gland produces relatively low level of thyroid hormones, a majority of which is prohormone FT4.27 The bioactive form FT3 exerts genomic effects by directly binding to the nuclear receptor. In the human body, up to 85% of circulating FT3 is produced by the extrathyroidal pathways including type 2 iodothyronine deiodinase (DIO2) and DIO1.28 Because of the expression of different types of transporters, FT4 is easier to get through the blood-brain barrier than FT3.29 Previous study has indicated that the hypothalamus-pituitary-thyroid axis is controlled by the DIO2-mediated conversion from FT4 to FT3 in hypothalamus.30 The regulation of DIO2 is conserved and steady, and transducing minor change of the circulating FT4 levels. The interplay between TSH and FT4 forms the so called “set point”. Thus, in euthyroidism, the change of TSH and FT4 is subtle and tightly controlled. In this case, FT3 may contribute to the DIO-mediated adaptive response. In our study, we also found that, in euthyroid subjects, GA and GA/HbA1c were all significantly and negatively correlated with FT3 and FT3/FT4, but not correlated with FT4 or TSH.
In SHypo subjects, the activity of DIO2 and thus the conversion rate of FT4 to FT3 are all significantly increased in almost all tissues, which coincide well with our results that FT3/FT4 was significantly higher in SHypo subjects than in euthyroid subjects. We also found that FT3/FT4 was negatively correlated with GA and GA/HbA1c in euthyroid subjects, but not in SHypo subjects, which might be resulted by the nearly full load of DIO2 in SHypo subjects. The thyroid-mediated TSH-triiodothyronine shunt may also increase in SHypo subjects.31 These mechanisms work together to maintain FT3 stability,28,32 which may leave little room for additional variation of FT3. The secretion of TSH is mainly regulated by the negative feedback of FT4. In our study, we found that FT4 was decreased while TSH was increased in SHypo subjects. However, the central thyroid hormone resistance indexes, TSHI and TT4RI, were also significantly increased in SHypo subjects, suggesting that the increase of TSH was insufficient to cope with the decrease of FT4 in SHypo subjects. FT4 rather than TSH directly reflects the deficiency of thyroid hormones in peripheral tissues. This may partly explain our findings that FT4 was negatively related to GA and GA/HbA1c within the subclinical hypothyroid range, while FT3 and TSH were not.
Due to a broad role in promoting metabolism, thyroid hormones may affect the level of GA by influencing the turnover rate of ALB. Nevertheless, few studies have explored the potential mechanism of thyroid dysfunction related to GA. Parving et al found that both the anabolic and catabolic rates of ALB were decreased in individuals with hypothyroidism. Moreover, the transcapillary escape rate and the extravascular mass of ALB were increased in individuals with hypothyroidism. All the variables returned to normal after thyroid hormone replacement.8 Further study is needed to clarify the potential mechanisms of thyroid hormones in relation to GA, GA/HbA1c.
To our knowledge, this is the first study to explore the relationships of thyroid hormones with GA and GA/HbA1c in euthyroid and SHypo subjects. Our study also has several limitations. Firstly, the study subjects were recruited from communities in Shanghai. Thus, to some extent, the results may be influenced by regional differences and population selection. Secondly, due to the nature of cross-sectional studies, we could not determine a causal relationship between thyroid hormones and GA and GA/HbA1c.
Conclusions
The present study found that FT3 was inversely related to GA in euthyroid individuals, while FT4 was inversely related to GA in SHypo individuals. In euthyroid and SHypo individuals, more attention should be paid to the potential effects of individual differences in thyroid hormones on GA.
Acknowledgments
This work was funded by the National Key R&D Program of China (2016YFA0502003).
Disclosure
The authors report no conflicts of interest in this work.
References
1. Biondi B, Kahaly GJ, Robertson RP. Thyroid dysfunction and diabetes mellitus: two closely associated disorders. Endocr Rev. 2019;40(3):789–824. doi:10.1210/er.2018-00163
2. Jali MV, Kambar S, Jali SM, Pawar N, Nalawade P. Prevalence of thyroid dysfunction among type 2 diabetes mellitus patients. Diabetes Metab Syndr. 2017;11(Suppl 1):S105–s108. doi:10.1016/j.dsx.2016.12.017
3. Ozair M, Noor S, Raghav A, Siddiqi SS, Chugtai AM, Ahmad J. Prevalence of thyroid disorders in North Indian type 2 diabetic subjects: a cross sectional study. Diabetes Metab Syndr. 2018;12(3):301–304. doi:10.1016/j.dsx.2017.12.016
4. Perros P, McCrimmon RJ, Shaw G, Frier BM. Frequency of thyroid dysfunction in diabetic patients: value of annual screening. Diabet Med. 1995;12(7):622–627. doi:10.1111/j.1464-5491.1995.tb00553.x
5. Umpierrez GE, Latif KA, Murphy MB, et al. Thyroid dysfunction in patients with type 1 diabetes: a longitudinal study. Diabetes Care. 2003;26(4):1181–1185. doi:10.2337/diacare.26.4.1181
6. Chen RH, Chen HY, Man KM, et al. Thyroid diseases increased the risk of type 2 diabetes mellitus: a nation-wide cohort study. Medicine (Baltim.). 2019;98(20):e15631. doi:10.1097/md.0000000000015631
7. Gronich N, Deftereos SN, Lavi I, Persidis AS, Abernethy DR, Rennert G. Hypothyroidism is a risk factor for new-onset diabetes: a cohort study. Diabetes Care. 2015;38(9):1657–1664. doi:10.2337/dc14-2515
8. Parving HH, Hansen JM, Nielsen SL, Rossing N, Munck O, Lassen NA. Mechanisms of edema formation in myxedema–increased protein extravasation and relatively slow lymphatic drainage. N Engl J Med. 1979;301(9):460–465. doi:10.1056/nejm197908303010902
9. Koga M, Murai J, Saito H, Matsumoto S, Kasayama S. Effects of thyroid hormone on serum glycated albumin levels: study on non-diabetic subjects. Diabetes Res Clin Pract. 2009;84(2):163–167. doi:10.1016/j.diabres.2009.01.013
10. Kim MK, Kwon HS, Baek KH, et al. Effects of thyroid hormone on A1C and glycated albumin levels in nondiabetic subjects with overt hypothyroidism. Diabetes Care. 2010;33(12):2546–2548. doi:10.2337/dc10-0988
11. Miyamoto H, Tao X, Kohzuma T, Ohnishi A. Influences of anemia, kidney disease, thyroid dysfunction, and liver disease on the ratio of glycated albumin to hemoglobin A1c. J Diabetes Sci Technol. 2018;12(5):1082–1083. doi:10.1177/1932296818767452
12. Wirth CD, Blum MR, da Costa BR, et al. Subclinical thyroid dysfunction and the risk for fractures: a systematic review and meta-analysis. Ann Intern Med. 2014;161(3):189–199. doi:10.7326/m14-0125
13. Moon S, Kim MJ, Yu JM, Yoo HJ, Park YJ. Subclinical hypothyroidism and the risk of cardiovascular disease and all-cause mortality: a meta-analysis of prospective cohort studies. Thyroid. 2018;28(9):1101–1110. doi:10.1089/thy.2017.0414
14. Shan Z, Chen L, Lian X, et al. Iodine status and prevalence of thyroid disorders after introduction of mandatory universal salt iodization for 16 years in china: a cross-sectional study in 10 cities. Thyroid. 2016;26(8):1125–1130. doi:10.1089/thy.2015.0613
15. Reynolds AN, Duncan A, Kruimer D, Venn BJ. Glycated albumin is associated with body mass index in euglycemic adults but is not predictive of postprandial blood glucose response. J Clin Lab Anal. 2017;31(5):5. doi:10.1002/jcla.22085
16. He X, Mo Y, Ma X, et al. Associations of body mass index with glycated albumin and glycated albumin/glycated hemoglobin A1c ratio in Chinese diabetic and non-diabetic populations. Clin Chim Acta. 2018;484:117–121. doi:10.1016/j.cca.2018.05.044
17. Fontenelle LC, Feitosa MM, Severo JS, et al. Thyroid function in human obesity: underlying mechanisms. Horm Metab Res. 2016;48(12):787–794. doi:10.1055/s-0042-121421
18. Xu Y, Ma X, Shen Y, Wang Y, Zhou J, Bao Y. Increasing waist circumference is associated with decreased levels of glycated albumin. Clin Chim Acta. 2019;495:118–122. doi:10.1016/j.cca.2019.04.001
19. Matthews DR, Hosker JP, Rudenski AS, Naylor BA, Treacher DF, Turner RC. Homeostasis model assessment: insulin resistance and beta-cell function from fasting plasma glucose and insulin concentrations in man. Diabetologia. 1985;28(7):412–419. doi:10.1007/BF00280883
20. Jostel A, Ryder WD, Shalet SM. The use of thyroid function tests in the diagnosis of hypopituitarism: definition and evaluation of the TSH index. Clin Endocrinol. 2009;71(4):529–534. doi:10.1111/j.1365-2265.2009.03534.x
21. Yagi H, Pohlenz J, Hayashi Y, Sakurai A, Refetoff S. Resistance to thyroid hormone caused by two mutant thyroid hormone receptors beta, R243Q and R243W, with marked impairment of function that cannot be explained by altered in vitro 3,5,3ʹ-triiodothyroinine binding affinity. J Clin Endocrinol Metab. 1997;82(5):1608–1614. doi:10.1210/jcem.82.5.3945
22. Obesity: preventing and managing the global epidemic. Vol. 894. Report of a WHO consultation. World Health Organ. Tech. Rep. Ser. 2000:
23. Feller M, Snel M, Moutzouri E, et al. Association of thyroid hormone therapy with quality of life and thyroid-related symptoms in patients with subclinical hypothyroidism: a systematic review and meta-analysis. JAMA. 2018;320(13):1349–1359. doi:10.1001/jama.2018.13770
24. Dozio E, Di Gaetano N, Findeisen P, Corsi Romanelli MM. Glycated albumin: from biochemistry and laboratory medicine to clinical practice. Endocrine. 2017;55(3):682–690. doi:10.1007/s12020-016-1091-6
25. Yazdanpanah S, Rabiee M, Tahriri M, et al. Evaluation of glycated albumin (GA) and GA/HbA1c ratio for diagnosis of diabetes and glycemic control: a comprehensive review. Crit Rev Clin Lab Sci. 2017;54(4):219–232. doi:10.1080/10408363.2017.1299684
26. Moriyama K, Kanamoto N, Hataya Y, et al. A case of type 2 diabetes mellitus developing hypothyroidism discovered as a result of a discrepancy between glycated hemoglobin and glycated albumin values. Diabetes Res Clin Pract. 2006;71(3):227–232. doi:10.1016/j.diabres.2005.06.013
27. Hoermann R, Midgley JEM, Larisch R, Dietrich JW. Recent advances in thyroid hormone regulation: toward a new paradigm for optimal diagnosis and treatment. Front Endocrinol. 2017;8:364. doi:10.3389/fendo.2017.00364
28. Gereben B, McAninch EA, Ribeiro MO, Bianco AC. Scope and limitations of iodothyronine deiodinases in hypothyroidism. Nat Rev Endocrinol. 2015;11(11):642–652. doi:10.1038/nrendo.2015.155
29. Morte B, Bernal J. Thyroid hormone action: astrocyte-neuron communication. Front Endocrinol. 2014;5:82. doi:10.3389/fendo.2014.00082
30. Werneck de Castro JP, Fonseca TL, Ueta CB, et al. Differences in hypothalamic type 2 deiodinase ubiquitination explain localized sensitivity to thyroxine. J Clin Invest. 2015;125(2):769–781. doi:10.1172/jci77588
31. Hoermann R, Midgley JE, Larisch R, Dietrich JW. Integration of peripheral and glandular regulation of triiodothyronine production by thyrotropin in untreated and thyroxine-treated subjects. Horm Metab Res. 2015;47(9):674–680. doi:10.1055/s-0034-1398616
32. Hoermann R, Midgley JE, Larisch R, Dietrich JW. Relational stability of thyroid hormones in euthyroid subjects and patients with autoimmune thyroid disease. Eur Thyroid J. 2016;5(3):171–179. doi:10.1159/000447967
 © 2020 The Author(s). This work is published and licensed by Dove Medical Press Limited. The full terms of this license are available at https://www.dovepress.com/terms.php and incorporate the Creative Commons Attribution - Non Commercial (unported, v3.0) License.
By accessing the work you hereby accept the Terms. Non-commercial uses of the work are permitted without any further permission from Dove Medical Press Limited, provided the work is properly attributed. For permission for commercial use of this work, please see paragraphs 4.2 and 5 of our Terms.
© 2020 The Author(s). This work is published and licensed by Dove Medical Press Limited. The full terms of this license are available at https://www.dovepress.com/terms.php and incorporate the Creative Commons Attribution - Non Commercial (unported, v3.0) License.
By accessing the work you hereby accept the Terms. Non-commercial uses of the work are permitted without any further permission from Dove Medical Press Limited, provided the work is properly attributed. For permission for commercial use of this work, please see paragraphs 4.2 and 5 of our Terms.