")
Back to Journals » Therapeutics and Clinical Risk Management » Volume 13
Association of uremic pruritus in hemodialysis patients with the number of days of high mean 24-hour particulate matter with a diameter of <2.5 μm
Authors Liu MH , Chan MJ , Hsu CW, Weng CH , Yen TH , Huang WH
Received 1 December 2016
Accepted for publication 19 January 2017
Published 23 February 2017 Volume 2017:13 Pages 255—262
DOI https://doi.org/10.2147/TCRM.S129133
Checked for plagiarism Yes
Review by Single anonymous peer review
Peer reviewer comments 4
Editor who approved publication: Dr Deyun Wang
Ming-Hui Liu,1,* Ming-Jen Chan,2,* Ching-Wei Hsu,2,3 Cheng-Hao Weng,2,3 Tzung-Hai Yen,2,3 Wen-Hung Huang2,3
1Department of Pediatric Dentistry, 2Department of Nephrology and Division of Clinical Toxicology and Toxicology Laboratory, Chang Gung Memorial Hospital, Linkou Medical Center, 3Chang Gung University College of Medicine, Taoyuan, Taiwan, Republic of China
*These authors contributed equally to this work
Abstract: Uremic pruritus (UP) is a common and incapacitating symptom in patients undergoing hemodialysis (HD). The pathogenesis of UP is multifactorial and complex. Particulate matter (PM), a major air pollutant, is a mixture of particles with various chemical compositions. PM is associated with several allergic diseases, including dermatitis. To assess the role of PM (PM with a diameter of <10 µm [PM10] and PM with a diameter of <2.5 µm [PM2.5]) and other clinical variables in UP in patients on HD, we recruited 866 patients on maintenance HD (MHD). We analyzed the number of days of mean 24-hour PM10 ≥125 µg/m3/12 months (NDPM10) or the number of days of mean 24-hour PM2.5 ≥35 µg/m3/12 months (NDPM2.5) exceeding the standard level in the past 12 months respectively to determine the association with UP. In a multivariate logistic regression, HD duration, serum ferritin levels, low-density lipoprotein (LDL) levels, and NDPM2.5 ≥116 days/12 months were positively associated with UP. This cross-sectional study showed that the number of days on which the environmental PM2.5 exceeds the standard level might be associated with UP in patients on MHD.
Keywords: air pollution, uremic pruritus, environmental particulate matter, PM2.5
Introduction
Uremic pruritus (UP) is a common and disabling symptom in hemodialysis (HD) patients. The prevalence of UP varies from 22% to 90%.1–3 To date, the pathogenesis of UP is considered multifactorial and remains poorly understood.4–7 Dermatological abnormalities, systemic inflammation, an imbalance of the endogenous opioidergic system, and a neuropathic mechanism are considered the main hypotheses.8
Particulate matter (PM), a major air pollutant, is a mixture of particles with various chemical compositions. PM is classified according to its size as follows: PM with a diameter of <10 μm (PM10), PM with a diameter of <2.5 μm (PM2.5), and PM with a diameter of <0.1 μm (ultrafine particles [UFPs]). Previous studies have reported that PM is associated with allergic diseases such as asthma,9–11 allergic rhinitis,12 and dermatitis.13,14 However, to our knowledge, a detailed study on the correlation between PM and UP in patients on maintenance HD (MHD) has not been reported. Therefore, the present cross-sectional study was conducted to assess the association between environmental PM (PM2.5 and PM10) and UP in patients on MHD.
Patients and methods
Methods
This cross-sectional study was approved by the medical ethics committee of Chang Gung Memorial Hospital. Written informed consent was obtained from all patients for this study. All patient information was kept confidential and made available only to the investigators. All medical records during the study period, including medical history, laboratory data, and inclusion and exclusion factors, were reviewed by senior nephrologists who have the experiences in experimental protocal. Furthermore, all experimental protocols were conducted in accordance with the guidelines of Strengthening the Reporting of Observational Studies in Epidemiology.
Study population
Patients were recruited from the three HD centers of the Chang Gung Memorial Hospital and the Taipei and Taoyuan branches of the Linkou Medical Center. Only patients on MHD who were aged ≥18 years and had undergone HD for at least 6 months were enrolled in this study. Patients with malignancies or obvious infectious diseases and patients who had been hospitalized or had undergone surgery within 3 months prior to the investigation were excluded. Diabetes mellitus (DM) was defined by either a physician’s diagnosis and antidiabetic drug treatment or two subsequent analyses demonstrating fasting blood glucose levels of >126 mg/dL. HD was performed using single-use hollow-fiber dialyzers equipped with modified cellulose, polyamide, or polysulfone membranes. The dialysate used in all cases had a standard ionic composition with a bicarbonate-based buffer. Patients undergoing hemodiafiltration (HDF) thrice weekly for ≥3 months were also included. We noted the incidence of cardiovascular disease (CVD), including cerebrovascular disease, coronary artery disease, congestive heart failure, and peripheral vascular disease, in these patients. Hypertension was defined by the regular use of antihypertensive drugs to control blood pressure or at least two blood pressure measurements >140/90 mmHg. Smoking behavior was also noted. Pruritus was screened from our HD centers. The diagnosis of pruritus was as follows: pruritus appearing after HD with or without antipruritics as observed by trained dermatologists or nephrologists. (The pruritus may be constant or intermittent and commonly associated with xerosis. There is a scratch with no primary lesions, and the back is the most commonly affected area. However, arms, head, and abdomen are also commonly affected.) The intensity of pruritus was measured by a visual analog scale (VAS), which consisted of a 10-cm horizontal line with 0 points (no pruritus) to 10 points (maximum intensity of pruritus).
Individual exposure to PM2.5 or PM10 was estimated using a geographic information system of the Taiwan Air Quality Monitoring Network, which is operated by the Environmental Protection Administration15 to determine the mean previous 12-month concentrations of PM2.5 and PM10 in patients’ living areas. The number of days on which the concentrations of PM2.5 or PM10 exceeded the standard mean 24-hour concentrations during the previous 12 months was calculated, with standard levels defined as <35 and <125 μg/m3, respectively.15
Laboratory, nutritional, and inflammatory parameters
All blood samples were drawn from the arterial end of the vascular access immediately after the initial 2-day interval before HD; the samples were then centrifuged and stored at −80°C until use. Nutritional markers such as serum creatinine levels, normalized protein catabolic rate (nPCR), and serum albumin levels were assayed and recorded. The nPCRs of the studied patients were calculated using validated equations and were normalized to their respective body weights.16 High-sensitivity C-reactive protein (hsCRP) levels were measured as indices of inflammation. A standard laboratory approach with an automatic analyzer was used for all other biochemical tests. Dialyzer clearance of urea (Kt/Vurea) was measured using a method described by Daugirdas.17 The serum calcium level was corrected with the serum albumin level. Anuria was defined as a daily urine amount of <100 mL.
Statistical analysis
Continuous variables (normal and nonnormal distributions) were expressed as mean ± standard deviation or median (interquartile range). Categorical variables were expressed as frequency or percentage. A χ2 test or Fisher’s exact test was used to analyze the correlation between categorical variables. Comparisons between two groups were performed using the Mann–Whitney U test or Student’s t-test. The Kolmogorov–Smirnov test was used to test whether the variables were normally distributed. To assume a normal distribution, P>0.05 was required. According to nonnormal distribution data, hsCRP, intact parathyroid hormone (iPTH), and ferritin levels were log transformed for analysis. Discrimination was assessed through an area under the receiver operating characteristic (AUROC) analysis, which was also used to calculate the cutoff values, sensitivity, specificity, and overall correctness. Finally, the optimal cutoff points were calculated by acquiring the maximum value of the Youden index (sensitivity + specificity - 1). To evaluate the relationship with UP, univariate and multivariate (forward method) logistic regression analyses were performed to assess the odds ratios (ORs) and 95% confidence intervals (CIs) for the baseline variables, including age, male sex, body mass index (BMI), smoking status, DM, hypertension, previous CVD, hepatitis B virus (HBV) infection, hepatitis C virus (HCV) infection, HD duration, blood access fistula, HDF, Kt/Vurea, nPCR, nonanuria status, hemoglobin level, serum albumin level, serum creatinine level, corrected calcium level, inorganic phosphate level, log ferritin level, log iPTH level, log hsCRP level, low-density lipoprotein (LDL) level, triglyceride level, the number of days of mean 24-hour PM2.5 ≥35 μg/m3/12 months (NDPM2.5), and the number of days of mean 24-hour PM10 ≥125 μg/m3/12 months (NDPM10). According to the low collinearity (variance inflation factor; NDPM2.5 ≥116 days/12 months, 1.75; NDPM10 ≥4.5 days/12 months, 1.74), in Analysis C, we included the two aforementioned items together for a multivariate logistic regression analysis. All nominal variables in the logistic regression were transformed into dummy variables. Missing data were approached using list-wise deletion. Data were analyzed using SPSS version 12.0 for Windows (IBM Corp., Armonk, NY, USA). The level of significance was set at P<0.05.
Results
In total, 866 patients on MHD were included in the study. Table 1 lists the patient characteristics, including comorbidities; dialysis-related data along with related biological and hematological information; and information regarding PM exposure for all patients with or without UP. There were 189 patients with UP. The median of VAS was 6. The correlation between NDPM2.5 ≥116 days/12 months (r=0.06, P=0.37), NDPM10 ≥4.5 days/12 months (r=0.08, P=0.27), and VAS was not significant.
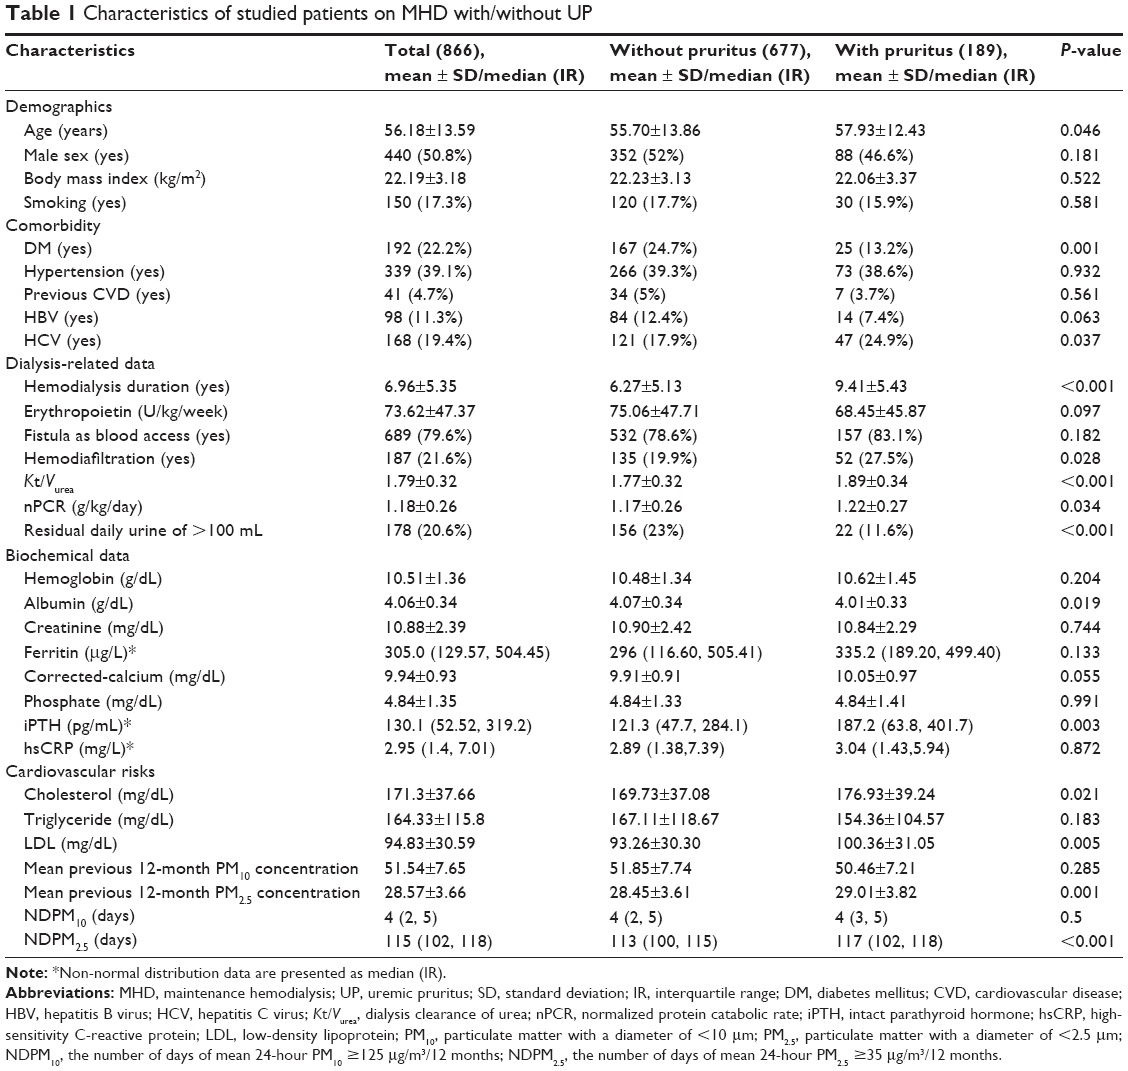 | Table 1 Characteristics of studied patients on MHD with/without UP |
Comparison of clinical variables between patients with and without UP
A comparison of the patients with and without UP revealed that a higher proportion of those with UP had HCV infection and had undergone HDF, whereas a lower proportion of them had DM and a nonanuria condition. Moreover, patients with UP were older than those without UP. Furthermore, patients with UP had longer HD durations; had higher Kt/Vurea, nPCR, iPTH, cholesterol, and LDL levels; and had lower serum albumin levels than those without UP (Table 1).
AUROC for NDPM2.5 and NDPM10
A higher NDPM2.5 was associated with UP. Computation of the AUROC confirmed that NDPM2.5 had favorable discriminatory power (AUROC =0.591±0.025; 95% CI, 0.54–0.64; P<0.001; Figure 1). The optimal cutoff point for NDPM2.5 was 116 days/12 months (sensitivity, 51%; specificity, 78%; overall correctness, 72.4%; Table 2). Similarly, the AUROC confirmed that NDPM10 had favorable discriminatory power (AUROC =0.564±0.024; 95% CI, 0.51–0.61; P=0.007; Figure 2). The optimal cutoff point for NDPM10 was 4.5 days/12 months (sensitivity, 48%; specificity, 74%; overall correctness, 68.6%; Table 2). These optimal cutoff points were used in the univariate and multivariate binary logistic regression analyses to evaluate their association with UP.
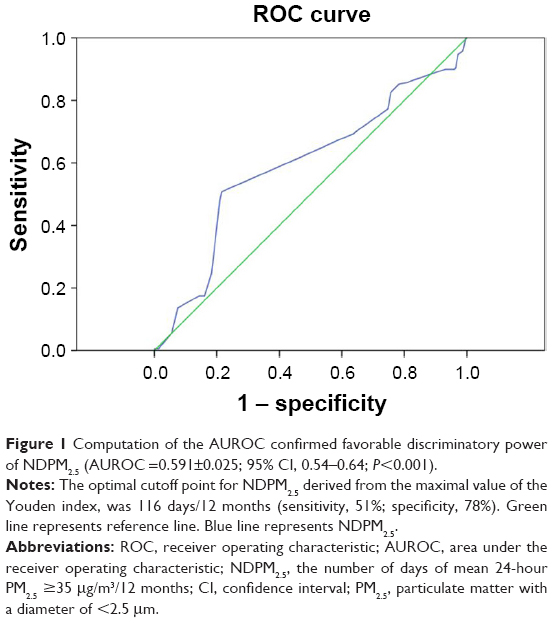 | Figure 1 Computation of the AUROC confirmed favorable discriminatory power of NDPM2.5 (AUROC =0.591±0.025; 95% CI, 0.54–0.64; P<0.001). |
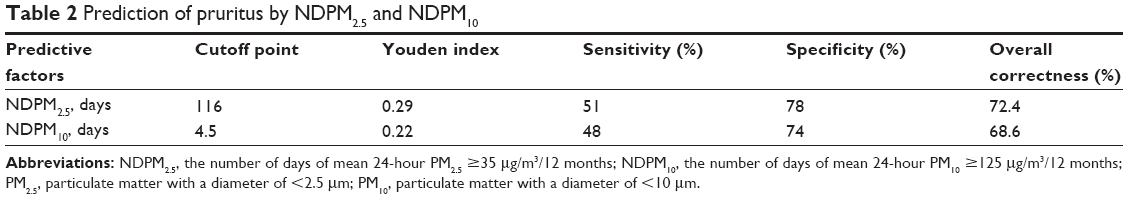 | Table 2 Prediction of pruritus by NDPM2.5 and NDPM10 |
 | Figure 2 Computation of the AUROC confirmed favorable discriminatory power of NDPM10 (AUROC =0.564±0.024; 95% CI, 0.51–0.61; P=0.007). |
Associations between UP and clinical variables
Univariate logistic regression identified several clinical variables that were significantly associated with UP (Table 3), such as BMI, DM, HCV infection, HD duration, HDF, Kt/Vurea, nPCR, nonanuria status, serum albumin level, log iPTH level, LDL level, and the optimal cutoff points for NDPM2.5 and NDPM10. To determine the association between UP and the number of days on which the mean 24-hour PM levels were greater than the standard values (NDPM2.5 ≥116 days/12 months and NDPM10 ≥4.5 days/12 months), multivariate forward logistic regression analysis of variables with P<0.1 in the univariate logistic regression was performed in three models (Analysis A: including the optimal cutoff point for NDPM2.5, Analysis B: including the optimal cutoff point for NDPM10, and Analysis C: including the optimal cutoff points for NDPM2.5 and NDPM10). The results of Analysis A indicated that HD duration (OR, 1.11; 95% CI, 1.08–1.15; P<0.001), log ferritin level (OR, 1.72; 95% CI, 1.16–2.55; P=0.007), LDL level (OR, 1.01; 95% CI, 1.00–1.01; P=0.006), and the optimal cutoff point for NDPM2.5 (OR, 3.57; 95% CI, 2.50–5.10; P<0.001) were associated with UP (Table 4). The results of analysis B indicated that HD duration (OR, 1.12; 95% CI, 1.08–1.15; P<0.001), serum albumin level (OR, 0.57; 95% CI, 0.34–0.95; P=0.032), log ferritin level (OR, 1.66; 95% CI, 1.13–2.45; P=0.01), LDL level (OR, 1.01; 95% CI, 1.00–1.01; P=0.006), and the optimal cutoff point for NDPM10 (OR, 2.54; 95% CI, 1.78–3.62; P<0.001) were associated with UP (Table 4). The results of analysis C indicated that HD duration (OR, 1.11; 95% CI, 1.08–1.15; P<0.001), log ferritin level (OR, 1.72; 95% CI, 1.16–2.55; P=0.007), LDL level (OR, 1.01; 95% CI, 1.00–1.01; P=0.006), and the optimal cutoff point for NDPM2.5 (OR, 3.57; 95% CI, 2.50–5.10; P<0.001) were associated with UP (Table 5).
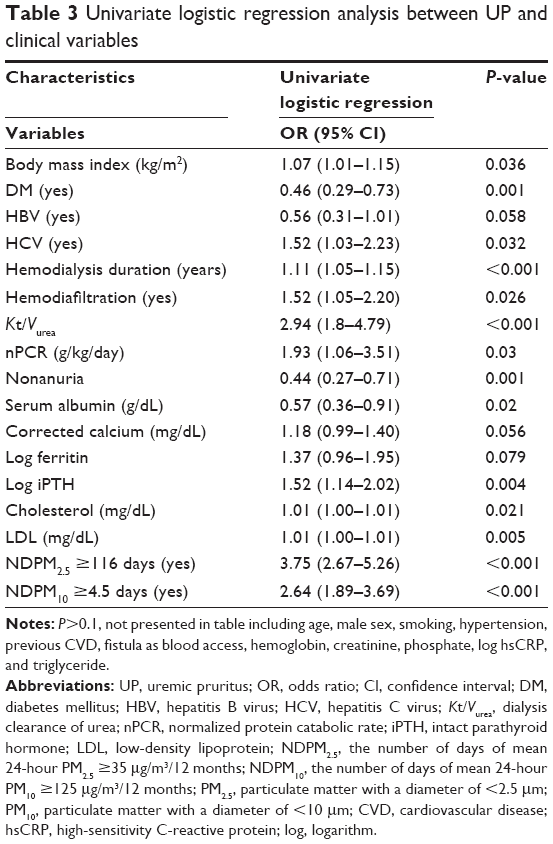 | Table 3 Univariate logistic regression analysis between UP and clinical variables |
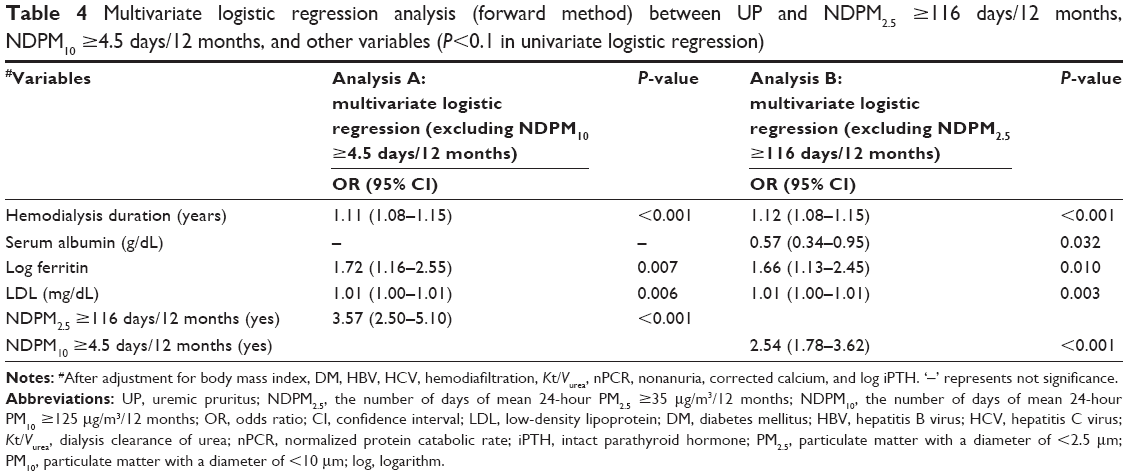 | Table 4 Multivariate logistic regression analysis (forward method) between UP and NDPM2.5 ≥116 days/12 months, NDPM10 ≥4.5 days/12 months, and other variables (P<0.1 in univariate logistic regression) |
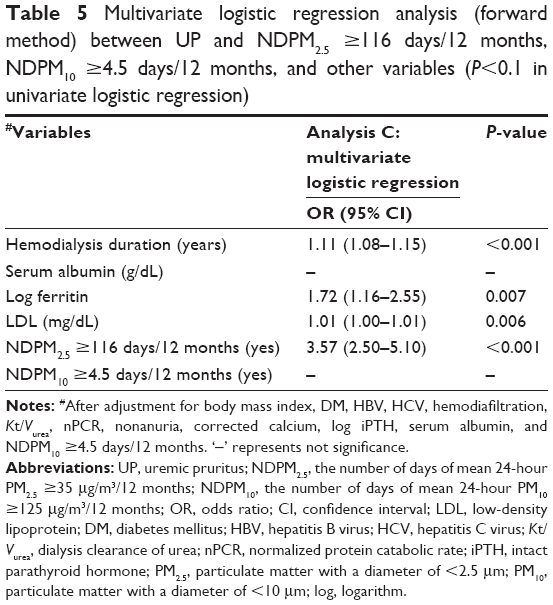 | Table 5 Multivariate logistic regression analysis (forward method) between UP and NDPM2.5 ≥116 days/12 months, NDPM10 ≥4.5 days/12 months, and other variables (P<0.1 in univariate logistic regression) |
Discussion
The results of the present cross-sectional study indicate that, after adjustment for related factors, the NDPM2.5 is a significant factor for UP in patients undergoing HD.
The mechanism of UP is complex and not yet fully understood. A study on the cause–effect relationship between PM and skin lesions is difficult because of the method of data collection and analysis of PM. The mechanisms of UP are included under abnormalities of opioid receptors, proinflammatory states with a high level of particular cytokines, malnutrition, interface of the distal ends of unmyelinated C fibers with dermal mast cells,18–20 and skin barrier destruction inducing an increase in neuron-specific enolase-immunoreactive nerve fibers in the epidermis.21 Outdoor air pollution has been reported to affect the health of patients with allergic diseases, such as asthma, atopic dermatitis (AD), and conjunctivitis.22–25
To our knowledge, this study is the first to demonstrate that the NDPM2.5 ≥116 days is associated with UP in patients on MHD. PM is a mixture of solid and liquid particles of different origins. It includes metals, volatile organic compounds, bacteria, virus, airborne allergens, suspended atmospheric dust, soil, and smoke. PM is classified on the basis of size; for instance, PMs with diameters <10 μm, <2.5 μm, and ≤0.1 μm are called PM10, PM2.5, and UFPs, respectively. Patients may be exposed to PM mainly through inhalation, ingestion, and skin contact. In research on Asian dust and dermatitis, dermatitis was significantly associated with PM levels during an Asian dust event,26 and dust particle-bound metals (particularly nickel) were considered the cause of dermatitis.27 The use of a mobile detector, the Pre-toddler Inhalable Particulate Environmental Robot, to investigate the association between PM exposure and eczema among preschoolers showed an association between PM concentrations and eczema (OR, 2.85).28
In a 3-year observational study on PM10 and skin lesions in 9–11-year-old school children,13 the lifetime prevalence of AD (eczema) in 4,907 children was significantly associated with the 3-year mean concentrations of PM10 (OR, 1.13). However, in a worldwide study on the prevalence of ambient PM on allergic diseases including eczema, Anderson et al29 observed no significant association between PM10 and the prevalence of eczema in children.
In a birth cohort study,30 infants with high prenatal exposure to PM2.5 in combination with postnatal exposure to environmental tobacco smoke were potentially at a higher risk of eczema in infancy (OR, 2.39). Kathuria and Silverberg31 also reported an association between PM2.5 and eczema. In a prospective study of symptoms of AD,14 outdoor PM2.5 and PM10 concentrations were higher on days when the patients had symptoms of AD. However, few studies have investigated the association between UFPs and skin lesions. In a study of 41 school children,32 pruritus scores were significantly associated with UFP concentrations.
Because air quality constantly changes, the study of air pollutants on skin lesions is difficult. It is difficult to accurately estimate the concentration of an air pollutant during the exposure period. In studies on the association between PMs and skin lesion, the mean concentrations of PMs over hours,27,30,32–34 days,28,35,36 and years31 have been used for analysis. In several studies on the association between air pollution and allergic disease,22–25 the duration of observation is 12 months. Therefore, to calculate the concentration of PMs objectively, we used the daily mean PM concentrations of the previous 12 months for our analysis. In Analyses A and B (Table 4), the optimal cutoff points for NDPM2.5 (OR =3.57) and NDPM10 (OR =2.54) separately exhibited strong positive correlations with UP. However, in Analysis C, taken together in the analysis, the optimal cutoff point for NDPM2.5 correlated positively with UP with a high OR (3.57), whereas that for NDPM10 did not. This is the first study to suggest that daily mean PM exceeding the standard value is associated with UP. From relevant literature29–32 and the results of our study, the particle size of PM and the number of days of exposure to high concentrations of PMs appear to be risk factors for UP in patients on MHD.
The role of PM in UP is unclear. As previously mentioned, inhalation and skin contact may be routes for UP in our patients on HD (this uncertainty is because of the lack of literature discussing PMs in drinking water or the surface of foods). Moreover, air pollutants are likely to aggravate symptoms, such as pruritus, possibly by inducing oxidative stress in the skin, which leads to skin barrier dysfunction, an increase in the number of neuronal fibers in the epidermis, immune dysregulation, or neurogenic inflammation.32,34,37–40 By demonstrating increased gene expression and transcription of the cytokines interleukin (IL)-6, IL-8, and granulocyte-macrophage colony-stimulating factor (GM-CSF), Choi et al41 showed that the inflammatory or proinflammatory reactions induced in response to Asian dust induced dermatitis; they also reported the effects of Asian dust on keratinocyte differentiation.
Conclusion
The results of the present cross-sectional study reveal that NDPM2.5 might be associated with UP in patients on MHD and that NDPM2.5 ≥116 days/12 months might be associated with the maximum probability of UP in this population. Furthermore, the prevalence of UP may differ by location. Further research is required in order to clarify the role of other air pollutants or environmental factors on UP in patients undergoing MHD.
Limitations
This study has some limitations. First, we did not include other factors such as humidity, seasons, temperature, diets, and mites or contact irritants. Therefore, we may have underestimated or overestimated the correlation between environmental PMs and UP. Second, this was a cross-sectional study. We observed only the correlation between environmental PM2.5 and UP and not the cause–effect relationship between them. The third limitation of this study is the assessment of how much and how often exposure occurs for a particular substance, which is difficult. Because of the difficulty on the activity of study population, objectively, we used the previous 12-month PM message around living areas for analysis.
Acknowledgments
We thank the members of the Statistic Center and Hemodialysis Center at Chang Gung Memorial Hospital for their invaluable and dedicated assistance including analysis of data.
Author contributions
All authors contributed toward data analysis, drafting and critically revising the paper and agree to be accountable for all aspects of the work.
Disclosure
W-HH and T-HY received funding through research grants from Chang Gung Memorial Hospital, Linkou (CMRPG3D0322 and G3D0012, respectively), and C-HW received funding through a research grant from Chang Gung Memorial Hospital, Linkou (CMRPG5D0081). The other authors report no conflicts of interest in this work.
References
Pauli-Magnus C, Mikus G, Alscher DM, et al. Naltrexone does not relieve uremic pruritus: results of a randomized, double-blind, placebo-controlled crossover study. J Am Soc Nephrol. 2000;11:514–519. | ||
Kimata N, Fuller DS, Saito A, et al. Pruritus in hemodialysis patients: results from the Japanese Dialysis Outcomes and Practice Patterns Study (JDOPPS). Hemodial Int. 2014;18(3):657–667. | ||
Pisoni RL, Wikstrom B, Elder SJ, et al. Pruritus in haemodialysis patients: international results from the Dialysis Outcomes and Practice Patterns Study (DOPPS). Nephrol Dial Transplant. 2006;21(12):3495–3505. | ||
Marquez D, Ramonda C, Lauxmann JE, et al. Uremic pruritus in hemodialysis patients: treatment with desloratadine versus gabapentin. J Bras Nefrol. 2012;34(2):148–152. | ||
Murphy M, Reaich D, Pai P, Finn P, Carmichael AJ. A randomized, placebo-controlled, double-blind trial of ondansetron in renal itch. Br J Dermatol. 2003;148(2):314–317. | ||
Silva SR, Viana PC, Lugon NV, Hoette M, Ruzany F, Lugon JR. Thalidomide for the treatment of uremic pruritus: a crossover randomized double-blind trial. Nephron. 1994;67(3):270–273. | ||
Chiu YL, Chen HY, Chuang YF, et al. Association of uraemic pruritus with inflammation and hepatitis infection in haemodialysis patients. Nephrol Dial Transplant. 2008;23(11):3685–3689. | ||
Aucella F, Gesuete A. Uremic pruritus: an unresolved challenge. G Ital Nefrol. 2009;26(5):585–599. | ||
Penttinen P, Vallius M, Tiittanen P, Ruuskanen J, Pekkanen J. Source-specific fine particles in urban air and respiratory function among adult asthmatics. Inhal Toxicol. 2006;18(3):191–198. | ||
Shima M, Nitta Y, Ando M, Adachi M. Effects of air pollution on the prevalence and incidence of asthma in children. Arch Environ Health. 2002;57(6):529–535. | ||
Kunzli N, Bridevaux PO, Liu LJ, et al; Swiss Cohort Study on Air Pollution and Lung Diseases in Adults. Traffic-related air pollution correlates with adult-onset asthma among never-smokers. Thorax. 2009;64(8):664–670. | ||
Hashizume M, Ueda K, Nishiwaki Y, Michikawa T, Onozuka D. Health effects of Asian dust events: a review of the literature. Nihon Eiseigaku Zasshi. 2010;65(3):413–421. | ||
Penard-Morand C, Raherison C, Charpin D, et al. Long-term exposure to close-proximity air pollution and asthma and allergies in urban children. Eur Respir J. 2010;36(1):33–40. | ||
Kim J, Kim EH, Oh I, et al. Symptoms of atopic dermatitis are influenced by outdoor air pollution. J Allergy Clin Immunol. 2013;132:495–498.e1. | ||
TAQMN [webpage on the Internet]. Taiwan Air Quality Monitoring Network (TAQMN) operated by the Environmental Protection Administration (EPA 2016). Available from: http://taqm.epa.gov.tw/taqm/zh-tw/default.aspx. Accessed September 6, 2016. | ||
Sargent JA. Control of dialysis by a single-pool urea model: the National Cooperative Dialysis Study. Kidney Int Suppl. 1983;23(13):S19–S25. | ||
Daugirdas JT. The post: pre-dialysis plasma urea nitrogen ratio to estimate K.t/V and NPCR: mathematical modeling. Int J Artif Organs. 1989;12(7):411–419. | ||
Nordal EJ, Os I. Uremic pruritus – pathogenesis and treatment. Tidsskr Nor Laegeforen. 2007;127:1201–1203. | ||
Mettang M, Weisshaar E. Pruritus: control of itch in patients undergoing dialysis. Skin Therapy Lett. 2010;15(2):1–5. | ||
Lugon JR. Uremic pruritus: a review. Hemodial Int. 2005;9:180–188. | ||
Johansson O, Hilliges M, Stahle-Backdahl M. Intraepidermal neuron-specific enolase (NSE)-immunoreactive nerve fibres: evidence for sprouting in uremic patients on maintenance hemodialysis. Neurosci Lett. 1989;99(3):281–286. | ||
Dunlop J, Matsui E, Sharma HP. Allergic rhinitis: environmental determinants. Immunol Allergy Clin North Am. 2016;36(2):367–377. | ||
Kim HH, Lee CS, Yu SD, et al. Near-road exposure and impact of air pollution on allergic diseases in elementary school children: a cross-sectional study. Yonsei Med J. 2016;57(3):698–713. | ||
Kim J, Han Y, Seo SC, et al. Association of carbon monoxide levels with allergic diseases in children. Allergy Asthma Proc. 2016;37(1):1–7. | ||
Lindgren A, Stroh E, Nihlen U, Montnemery P, Axmon A, Jakobsson K. Traffic exposure associated with allergic asthma and allergic rhinitis in adults. A cross-sectional study in southern Sweden. Int J Health Geogr. 2009;8:25. | ||
Onishi K, Otani S, Yoshida A, Mu H, Kurozawa Y. Adverse health effects of Asian dust particles and heavy metals in Japan. Asia Pac J Public Health. 2015;27:N1719–N1726. | ||
Otani S, Onishi K, Mu H, et al. The relationship between skin symptoms and allergic reactions to Asian dust. Int J Environ Res Public Health. 2012;9:4606–4614. | ||
Shah L, Mainelis G, Ramagopal M, Black K, Shalat SL. Use of a robotic sampler (PIPER) for evaluation of particulate matter exposure and eczema in preschoolers. Int J Environ Res Public Health. 2016;13(2):242. | ||
Anderson HR, Ruggles R, Pandey KD, et al; ISAAC Phase One Study Group. Ambient particulate pollution and the world-wide prevalence of asthma, rhinoconjunctivitis and eczema in children: phase one of the International Study of Asthma and Allergies in Childhood (ISAAC). Occup Environ Med. 2010;67(5):293–300. | ||
Jedrychowski W, Perera F, Maugeri U, et al. Effects of prenatal and perinatal exposure to fine air pollutants and maternal fish consumption on the occurrence of infantile eczema. Pediatr Allergy Immunol. 2011;155(3):275–281. | ||
Kathuria P, Silverberg JI. Association of pollution and climate with atopic eczema in US children. Pediatr Allergy Immunol. 2016;27(5):478–485. | ||
Song S, Lee K, Lee YM, et al. Acute health effects of urban fine and ultrafine particles on children with atopic dermatitis. Environ Res. 2011;111(3):394–399. | ||
Lee JH, Lee HS, Park MR, et al. Relationship between indoor air pollutant levels and residential environment in children with atopic dermatitis. Allergy Asthma Immunol Res. 2014;6(6):517–524. | ||
Song S, Paek D, Park C, Lee C, Lee JH, Yu SD. Exposure to ambient ultrafine particles and urinary 8-hydroxyl-2-deoxyguanosine in children with and without eczema. Sci Total Environ. 2013;458–460:408–413. | ||
Annesi-Maesano I, Moreau D, Caillaud D, et al. Residential proximity fine particles related to allergic sensitisation and asthma in primary school children. Respir Med. 2007;101(8):1721–1729. | ||
Jedrychowski W, Spengler JD, Maugeri U, et al. Effect of prenatal exposure to fine particulate matter and intake of paracetamol (acetaminophen) in pregnancy on eczema occurrence in early childhood. Sci Total Environ. 2011;409(24):5205–5209. | ||
Eberlein-Konig B, Przybilla B, Kuhnl P, et al. Influence of airborne nitrogen dioxide or formaldehyde on parameters of skin function and cellular activation in patients with atopic eczema and control subjects. J Allergy Clin Immunol. 1998;101:141–143. | ||
Huss-Marp J, Eberlein-Konig B, Breuer K, et al. Influence of short-term exposure to airborne Der p 1 and volatile organic compounds on skin barrier function and dermal blood flow in patients with atopic eczema and healthy individuals. Clin Exp Allergy. 2006;36(3):338–345. | ||
Ahn K. The role of air pollutants in atopic dermatitis. J Allergy Clin Immunol. 2014;134(5):993–999. [discussion 1000]. | ||
Meggs WJ. Neurogenic inflammation and sensitivity to environmental chemicals. Environ Health Perspect. 1993;101(3):234–238. | ||
Choi H, Shin DW, Kim W, Doh SJ, Lee SH, Noh M. Asian dust storm particles induce a broad toxicological transcriptional program in human epidermal keratinocytes. Toxicol Lett. 2011;200(1–2):92–99. |
 © 2017 The Author(s). This work is published and licensed by Dove Medical Press Limited. The full terms of this license are available at https://www.dovepress.com/terms.php and incorporate the Creative Commons Attribution - Non Commercial (unported, v3.0) License.
By accessing the work you hereby accept the Terms. Non-commercial uses of the work are permitted without any further permission from Dove Medical Press Limited, provided the work is properly attributed. For permission for commercial use of this work, please see paragraphs 4.2 and 5 of our Terms.
© 2017 The Author(s). This work is published and licensed by Dove Medical Press Limited. The full terms of this license are available at https://www.dovepress.com/terms.php and incorporate the Creative Commons Attribution - Non Commercial (unported, v3.0) License.
By accessing the work you hereby accept the Terms. Non-commercial uses of the work are permitted without any further permission from Dove Medical Press Limited, provided the work is properly attributed. For permission for commercial use of this work, please see paragraphs 4.2 and 5 of our Terms.