")
Back to Journals » Diabetes, Metabolic Syndrome and Obesity » Volume 13
Association of TNF-α Gene Expression and Release in Response to Anti-Diabetic Drugs from Human Adipocytes in vitro
Authors Saxena M, Ali D, Modi DR, Almarzoug MHA , Hussain SA, Manohrdas S
Received 30 May 2020
Accepted for publication 2 July 2020
Published 24 July 2020 Volume 2020:13 Pages 2633—2640
DOI https://doi.org/10.2147/DMSO.S265362
Checked for plagiarism Yes
Review by Single anonymous peer review
Peer reviewer comments 2
Editor who approved publication: Prof. Dr. Juei-Tang Cheng
Madhukar Saxena,1,* Daoud Ali,2,* Dinesh Raj Modi,1 Mohammed HA Almarzoug,2 SA Hussain,2 S Manohrdas2
1Department of Biotechnology, Babasaheb Bhimrao Ambedkar University, Lucknow, India; 2Department of Zoology, College of Science, King Saud University, Riyadh, Saudi Arabia
*These authors contributed equally to this work
Correspondence: Madhukar Saxena
Department of Biotechnology, Babasaheb Bhimrao Ambedkar University, Vidya Vihar, Rai Bareilly Road, Lucknow, India
Email [email protected]
Introduction: TNF-α, a proinflammatory cytokine secreted by activated immune cells, and overexpression of it in adipocytes, has an important role in insulin resistance progression and diabetes development.
Aim and Objective: Subcutaneous adipocytes derived from mesenchymal stem cells were used for in vitro analysis to find the role of antidiabetic drugs on TNF-α in high glucose-fed adipocytes.
Methods: In vitro adipocytes were used along with variable concentration of anti-diabetic drugs. The level of TNF-α was measured by ELISA and the mRNA level was quantified using SYBR-Green real-time PCR. All data were statistically analyzed.
Results: The level of TNF-α and the mRNA expression were observed and analyzed with normal adipocytes. TNF-α level and expression of it showed agonistic behavior, ie no change at low concentration while enhances with the increase of glucose. The level was decreased significantly when the adipocytes were treated with metformin (p=0.015) and pioglitazone (p=0.020). A combination of drugs showed that the expression of TNF-α was almost the same as for metformin alone. However, insulin increases the TNF-α expression as for pioglitazone.
Discussion: Such a report on adipocytes may be helpful for clinical benefits to understand the additional mechanism of adipocytes on the release and expression of TNF-α. However, anti-diabetic drugs including insulin up-regulate the TNF-α gene expression in mild or severe glucose load.
Keywords: adipocytes, TNF-α, anti-diabetic drugs, T2DM, gene expression
Introduction
Till the late 1980s, adipocytes were recognized as the energy storage cells with a main function to store fat as triacylglycerols (TAGs). Later on, it was found that it was also secreting some adipocyte specific protein named adipsin.1 Now, many stimulating proteins and a variety of protein products, including many endocrine hormones, have been secreted by adipocytes and involved in various metabolic processes.2,3 Of these secreted proteins, leptin, an adipocyte-derived hormone, plays a vital role in signaling cascade of fat mass and central brain centers to regulate the metabolism of the body. It is also involved to control the weight of the body including the regulation in metabolism of glucose because leptin is very sensitive toward insulin and immune functions.4–6 Insulin action on adipocytes stimulates the uptake of glucose and alters the metabolism of lipid by which triacylglycerol breakdown decreases and enhances their accumulation inside the adipocytes. Adipocytes are the largest storage room of cholesterol in the body and function as endocrine cells. Adipocytes secrete various signaling molecules which play an important function in obesity, type 2 diabetes mellitus (T2DM) as well as in other metabolic disorders.7 TNF-α inhibits the differentiation of fat cells and mediates insulin resistance in it. Previous reports reported that both TNF receptors are expressed in adipocytes, but their metabolic function is unclear. However, in in vitro analysis the effect of receptor-specific TNF muteins on adipocyte differentiation and insulin-stimulated glucose transport showed a marked decrease during differentiation apart from their increase in endogenous TNF mRNA expression.8 Endothelial cells and macrophages inside the adipocytes have been involved for the production of various cytokines. Enhanced pro-inflammatory cytokines like IL-6, IL-8 and TNF-α are well associated with obesity. TNF-α, a proinflammatory cytokine secreted by activated immune cells, plays an important role in responses of innate immunity. Overexpression of it in adipocytes and myocytes decreases the activity of tyrosine kinase, suggesting their important role in insulin resistance progression and T2DM development.9 Traditional anti-diabetic drugs, viz. metformin hydrochloride and pioglitazone, are widely used to regulate the load of blood glucose in T2DM treatment which leads to various associated complications and causes metabolic syndrome. Metformin is mechanistically involved to regulate and lower the blood glucose load in T2DM patients while pioglitazone hydrochloride works by making cells more sensitive toward insulin. In T2DM, inflamed metabolic syndrome, the level of cytokine is enhanced. To understand such an inflammation role we observed in in vitro adipocytes the effect of anti-diabetic drugs, viz. metformin, pioglitazone along with insulin, and their combinations on the expression of potent inflammation marker TNF-α. Treatments of T2DM, such as treating insulin deficiency, hepatic glucose load and the delay of glucose absorption, decreasing the level of plasma glucose have been widely used. But most of the treatment strategies have failed to restore metabolic homeostasis and to prevent the development of T2DM-related complications. Thus, there remains a need to restore insulin action for the management of T2DM by use of effective drugs. The proposed study will probably increase our insight into the impact of inflammation and its genetic effect on adipocytes in the development and/or progression of T2DM. The study will also conclude the genetic effect of anti-diabetic drugs on adipocytes. Such kind of studies will lead to alter the treatment strategies and save mankind from diabetic inflamed comorbidities.
Materials and Methods
Cell Culture
Wharton’s jelly mesenchymal stem cells (Himedia India Pvt. Ltd) with culture medium (DMEM/Ham’s F12; 1:1) with FCS (10%), antibiotics and glucose (5 mM) were incubated in a CO2 incubator for 48 h. Proliferation medium (PM) and adipocyte differentiation medium (ADM) contained HEPES and HEPES, insulin transferrin selenium (ITS), sodium bicarbonate, and biotin respectively. ADM was used mainly for the optimization of adipogenic differentiation of actively proliferating human mesenchymal stem cells in vitro. However, the factors used in ADM usually potentiate adipogenic differentiation by the activation of C/EBP and PPAR-γ. Adipocytes were maintained till the deposition of lipid droplets and at the 7th day the majority of cells (more than 90%) contained lipid droplets. The adipocytes were stained by Oil Red O. Cultured cells at room temperature were treated with 10% solution of formaldehyde in phosphate-buffered saline for 5 min followed by 60% isopropanol washing and staining with Oil Red O solution (in 60% isopropanol) for at least 10 min. Over-stained dye will be washed off by repeated washing with water (4 times). Stained cells were immediately viewed under phase contrast inverted microscope and images were captured using a mounted digital camera.
Drug Treatment and TNF-α Estimation
The cultured mature adipocytes were further treated with glucose (5–20 mM) in triplicate along with variable concentration of anti-diabetic drugs (metformin hydrochloride (50–200 mg/mL), pioglitazone hydrochloride (5–20 mg/mL) (Sigma Aldrich, USA) and insulin (10–25 mg/mL) (HiMedia, India)). The level of TNF-α was measured by ELISA. The cells were firstly centrifuged at 300×g for 2 min, and thereafter supernatant was used for assay for its estimation using a commercially available kit from Invitrogen (USA) according to the manufacturer’s instructions.
mRNA Level Determination
For TNF-α mRNA determination, the oligonucleotide primer pairs 5ʹ-CTGGGGCCTACAGCTTTGAT-3ʹ and 5ʹ-GGCTCCGTGTCTCAAGGAAG-3ʹ were used; β-Actin was used as a housekeeping gene having 5ʹ-ACGGGGTCACCCACACTGTGC-3ʹ and 5ʹ-CTAGAAGCATTTGCGGTGGACGATG-3ʹ primer pairs. RNA was isolated from mature adipocytes (1×10⁷ cells) using a GeneJET RNA Purification kit (Thermo Scientific, India). Random hexamer primers were used for the synthesis of cDNA using a Verso cDNA synthesis kit (Thermo Scientific, India). A DyNAmo Color Flash SYBR-Green qPCR kit (Thermo Scientific, India) was used for mRNA gene expression. Relative quantification was used to determine the ratio between treated adipocytes with anti-diabetic drugs (metformin hydrochloride, pioglitazone hydrochloride (Sigma Aldrich, USA) and insulin (HiMedia, India)) and untreated adipocytes as a calibrator. Quantification of target gene TNF-α mRNA was expressed relative to the housekeeping gene (β-actin) mRNA. Quantification was performed with a SYBR-Green real-time PCR assay using an LC 480 (Roche, USA). In brief, PCR amplification was performed with PCR master mix containing target primers, DNA polymerase, SYBR-Green I, 5 mM MgCl2, dNTP mix including dUTP and PCR buffer. All samples were determined as duplicates. Samples were incubated for an initial denaturation at 95 °C for 7 min, followed by 40 PCR cycles each consisting of 95 °C for 10 sec, 60 °C for 30 sec and 74 °C for 60 sec. Relative gene expression of TNF-α was calculated.
Statistical Analysis
Microsoft Excel were used to plot the values. Statistical analysis was done by Student’s t-test and one way ANOVA to compare the means by SPSS software (Ver. 19). Differences were considered significant when p values were ≤0.05. Results were expressed as means±standard deviations.
Results
Adipogenesis phases of preadipocytes and adipocytes derived from Wharton’s jelly mesenchymal stem cells are shown in Figure 1. Cytokine levels of TNF-α in untreated and treated adipocytes of variable concentration of glucose (5–20 mM) with different anti-diabetic drugs are shown in Figure 2. The level of TNF-α has been increased according to the increase in glucose concentrations, which mimics the diabetic model. However, when anti-diabetic drug was included in the cells for maintaining nurture in the milieu of cells we found that metformin alone (50 mg/mL to 200 mg/mL) did not show any significant observation in TNF-α level except at 15 mM glucose concentration and significant association (p=0.015) statistically. Similarly, pioglitazone (5 mg/mL to 20 mg/mL) also did not show any change at 5 mM and 10 mM glucose adipocytes; however, at 15 mM and 20 mM the TNF-α level was suddenly decreased (p=0.020 and 0.034 respectively). While for both metformin and pioglitazone in combination we found a sudden decrease in level and showed a significant decrease in 20 mM glucose concentration (p=0.003). Apart from this, when insulin alone is used then a sudden increase in level was observed and showed significant association at 20 mM glucose concentration (p=0.002). This change in folds of TNF-α level in untreated and treated adipocytes of variable concentration of glucose (5–20 mM) with different anti-diabetic drugs, viz. metformin, pioglitazone, combination of metformin and pioglitazone and insulin, is shown in Figure 3. During the estimation of gene expression of TNF-α with metformin in the glucose-treated adipocytes, which mimics the T2DM load in the cell with metformin anti-diabetic drug, we found that the TNF-α gene expression increased in low concentration and thereafter decreases. It is almost constant in a higher dose of metformin, as shown in Figure 4A. The down-regulation of TNF-α gene expression was observed during the treatment with metformin. Previously it was reduced at very low rate, while when the dose increased the expression suddenly decreased as shown in Figure 5A. In contrast to this, pioglitazone showed different behavior. In pioglitazone treatment the expression increases as the drug concentration increases (Figure 4B). The change in folds of TNF-α gene expression were plotted and are shown in Figure 5B. Furthermore, when the combination of both the drugs were used to treat the glucose load, the expression of TNF-α showed almost the same pattern as that of metformin alone (Figure 4C). In the combination of both drugs having a concentration of metformin 150 mg/mL and pioglitazone 15 mg/mL, we found no change in the gene expression of TNF-α or it is almost similar to that in control (Figure 5C). But when the drug dose was increased then the expression was also reduced. However, in the case of insulin treatment the result is quite interesting and is almost similar to the result of pioglitazone (Figure 4D). As the concentration of insulin increases, the TNF-α expression increases in the case of pioglitazone treatment as shown in Figure 5D. This clearly shows that during the use of metformin alone the inflammation increases at a low concentration of the drug, while in pioglitazone, inflammation increases drastically. However, the combination of metformin and pioglitazone creates the natural state and the inflammation is reduced, while insulin treatment increases the state of inflammation.
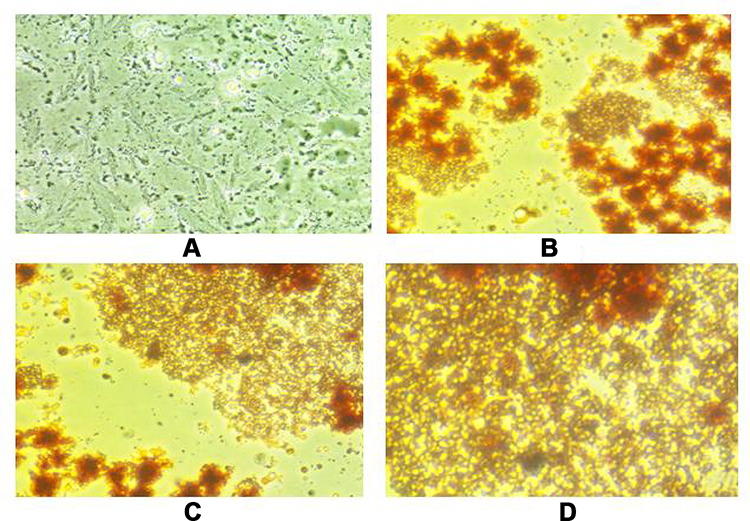 |
Figure 1 Adipogenesis phases of human subcutaneous preadipocytes. (A) Day 0: Wharton’s jelly mesenchymal stem cells. (B) Day 2: Proliferation phase and appearance of preadipocytes. (C) Day 4: Differentiation phase and accumulation of lipid droplets. (D) Day 7: Mature adipocytes with accumulated lipid droplets. |
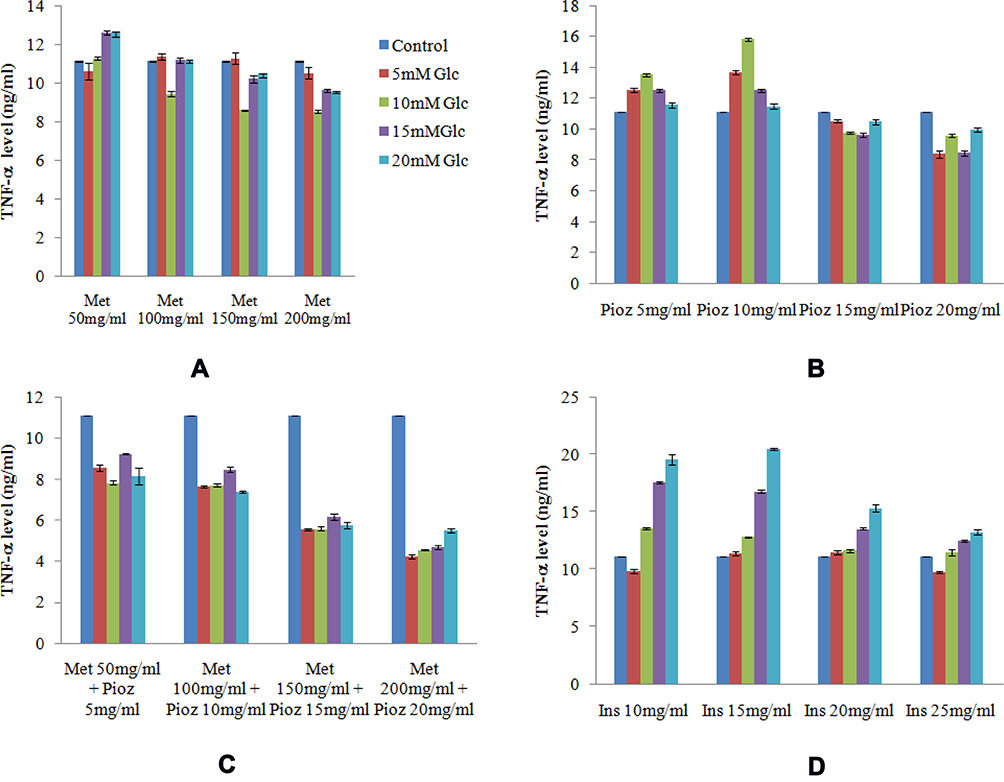 |
Figure 2 Cytokine level of TNF-α in untreated and treated adipocytes of variable concentration of glucose (5–20 mM) with different anti-diabetic drugs. (A) Metformin. (B) Pioglitazone. (C) Combination of metformin and pioglitazone. (D) Insulin. x-axis: variable concentration of anti-diabetic drugs; y-axis: change in folds of TNF-α level. |
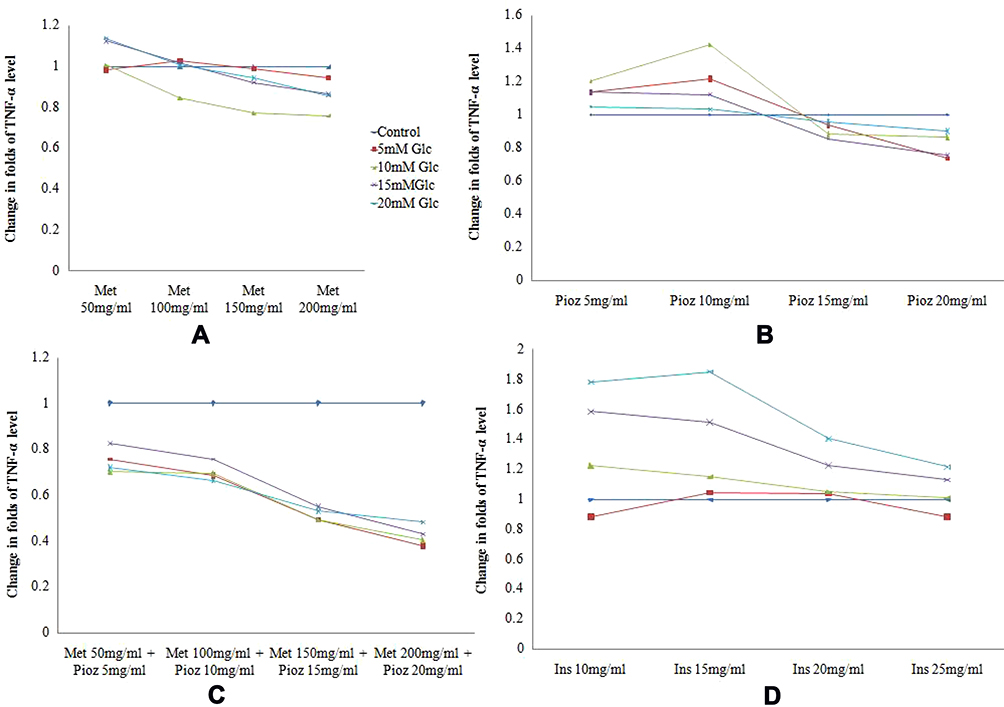 |
Figure 3 Change in folds of TNF-α level in untreated and treated adipocytes of variable concentration of glucose (5–20 mM) with different anti-diabetic drugs. (A) Metformin. (B) Pioglitazone. (C) Combination of metformin and pioglitazone. (D) Insulin. |
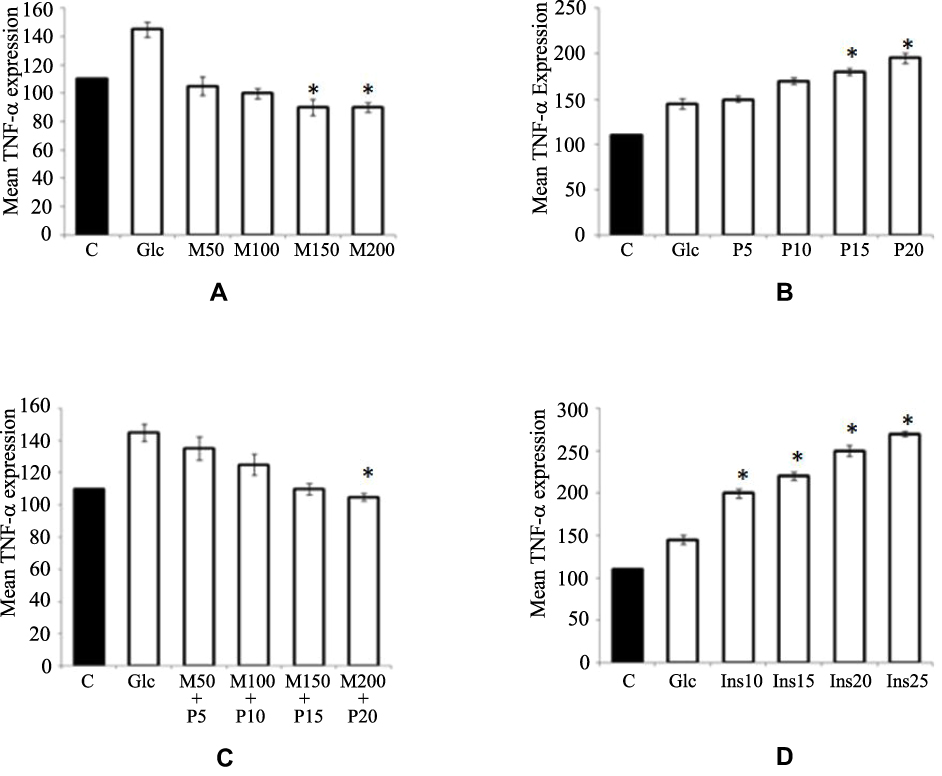 |
Figure 4 TNF-α mRNA expression with anti-diabetic drugs. (A) Metformin. (B) Pioglitazone. (C) Combination of metformin and pioglitazone. (D) Insulin. *Shows the significant change in TNF-α mRNA expression with anti-diabetic drugs. Abbreviations: Glc, glucose-fed adipocytes; M50, metformin hydrochloride 50 mg/mL; M100, metformin hydrochloride 100 mg/mL; M150, metformin hydrochloride 150 mg/mL; M200, metformin hydrochloride 200 mg/mL; P5, pioglitazone 5 mg/mL; P10, pioglitazone 10 mg/mL; P15, pioglitazone 15 mg/mL; P20, pioglitazone 20 mg/mL; Ins10, insulin 10 mg/mL; Ins15, insulin 15 mg/mL; Ins20, insulin 20 mg/mL; Ins25, insulin 25 mg/mL; C, Control. |
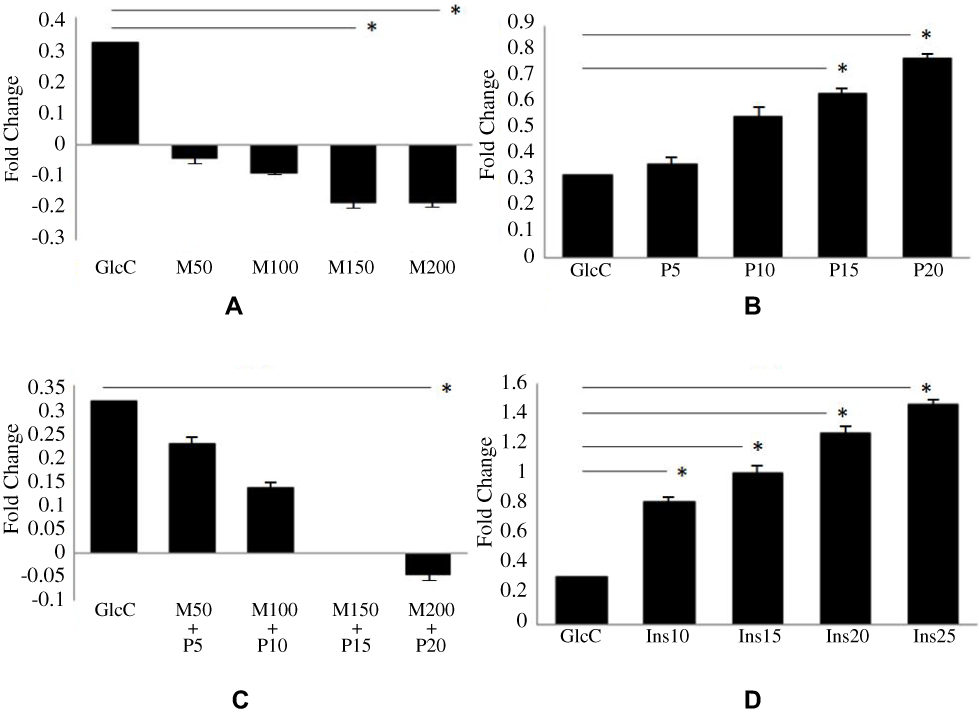 |
Figure 5 Change in folds of TNF-α gene expression with different anti-diabetic drugs. (A) Metformin. (B) Pioglitazone. (C) Combination of metformin and pioglitazone. (D) Insulin. *Shows the significant change in fold of TNF-α mRNA expression with anti-diabetic drugs. Abbreviations: GlcC, glucose-treated control adipocytes; M50, metformin hydrochloride 50 mg/mL; M100, metformin hydrochloride 100 mg/mL; M150, metformin hydrochloride 150 mg/mL; M200, metformin hydrochloride 200 mg/mL; P5, pioglitazone 5 mg/mL; P10, pioglitazone 10 mg/mL; P15, pioglitazone 15 mg/mL; P20, pioglitazone 20 mg/mL; Ins10, insulin 10 mg/mL; Ins15, insulin 15 mg/mL; Ins20, insulin 20 mg/mL; Ins25, insulin 25 mg/mL. |
Discussion
In this study, we have generated a comprehensive analysis of gene expression of TNF-α in adipocytes which mimics T2DM cells using glucose feed. Further, we have analyzed the role of traditional anti-diabetic drug treatments, viz. metformin, pioglitazone, combination of both as well as insulin, at various concentrations. Although such kind of work is not done anywhere around the globe and this is the first report. However, a similar kind of report to find the association of miRNAs and TNF-α in preadipocytes and adipocytes was reported.10 It was previously reported that the high concentrations of insulin and leptin either alone or combined together significantly increased TNF-α protein secretion in in vitro analysis as observed in our report. It was also reported in concordance with the present report that glucose alone significantly increased TNF-α protein.11 Presently, we have demonstrated that the exposure of adipocytes to high concentrations of glucose mimics the T2DM state and analyzed the level and mRNA expression of TNF-α in vitro. Moreover, we have found the same result as expected that the exposure of traditional anti-diabetic drug metformin usually used for the treatment of T2DM decreases the level of TNF-α and down-regulates the state of inflammation. The above findings are in agreement with previously published reports where the drug dexamethasone/high glucose increased the expression of resistin when estimated at the mRNA and protein level in 3T3-L1 murine adipocytes12 as well as in the human U937 monocytic cell line.13 While, insulin may diminish expression of resistin gene in the 3T3-L1 cell line acting mainly through the pathways of PI-3, ERK or p38-MAP kinases.12,14 Apart from this we have also demonstrated that high concentrations of either pioglitazone or insulin could enhance TNF-α along with the addition of high glucose. They also induce further TNF-α mRNA and protein expression, in support of previous reports.15,16 It was already reported that monocyte-enriched mononuclear cells from T2DM patients showed enhanced visfatin, resistin, TNF-α, IL-6 and IL-1β levels as well as mRNA expression, which indicates that the state of hyper-insulinemia/glycemia could enhance the production of various cytokines.17,18 It is well known fact that TNF-α is involved in the loss of body fat in wasting diseases and TNF-α is a potent inhibitor of adipocyte differentiation in in vitro models.19 This suppression is mainly due to the developmental and metabolic markers of fat cell differentiation like peroxisome proliferator-activated receptor (PPAR)-γ2, lipoprotein lipase (LPL), glycerol-3-phosphate dehydrogenase (GPDH) and GLUT4 while TNF-α promotes lipolysis in mature adipocytes. Therefore, TNF-α induces apoptosis of human preadipocytes and adipocytes in vitro.20 The relation of TNF-α and adipocytes in response to insulin resistance and obesity was well summarized by Hotamisligil in 2000.21 However, the effect of PPAR-γ in response to thiazolidinediones was studied in detail to find their therapeutic effect for the development of obesity.22 As the metabolic role of TNF-α in human adipocytes is vast, these findings on the relation and association of TNF-α with anti-diabetic drugs unfold many secrets.
However, in conclusion of the current study it has been shown that increasing concentration of the drug pioglitazone down-regulates the secretion of inflammatory cytokines, mainly TNF-α. Whereas high glucose concentration does not appear to depress the acceleration caused by insulin by the glucose uptake in adipocytes. It is also concluded that inflammatory cytokine secretion of TNF-α is increased by the uptake of enhanced glucose concentration with insulin in adipocytes as well. Furthermore, it is also concluded that in whole human subcutaneous adipocytes, metformin, pioglitazone and combination of both limits the regulation of inflammatory cytokines. However, pioglitazone and metformin in combination as well as insulin up-regulates TNF-α protein secretion in vitro in mild diabetic status and highly up-regulates in severe diabetic status. This effect of anti-diabetic drugs on adipose tissue represents an additional mechanism through which this may induce clinical benefits. Further studies are required to unwind the mechanism of it and also to understand the molecular pathway of this up-regulation in humans. Our work provides an important step toward finding the role of drugs in causing the severe inflammatory state in T2DM individuals mainly by the adipocyte biology in vitro. An understanding of the role of inflammation after the drug treatment may lead to novel cytokine-based therapies that complement current anti-diabetic treatments.
Acknowledgments
This work was funded by Researchers Supporting Project number (RSP-2020/165), King Saud University, Riyadh, Saudi Arabia.MS is thankful for Research Associate from ICMR, New Delhi, India.
Disclosure
The authors report no conflicts of interest in this work.
References
1. Cook KS, Min H, Johnson D, et al. Adipsin: a circulating serine protease homolog secreted by adipose tissue and sciatic nerve. Science. 1987;237(4813):402–405. doi:10.1126/science.3299705
2. Cianflone K, Maslowska M, Sniderman AD, et al. Acylation stimulating protein (ASP), an adipocyte autocrine: new directions. Semin Cell Dev Biol. 1999;10(1):31–41. doi:10.1006/scdb.1998.0272
3. Saleh J, Al-Wardy N, Farhan H, et al. Acylation stimulating protein: a female lipogenic factor? Obes Rev. 2011;12(6):440–448. doi:10.1111/j.1467-789X.2010.00832.x
4. Zhang Y, Proenca R, Maffei M, et al. Positional cloning of the mouse obese gene and its human homologue. Nature. 1994;372(6505):425–432. doi:10.1038/372425a0
5. Chlouverakis C. Insulin resistance of parabiotic obese hyperglycemic mice (obob). Horm Metab Res. 1972;4(3):143–148. doi:10.1055/s-0028-1094088
6. Cava A, Matarese G. The weight of leptin in immunity. Nat Rev Immunol. 2004;4(5):371–379. doi:10.1038/nri1350
7. Liu Y, Kongsuphol P, Gourikutty SBN, et al. Human adipocyte differentiation and characterization in a perfusion-based cell culture device. Biomed Microdevices. 2017;19(3):18. doi:10.1007/s10544-017-0164-5
8. Hube F, Hauner H. The two tumor necrosis factor receptors mediate opposite effects on differentiation and glucose metabolism in human adipocytes in primary culture. Endocrinology. 2000;141(7):2582–2588. doi:10.1210/endo.141.7.7561
9. Saxena M, Srivastava N, Banerjee M, et al. Association of interleukin-10 (IL-10), interleukin-6 (IL-6) and Tumour Necrosis Factor-α (TNF-α) gene polymorphisms with type 2 diabetes mellitus in North India. Mol Biol Rep. 2013;40(11):6271–6279. doi:10.1007/s11033-013-2739-4
10. Xie H, Lim B, Lodish HF, et al. MicroRNAs induced during adipogenesis that accelerate fat cell development are downregulated in obesity. Diabetes. 2009;58(5):1050–1057. doi:10.2337/db08-1299
11. Tsiotra PC, Boutati E, Dimitriadis G, et al. High insulin and leptin increase resistin and inflammatory cytokine production from human mononuclear cells. Biomed Res Int. 2013;2013:1–10. doi:10.1155/2013/487081
12. Shojima N, Sakoda H, Ogihara T, et al. Humoral regulation of resistin expression in 3T3-L1 and mouse adipose cells. Diabetes. 2002;51(6):1737–1744. doi:10.2337/diabetes.51.6.1737
13. Stan D, Calin M, Manduteanu I, et al. High glucose induces enhanced expression of resistin in human U937 monocyte-like cell line by MAPK- and NF-kB-dependent mechanisms; the modulating effect of insulin. Cell Tissue Res. 2011;343(2):379–387. doi:10.1007/s00441-010-1092-3
14. Kawashima J, Tsuruzoe K, Motoshima H, et al. Insulin down-regulates resistin mRNA through the synthesis of protein(s) that could accelerate the degradation of resistin mRNA in 3T3-L1 adipocytes. Diabetologia. 2003;46(2):231–240. doi:10.1007/s00125-002-1022-3
15. Hancu N, Netea MG, Baciu I, et al. High glucose concentrations increase the tumor necrosis factor-alpha production capacity by human peripheral blood mononuclear cells. Rom J Physiol. 1998;35(3–4):325–330.
16. Iida KT, Shimano H, Kawakami Y, et al. Insulin up-regulates tumor necrosis factor-α production in macrophages through an extracellular-regulated kinase-dependent pathway. J Biol Chem. 2001;276(35):32531–32537. doi:10.1074/jbc.M009894200
17. Tsiotra PC, Tsigos C, Anastasiou E, et al. Peripheral mononuclear cell resistin mRNA expression is increased in type 2 diabetic women. Mediators Inflamm. 2008;2008:1–8. doi:10.1155/2008/892864
18. Tsiotra PC, Tsigos C, Yfanti E, et al. Visfatin, TNF-α and IL-6 mRNA expression is increased in mononuclear cells from type 2 diabetic women. Horm Metab Res. 2007;39(10):758–763. doi:10.1055/s-2007-990288
19. Hube F, Hauner H. The role of TNF-α in human adipose tissue: prevention of weight gain at the expense of insulin resistance? Horm Metab Res. 1999;31(12):626–631. doi:10.1055/s-2007-978810
20. Prins JB, Niesler CU, Winterford CM, et al. Tumor necrosis factor-α induces apoptosis of human adipose cells. Diabetes. 1997;46(12):1939–1944. doi:10.2337/diab.46.12.1939
21. Hotamisligil GS. Molecular mechanisms of insulin resistance and the role of the adipocyte. Int J Obes Relat Metab Disord. 2000;24(S4):S23–S27. doi:10.1038/sj.ijo.0801497
22. Ouarrat DE, Isaac R, Lee YS, et al. TAZ is a negative regulator of PPARγ activity in adipocytes and TAZ deletion improves insulin sensitivity and glucose tolerance. Cell Metab. 2020;31(1):162–173. doi:10.1016/j.cmet.2019.10.003
 © 2020 The Author(s). This work is published and licensed by Dove Medical Press Limited. The full terms of this license are available at https://www.dovepress.com/terms.php and incorporate the Creative Commons Attribution - Non Commercial (unported, v3.0) License.
By accessing the work you hereby accept the Terms. Non-commercial uses of the work are permitted without any further permission from Dove Medical Press Limited, provided the work is properly attributed. For permission for commercial use of this work, please see paragraphs 4.2 and 5 of our Terms.
© 2020 The Author(s). This work is published and licensed by Dove Medical Press Limited. The full terms of this license are available at https://www.dovepress.com/terms.php and incorporate the Creative Commons Attribution - Non Commercial (unported, v3.0) License.
By accessing the work you hereby accept the Terms. Non-commercial uses of the work are permitted without any further permission from Dove Medical Press Limited, provided the work is properly attributed. For permission for commercial use of this work, please see paragraphs 4.2 and 5 of our Terms.